rystad energy gas perspectives -...
TRANSCRIPT

RYSTAD ENERGY GAS PERSPECTIVES
Jakarta, November 20th 2017
Agenda
1. Global LNG market outlook – Oversupply and new Asian demand2. Japan LNG Market outlook – LNG demand in a nuclear restart
2
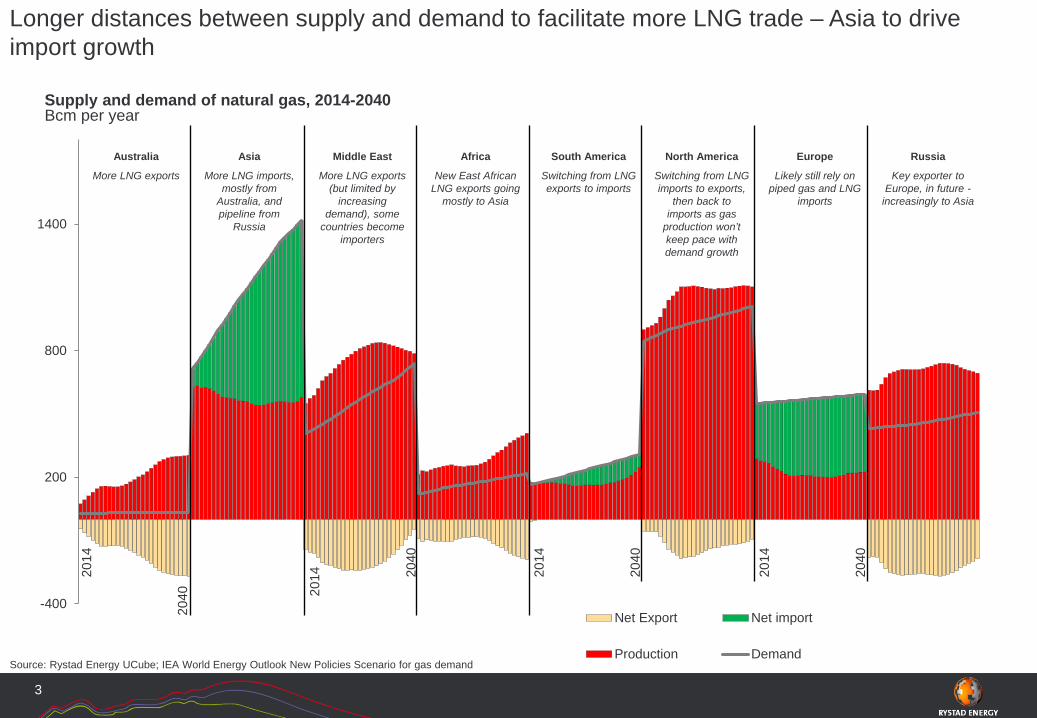
Longer distances between supply and demand to facilitate more LNG trade – Asia to drive import growth
-400
200
800
1400
Net Export Net import
Production DemandSource: Rystad Energy UCube; IEA World Energy Outlook New Policies Scenario for gas demand
3
Supply and demand of natural gas, 2014-2040Bcm per year
Australia Asia Middle East Africa South America North America Europe Russia
More LNG exports More LNG imports, mostly from
Australia, and pipeline from
Russia
More LNG exports (but limited by
increasing demand), some
countries become importers
New East African LNG exports going
mostly to Asia
Switching from LNG imports to exports,
then back to imports as gas
production won’t keep pace with demand growth
Switching from LNG exports to imports
Likely still rely on piped gas and LNG
imports
Key exporter to Europe, in future -
increasingly to Asia
2014
2040
2014
2040
2014 20
40
2014
2040
0
50
100
150
200
250
Philippines Malaysia/Thailand JDAVietnam BruneiMyanmar
0
20
40
60
80
100
120
India Pakistan Bangladesh
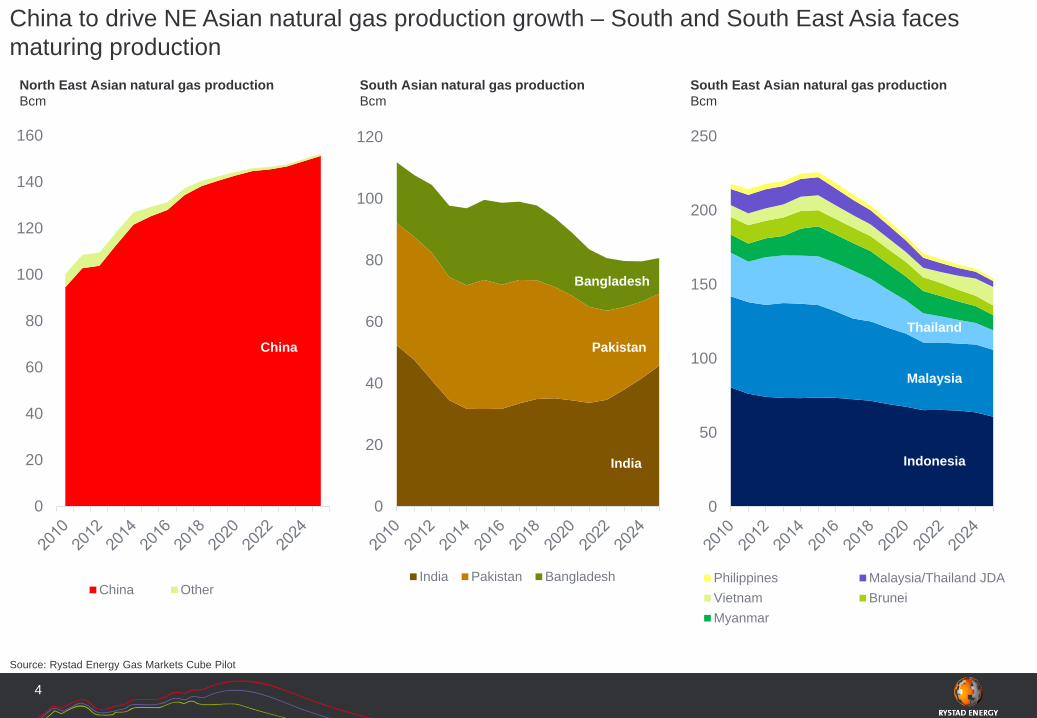
China to drive NE Asian natural gas production growth – South and South East Asia faces maturing production
Source: Rystad Energy Gas Markets Cube Pilot
4
0
20
40
60
80
100
120
140
160
China Other
North East Asian natural gas productionBcm
South Asian natural gas productionBcm
South East Asian natural gas productionBcm
China Pakistan
India
Bangladesh
Indonesia
Malaysia
Thailand
0
20
40
60
80
100
120
140
160
180
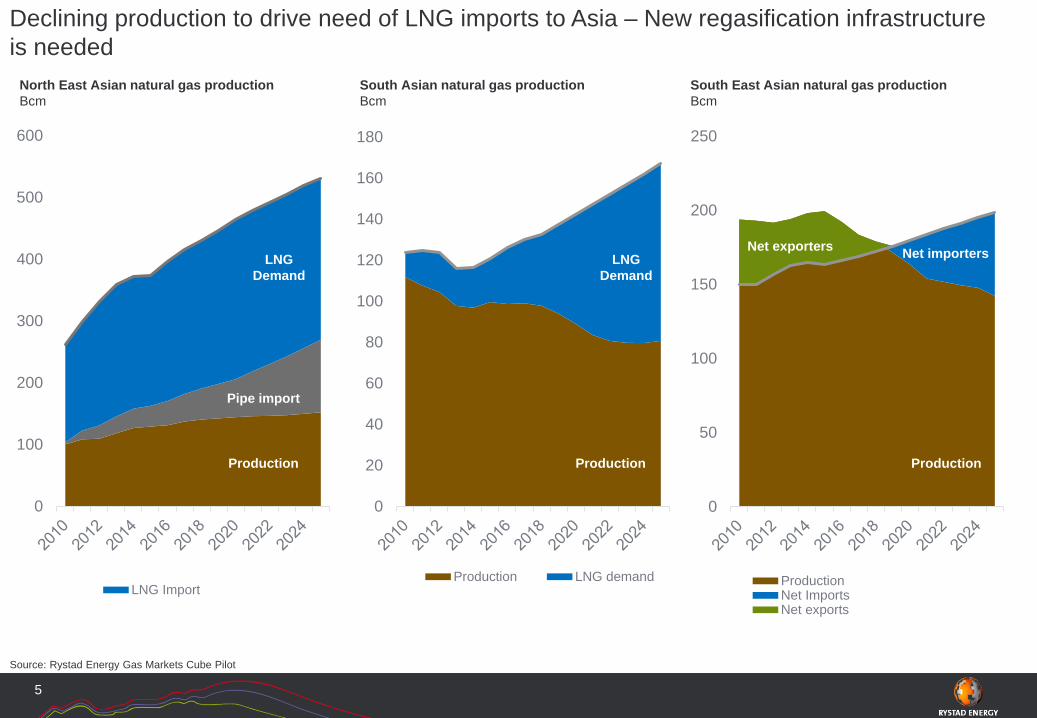
Production LNG demand
Declining production to drive need of LNG imports to Asia – New regasification infrastructure is needed
Source: Rystad Energy Gas Markets Cube Pilot
5
0
100
200
300
400
500
600
LNG Import
North East Asian natural gas productionBcm
South Asian natural gas productionBcm
South East Asian natural gas productionBcm
Production
LNG Demand
Indonesia
Malaysia
Thailand
0
50
100
150
200
250
ProductionNet ImportsNet exports
Net exporters Net importers
Production
LNG Demand
Pipe import
Production
0
50
100
150
200
250
300
350
400
45020
10
2011
2012
2013
2014
2015
2016
2017
2018
2019
2020
2021
2022
2023
2024
2025
2026
2027
2028
2029
2030
Qatar
Australia
United States
Russia
Indonesia
Malaysia
Nigeria
Algeria
Trinidad and Tobago
Papua New Guinea
Other
17%
20%
20%
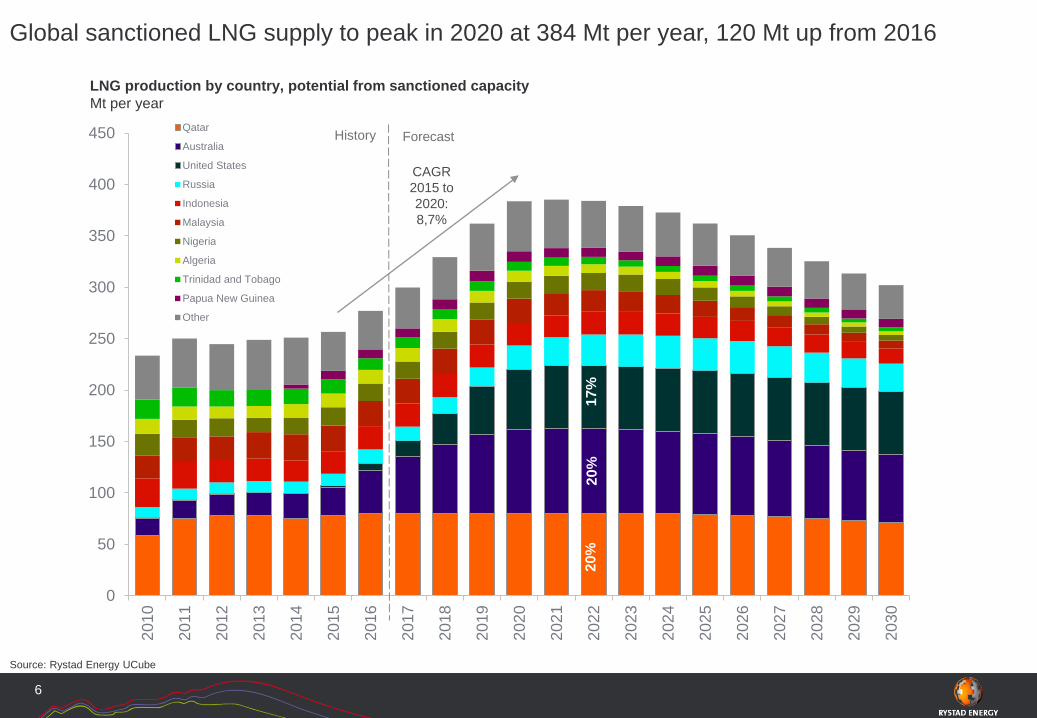
Global sanctioned LNG supply to peak in 2020 at 384 Mt per year, 120 Mt up from 2016
LNG production by country, potential from sanctioned capacityMt per year
Source: Rystad Energy UCube
6
ForecastHistory
CAGR 2015 to 2020:8,7%
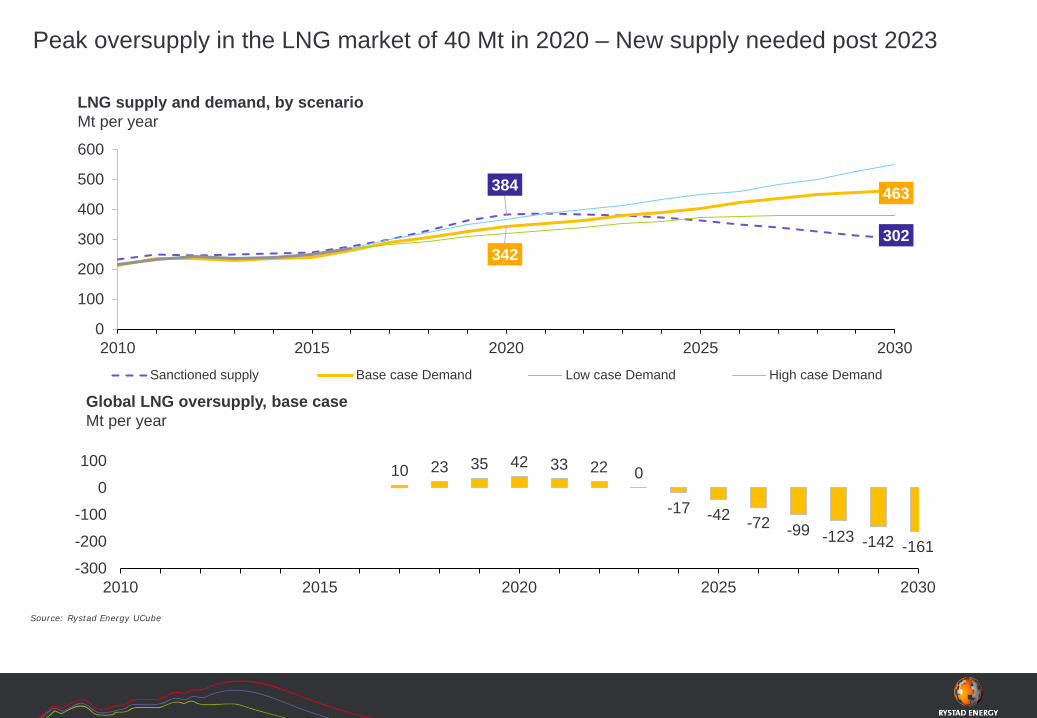
Source: Rystad Energy UCube
LNG supply and demand, by scenarioMt per year
384
302342
463
0
100
200
300
400
500
600
2010 2015 2020 2025 2030Sanctioned supply Base case Demand Low case Demand High case Demand
10 23 35 42 33 22 0
-17 -42 -72 -99 -123 -142 -161-300
-200
-100
0
100
2010 2015 2020 2025 2030
Global LNG oversupply, base caseMt per year
Peak oversupply in the LNG market of 40 Mt in 2020 – New supply needed post 2023
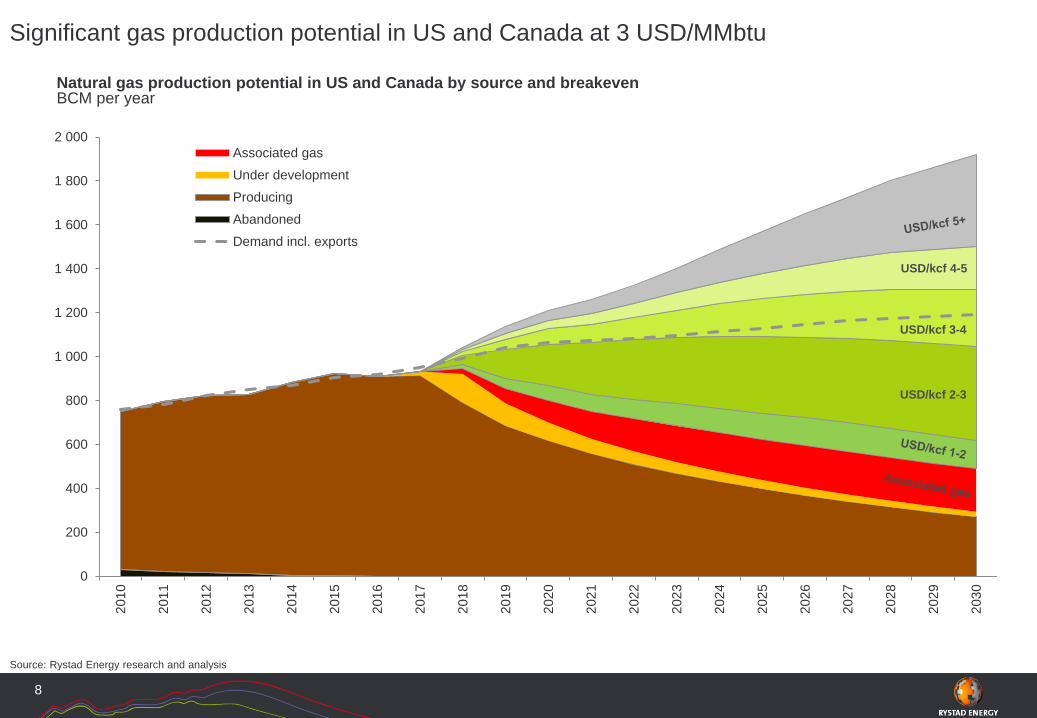
Significant gas production potential in US and Canada at 3 USD/MMbtu
0
200
400
600
800
1 000
1 200
1 400
1 600
1 800
2 00020
10
2011
2012
2013
2014
2015
2016
2017
2018
2019
2020
2021
2022
2023
2024
2025
2026
2027
2028
2029
2030
Associated gasUnder developmentProducingAbandonedDemand incl. exports
Source: Rystad Energy research and analysis
8
Natural gas production potential in US and Canada by source and breakevenBCM per year
USD/kcf 4-5
USD/kcf 2-3
USD/kcf 3-4
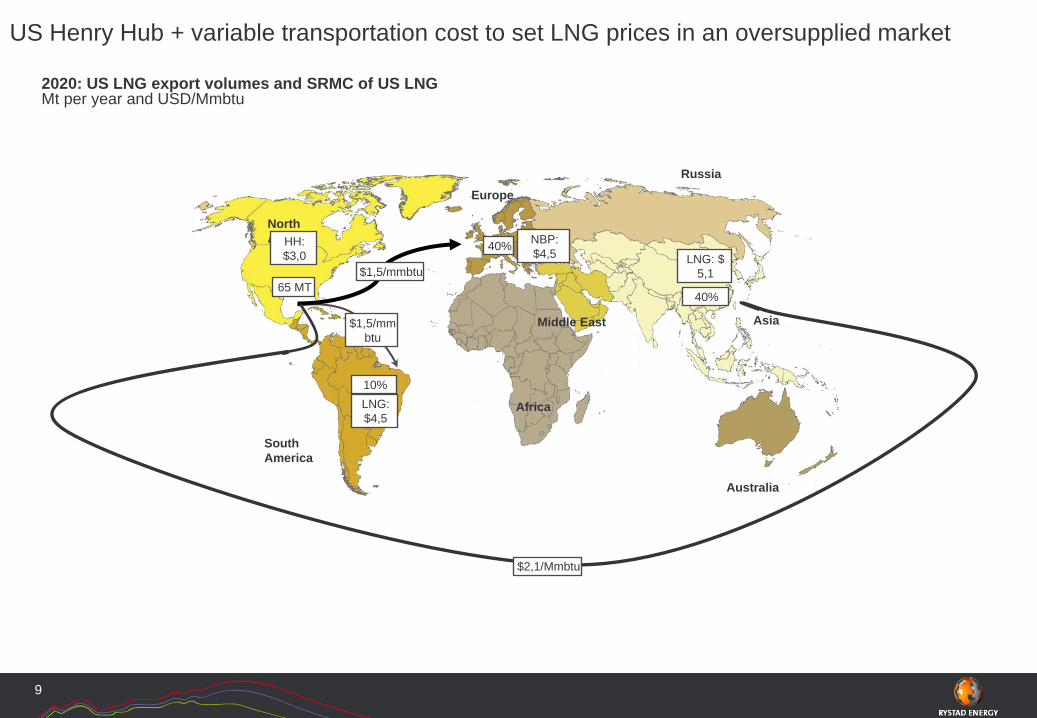
US Henry Hub + variable transportation cost to set LNG prices in an oversupplied market
9
2020: US LNG export volumes and SRMC of US LNGMt per year and USD/Mmbtu
Australia
Asia
South America
North America
EuropeRussia
Middle East
Africa
65 MT$1,5/mmbtu
$2,1/Mmbtu
$1,5/mmbtu
10%
40%
40%LNG: $
5,1
LNG: $4,5
HH: $3,0
NBP: $4,5
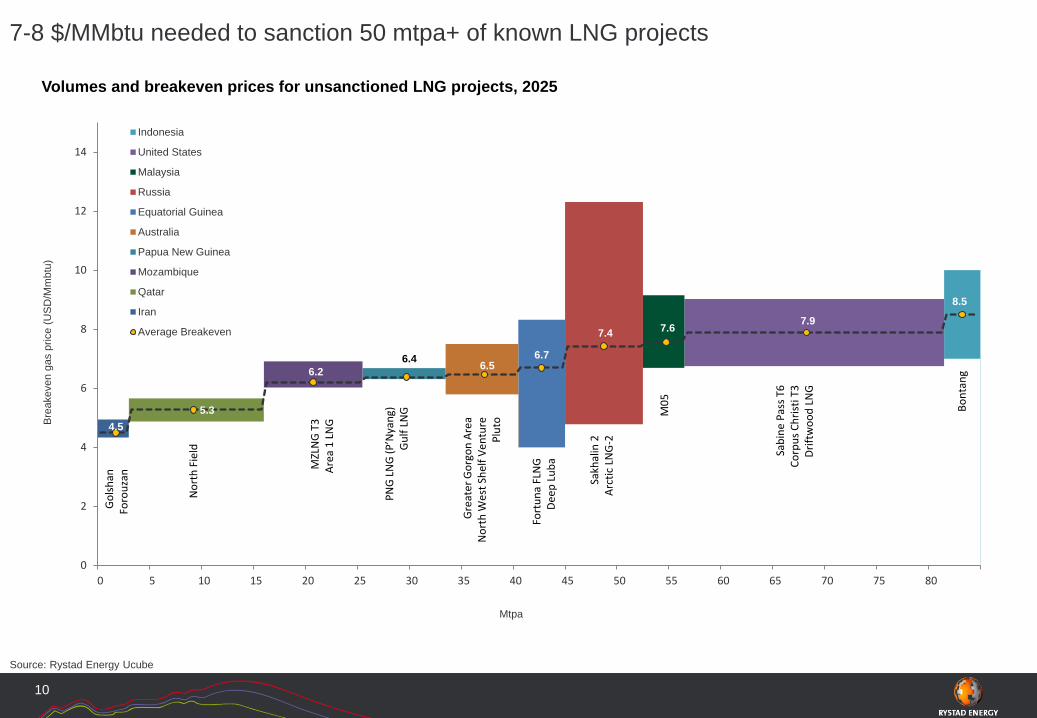
7-8 $/MMbtu needed to sanction 50 mtpa+ of known LNG projects
Source: Rystad Energy Ucube
10
4.55.3
6.26.4 6.5
6.7
7.4 7.6 7.9
8.5
0
2
4
6
8
10
12
14
0 5 10 15 20 25 30 35 40 45 50 55 60 65 70 75 80
Bre
akev
en g
as p
rice
(US
D/M
mbt
u)
Mtpa
Indonesia
United States
Malaysia
Russia
Equatorial Guinea
Australia
Papua New Guinea
Mozambique
Qatar
Iran
Average Breakeven
Volumes and breakeven prices for unsanctioned LNG projects, 2025 G
olsh
anFo
rouz
an
MZL
NG
T3
Area
1 L
NG
Gre
ater
Gor
gon
Area
Nor
th W
est S
helf
Vent
ure
Plut
o
PNG
LNG
(P’N
yang
)G
ulf L
NG Bo
ntan
g
M05
Sakh
alin
2Ar
ctic
LN
G-2
Sabi
ne P
ass T
6Co
rpus
Chr
isti T
3Dr
iftw
ood
LNG
Nor
th F
ield
Fort
una
FLN
GDe
ep L
uba
5,1
7,5 7,5
4,5
7,5 7,5
3,0 3,1 3,3
0
50
100
150
200
250
300
350
400
450
500
0
2
4
6
8
10
12
14
16
18
20
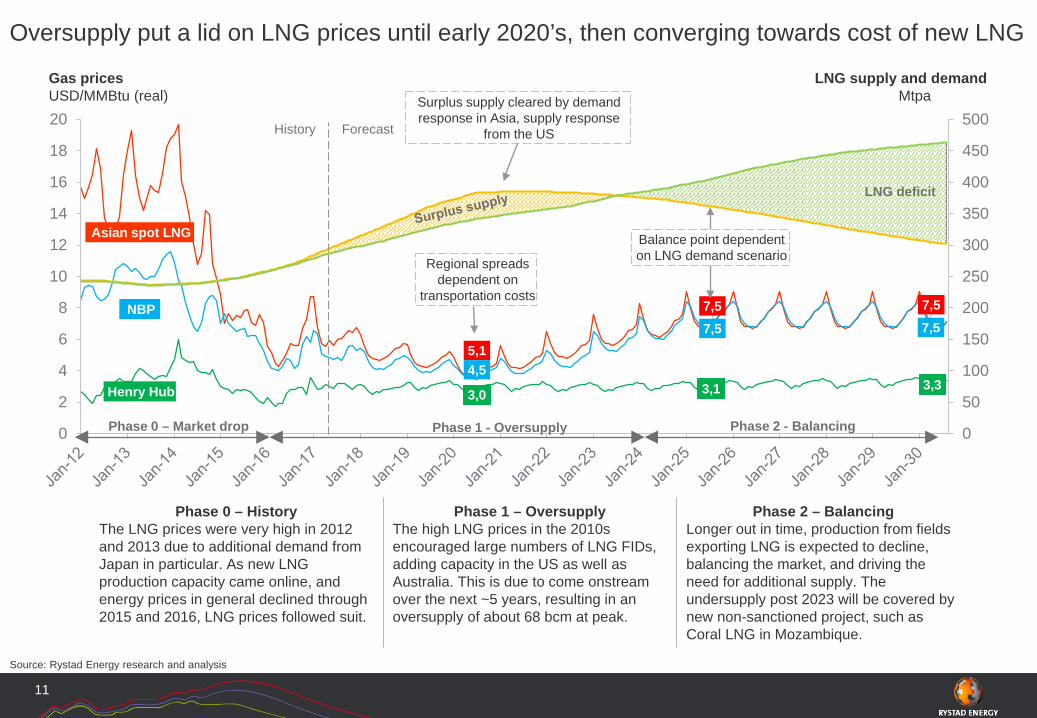
Oversupply put a lid on LNG prices until early 2020’s, then converging towards cost of new LNG
Source: Rystad Energy research and analysis
11
ForecastHistory
Phase 1 - Oversupply Phase 2 - Balancing
Phase 0 – HistoryThe LNG prices were very high in 2012 and 2013 due to additional demand from Japan in particular. As new LNG production capacity came online, and energy prices in general declined through 2015 and 2016, LNG prices followed suit.
Phase 1 – OversupplyThe high LNG prices in the 2010s encouraged large numbers of LNG FIDs, adding capacity in the US as well as Australia. This is due to come onstream over the next ~5 years, resulting in an oversupply of about 68 bcm at peak.
Phase 2 – BalancingLonger out in time, production from fieldsexporting LNG is expected to decline, balancing the market, and driving the need for additional supply. The undersupply post 2023 will be covered by new non-sanctioned project, such as Coral LNG in Mozambique.
Phase 0 – Market drop
Gas prices LNG supply and demandUSD/MMBtu (real) Mtpa
NBP
Henry Hub
Asian spot LNG
LNG deficit
Surplus supply cleared by demand response in Asia, supply response
from the US
Balance point dependent on LNG demand scenarioRegional spreads
dependent on transportation costs
Agenda
1. Global LNG market outlook – Oversupply and new Asian demand2. Japan LNG Market outlook – LNG demand in a nuclear restart
12

• The world’s largest LNG importer, with over 200 mtpa in import capacity
• Import most of its natural gas consumption
• LNG imports surged after Tohoku earthquake in 2011 leading to shutdown of nuclear power plants
• Gas for power is the main driver of LNG imports into Japan
LNG demand increased 17% in 2011 due to nuclear shut down
Source: Japan Gas Association, Japanese import statistics, Rystad Energy research and analysis
Japan total gas demand (mtpa) and average LNG import prices (USD/MMBtu)
13
-
2
4
6
8
10
12
14
16
18
0
10
20
30
40
50
60
70
80
90
2005 2006 2007 2008 2009 2010 2011 2012 2013 2014 2015 2016
USD
/MM
Btu
mtp
a
Gas for power & heat Industry Residential & Commercial
Others Average LNG import prices
17%

• Rystad Energy’s base case: 12 out of 26 reactors initially under review become operational by 2020
• Another six reactors likely to restart by 2025, adding 15.8 GW of nuclear capacity or 10% of Japanese power generation in 2025
• Rystad Energy’s high case scenario assuming faster restarts, we expect 26 reactors to come online by 2025, adding 25 GW of capacity. This equates to power generation of about 160 TWh (16% of power generation in 2025)
2015 – 2025: Nuclear restart resets Japanese energy sector
Source: Rystad Energy research and analysis
Nuclear restart – Base case (GW)
14
15.8
1.70.8
2.8
3.01.1
1.60.8
0.80.6
1.90.9
0
5
10
15
20
25
30
2015 2016 2017 2018 2019 2020 2021 2022 2023 2024 2025 2025Total
Before Fukushima 48,8
25High case
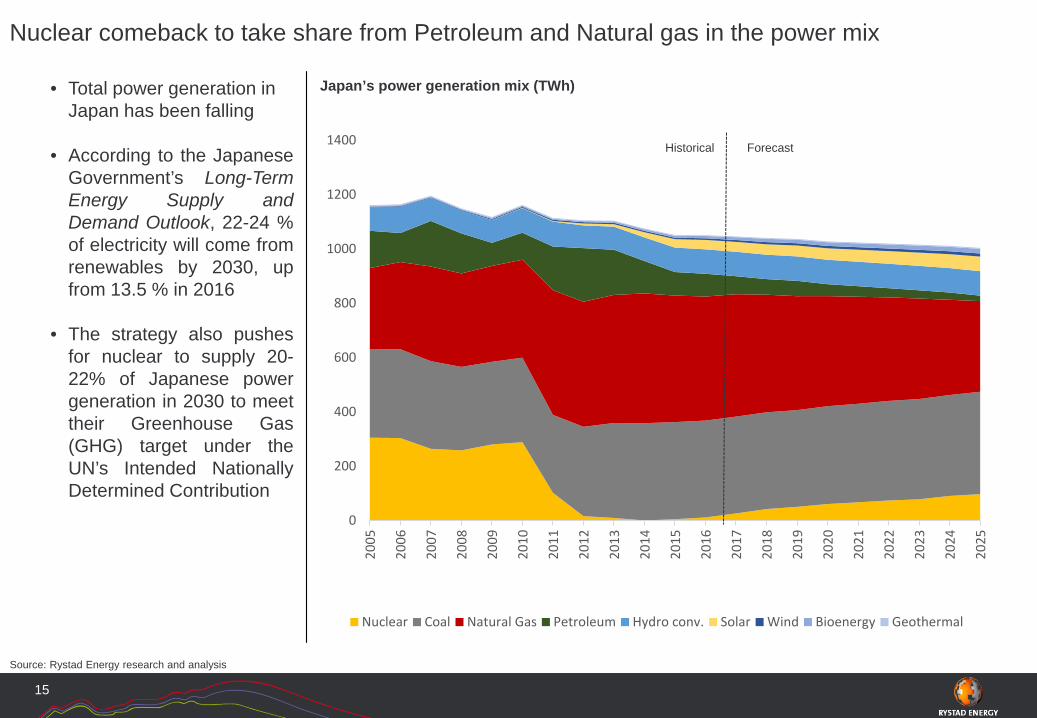
• Total power generation in Japan has been falling
• According to the JapaneseGovernment’s Long-TermEnergy Supply andDemand Outlook, 22-24 %of electricity will come fromrenewables by 2030, upfrom 13.5 % in 2016
• The strategy also pushesfor nuclear to supply 20-22% of Japanese powergeneration in 2030 to meettheir Greenhouse Gas(GHG) target under theUN’s Intended NationallyDetermined Contribution
Nuclear comeback to take share from Petroleum and Natural gas in the power mix
Source: Rystad Energy research and analysis
Japan’s power generation mix (TWh)
15
0
200
400
600
800
1000
1200
1400
2005
2006
2007
2008
2009
2010
2011
2012
2013
2014
2015
2016
2017
2018
2019
2020
2021
2022
2023
2024
2025
Nuclear Coal Natural Gas Petroleum Hydro conv. Solar Wind Bioenergy Geothermal
Historical Forecast
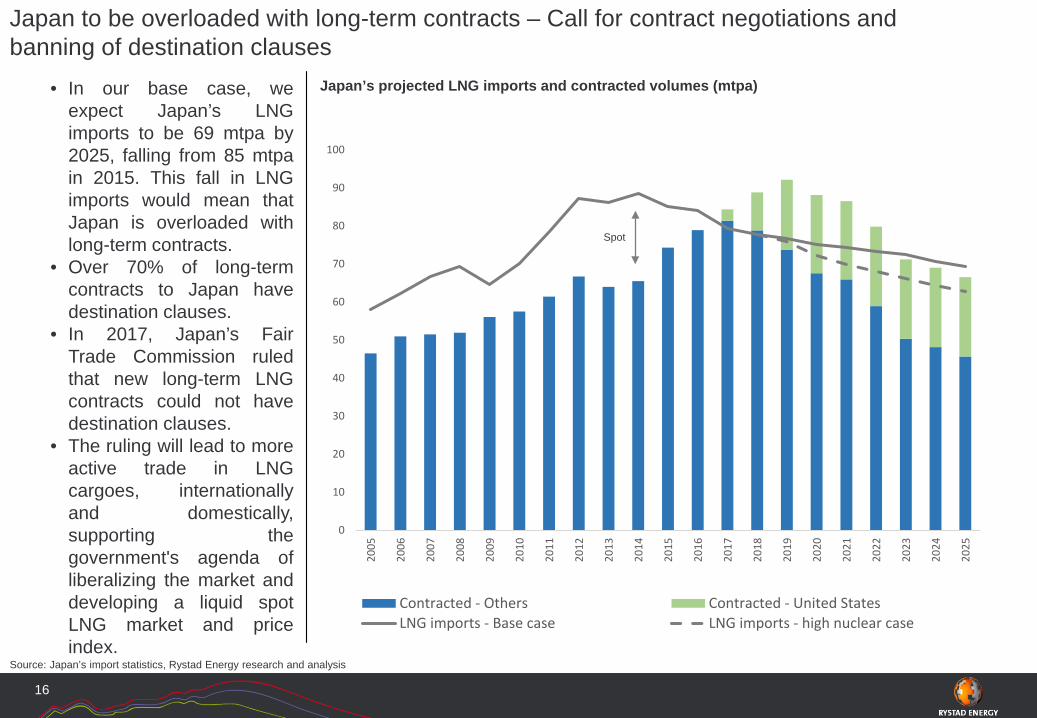
• In our base case, weexpect Japan’s LNGimports to be 69 mtpa by2025, falling from 85 mtpain 2015. This fall in LNGimports would mean thatJapan is overloaded withlong-term contracts.
• Over 70% of long-termcontracts to Japan havedestination clauses.
• In 2017, Japan’s FairTrade Commission ruledthat new long-term LNGcontracts could not havedestination clauses.
• The ruling will lead to moreactive trade in LNGcargoes, internationallyand domestically,supporting thegovernment's agenda ofliberalizing the market anddeveloping a liquid spotLNG market and priceindex.
Japan to be overloaded with long-term contracts – Call for contract negotiations and banning of destination clauses
Source: Japan’s import statistics, Rystad Energy research and analysis
Japan’s projected LNG imports and contracted volumes (mtpa)
16
0
10
20
30
40
50
60
70
80
90
100
2005
2006
2007
2008
2009
2010
2011
2012
2013
2014
2015
2016
2017
2018
2019
2020
2021
2022
2023
2024
2025
Contracted - Others Contracted - United StatesLNG imports - Base case LNG imports - high nuclear case
Spot

0
20
40
60
80
100
0
2
4
6
8
10
12
14
16
1820
10
2011
2012
2013
2014
2015
2016
2017
2018
2019
2020
2021
2022
2023
2024
2025
USD
/bbl
USD
/MM
Btu
Henry Hub NBP
East Asian spot LNG JCC-indexed (14%)
Brent crude history Brent crude - Rystad Energy's base case
Spread between oil-linked gas contracts and LNG spot to widen as oil prices increase -Pressure for long-term contract renegotiation and gas-to-gas price indexation
Global gas prices (USD/MMBtu) and Brent crude price (USD/bbl), Real
Source: Rystad Energy research and analysis
17
ForecastHistorical
*Prices are real, annual average, assuming normal weather without seasonal variations. East Asian Spot LNG excludes regasification cost. Brent crude price forecast is Rystad Energy’s base case scenario. JCC-indexed is linked to Brent crude with a lag – History is based on historical Brent crude and Forecast is based on Rystad Energy’s Brent base case forecast. Brent crude forward as of 26 Apr 2017.
Gap JCC-LNG Spot call for renegotiations?

DATA SOURCES
Jakarta, November 20th 2017
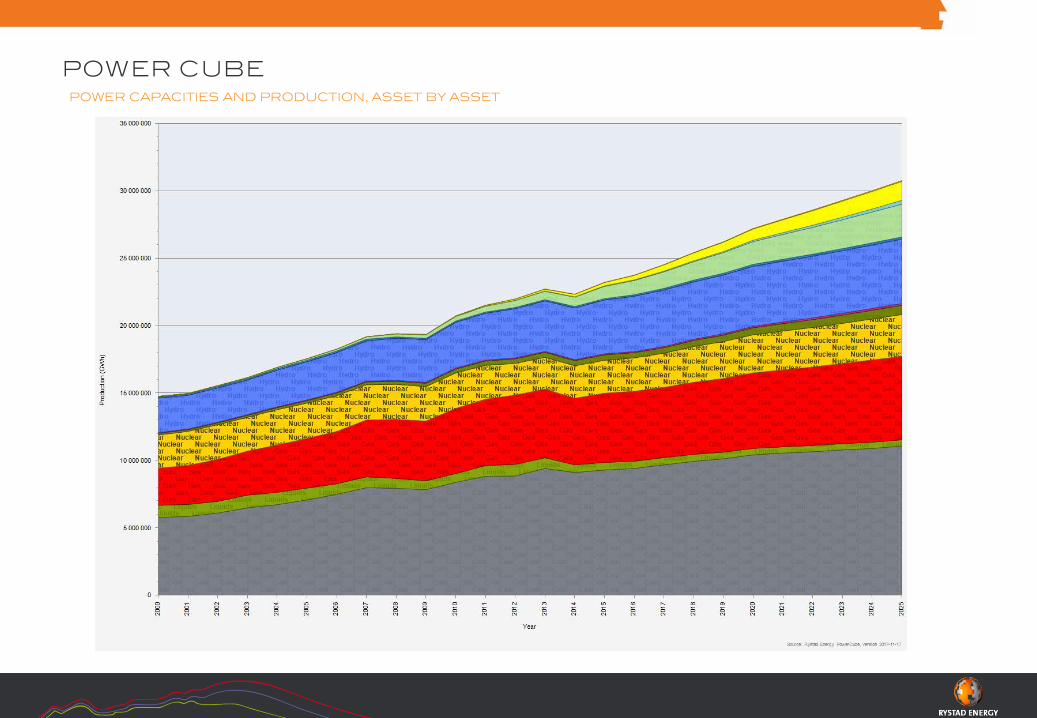
POWER CUBEPOWER CAPACITIES AND PRODUCTION, ASSET BY ASSET
Tailored presentations and discussions
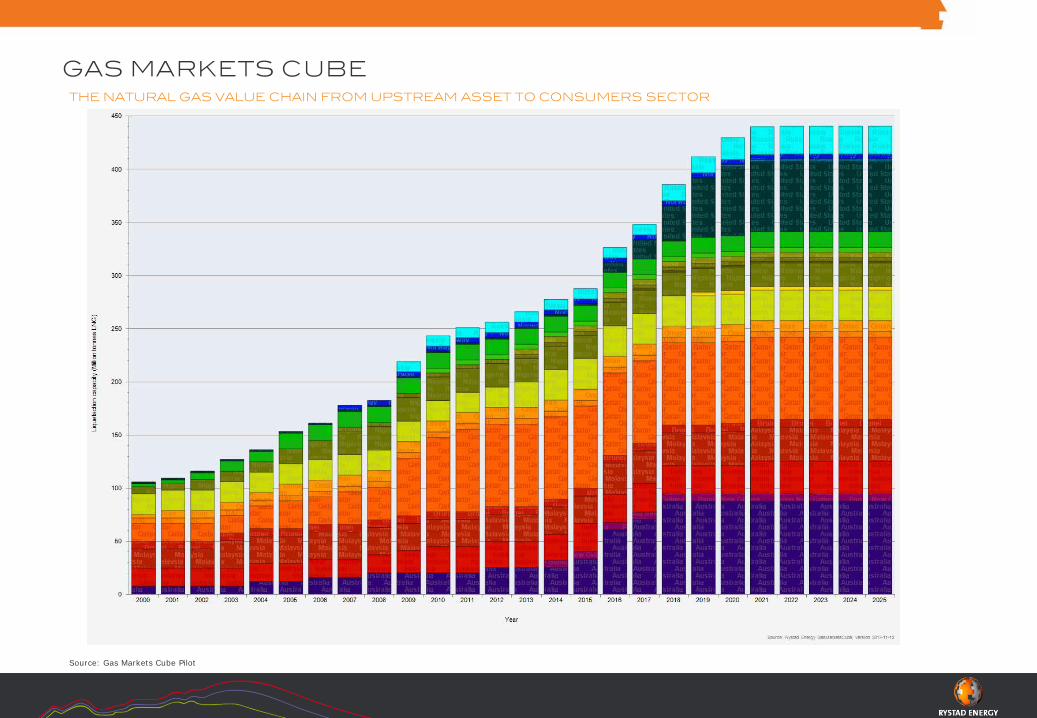
Source: Gas Markets Cube Pilot
GAS MARKETS CUBETHE NATURAL GAS VALUE CHAIN FROM UPSTREAM ASSET TO CONSUMERS SECTOR
Tailored presentations and discussions
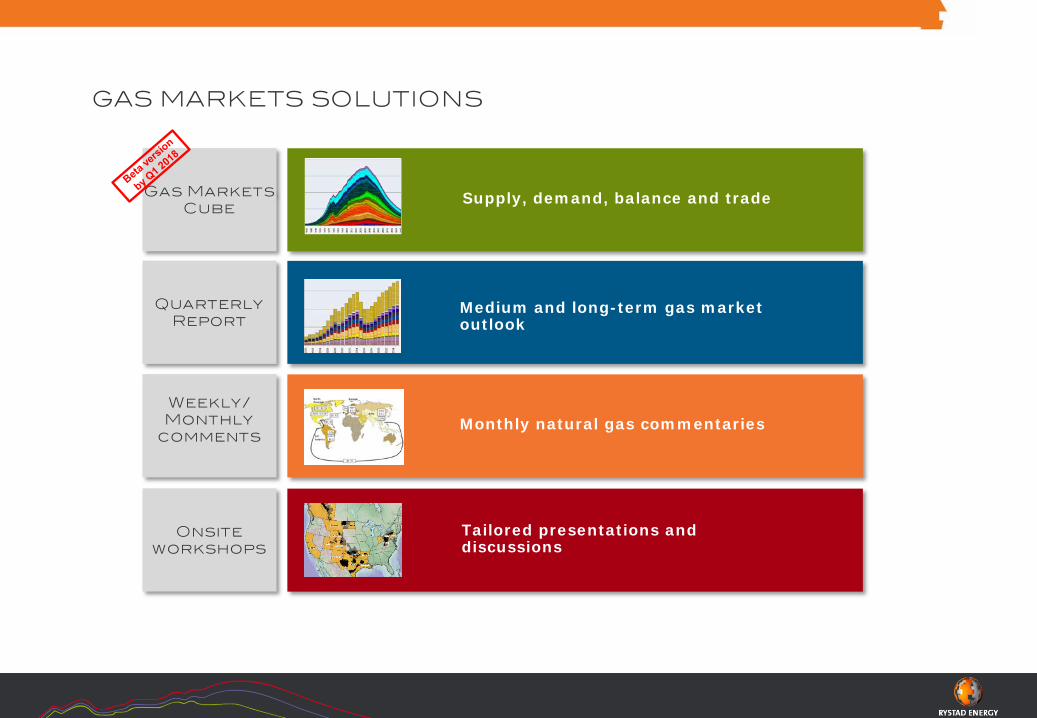
GAS MARKETS SOLUTIONS
Quarterly Report
Onsiteworkshops
Tailored presentations and discussions
Medium and long-term gas market outlook
Weekly/ Monthly
commentsMonthly natural gas commentaries
Gas Markets Cube
Supply, demand, balance and trade