rx for hot cities: more trees and ... - us forest service
TRANSCRIPT

Rx for Hot Cities: More Trees and Solar
Reflectance
Edith de Guzman
Director of Research | TreePeople
Director and Co-Founder | Los Angeles Urban Cooling Collaborative
PhD Student | UCLA Institute of the Environment & Sustainability
Rx for Hot Cities:
More Trees and Solar Reflectance

An initial question led us to explore trees through the
lens of heat impacts, public health, and equity...

What should our region’s urban tree cover target be?
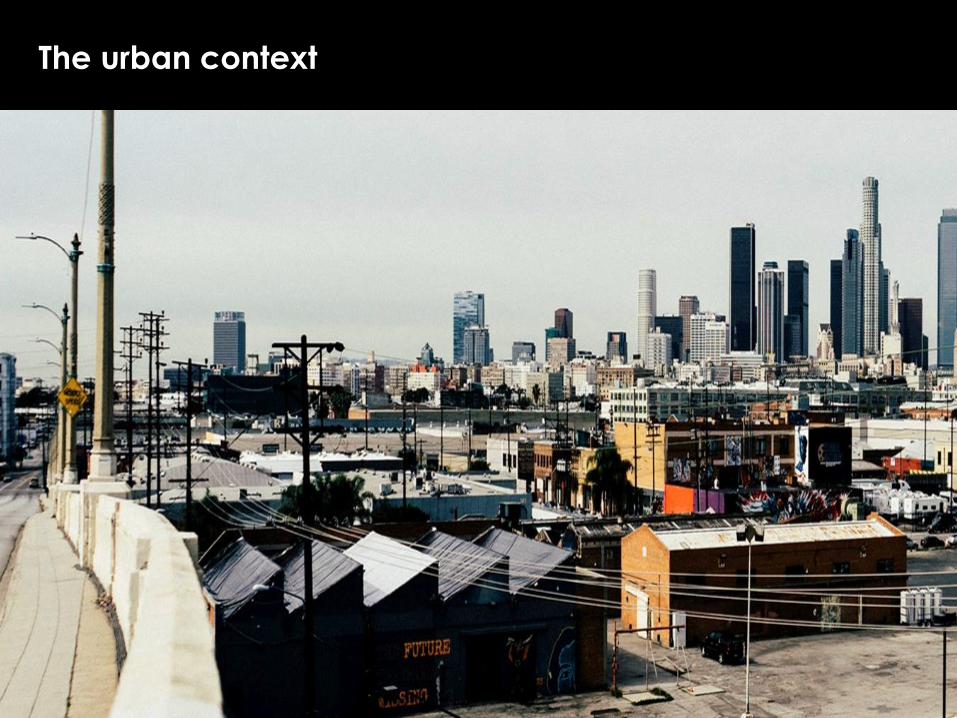
The urban context

140oF
125oF75oF
Credit: UCLA Environmental Science Practicum 2016-2017
“Improving Microclimates in Los Angeles’ Heat-Vulnerable Communities”
Advisor: Dr. Aradhna Tripati
Team Members: Nathan Fan, Stacey Li, Ingrid Maradiga, Apsara Perera, Jonathan Tedjakusnadiand, Jiahui Wang
The human context

Credit: Mapping Inequality: Redlining in New Deal America
University of Richmond's Digital Scholarship LabWatts: 10% Tree Cover Bel-Air: 35% Tree Cover
Disparities in tree cover and heat vulnerability
Mapping Inequality: Redlining in New Deal America. University of Richmond's Digital Scholarship Lab
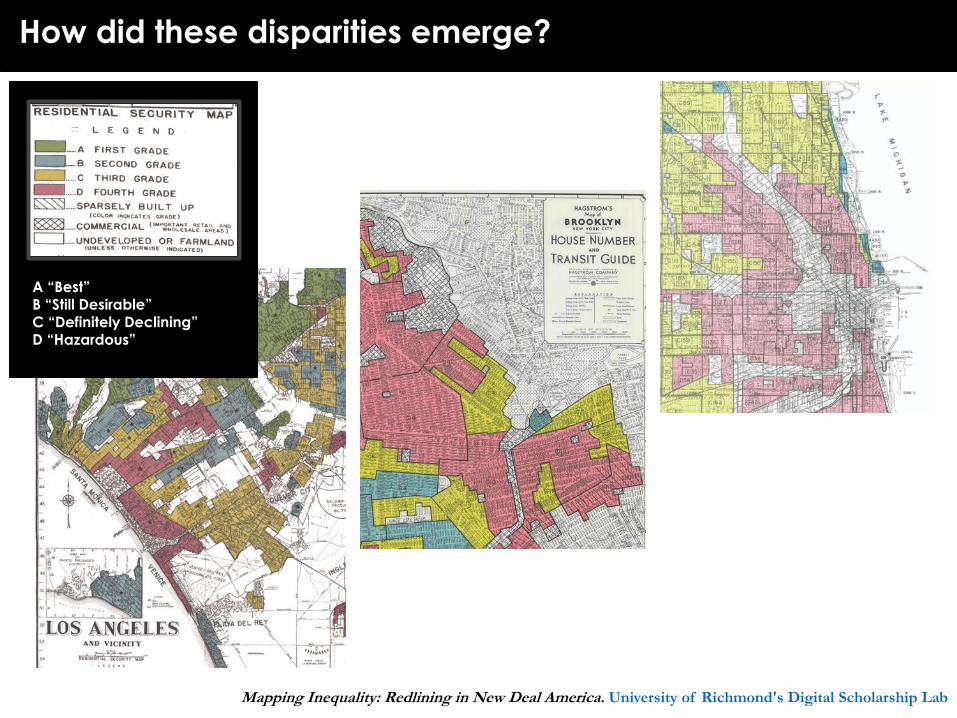
How did these disparities emerge?
A “Best”B “Still Desirable”
C “Definitely Declining”D “Hazardous”
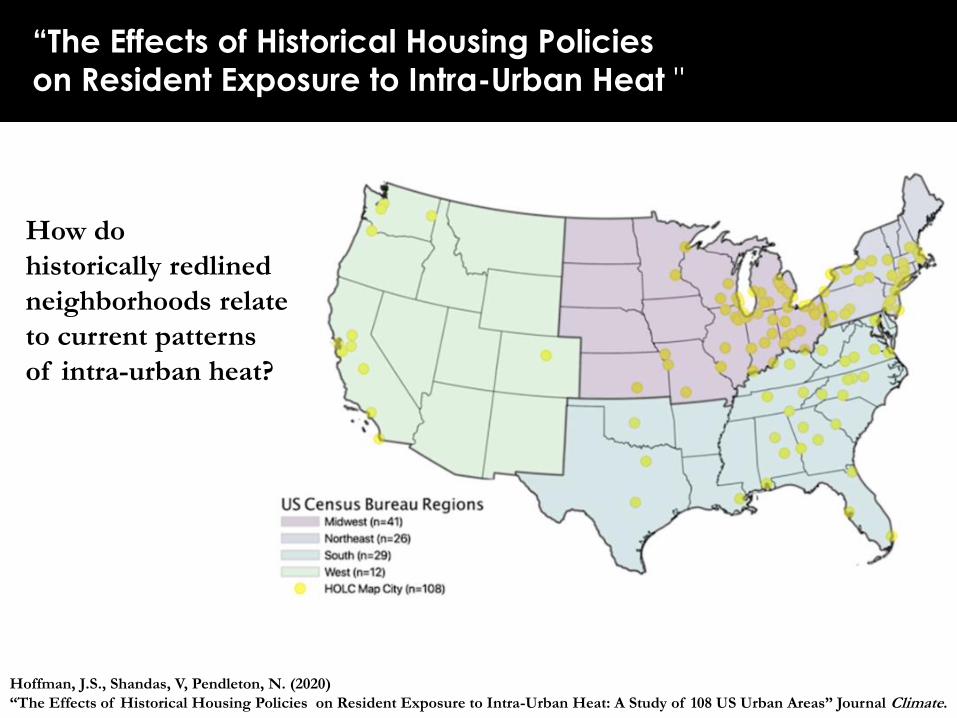
How do
historically redlined
neighborhoods relate
to current patterns
of intra-urban heat?
Hoffman, J.S., Shandas, V, Pendleton, N. (2020)
“The Effects of Historical Housing Policies on Resident Exposure to Intra-Urban Heat: A Study of 108 US Urban Areas” Journal Climate.
“The Effects of Historical Housing Policies
on Resident Exposure to Intra-Urban Heat "
Credit: Mapping Inequality: Redlining in New Deal America
University of Richmond's Digital Scholarship LabHoffman, J.S., Shandas, V, Pendleton, N. (2020) “The Effects of Historical Housing Policies on Resident Exposure to Intra-Urban Heat:
A Study of 108 US Urban Areas” Journal Climate.
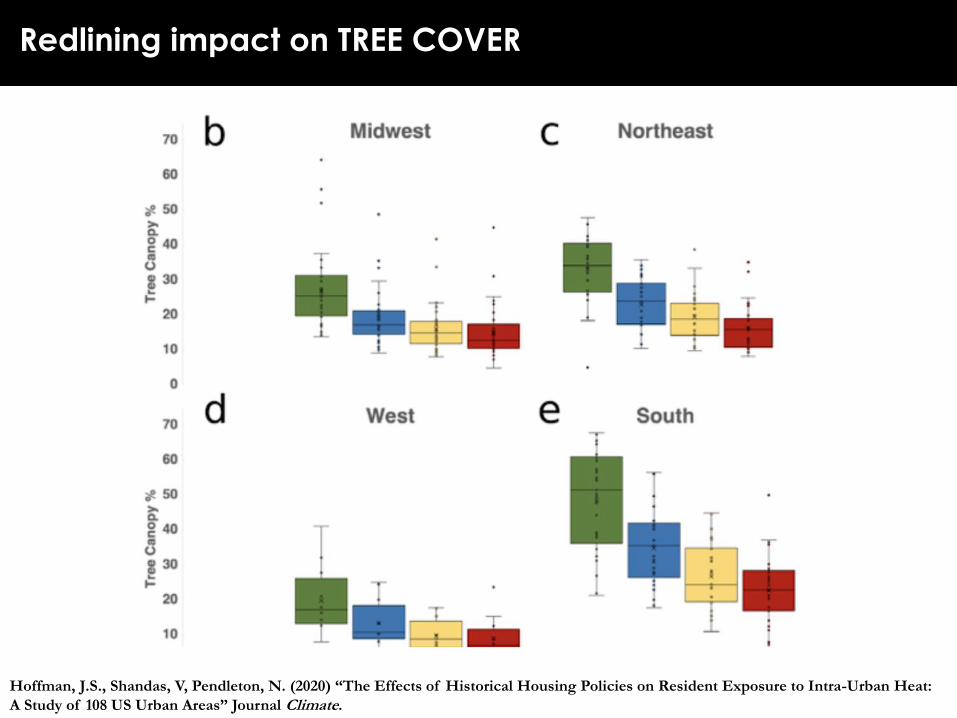
Redlining impact on TREE COVER

Credit: Mapping Inequality: Redlining in New Deal America
University of Richmond's Digital Scholarship Lab
Differences in
redlined vs. non-
redlined
neighborhoods:
Average:
2.6°C
(4.7°F)
Up to 7°C
(12.6°F)
Redlining impact on TEMPERATURE
Hoffman, J.S., Shandas, V, Pendleton, N. (2020) “The Effects of Historical Housing Policies on Resident Exposure to Intra-Urban Heat:
A Study of 108 US Urban Areas” Journal Climate.
Project funding
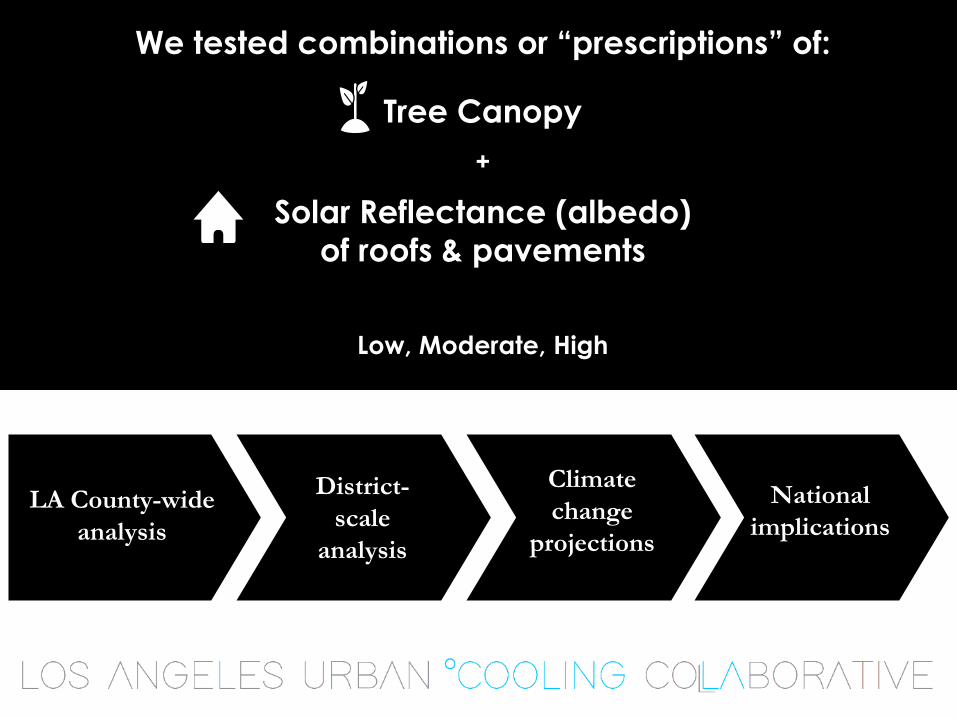
LA County-wide
analysis
District-
scale
analysis
Climate
change
projections
National
implications
We tested combinations or “prescriptions” of:
Tree Canopy
+
Solar Reflectance (albedo)
of roofs & pavements
Low, Moderate, High
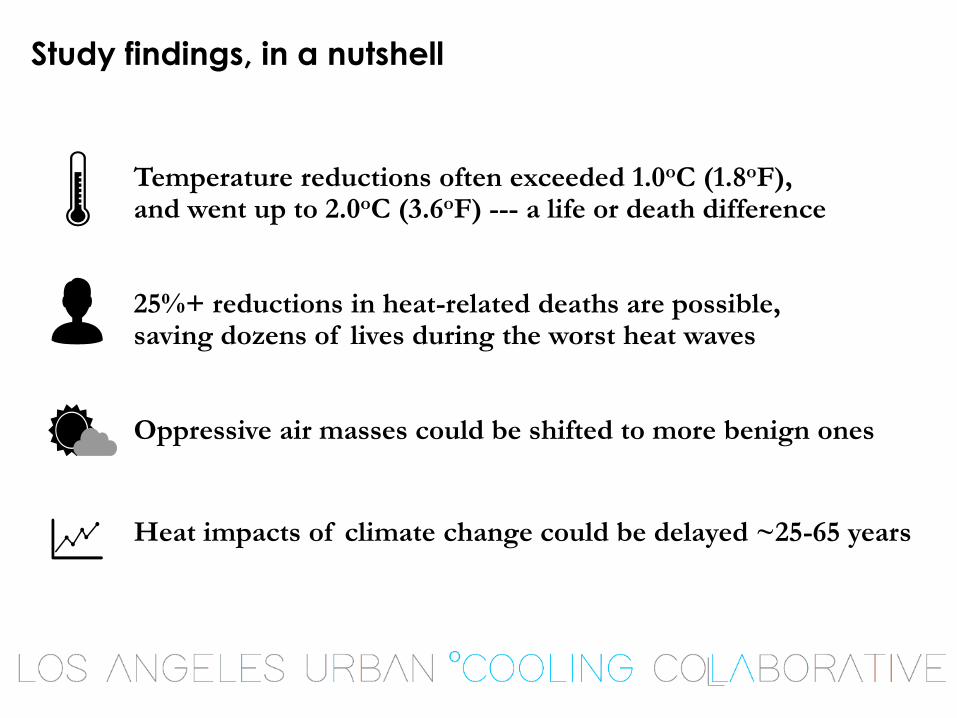
Temperature reductions often exceeded 1.0oC (1.8oF), and went up to 2.0oC (3.6oF) --- a life or death difference
25%+ reductions in heat-related deaths are possible, saving dozens of lives during the worst heat waves
Oppressive air masses could be shifted to more benign ones
Heat impacts of climate change could be delayed ~25-65 years
Study findings, in a nutshell
Thinking about heat-health outcomes
David Eisenman, MD MSHS
Professor of Medicine and Public Health
David Geffen School of Medicine at UCLA
Director, UCLA Center for Public Health and Disasters
Fielding UCLA School of Public Health


Health effects of heat
• Dehydration, redirecting blood away from vital organs to the skin, elevated heart rate… inflammatory response, cellular metabolic breakdown.
• Exacerbation of chronic diseases especially kidney, heart, lung diseases.
• Heat Illness
• Ten categories according to the WHO International Classification of Diseases: heat stroke, exertional heat stroke, heat syncope, heat cramps, heat exhaustion (3), heat fatigue, heat edema, other.
• Case Study: Elderly woman is brought to the clinic with nausea, lethargy and a temperature of 104.2 degrees. She may have sepsis, stroke, meningitis, or heat stroke.

Social Vulnerability Factors for Heat Effects
CATEGORY VULNERABILITY FACTORS SOURCE
AGE
65 years and older
Knowlton et al. 2009; Naughton et al. 2002; Basu
and Ostro 2008; Whitman et al.1997; Poumadere
et al. 2005; Reid et al. 2009
Children and adolescents Knowlton et al. 2009;
Infants (1 year of age or less) Basu and Ostro 2008
HEALTH
CONDITION
Certain medications McGeehin and Mirabelli 2001
Cardiovascular disease Poumadere et al. 2005
Diabetes Reid et al. 2009; Schwartz 2005
Psychiatric illness, major tranquilizers Naughton et al. 2002; Poumadere et al. 2005’
Kilbourne et al. l982
Lack of health insurance
People with medical problems who were
confined to bed or who were unable to care
for themselves
Semenza et al. 1996
Obesity Luber and McGeehin 2008
Alcoholism Kilbourne et al. 1982

CATEGORY VULNERABILITY FACTORS SOURCE
RESIDENCE
Living on higher floors of multistory buildingsKilboune et al. 1992; Semenza et al. 1996, Poumadere
et al. 2005
No AC in home, or inability to pay high electricity bills
resulting from AC use
McGeehin and Mirabelli 2001; Reid et al. 2009;
Semenza et al.1996; Kilbourne et al. 1982
Heat island effect (low tree cover and
high percentage of impervious surfaces)Shonkoff et al. 2009
High settlement density, sparse vegetation; having no
open space in the neighborhoodHarlan et al. 2006
Poor access to transit or car Shonkoff et al. 2009
Residence in high-crime areas McGeehin and Mirabelli 2001
SOCIAL
ISOLATION
Lack of access to media McGeehin and Mirabelli 2001
Non-English language speaking only McGeehin and Mirabelli 2001
Social isolation, living alone, and/or not leaving home
every day
McGeehin and Mirabelli 2001; Poumadere et al. 2005;
Naughton et al. 2002; Semenza et al. 1996
SOCIO-
ECONOMIC
FACTORS
Women Ishigami et al. 2007; Poumadere et al. 2005
Race other than white Reid et al. 2009
African Americans Basu and Ostro 2009; Ishigami et al. 2007; Whitman et
al. 1997
Poverty Poumadere et al. 2005; Reid et al. 2009; Harlan et al.
2006;
Less than high school diploma Reid et al. 2009
Outdoor workers MMWR 2005; CDC 2010; Riley et al 2016
Citizenship status Shonkoff et al. 2009
Social Vulnerability Factors for Heat Effects

Figure from U.S. Global Change Research Program
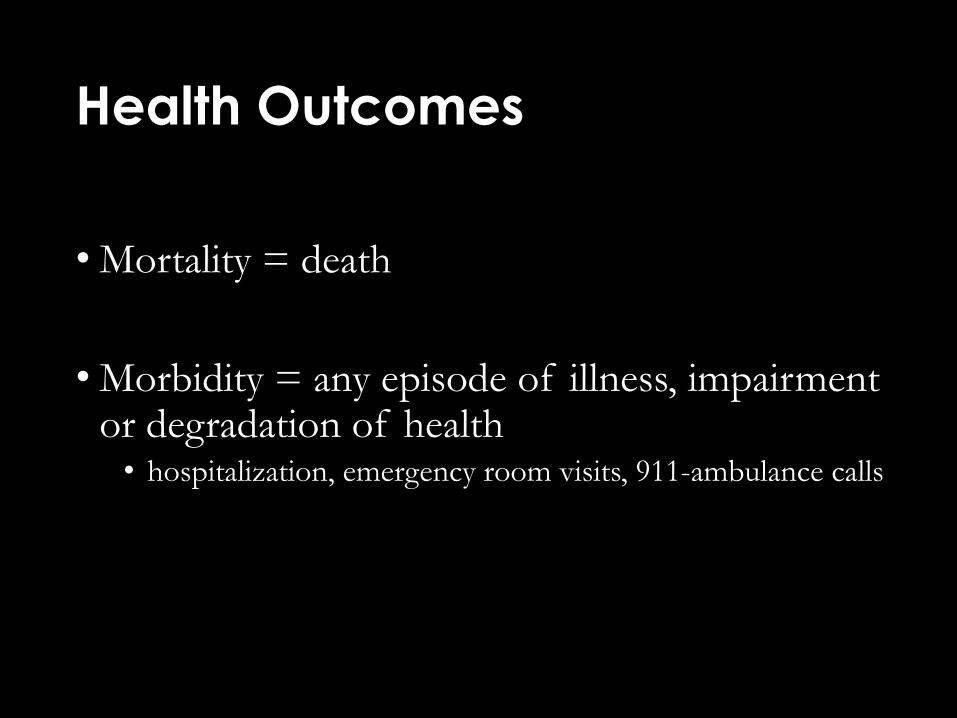
Health Outcomes
• Mortality = death
• Morbidity = any episode of illness, impairment or degradation of health
• hospitalization, emergency room visits, 911-ambulance calls

Data Reliability
• Mortality• Are causes of death reliable? Attending physician fills out
causes of death and can be inaccurate. Death certificate forms not designed by researchers
• Morbidity• Studies have found that hospitalization diagnosis are valid
• Less known about validity of ER diagnoses


Laurence S. Kalkstein, Ph.D.
Professor Emeritus
President, Applied Climatologists, Inc.
Co-Founder, Los Angeles Urban Cooling Collaborative (LAUCC)
Climate and Heat-Health Modeling: Results From LAUCC Analysis

● Heat is the leading weather-related cause of death in the U.S.
● Urban area residents are particularly sensitive to heat,
especially in non-tropical areas.
● The Urban Heat Island (UHI) contributes to this sensitivity.
● The vulnerability of people varies among cities and neighborhoods.
● Summer climate variability is more important than the actual temperature
(more people die of heat in Los Angeles than Singapore!).
● Extended heat events and excessive nighttime temperatures are most
important contributors.
● We can improve the city’s environment to lessen the negative health
impact of heat.
Quick Facts About Heat and Health
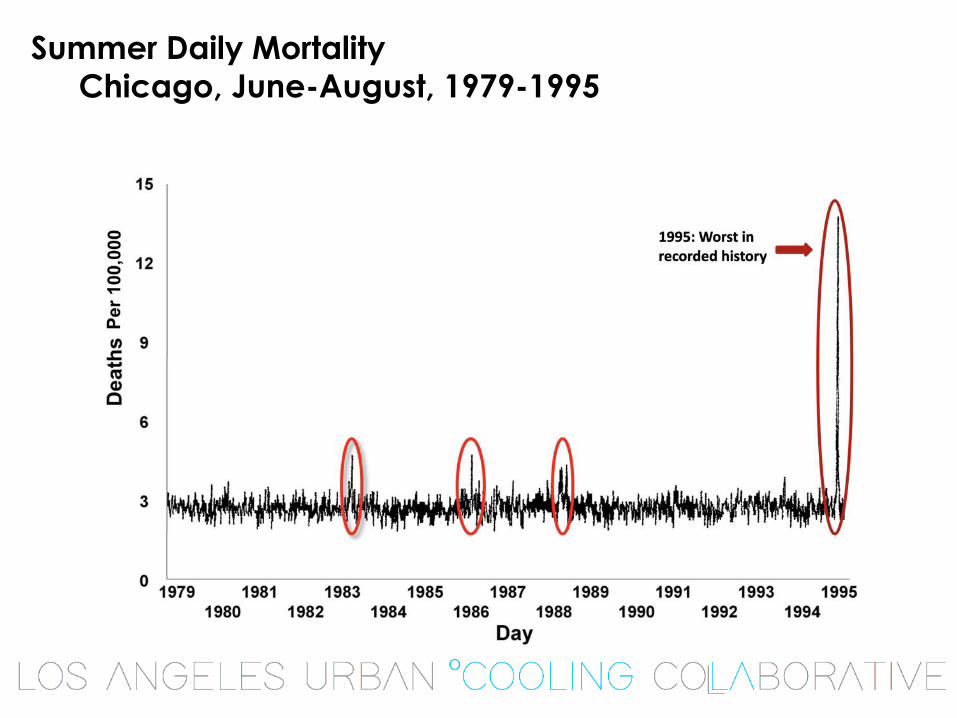
Summer Daily Mortality
Chicago, June-August, 1979-1995

World Map of Sensitivities:
Regions With Most Heat-Related Deaths
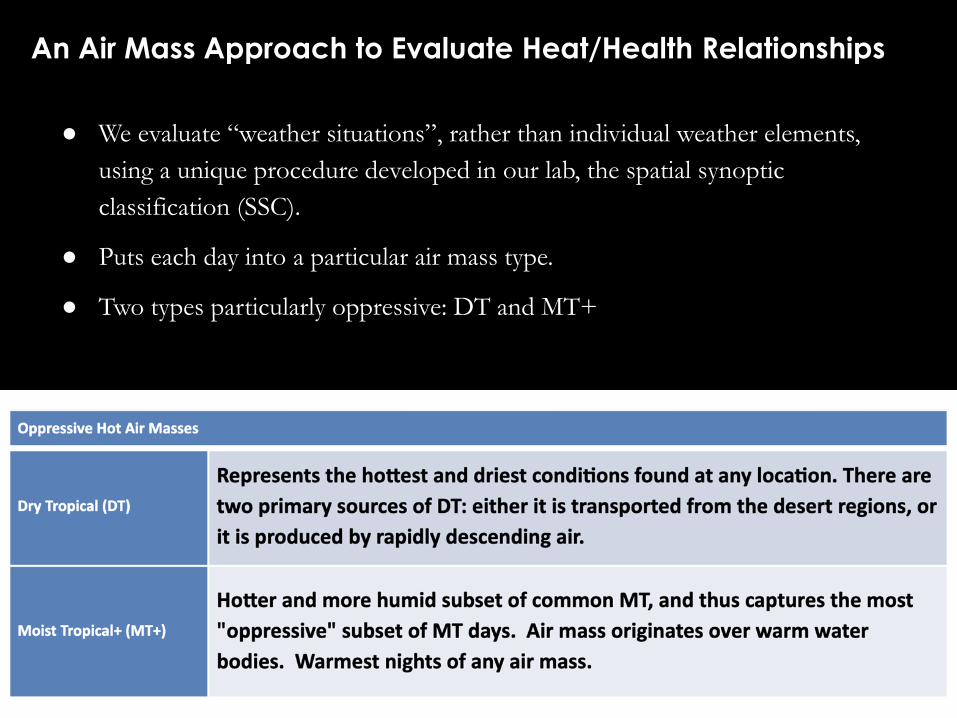
● We evaluate “weather situations”, rather than individual weather elements,
using a unique procedure developed in our lab, the spatial synoptic
classification (SSC).
● Puts each day into a particular air mass type.
● Two types particularly oppressive: DT and MT+
An Air Mass Approach to Evaluate Heat/Health Relationships
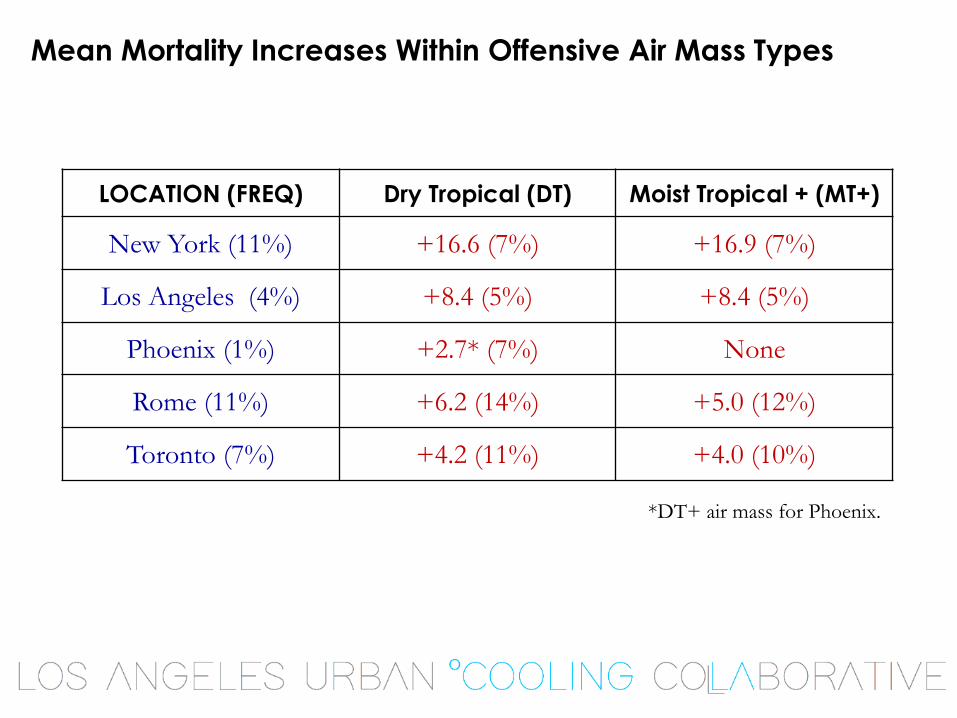
Mean Mortality Increases Within Offensive Air Mass Types
*DT+ air mass for Phoenix.
LOCATION (FREQ) Dry Tropical (DT) Moist Tropical + (MT+)
New York (11%) +16.6 (7%) +16.9 (7%)
Los Angeles (4%) +8.4 (5%) +8.4 (5%)
Phoenix (1%) +2.7* (7%) None
Rome (11%) +6.2 (14%) +5.0 (12%)
Toronto (7%) +4.2 (11%) +4.0 (10%)

Can We Cool Our Cities?

Urban Greening:
Shade and evaporative cooling
Provides shade and reduce
solar heat gain in the
built environment
Improves energy efficiency
through shading structures
and air conditioning units
Converts solar radiation
to evapotranspiration

Reflective Roofing:
Energy efficiency and comfort
Reduces electricity use and
cooling costs in year-round
cooling environments
Improves air quality by reducing
the formation of ozone
Provides a more
pleasant home environment

Two Levels of Spatial Analysis
Countywide: Evaluate the entire county and assume similar
“prescriptions” are employed throughout.
● Advantage: large sample size for mortality;
● Disadvantage: cannot break down results locally.
District level: Evaluate a number of socially-homogeneous districts
within LA County separately.
● Advantage: can determine impact of socio-economic factors
● Disadvantage: sometimes population sizes are too small to do an adequate
mortality evaluation.
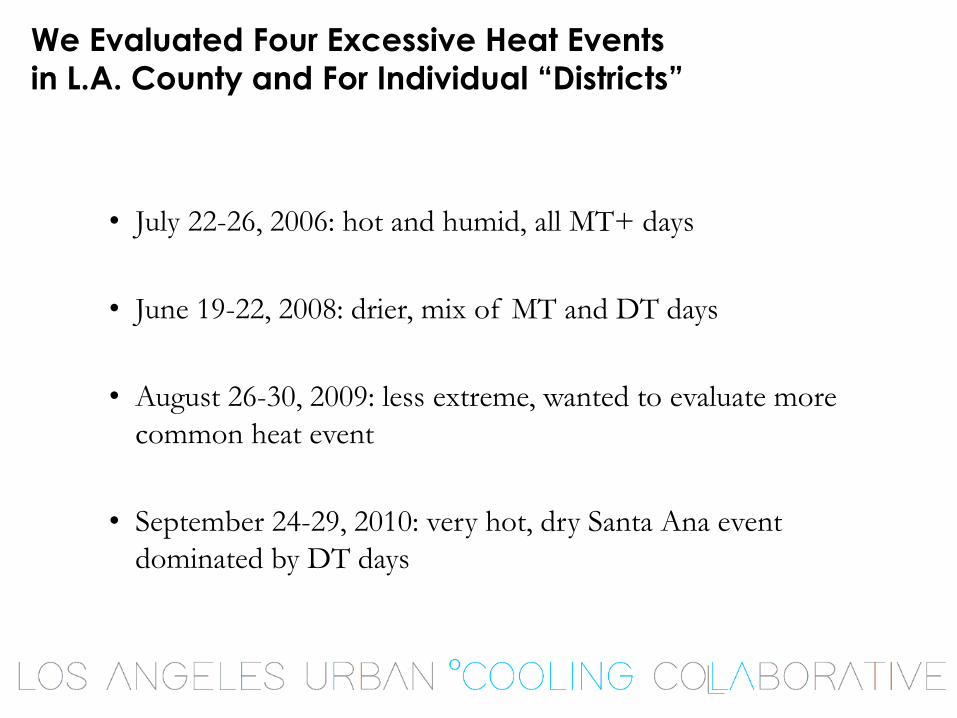
We Evaluated Four Excessive Heat Events
in L.A. County and For Individual “Districts”
• July 22-26, 2006: hot and humid, all MT+ days
• June 19-22, 2008: drier, mix of MT and DT days
• August 26-30, 2009: less extreme, wanted to evaluate more
common heat event
• September 24-29, 2010: very hot, dry Santa Ana event
dominated by DT days

Mitigation Scenarios (albedo and vegetation)

Model Results:
County Level Air Temperature Differences
County-level mitigation 🡺 Rx 1; Low tree cover, high reflectance
2m Air T differences: Control - Rx1
Heat Wave: August 26, 2009
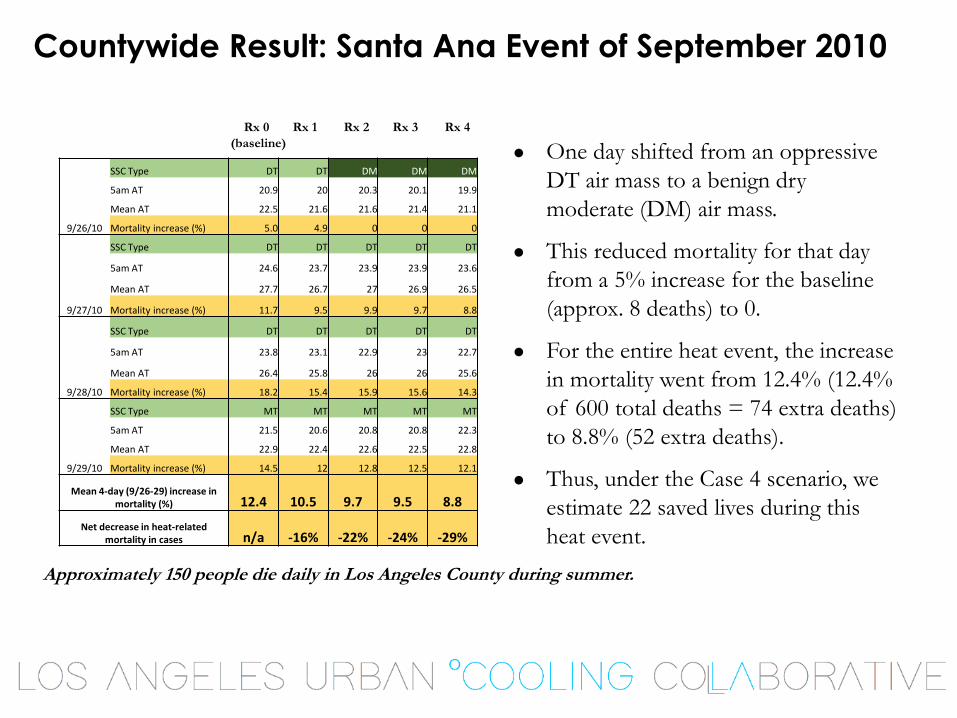
Countywide Result: Santa Ana Event of September 2010
● One day shifted from an oppressive
DT air mass to a benign dry
moderate (DM) air mass.
● This reduced mortality for that day
from a 5% increase for the baseline
(approx. 8 deaths) to 0.
● For the entire heat event, the increase
in mortality went from 12.4% (12.4%
of 600 total deaths = 74 extra deaths)
to 8.8% (52 extra deaths).
● Thus, under the Case 4 scenario, we
estimate 22 saved lives during this
heat event.
9/26/10
SSC Type DT DT DM DM DM
5am AT 20.9 20 20.3 20.1 19.9
Mean AT 22.5 21.6 21.6 21.4 21.1
Mortality increase (%) 5.0 4.9 0 0 0
9/27/10
SSC Type DT DT DT DT DT
5am AT 24.6 23.7 23.9 23.9 23.6
Mean AT 27.7 26.7 27 26.9 26.5
Mortality increase (%) 11.7 9.5 9.9 9.7 8.8
9/28/10
SSC Type DT DT DT DT DT
5am AT 23.8 23.1 22.9 23 22.7
Mean AT 26.4 25.8 26 26 25.6
Mortality increase (%) 18.2 15.4 15.9 15.6 14.3
9/29/10
SSC Type MT MT MT MT MT
5am AT 21.5 20.6 20.8 20.8 22.3
Mean AT 22.9 22.4 22.6 22.5 22.8
Mortality increase (%) 14.5 12 12.8 12.5 12.1
Mean 4-day (9/26-29) increase in mortality (%) 12.4 10.5 9.7 9.5 8.8
Net decrease in heat-related mortality in cases n/a -16% -22% -24% -29%
Rx 0 Rx 1 Rx 2 Rx 3 Rx 4
(baseline)
Approximately 150 people die daily in Los Angeles County during summer.
District-Level Evaluation
• Districts developed by California State University Northridge
– Dr. Kimberly Kirner, Anthropology Department
– Dr. Regan Maas, Geography Department
• Los Angeles County was divided into smaller socio-economically homogeneous districts.
• Each district needed to have a population of at least 300,000 to minimize non-meteorological variations in mortality.
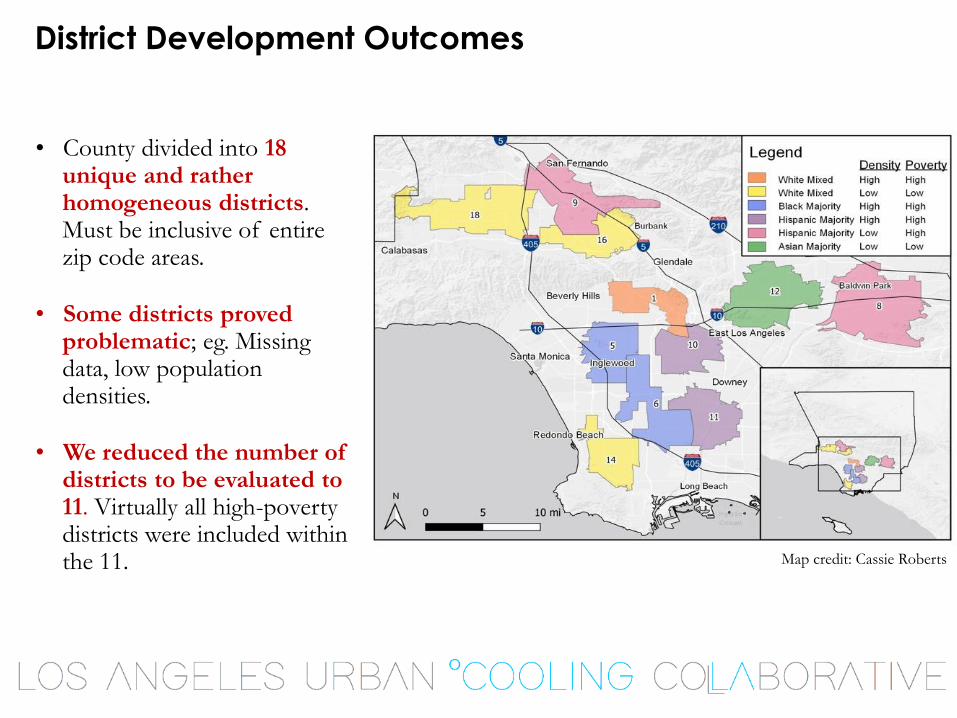
District Development Outcomes
• County divided into 18 unique and rather homogeneous districts. Must be inclusive of entire zip code areas.
• Some districts proved problematic; eg. Missing data, low population densities.
• We reduced the number of districts to be evaluated to 11. Virtually all high-poverty districts were included within the 11. Map credit: Cassie Roberts

Cooling and Mortality Results: District 11, Los Angeles
Mean AT
7/22/2006 29.9 29.4 29.2 29.4 29.0
7/23/2006 27.0 26.5 26.2 26.5 26.1
7/24/2006 28.7 28.2 28.0 28.2 27.8
7/25/2006 24.6 24.3 24.2 24.3 24.1
7/26/2006 27.0 26.6 26.5 26.6 26.4
Date Rx 0 Rx 1 Rx 2 Rx 3 Rx 4
Estimated mortality
7/22/2006 0.5 0.4 0.4 0.4 0.3
7/23/2006 1.0 0.8 0.8 0.8 0.8
7/24/2006 1.7 1.3 1.1 1.3 1.0
7/25/2006 0.7 0.5 0.4 0.5 0.3
7/26/2006 0.7 0.5 0.5 0.5 0.4
SUM 4.52 3.49 3.11 3.49 2.73
REDUCTION 23% 31% 23% 40%
Rx 0: 16.6% TCC, .10
pavement, .17 roof
Rx 1: 20% TCC, .35
pavement, .45 roof
Rx 2: 40% TCC, .20
pavement, .27 roof
Rx 3: 30% TCC, .25
pavement, .37 roof
Rx 4: 40% TCC, .35
pavement, .45 roof
Assumptions are that these cases only apply to the individual district, and there are no albedo/vegetation increases in the remainder of the study area!

Percent Reduction in Mortality by District
July 22-26, 2006
Rx 4: High Tree Canopy / High Albedo

Percent Reduction in Mortality by District
Sept. 24-29, 2010
Rx 4: High Tree Canopy / High Albedo

How Many Years Can We Delay Climate Change?
Mean max
temperature reduction:
Rx 1: -1.1oC
Rx 2: -1.0oC
Rx 3: -1.0oC
Rx 4: -1.7oC

Summary of Results
• Lower income, more densely populated districts generally
demonstrated the greatest increases in heat-related mortality (eg.
Districts 1, 5, 11).
• These districts also showed the greatest benefits from use of “cool
solutions”, based upon mortality reductions.
• There were some unexplained exceptions: eg. Low-income District
10 showed little impact, wealthier but hot district 16 showed
greater impact.
• Use of “cool solutions” can delay climate change by at least
several decades in Los Angeles.
Concluding Remarks
● The importance of heat upon human health cannot be overstated.
● We must gain understanding about the regionality of the problem, the
impact of the urban heat island, and the potential impact of climate
change.
● For those who are skeptical of climate change disaster, we must
emphasize that heat is already the largest weather-related killer!
● Numerous urban areas have expressed interest in this work and we are
actively engaged with them - Twin Cities, Madison/Milwaukee, WI,
Miami-Dade and Broward counties, FL.
● Academics, the private sector, the government, and nonprofits must
unite (like LAUCC) to tackle this problem and to come up with
adaptation and/or mitigation policy options.

Project report, infographic
and more information at
treepeople.org/urbancooling