russian truck market - napinfo.ru · 8001-10000 5001-8000 3501-5000 no data ... nizhniy novgorod...
TRANSCRIPT
Russiantruck market

2Source: Russian Automotive Market Research (NAPI).
Trucks production in Russia, by GVW
Brand LCV Middle Heavy
2,5 - 5 5 - 8 8 - 12 12 - 16 > 16
KAMAZ
GAZ
Ural
ZIL
Hyundai
Iveco-AMT
Volvo
Renault
Scania
Mercedes
Fiat
Fuso
Isuzu
Baw

3Source: Russian Automotive Market Research (NAPI).
Trucks Import, by GVW
Brand LCV
2,5 - 5
BAW
CHEVROLET
CITROEN
FIAT
FORD
HYUNDAI
MERCEDES-BENZ
MITSUBISHI
NISSAN
PEUGEOT
RENAULT
VOLKSWAGEN
BOGDAN
KIA
FOTON
GREAT WALL
TOYOTA
FAW
MAZDA
JMC
Brand Middle
5-8 10-12 12-16
BAW
HYUNDAI
ISUZU
MERCEDES-BENZ
MITSUBISHI
FOTON
FAW
HINO
IVECO
MAN
DAEWOO
Brand Heavy
> 16
FORD
HYUNDAI
ISUZU
MERCEDES-BENZ
MITSUBISHI
RENAULT
FAW
HINO
IVECO
MAN
DAEWOO
BEIFANG BENCHI
CAMC
CNHTC
DAEWOO
DAF
DONGFENG
FREIGHTLINER
INTERNATIONAL
KENWORTH
KRAZ
MACK
SCANIA
SHAANXI
TATRA
VOLVO

108
79
New Used
Truck Import, K
Source: FTS, Russian Automotive Market Research. 4
2008
115
35
New Used
2011
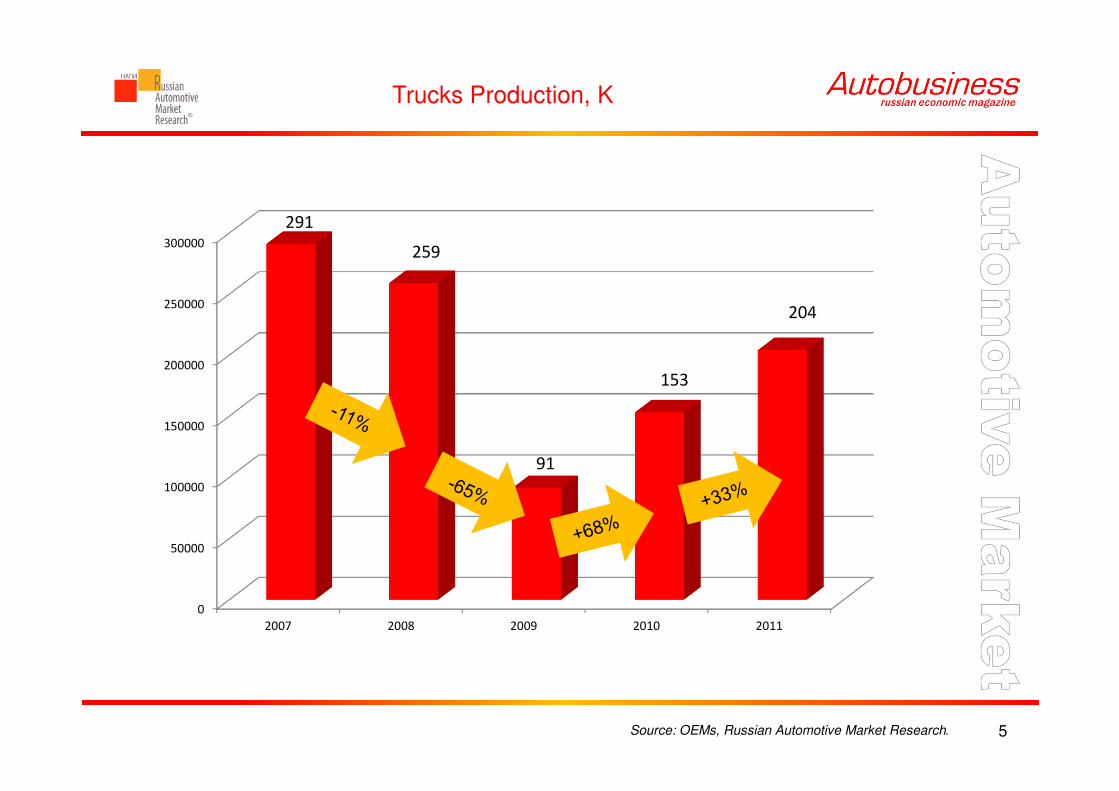
Trucks Production, K
Source: OEMs, Russian Automotive Market Research. 5
0
50000
100000
150000
200000
250000
300000
2007 2008 2009 2010 2011
291
259
91
153
204
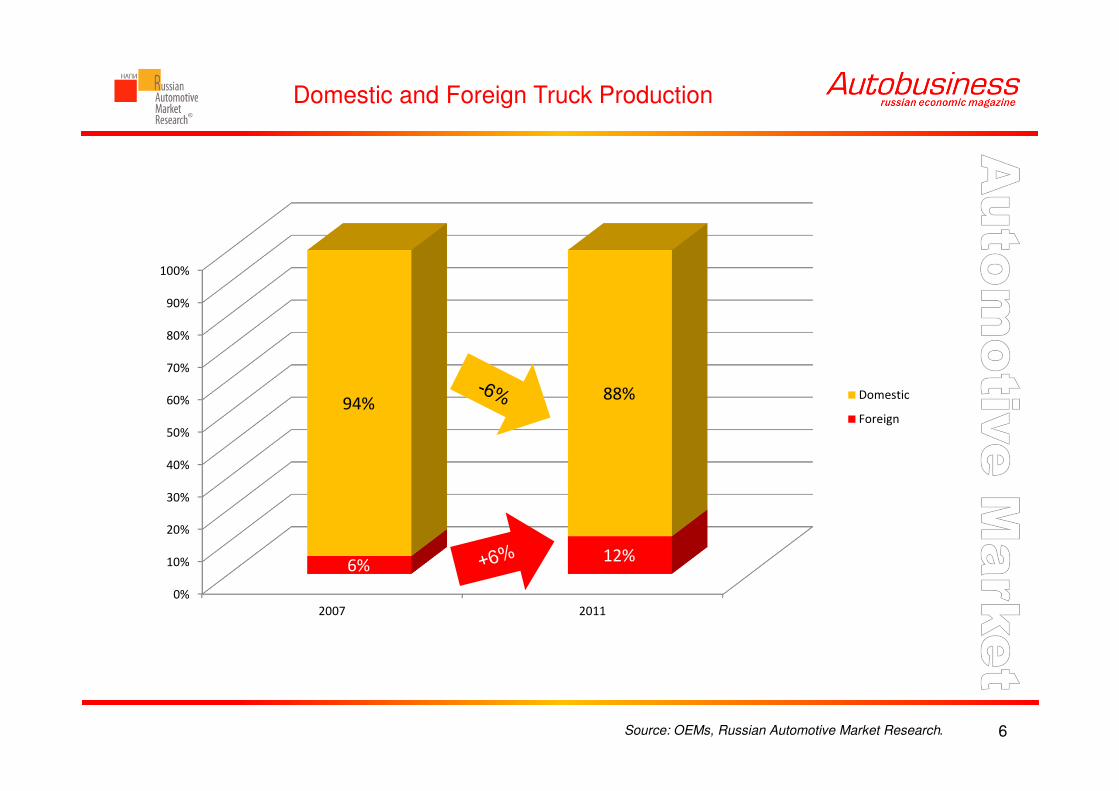
Domestic and Foreign Truck Production
Source: OEMs, Russian Automotive Market Research. 6
0%
10%
20%
30%
40%
50%
60%
70%
80%
90%
100%
2007 2011
6%12%
94%88% Domestic
Foreign
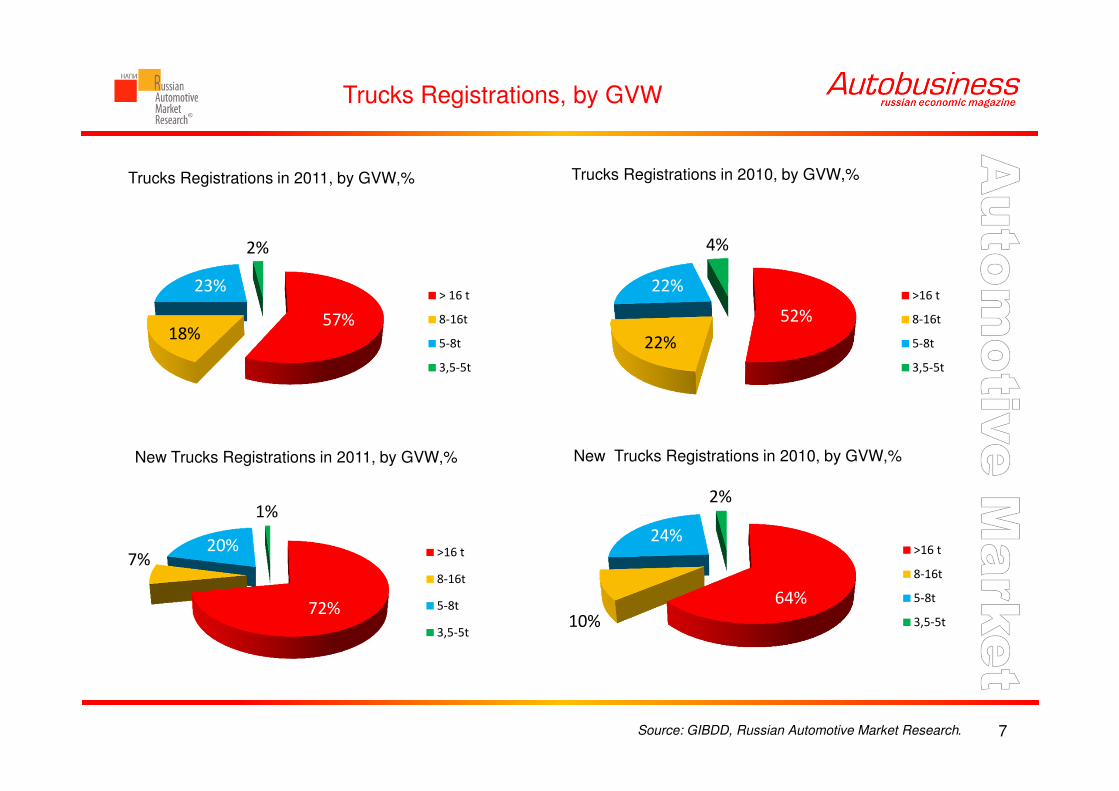
Trucks Registrations, by GVW
Source: GIBDD, Russian Automotive Market Research. 7
Trucks Registrations in 2011, by GVW,% Trucks Registrations in 2010, by GVW,%
New Trucks Registrations in 2011, by GVW,% New Trucks Registrations in 2010, by GVW,%
52%
22%
22%
4%
>16 t
8-16t
5-8t
3,5-5t
72%
7%20%
1%
>16 t
8-16t
5-8t
3,5-5t
64%
10%
24%
2%
>16 t
8-16t
5-8t
3,5-5t
57%18%
23%
2%
> 16 t
8-16t
5-8t
3,5-5t
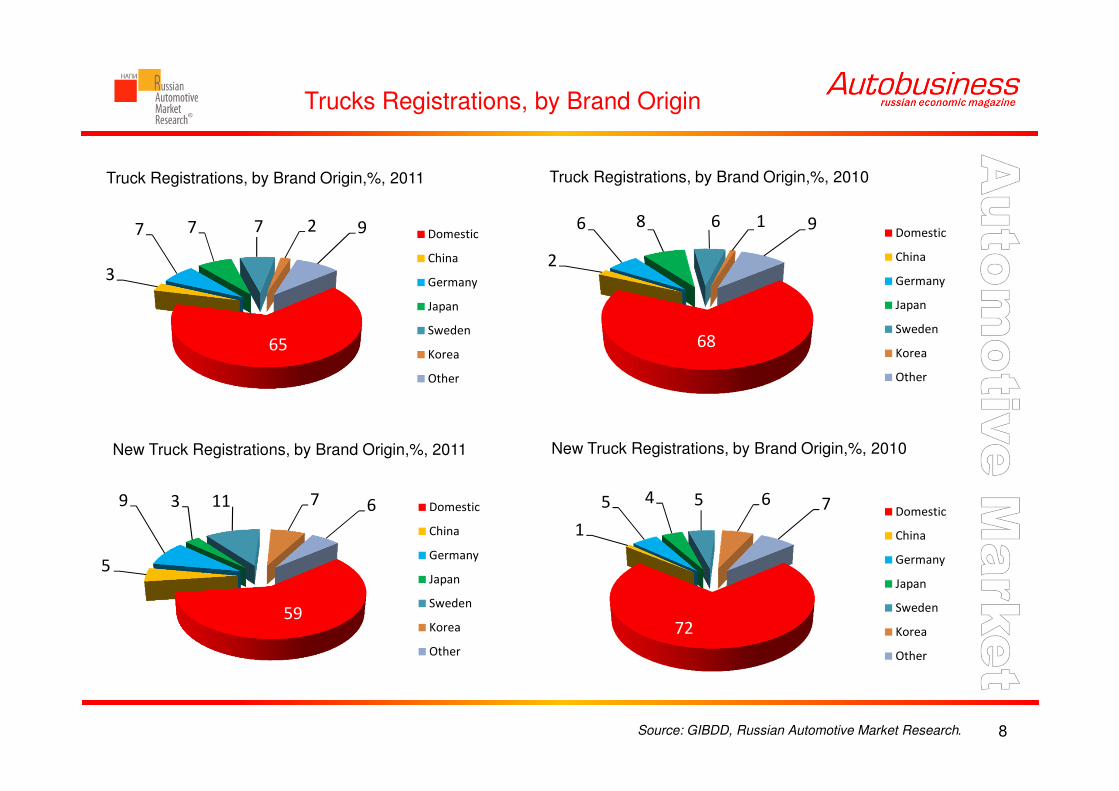
Trucks Registrations, by Brand Origin
8
Truck Registrations, by Brand Origin,%, 2011 Truck Registrations, by Brand Origin,%, 2010
New Truck Registrations, by Brand Origin,%, 2011 New Truck Registrations, by Brand Origin,%, 2010
Source: GIBDD, Russian Automotive Market Research.
68
2
6 8 6 1 9Domestic
China
Germany
Japan
Sweden
Korea
Other
59
5
9 3 11 7 6 Domestic
China
Germany
Japan
Sweden
Korea
Other
65
3
7 7 7 2 9 Domestic
China
Germany
Japan
Sweden
Korea
Other
72
1
5 4 5 6 7Domestic
China
Germany
Japan
Sweden
Korea
Other

New truck registrations, by regions and GVW in 2011
9
Region >1600014001-16000
12001-14000
10001-12000
8001-10000 5001-8000 3501-5000 no data
Moscow 68,43% 2,11% 0,65% 4,95% 0,07% 18,91% 2,39% 2,48%
Moscow region 64,91% 2,76% 0,60% 5,01% 0,35% 23,50% 1,01% 1,87%
Tatarstan Republic 82,03% 2,23% 1,15% 1,67% 0,02% 11,40% 0,21% 1,30%
St. Petersburg 70,82% 1,69% 0,38% 3,12% 0,00% 15,69% 1,09% 7,21%
Krasnodar region 72,40% 1,71% 0,39% 2,19% 0,51% 19,24% 1,59% 1,98%
Khanty-Mansiysk region 85,36% 3,41% 2,58% 0,94% 0,10% 5,53% 0,17% 1,91%
Nizhniy Novgorod region 59,41% 1,29% 0,14% 4,82% 0,14% 31,62% 0,75% 1,82%
Chelyabinsk region 68,62% 2,57% 0,30% 2,84% 0,26% 22,46% 0,45% 2,50%
Sverdlovsk region 68,21% 2,30% 0,56% 2,94% 0,67% 22,42% 0,48% 2,42%
Krasnoyarsk region 73,14% 2,32% 1,53% 2,15% 2,32% 15,86% 0,48% 2,19%
Rostov-on-Don region 68,46% 1,84% 0,28% 4,61% 0,14% 21,25% 0,78% 2,63%
Samara region 68,19% 2,90% 0,56% 3,32% 0,05% 21,42% 1,03% 2,53%
Komi Republic 89,32% 1,20% 1,25% 0,45% 0,00% 5,81% 0,25% 1,70%
Bashkortostan Republic 67,93% 3,23% 1,25% 2,39% 0,42% 22,64% 0,78% 1,35%
Yamal-Nenets region 90,61% 1,44% 2,32% 0,66% 0,11% 3,75% 0,17% 0,94%
Average 71,01% 2,26% 0,83% 3,34% 0,35% 19,01% 0,86% 2,34%
Source: GIBDD, Russian Automotive Market Research.

New truck registrations, by regions and GVW in 2011
10
Region >1600014001-16000
12001-14000
10001-12000
8001-10000 5001-8000 3501-5000 no data
Moscow 9201 284 87 666 10 2542 322 334
Moscow region 4453 189 41 344 24 1612 69 128
Tatarstan Republic 4715 128 66 96 1 655 12 75
St. Petersburg 3318 79 18 146 735 51 338
Krasnodar region 3142 74 17 95 22 835 69 86
Khanty-Mansiysk region 3534 141 107 39 4 229 7 79
Nizhniy Novgorod region 1663 36 4 135 4 885 21 51
Chelyabinsk region 1815 68 8 75 7 594 12 66
Sverdlovsk region 1719 58 14 74 17 565 12 61
Krasnoyarsk region 1669 53 35 49 53 362 11 50
Rostov-on-Don region 1485 40 6 100 3 461 17 57
Samara region 1458 62 12 71 1 458 22 54
Komi Republic 1782 24 25 9 116 5 34
Bashkortostan Republic 1305 62 24 46 8 435 15 26
Yamal-Nenets region 1641 26 42 12 2 68 3 17
Source: GIBDD, Russian Automotive Market Research.

New heavy truck registrations, by regions in 2011
11
Region >16000
Tatarstan Republic 82,03%
Khanty-Mansiysk region 85,36%
Komi Republic 89,32%
Yamal-Nenets region 90,61%
Ivanovo region 90,46%
Khabarovskyi region 82,64%
Sakha Republic 82,66%
Kaliningrad region 92,59%
Sakhalin region 80,80%
Magadan region 82,25%
Tyva Republic 81,29%
Nenets region 82,26%
Chukotka region 88,00%
Average 71,01%
Source: GIBDD, Russian Automotive Market Research.

New truck registrations, by body types in 2011
12
Type of body Quantity Share, %
Tractor 29419 27,81%
Dumper 22041 20,84%
Van & Onboard 24201 22,88%
Truck crane 5263 4,98%
Tank 3894 3,68%
Refrigerator 1655 1,56%
Garbage truck 1116 1,06%
Total (>1%) 87589 82,81%
Other (30 body types) 18178 17,19%
Total 105767 100,00%
Source: GIBDD, Russian Automotive Market Research.

New truck registrations, by body types
and regions in 2011
13
Region Tractor DumperVan &
Onboard Truck crane Tank Refrigerator
Garbage truck
Moscow 28,48% 19,25% 26,94% 5,73% 1,64% 3,62% 1,12%
Moscow region 32,96% 14,14% 30,32% 4,21% 3,15% 3,22% 1,37%
Tatarstan Republic 34,22% 21,92% 11,73% 1,97% 1,51% 0,45% 0,40%
St. Petersburg 42,48% 16,99% 19,79% 3,50% 3,65% 1,02% 0,30%
Krasnodar region 22,28% 29,38% 24,12% 5,81% 2,79% 2,26% 1,08%
Khanty-Mansiysk region 24,03% 25,14% 9,23% 11,76% 8,53% 0,24% 0,75%
Nizhniy Novgorod region 33,37% 12,68% 34,23% 3,22% 4,39% 0,75% 0,71%
Chelyabinsk region 34,97% 21,44% 26,92% 2,31% 3,67% 0,00% 0,49%
Sverdlovsk region 29,44% 20,52% 18,97% 4,56% 2,50% 5,56% 1,79%
Krasnoyarsk region 22,26% 26,07% 20,11% 5,13% 3,86% 1,27% 0,53%
Rostov-on-Don region 31,07% 19,13% 28,45% 3,00% 4,33% 2,54% 0,32%
Samara region 31,76% 19,64% 27,03% 5,43% 3,93% 2,48% 0,61%
Komi Republic 21,75% 25,81% 8,42% 8,32% 6,57% 0,30% 0,35%
Bashkortostan Republic 18,84% 24,26% 29,88% 6,35% 2,19% 0,57% 1,15%
Yamal-Nenets region 15,02% 35,73% 6,79% 14,08% 7,29% 0,22% 0,50%
Average 27,81% 20,84% 22,88% 4,98% 3,68% 1,56% 1,06%
Source: GIBDD, Russian Automotive Market Research.
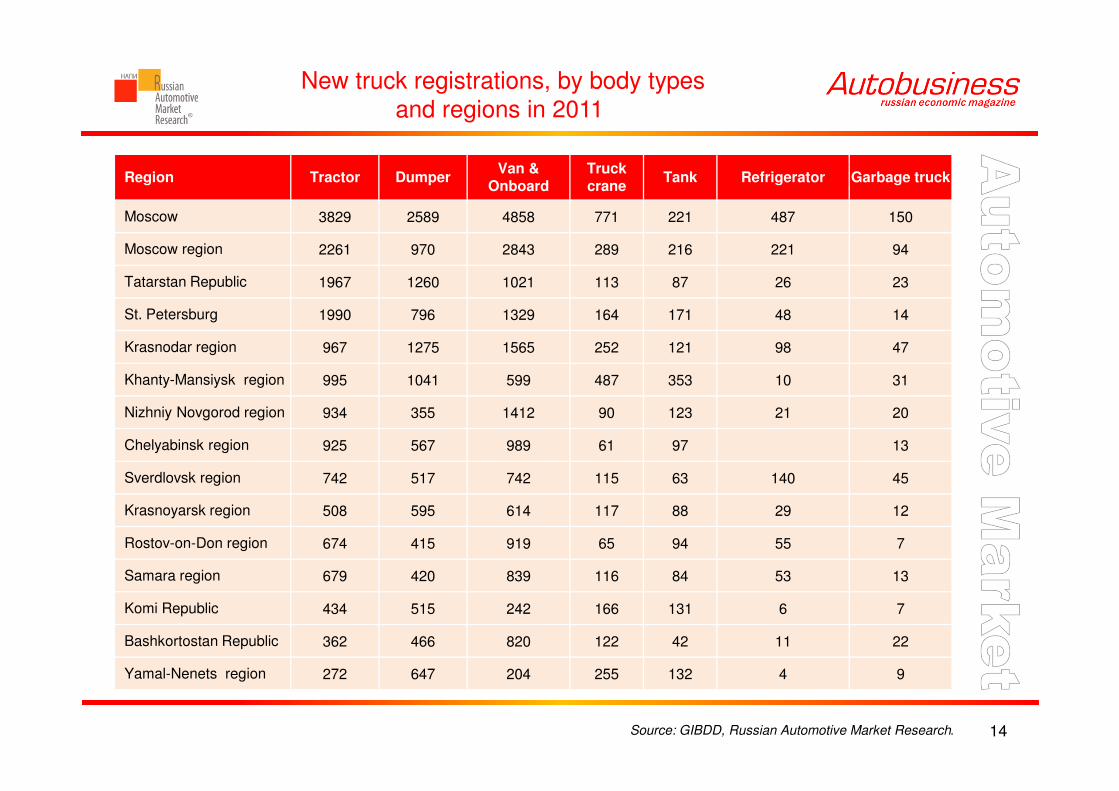
New truck registrations, by body types
and regions in 2011
14
Region Tractor DumperVan &
Onboard Truck crane
Tank Refrigerator Garbage truck
Moscow 3829 2589 4858 771 221 487 150
Moscow region 2261 970 2843 289 216 221 94
Tatarstan Republic 1967 1260 1021 113 87 26 23
St. Petersburg 1990 796 1329 164 171 48 14
Krasnodar region 967 1275 1565 252 121 98 47
Khanty-Mansiysk region 995 1041 599 487 353 10 31
Nizhniy Novgorod region 934 355 1412 90 123 21 20
Chelyabinsk region 925 567 989 61 97 13
Sverdlovsk region 742 517 742 115 63 140 45
Krasnoyarsk region 508 595 614 117 88 29 12
Rostov-on-Don region 674 415 919 65 94 55 7
Samara region 679 420 839 116 84 53 13
Komi Republic 434 515 242 166 131 6 7
Bashkortostan Republic 362 466 820 122 42 11 22
Yamal-Nenets region 272 647 204 255 132 4 9
Source: GIBDD, Russian Automotive Market Research.

New and used truck registrations, by month,
in 2011, unit
15
0
5000
10000
15000
20000
25000
30000
35000
01 02 03 04 05 06 07 08 09 10 11 12
New Used
Source: GIBDD, Russian Automotive Market Research.

New Russian truck registrations, by regions in 2011
16
Russian KAMAZ
Region Quantity Share, %
Tatarstan Republic 3364 11,21%
Moscow 2398 7,99%
Khanty-Mansiysk region 1990 6,63%
Krasnodar region 1467 4,89%
Moscow region 1205 4,02%
Krasnoyarsk region 892 2,97%
St. Petersburg 867 2,89%
Kemerovo region 840 2,80%
Samara region 714 2,38%
Bashkortostan Republic 703 2,34%
Top 10 14440 48,12%
Other 15567 51,88%
Total 30007 100,00%
Source: GIBDD, Russian Automotive Market Research.

New CIS truck registrations, by regions in 2011
17
Russian GAZ
Region Quantity Share, %
Nizhniy Novgorod region 656 5,87%
Moscow 646 5,78%
Moscow region 572 5,12%
Krasnodar region 425 3,80%
Tatarstan Republic 424 3,79%
Sankt-Petersburg 335 3,00%
Samara region 315 2,82%
Bashkortostan Republic 294 2,63%
Rostov-on-Don region 265 2,37%
Chelyabinsk region 253 2,26%
Top 10 4185 37,44%
Other 6993 62,56%
Total 11178 100,00%
Source: GIBDD, Russian Automotive Market Research.

New Russian truck registrations, by regions in 2011
18
Russian URAL
Region Quantity Share, %
Moscow 1193 18,61%
Komi Republic 766 11,95%
Yamal-Nenets region 586 9,14%
Khanty-Mansiysk region 511 7,97%
Bashkortostan Republic 231 3,60%
Moscow region 208 3,24%
Tyumen region 191 2,98%
Khabarovskyi region 162 2,53%
Primorskyi region 161 2,51%
Sakha Republic 158 2,46%
Top 10 4167 65,01%
Other 2243 34,99%
Total 6410 100,00%
Source: GIBDD, Russian Automotive Market Research.
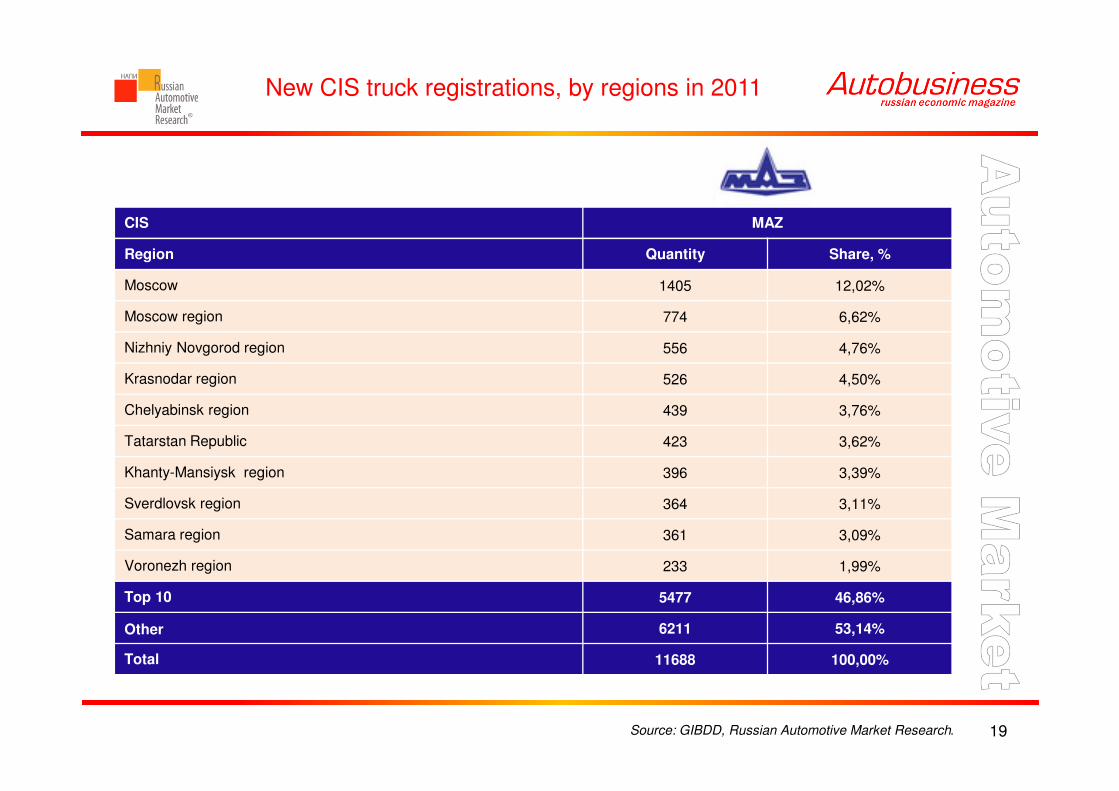
New CIS truck registrations, by regions in 2011
19
CIS MAZ
Region Quantity Share, %
Moscow 1405 12,02%
Moscow region 774 6,62%
Nizhniy Novgorod region 556 4,76%
Krasnodar region 526 4,50%
Chelyabinsk region 439 3,76%
Tatarstan Republic 423 3,62%
Khanty-Mansiysk region 396 3,39%
Sverdlovsk region 364 3,11%
Samara region 361 3,09%
Voronezh region 233 1,99%
Top 10 5477 46,86%
Other 6211 53,14%
Total 11688 100,00%
Source: GIBDD, Russian Automotive Market Research.
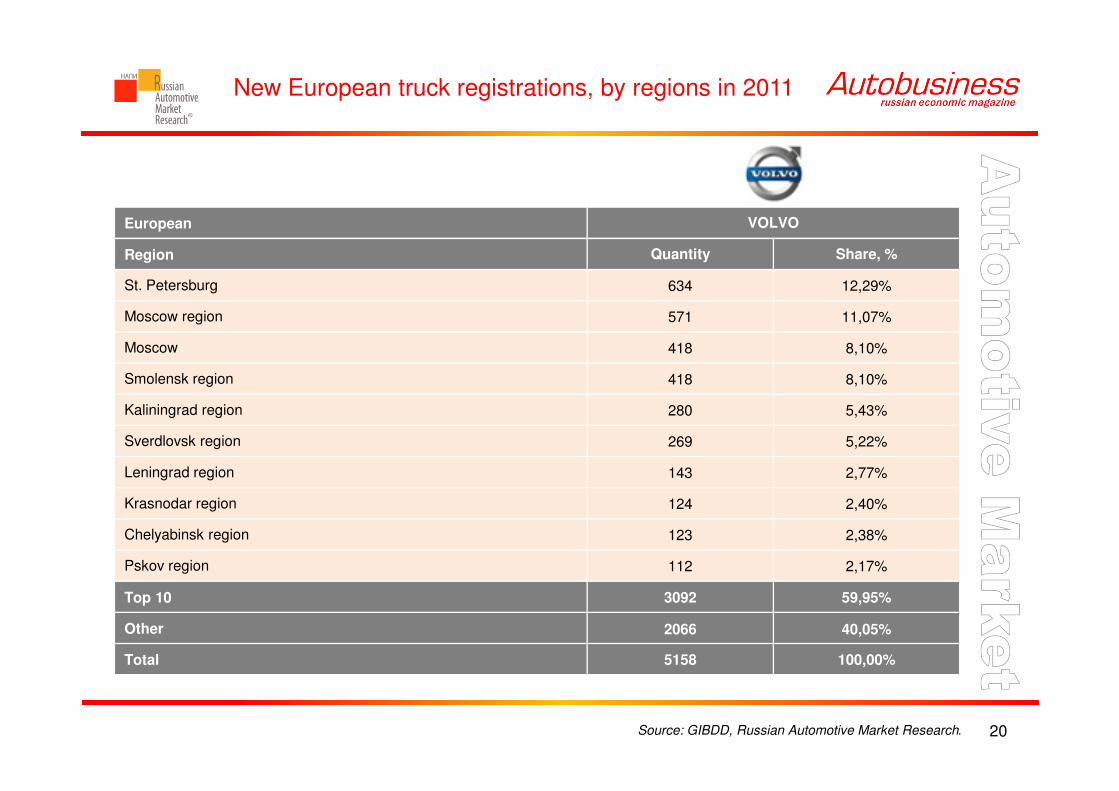
New European truck registrations, by regions in 2011
20
European VOLVO
Region Quantity Share, %
St. Petersburg 634 12,29%
Moscow region 571 11,07%
Moscow 418 8,10%
Smolensk region 418 8,10%
Kaliningrad region 280 5,43%
Sverdlovsk region 269 5,22%
Leningrad region 143 2,77%
Krasnodar region 124 2,40%
Chelyabinsk region 123 2,38%
Pskov region 112 2,17%
Top 10 3092 59,95%
Other 2066 40,05%
Total 5158 100,00%
Source: GIBDD, Russian Automotive Market Research.

New European truck registrations, by regions in 2011
21
European RENAULT
Region Quantity Share, %
Moscow 263 19,83%
Moscow region 106 7,99%
St. Petersburg 106 7,99%
Krasnodar region 77 5,81%
Samara region 66 4,98%
Saratov region 54 4,07%
Belgorod region 48 3,62%
Smolensk region 38 2,87%
Chelyabinsk region 35 2,64%
Ryazan region 35 2,64%
Top 10 828 62,44%
Other 498 37,56%
Total 1326 100,00%
Source: GIBDD, Russian Automotive Market Research.

New European truck registrations, by regions in 2011
22
European MAN
Region Quantity Share, %
Moscow 1623 24,33%
Ivanovo region 1275 19,11%
Moscow region 471 7,06%
St. Petersburg 353 5,29%
Krasnodar region 316 4,74%
Khanty-Mansiysk region 184 2,76%
Sverdlovsk region 146 2,19%
Stavropol region 138 2,07%
Voronezh region 131 1,96%
Rostov-on-Don region 124 1,86%
Top 10 4761 71,37%
Other 1910 28,63%
Total 6671 100,00%
Source: GIBDD, Russian Automotive Market Research.
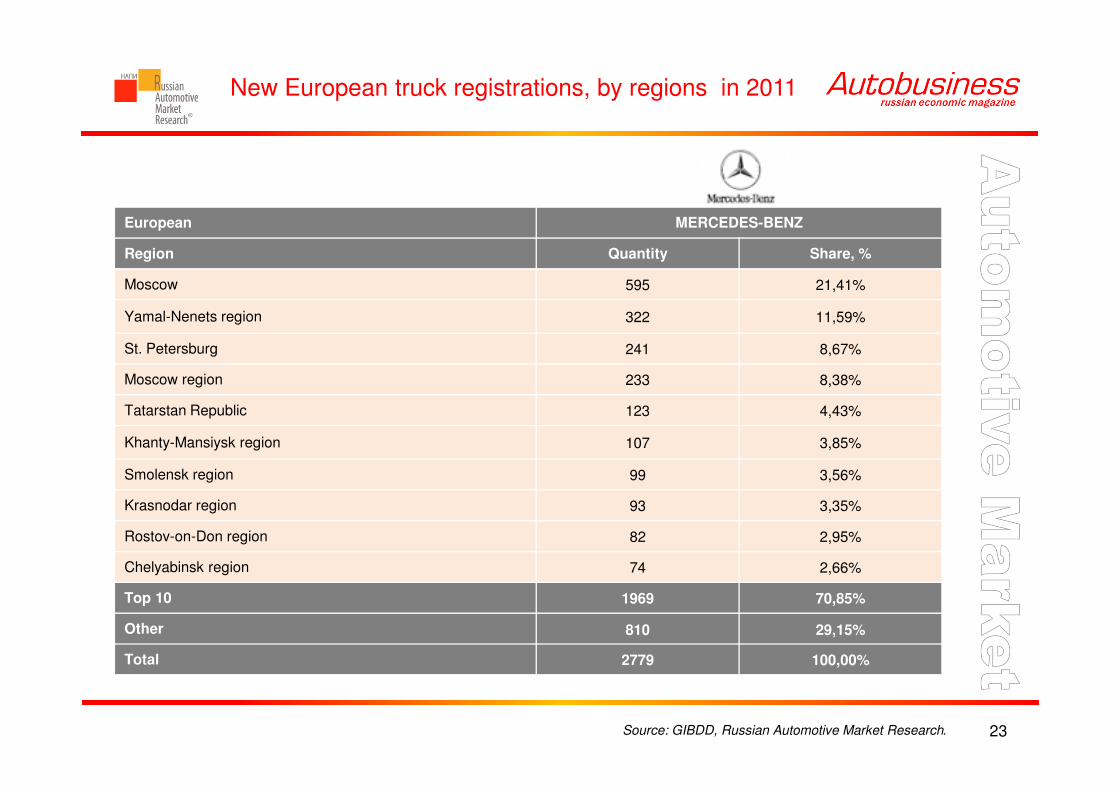
New European truck registrations, by regions in 2011
23
European MERCEDES-BENZ
Region Quantity Share, %
Moscow 595 21,41%
Yamal-Nenets region 322 11,59%
St. Petersburg 241 8,67%
Moscow region 233 8,38%
Tatarstan Republic 123 4,43%
Khanty-Mansiysk region 107 3,85%
Smolensk region 99 3,56%
Krasnodar region 93 3,35%
Rostov-on-Don region 82 2,95%
Chelyabinsk region 74 2,66%
Top 10 1969 70,85%
Other 810 29,15%
Total 2779 100,00%
Source: GIBDD, Russian Automotive Market Research.

New European truck registrations, by regions in 2011
24
European DAF
Region Quantity Share, %
Moscow 166 10,09%
Moscow region 116 7,05%
Bryansk region 112 6,80%
Krasnodar region 103 6,26%
St. Petersburg 100 6,08%
Rostov-on-Don region 89 5,41%
Samara region 74 4,50%
Smolensk region 68 4,13%
Kaliningrad region 63 3,83%
Chelyabinsk region 56 3,40%
Top 10 947 57,53%
Other 699 42,47%
Total 1646 100,00%
Source: GIBDD, Russian Automotive Market Research.

New European truck registrations, by regions in 2011
25
European SCANIA
Region Quantity Share, %
Moscow 1036 16,39%
Moscow region 755 11,95%
St. Petersburg 734 11,62%
Tatarstan Republic 619 9,80%
Nizhniy Novgorod region 318 5,03%
Chelyabinsk region 193 3,05%
Novosibirsk region 148 2,34%
Orenburg region 141 2,23%
Krasnoyarsk region 128 2,03%
Krasnodar region 121 1,91%
Top 10 3157 49,96%
Other 2126 33,64%
Total 6319 100,00%
Source: GIBDD, Russian Automotive Market Research.
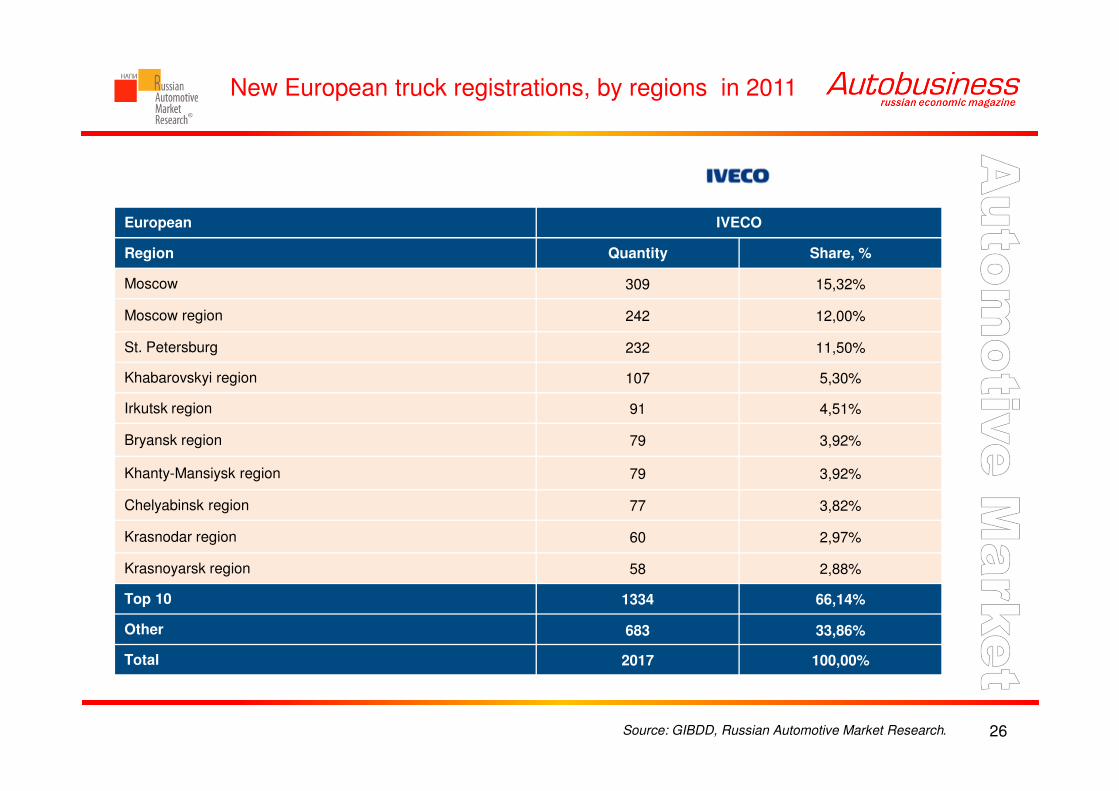
New European truck registrations, by regions in 2011
26
European IVECO
Region Quantity Share, %
Moscow 309 15,32%
Moscow region 242 12,00%
St. Petersburg 232 11,50%
Khabarovskyi region 107 5,30%
Irkutsk region 91 4,51%
Bryansk region 79 3,92%
Khanty-Mansiysk region 79 3,92%
Chelyabinsk region 77 3,82%
Krasnodar region 60 2,97%
Krasnoyarsk region 58 2,88%
Top 10 1334 66,14%
Other 683 33,86%
Total 2017 100,00%
Source: GIBDD, Russian Automotive Market Research.

New Japanese truck registrations, by regions in 2011
27
Japanese HINO
Region Quantity Share, %
Moscow 104 10,11%
Primorskyi region 79 7,68%
Chelyabinsk region 69 6,71%
Khabarovskyi region 44 4,28%
Nizhniy Novgorod region 44 4,28%
St. Petersburg 44 4,28%
Novosibirsk region 41 3,98%
Moscow region 39 3,79%
Krasnoyarsk region 37 3,60%
Tatarstan Republic 36 3,50%
Top 10 537 52,19%
Other 492 47,81%
Total 1029 100,00%
Source: GIBDD, Russian Automotive Market Research.

New Japanese truck registrations, by regions in 2011
28
Japanese ISUZU
Region Quantity Share, %
Moscow 207 12,81%
Moscow region 126 7,80%
Irkutsk region 92 5,69%
Chelyabinsk region 76 4,70%
Krasnodar region 70 4,33%
St. Petersburg 62 3,84%
Tatarstan Republic 62 3,84%
Kemerovo region 59 3,65%
Stavropol region 58 3,59%
Sverdlovsk region 51 3,16%
Top 10 863 53,40%
Other 753 46,60%
Total 1616 100,00%
Source: GIBDD, Russian Automotive Market Research.

New Korean truck registrations, by regions in 2011
29
Korean HYUNDAI
Region Quantity Share, %
Moscow 1590 23,16%
Moscow region 757 11,03%
St. Petersburg 338 4,92%
Krasnodar region 334 4,87%
Rostov-on-Don region 282 4,11%
Chelyabinsk region 208 3,03%
Sverdlovsk region 199 2,90%
Krasnoyarsk region 170 2,48%
Nizhniy Novgorod region 167 2,43%
Irkutsk region 136 1,98%
Top 10 4181 60,90%
Other 2684 39,10%
Total 6865 100,00%
Source: GIBDD, Russian Automotive Market Research.

New Chinees truck registrations, by regions in 2011
30
Chines
Region Quantity Share, %
Moscow 485 9,81%
Moscow region 300 6,07%
Amur region 274 5,54%
Sverdlovsk region 238 4,81%
Krasnodar region 230 4,65%
Chelyabinsk region 216 4,37%
Khabarovskyi region 196 3,96%
Irkutsk region 184 3,72%
Khanty-Mansiysk region 163 3,30%
Zabaikalskyi region 135 2,73%
Sakha Republic 113 2,28%
Top 10 2534 51,23%
Other 2412 48,77%
Grand Total 4946 100,00%
Source: GIBDD, Russian Automotive Market Research.

31
www.napinfo.ru
www.abiz.ru
E-mail: [email protected]
Телефон: +7 (831) 439 21 82
Факс: +7 (831) 434 53 94