russian nuclear submarine accidents survey
DESCRIPTION
TRANSCRIPT
1
Russian Nuclear Submarine
Accidents Survey
Ole Reistad
Norwegian Radiation Protection Authority

Russian Nuclear Submarine
Accidents Survey
Ole Reistad
Norwegian Radiation Protection Authority
3
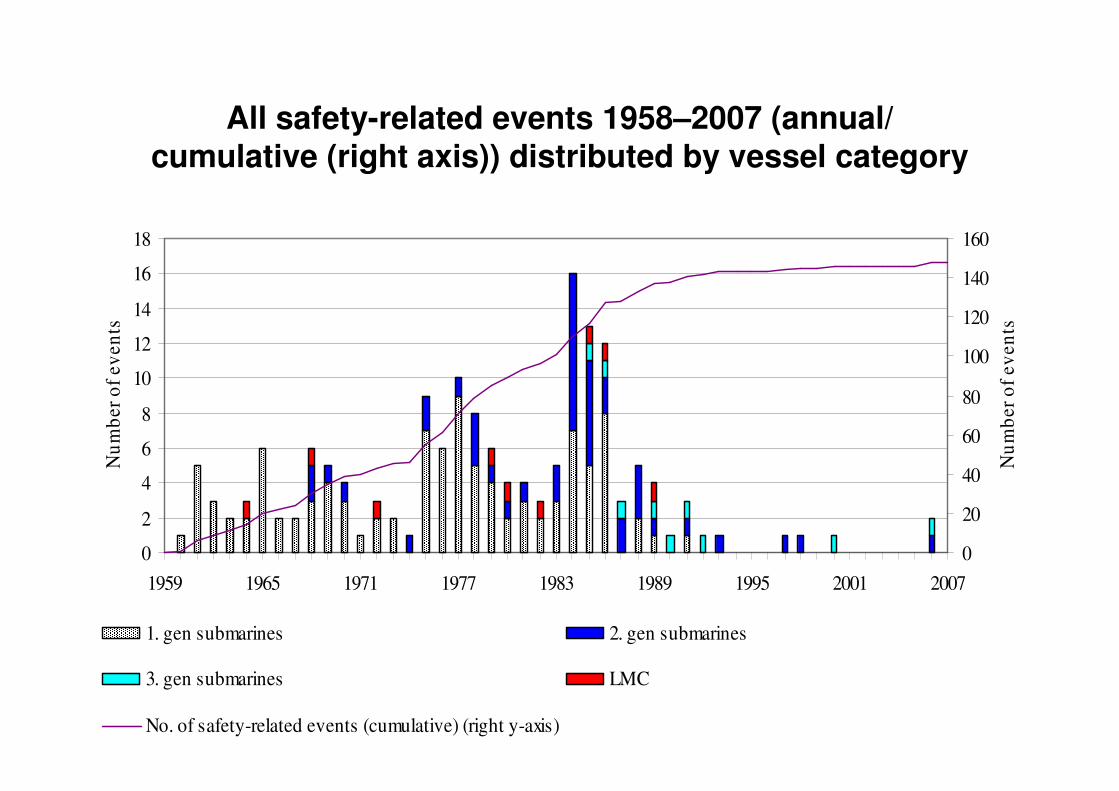
All safety-related events 1958–2007 (annual/ cumulative (right axis)) distributed by vessel category
0
2
4
6
8
10
12
14
16
18
1959 1965 1971 1977 1983 1989 1995 2001 2007
Nu
mb
er
of
ev
en
ts
0
20
40
60
80
100
120
140
160
Nu
mb
er
of
ev
en
ts
1. gen submarines 2. gen submarines
3. gen submarines LMC
No. of safety-related events (cumulative) (right y-axis)

4
All safety-related events 1958–2007 distributed by safety significance (1–7) (left axis) and events with release
of radioactivity (cumulative) (right axis)
0
2
4
6
8
10
12
14
16
18
1959 1965 1971 1977 1983 1989 1995 2001 2007
Year
Nu
mb
er
of
ev
en
ts
0
5
10
15
20
25
30
Nu
mb
er
of
ev
en
ts
0 1 2 3 4 5 7 Events with release of radioactivity (accumulated)

5
Annual (left) and cumulative (right) vessel-operating-year (VOY) for Russian nuclear submarines
0
50
100
150
200
1959
1965
1971
1977
1983
1989
1995
2001
2007
Year
In-s
ervic
e yea
rs (
annual
)
3. gen (VOY) 2. gen (VOY)
1. gen (VOY) LMC (VOY)
0
1000
2000
3000
4000
5000
6000
1 6 11 16 21 26 31 36 41 46
Year
Op
era
tio
nal
years
(cu
mu
lati
ve)
All classes (total VOY) 2. gen (VOY)
1. gen (VOY) 3. gen (VOY)
LMC (VOY)

6
Vessel operating days (left) and distance (right) for first-generation vessels
0
2
4
6
8
10
12
0-100
200-3
00500
-600
700-8
00900
-1000
1100-
1200
1300-
1400
1500-
1600
1700-
1800
1900-
2000
Vessel operating days
Nu
mb
er
of
ve
sse
ls
0
2
4
6
8
10
12
0-100
00
30000
-400
00
60000
-700
00
90000
-100
000
12000
0-13
0000
15000
0-16
0000
18000
0-19
0000
21000
0-22
0000
24000
0-25
0000
27000
0-28
0000
31000
0-32
0000
34000
0-35
0000
37000
0-38
0000
Vessel distance traversed (miles)N
um
be
r o
f v
ess
els

7
Safety-related event rate (annual) - annual number of events/ annual vessel operating years (all vessel
classes)
0.0
0.1
0.2
0.3
0.4
0.5
0.6
1959 1979 1999
Year
Safe
ty-r
elate
d e
ven
t
rate
(ev
ents
(an
nu
al)
/
VO
Y (
an
nu
al)
)
1. generation vessels 2. generation vessel
0.0
0.1
0.2
0.3
0.4
0.5
0.6
1959 1979 1999
Year
3. generation vessels LMC vessels

8
Mean-time between safety-related events, 1959–2007 (left) and 1959–1984 (right) with confidence interval
1
10
100
1000
100 1000 10000
VOY (years)
MT
BF
(in
-serv
ice y
ears
)
1
10
100
1000
100 1000 10000
VOY (years)
MT
BF
(in
-serv
ice y
ears
)
9
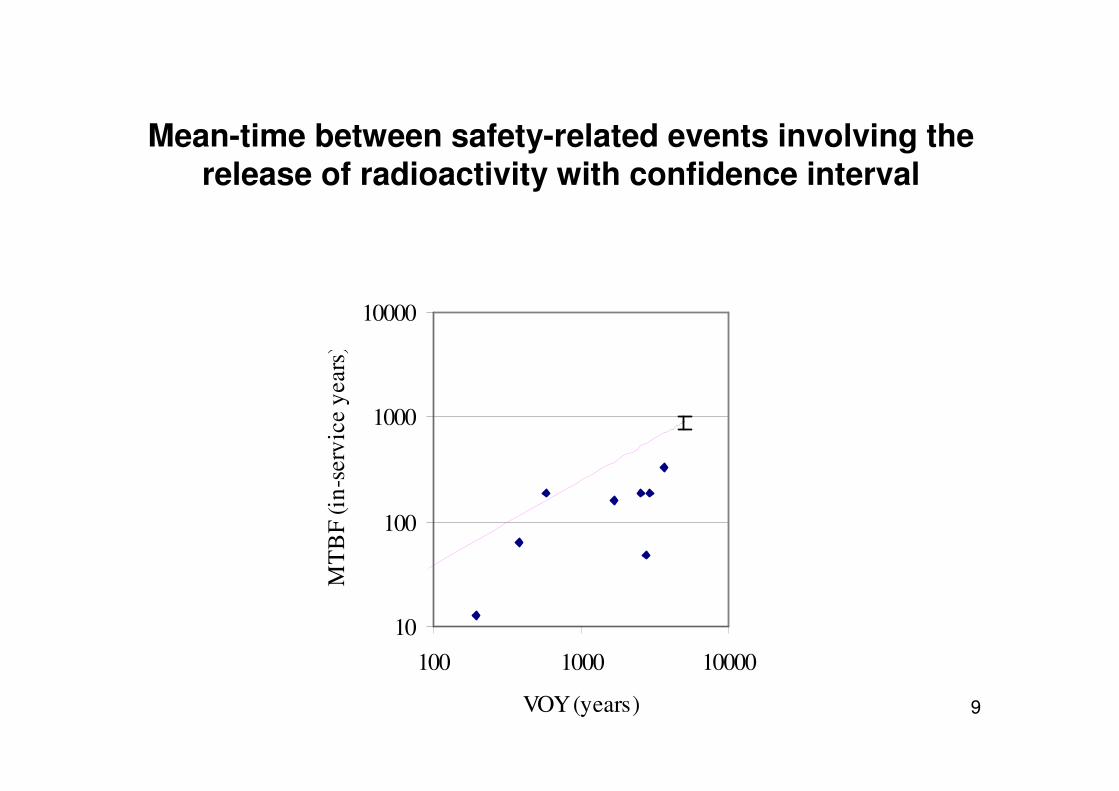
Mean-time between safety-related events involving the release of radioactivity with confidence interval
10
100
1000
10000
100 1000 10000
VOY (years)
MT
BF
(in
-serv
ice y
ears
)