russian arctic warming and ‘greening’ are closely … arctic warming and ‘greening’ are...
TRANSCRIPT
Russian Arctic warming and lsquogreeningrsquo are closely trackedby tundra shrub willows
B R U C E C F O R B E S 1 M A R C M A C I A S F A U R I A w z1 and P E N T T I Z E T T E R B E R G sect
Arctic Centre University of Lapland FI-96101 Rovaniemi Finland wBiogeoscience Institute University of Calgary Calgary
Alberta Canada T2N 1N4 zDepartment of Ecology University of Barcelona Barcelona Catalonia 08028 Spain sectEcological
Research Institute University of Joensuu FI-80101 Joensuu Finland
Abstract
Growth in arctic vegetation is generally expected to increase under a warming climateparticularly among deciduous shrubs We analyzed annual ring growth for an abundantand nearly circumpolar erect willow (Salix lanata L) from the coastal zone of the northwestRussian Arctic (Nenets Autonomous Okrug) The resulting chronology is strongly related tosummer temperature for the period 1942ndash2005 Remarkably high correlations occur at longdistances (41600 km) across the tundra and taiga zones of West Siberia and Eastern EuropeWe also found a clear relationship with photosynthetic activity for upland vegetation at aregional scale for the period 1981ndash2005 confirming a parallel lsquogreeningrsquo trend reported forsimilarly warming North American portions of the tundra biome The standardized growthcurve suggests a significant increase in shrub willow growth over the last six decades Thesefindings are in line with field and remote sensing studies that have assigned a strong shrubcomponent to the reported greening signal since the early 1980s Furthermore the growthtrend agrees with qualitative observations by nomadic Nenets reindeer herders of recentincreases in willow size in the region The quality of the chronology as a climate proxy isexceptional Given its wide geographic distribution and the ready preservation of wood inpermafrost S lanata L has great potential for extended temperature reconstructions in remoteareas across the Arctic
Keywords climate change dendrochronology NDVI remote sensing Salix lanata trend analysis
Received 22 May 2009 and accepted 2 July 2009
Introduction
The general consensus is that growth in arctic vegeta-
tion is expected to increase under a warming climate
(ACIA 2005 IPCC 2007) Remote sensing data reveal
that tundra vegetation in North America may be re-
sponding to the recent warming via enhanced photo-
synthetic activity (Goetz et al 2005 Verbyla 2008) At a
circumpolar scale the highest photosynthetic activity
and strongest growth trends are reported in locations
characterized by erect shrub tundra (Raynolds et al
2006) Live leaf phytomass from deciduous shrubs
shown to have increased in northern Alaska during
the second half of the last century (Sturm et al 2001
Tape et al 2006) is believed to be a key driver of the
observed trends (Jia et al 2003 Goetz et al 2005
Verbyla 2008) In the Eurasian Arctic ground-level
quantification of deciduous shrub growth is missing
Retrospective analyses that could quantify the relation-
ship between summer warmth and deciduous shrub
growth would help to fill a critical gap in our under-
standing of the lsquogreeningrsquo already underway
The resolution of proxy climate records varies con-
siderably but few natural archives offer annually re-
solved records of past arctic climates (Zalatan amp
Gajewski 2006) Ice cores and lake varve sequences
can provide annual or even seasonal records of past
climatic conditions but can be subject to error from
missing years and replication which would help re-
duce the error associated with dating is typically not
possible Relatively few studies to date have exploited
arctic woody species for dendroclimatology These have
either (1) used evergreen shrubs (2) found precipitation
or snow regime growth responses andor (3) not
produced complete chronologies (Walker 1987 Wood-
cock amp Bradley 1994 Johnstone amp Henry 1997 Rayback
amp Henry 2006 Schmidt et al 2006 Zalatan amp Gajewski
2006 Bar et al 2007 Nikolaev amp Samsonova 2007
Forchhammer et al 2008) or (4) produced floating
chronologies for archaeological dating (Shiyatov amp
Correspondence Bruce C Forbes tel 1 358 40 847 9202 fax 1 358
16 341 2777 e-mail bforbesulaplandfi
1Contributed equally to this work
Global Change Biology (2010) 16 1542ndash1554 doi 101111j1365-2486200902047x
1542 r 2009 Blackwell Publishing Ltd
Hantemirov 2000) ie the time periods represented
were not continuous up until the present Yet until
now no studies have managed to produce a response
function relating deciduous tundra shrub growth to
temperature despite mounting evidence in the last
few years for a link between summer warmth and
increasing live leaf phytomass in portions of the tundra
biome (lsquogreeningrsquo of the Arctic Jia et al 2003 Goetz
et al 2005 Raynolds et al 2008 Verbyla 2008)
Salix lanata L (sensu latu) is an abundant deciduous
dioecious willow with nearly circumpolar geographic
distribution from the northern boreal forest (forest-
tundra transition zone) to the northern limits of the
Low Arctic (dwarf and prostrate shrub zone) except in
Greenland where it is absent (Hulten amp Fries 1986)
Other than at its northern range limits the plant is
typically erect attaining a height of 1ndash3 m under favor-
able conditions with adequate snow cover (Jonsell
2000 Tolmachev 2000) but it also grows horizontally
in response to chronic snow loading and readily roots
adventitiously when stems come into contact with the
ground Several authors have commented on the diffi-
culties involved with reliably cross-dating arctic wil-
lows (Beschel amp Webb 1963 Woodcock amp Bradley
1994) but this species does produce well-defined
growth rings Moreover preserved dead Salix material
from at least two tundra species (S arctica Pall and
S dasyclados Wimm) has been previously cross-dated
suggesting the potential for extending chronologies
from living material (Woodcock amp Bradley 1994 Shiya-
tov amp Hantemirov 2000)
The aims of the present study are to (i) develop a ring
width chronology using S lanata from the East Euro-
pean Arctic (ii) investigate the growthndashclimate relation-
ship and thus the potential for proxy climate recon-
struction of this abundant and geographically
widespread species and (iii) explore possible evidence
for a tundra shrub growth trend to match an ostensible
arctic lsquogreeningrsquo detected by the Normalized Difference
Vegetation Index (NDVI Jia et al 2003 Goetz et al
2005 Raynolds et al 2006 Verbyla 2008)
Study area
The study area lies in the Nenets Autonomous Okrug
(Fig 1) about 20 km southeast of the coastal port of
Varandei between the lakes Big Toravei and Small
Toravei (6814000N 5813000E) This is a region of low arctic
tundra (Walker et al 2005) with uplands characterized
by dwarf shrub heath Sphagnum-sedge mires in the
lowlands and dense copses of Salix spp 50ndash250 cm tall
in moist to saturated riparian habitats and along lake
margins with rolling moderate slopes A supervised
classification based on very high-resolution Quickbird-2
satellite imagery determined the local ground cover of
erect Salix copse to be 20 (Fig 2) The study area is
12 3
45
6
78
910
11
12 13
14
15
0
RU
RL
R
S
UralMountains
YamalPeninsula
West
Siberian
Basin
North
Eastern
Europe
Kara Sea Barents Sea
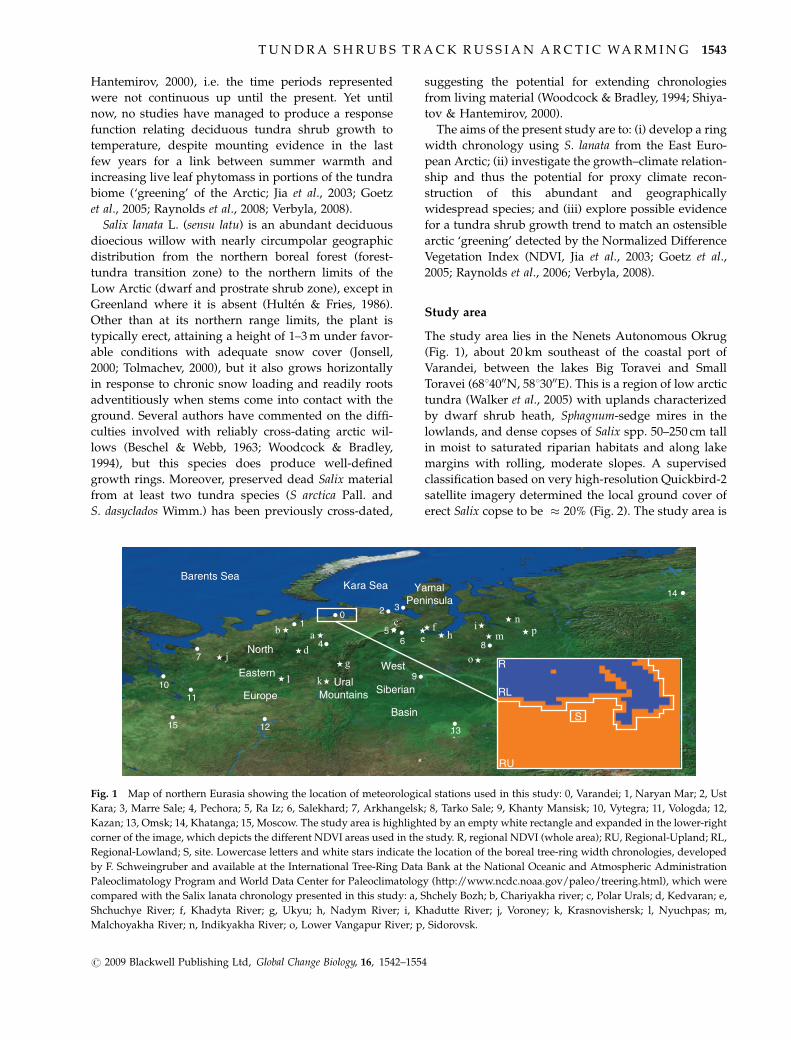
Fig 1 Map of northern Eurasia showing the location of meteorological stations used in this study 0 Varandei 1 Naryan Mar 2 Ust
Kara 3 Marre Sale 4 Pechora 5 Ra Iz 6 Salekhard 7 Arkhangelsk 8 Tarko Sale 9 Khanty Mansisk 10 Vytegra 11 Vologda 12
Kazan 13 Omsk 14 Khatanga 15 Moscow The study area is highlighted by an empty white rectangle and expanded in the lower-right
corner of the image which depicts the different NDVI areas used in the study R regional NDVI (whole area) RU Regional-Upland RL
Regional-Lowland S site Lowercase letters and white stars indicate the location of the boreal tree-ring width chronologies developed
by F Schweingruber and available at the International Tree-Ring Data Bank at the National Oceanic and Atmospheric Administration
Paleoclimatology Program and World Data Center for Paleoclimatology (httpwwwncdcnoaagovpaleotreeringhtml) which were
compared with the Salix lanata chronology presented in this study a Shchely Bozh b Chariyakha river c Polar Urals d Kedvaran e
Shchuchye River f Khadyta River g Ukyu h Nadym River i Khadutte River j Voroney k Krasnovishersk l Nyuchpas m
Malchoyakha River n Indikyakha River o Lower Vangapur River p Sidorovsk
T U N D R A S H R U B S T R A C K R U S S I A N A R C T I C WA R M I N G 1543
r 2009 Blackwell Publishing Ltd Global Change Biology 16 1542ndash1554
situated within subzone D of the Circumpolar Arctic
Vegetation Map (CAVM Walker et al 2005) The
boundary between subzones C and D separates drier
northern tundra on mineral soils from southern rela-
tively moist tundra with moss carpets This is approxi-
mately equivalent to the boundary between the high
and low arctic (Bliss 1997) Subzone D is characterized
by erect shrubs (440 cm tall) in protected locations
such as riparian habitats and at the foot of steep slopes
particularly along lakeshores Substrates are classified
as peaty tundra gley soils with high organic content
(Ponomarev et al 2004) During 1995ndash2005 mean sum-
mer (JunendashAugust) temperature at Varandei the nearest
weather station was 75 1C and snow cover depths
between December and April averaged 68 cm This
region has experienced an estimated warming trend
of 1ndash2 1C for the month of July during the main study
period 1942ndash2005 (NASA-GISS 2009) Winter tempera-
tures (DecemberndashFebruary) for the same period do not
reveal a warming trend although from 1981 to 2005
temperature has increased from 02 to 05 1C (NASA-
GISS 2009) This study will focus on the growing
season (JunendashAugust) in order to address the aforemen-
tioned literature gap concerning the relationship be-
tween summer warmth and deciduous phytomass at
the regional scale
Materials and methods
Field methods
168 slices 2ndash3-cm-thick were collected from 40 discrete
individuals spread across 15 sample sites over an area
of approximately 3 25 km in the summer of 2006
These represent lsquouplandrsquo tundra that is relatively low-
lying ( 25 m asl) but still topographically distinct
from the adjoining mire-dominated coastal lowland
that is generally 100 cm asl (Fig 2) A minimum
of four slices between the root collar and the upper
canopy was taken from each individual in order to
properly account for reaction wood which forms in
response to mechanical stress eg wind exposure snow
loading soil movement and can result in asymmetric
stem growth In the few cases of obtaining two or more
samples from among dense polycormic clonal copses
care was taken to differentiate between distinct genets
Whenever possible neighboring female (7) and male
(24) plants were used in order to test for potential
variations in stem growth resulting from differential
allocation to reproductive effort or stem production
Olofsson et al (2009) have recently argued that her-
bivory must be considered in order to understand how
a changing climate may or may not affect shrub
Fig 2 Supervised land classification of the sampling area on a very high resolution Quickbird-2 image taken on 5 August 2005 The
percentages of land cover for each class are shown Note the sharp change between the upland (U) and lowland (L) at the northern edge
of the image the lowlands having a much greater proportion of peatland
1544 B C F O R B E S et al
r 2009 Blackwell Publishing Ltd Global Change Biology 16 1542ndash1554
abundance The leaves and twigs of S lanata constitute
important forage for several herbivores including rein-
deer (Rangifer tarandus L Podkorytov 1995) In smaller
erect individuals and related prostrate taxa such as
S arctica Pall herbivory could be a source of dendro-
chronological error within years (Schmidt et al 2006)
and early- and mid-season browsing and trampling are
demonstrated to significantly reduce Salix biomass in
shrubs 80 cm in height (Kitti et al 2009) In the study
area which comprises designated pasture territory
used by nomadic Nenets herders Salix spp are poten-
tially grazed in late summer up to a level of 18 m
We found no evidence of browsing in the field and only
erect individuals with heights ranging 2ndash25 m were
sampled
Climate and remote sensing data
Continuous climate records in the arctic tundra tend to
be relatively short-term and spatially restricted to coast-
al areas where most meteorological stations are located
particularly in North America (Zalatan amp Gajewski
2006) In the East European North (Fig 1) data sources
north of treeline are patchy spatially and temporally
and the distances between stations can be great At
nearby Varandei continuous climate records extend
back only to the 1990s Mean monthly temperature data
from 12 stations in Northern Russia 225 to 1725 km
from the study site and covering the period 1942ndash2004
were obtained from the National Climatic Data Cen-
ter (NCDC httpwwwncdcnoaagovoancdchtml)
Monthly precipitation and temperature data from five
nearby (ie distances o400 km) Russian Arctic stations
for 1961ndash2000 were available at the National Snow and
Ice Data Center (NSIDC) at Boulder Colorado Further
we used mean monthly surface temperature data from a
251 latitude per 251 longitude regional grid covering
the period 1948ndash2005 from the NCEP Reanalysis data-
base provided by the NOAA-CIRES Climate Diagnos-
tics Centre Boulder Colorado (httpwwwcdcnoaa
gov)
NDVI data are derived from the National Oceanic
and Atmospheric Administration (NOAA) Advanced
Very High Resolution Radiometer (AVHRR) meteorolo-
gical satellites and serve as a strong proxy for gross
photosynthesis They are therefore useful for estimating
levels of total live aboveground phytomass and leaf
area index (LAI) in tundra vegetation (Goetz et al 2005
Riedel et al 2005 Raynolds et al 2006) We obtained
biweekly NDVI records from the Global Inventory
Modeling and Mapping Studies (GIMMS) dataset
available through the Global Land Cover Facility
(httpglcfumiacsumdedudatagimms) The data-
set (Tucker et al 2005) has been corrected for calibra-
tion view geometry volcanic aerosols and other effects
not related to vegetation change and covers the period
1981ndash2005 at 8 km resolution We computed regional
averages of NDVI for four areas which varied in exten-
sion and in physiographic characteristics (Fig 1) (i) Site
comprised of a small area in the immediate vicinity of
the sampling site (4 pixels 256 km2) (ii) Regional a broad
area around the site (648 pixels 41472 km2) (iii) Regional-
Upland as (ii) but excluding coastal pixels and thus with
a smaller fraction of mires peatlands and water bodies
and a higher fraction of well-drained land (576 pixels
36864 km2) and (iv) Regional-Lowland as (ii) but includ-
ing only coastal pixels which showed consistent lower
NDVI values due a combination of cooler temperatures
(immediate proximity to the Barents Sea) and higher
fraction of water bodies (72 pixels 4608 km2)
Data analysis
Wood samples were sanded and measured with a
precision of 001 mm Cross-dating of the ring width
measurement series was performed following standard
dendrochronological procedures (Fritts 1976) Indivi-
dual ring width measurements showed a characteristic
age-related trend with early suppressed growth fol-
lowed by a relatively sharp growth increase (Support-
ing information Fig S1) Such a growth pattern was
interpreted as the time the individual shrub takes to
reach the lsquocanopyrsquo of the respective thicket from which
it was sampled Ring width measurements were initi-
ally detrended using a 32-year smoothing spline (Cook
amp Peters 1981) The Expressed Population Signal (EPS)
which is a function of series replication and mean inter-
series correlation was used to define the reliable part of
the chronology (EPS 85 Wigley et al 1984) Other
descriptive statistics were calculated for each chronol-
ogy to permit comparisons with other dendrochronolo-
gical data sets (Fritts 1976)
Dendrochronology in northern Russia has been re-
stricted to the boreal forest and forest-tundra zones
with research focused on the conifers Larix sibirica Ldb
L gmelini Pilger L cajanderi Mayr Picea obovata Ldb and
Pinus sylvestris L (eg Shiyatov et al 1996) That is the
resulting S lanata chronology cannot be compared with
any other Russian tundra shrub chronology In order to
test its agreement with other ring width chronologies in
the region a network of existing 16 tree-ring width
chronologies from various species in the northern bor-
eal forest located south of our study site and developed
by F Schweingruber (Fig 1 Table 1) was correlated
against the S lanata chronology Measurement data for
each chronology was obtained from the International
Tree-Ring Data Bank at the National Oceanic and Atmo-
spheric Administration Paleoclimatology Program and
T U N D R A S H R U B S T R A C K R U S S I A N A R C T I C WA R M I N G 1545
r 2009 Blackwell Publishing Ltd Global Change Biology 16 1542ndash1554
World Data Center for Paleoclimatology (http
wwwncdcnoaagovpaleotreeringhtml) Individual
measurement series were standardized by negative
exponential functions or nonascending straight lines
to remove the age-related growth trend a common
procedure in northern boreal forest stands (eg Macias
et al 2004)
Response functions between the ring width residual
chronology and monthly climate data (temperature and
precipitation) for the five closest climate stations (dis-
tance to the site 400 km) were performed using the
program DendroClim2002 (Biondi amp Waikul 2004) for
the period 1961ndash2000 for which we had full climatic
data Response function coefficients are multivariate
estimates from a principal component regression model
calculated to avoid colinearity between predictors com-
monly found in multivariable sets of meteorological
data Significance and stability of coefficients were
assessed by 1000 bootstrap estimates obtained by ran-
dom extraction with replacement from the initial data
set Climatendashgrowth relationships were analyzed from
the previous September to August of the growth year
Correlations between climate and the boreal forest tree-
ring width chronologies were computed in order to put
the climate signal of our S lanata chronology in context
Finally relationships between shrub growth and NDVI
data measurements were assessed by linear Pearsonrsquos
correlation coefficients
Owing to the very flexible 32-year smoothing spline
applied to the individual ring-width series in the stan-
dardization process any mid to low-frequency compo-
nent will be missing in the resulting ring width
chronology However assessing decadal shrub-growth
trends is of great interest in order to investigate if
current temperature and NDVI trends can be related
to increased deciduous shrub growth We attempted a
recovery of the longer-term component of the chronol-
ogy by applying the Regional Curve Standardization
approach (RCS Briffa et al 1992) to the individual
growth series a method specifically designed to pre-
serve low frequency variability in ring width chronol-
ogies (Fig S2) Sampling from the root collar at the base
of each stem provided the best available material from
the live portion of the individual
Results
A reliable ring width chronology (STD32) was pro-
duced for the period 1942ndash2005 (Fig 3a) with very high
interseries correlation and chronology statistics (Table
2) Owing to the flexible spline used in the standardiza-
tion process the chronology was largely free of low
Table 1 Network of northern boreal forest tree-ring chronologies developed by F Schweingruber and available at the International
Tree-Ring Data Bank at the National Oceanic and Atmospheric Administration Paleoclimatology Program and World Data Center
for Paleoclimatology (httpwwwncdcnoaagovpaleotreeringhtml)
Code Site Lat Lon Species Full period
Distance to
site (km)
Pearsonrsquos
correlation
a Shchely Bozh 6622 5633 Picea obovata 1784ndash1990 180 0320
b Chariyakha River 6688 5195 Pinus sylvestris 1653ndash1990 295 0419
c Polar Urals 6687 6563 Larix sibirica 914ndash1990 360 0491
d Kedvaran 6425 5357 Larix sibirica 1674ndash1991 450 0277
e Shchuchye River 6682 6928 Larix sibirica 1710ndash1990 490 0320
f Khadyta River 6720 6983 Larix sibirica 1782ndash1990 500 0546
g Ukyu 6260 5880 Picea obovata 1616ndash1991 590 0178
h Nadym River 6622 7167 Larix sibirica 1740ndash1990 610 0418
i Khadutte River 6747 7677 Larix sibirica 1585ndash1990 790 0381
j Voroney 6343 4355 Larix sibirica 1729ndash1990 830 0231
k Krasnovishersk 6038 5712 Larix sibirica 1730ndash1991 830 0172
l Nyuchpas 6070 5138 Pinus sylvestris 1651ndash1991 850 0176
m Malchoyakha River 6608 7768 Larix sibirica 1780ndash1990 870 0282
n Indikyakha River 6825 8018 Larix sibirica 1592ndash1990 920 0288
o Lower Vangapur River 6307 7632 Larix sibirica 1804ndash1994 990 0206
p Sidorovsk 6667 8233 Larix sibirica 1750ndash1990 1050 0250
Code shows the lowercase letters corresponding to each site in Fig 1
Po01 Po005 and Po001
Lat latitude Lon longitude in decimal degrees full period total time span covered by each chronology distance to site (km) is the
distance (straight line) from the S lanata site to each boreal forest site Pearsonrsquos correlations were computed over the maximum
common time span (1942ndash1990) and between the residual chronologies
1546 B C F O R B E S et al
r 2009 Blackwell Publishing Ltd Global Change Biology 16 1542ndash1554
frequency variability No difference was found in the
ring width between male and female individuals Posi-
tive correlations were found when comparing the
S lanata chronology with the network of northern
boreal forest chronologies (common period 1942ndash1990
Table 1) correlations were significant (Po005) with
nine out the 16 chronologies and at distances
4900 km Our S lanata chronology strongly correlated
with the Polar Urals chronology (r 5 049 Po0001)
successfully used in Northern Hemisphere temperature
reconstructions (eg Esper et al 2002)
Response function coefficients revealed a very strong
summer (especially July and August) temperature signal
and no precipitation signal Figure 4 depicts the average
response function coefficients for the five records of
monthly temperature and precipitation summarizing
the overall ring width vs climate relationships June
temperature was found to be significant when using the
Naryan Mar record ndash the closest meteorological station
located 225 km from the study site The only significant
positive response to December temperature was found
for Salekhard (400 km from the site) Correlation coeffi-
cients with summer temperature (defined as the June to
August average) for a set of climate stations covering
the 62-year period 1942ndash2004 were extremely high
(r407 at distances up to 300 km Table 3A) Omsk
summer temperatures in the southern Ural Region
were very highly related to the chronology despite this
station being some 1650 km distant from the sample
sites Correlations between STD32 and gridded summer
Rin
g-w
idth
inde
x
Sam
ple
num
ber
Tem
pera
ture
(degC
)
Year
(a)
(b)
Fig 3 (a) Salix lanata ring width STD32 ndash continuous line standardized with a 32 years smoothing spline ndash and RCS ndash dashed line
standardized with the regional curve standardization procedure ndash chronologies period 1942ndash2005 (see Materials and methods for further
explanation) Sample depth (number of individuals) is shown as a filled grey area Note the clear low frequency component in the
chronology obtained by RCS specifically designed to preserve it suggesting a significant increase in Salix lanata growth for the period
1942ndash2005 (b) summer season (defined as JunendashAugust average) temperature series for a coastal lowland (Marre Sale ndash 69721N 66821E
lower) an interior lowland (Naryan Mar ndash 67631N 53031E middle) and an upland interior (Salekhard ndash 66531N 66671E upper)
meteorological stations close to the studied stand for the same period 1942ndash2005 obtained from the National Climatic Data Center
(NCDC httpwwwncdcnoaagovoancdchtml see Materials and methods) Linear fits their equations and the trend-associated
P-values are displayed Note the lower coastal temperatures and the fact that the positive trend for summer temperature in Salekhard
(upland interior) is remarkably similar to that of the RCS chronology
T U N D R A S H R U B S T R A C K R U S S I A N A R C T I C WA R M I N G 1547
r 2009 Blackwell Publishing Ltd Global Change Biology 16 1542ndash1554
temperature data for 1948ndash2005 are depicted in Fig 5
with very high coefficients occurring at long distances
especially towards the south-east into the West Siberian
Basin well into the boreal zone
Moreover our S lanata chronology consistently
showed a stronger summer temperature signal than
the network of northern boreal forest tree-ring chron-
ologies when tested against the set of climate stations
across Northern Russia for the common period 1942ndash
1990 (Table S1) Table 3B shows this in the case of the
Polar Urals L sibirica chronology well known to paleo-
climatologists and located 360 km south-east of our
sampling site
Fifteen-day NDVI values (1981ndash2005) peaked in the
second half of July (interpreted as peak total biomass)
and sharply dropped in the second half of September
being highest and lowest in the Regional-Upland and
Regional-Lowland zones respectively (Fig 6a) NDVI
values for the Site area (256 km2) were closer to the
Regional-Upland NDVI values Relationships between
NDVI and temperature for a set of stations located
within a radius o400 km from the site peaked in the
second half of June (interpreted as peak productivity)
but were high since the second half of May when
significant snow cover remains on the ground but Salix
spp are already experiencing bud-break and the first
leaves begin to emerge from the snow-free portions of
the canopy Figure 6b shows the correlation patterns
between NDVI and the Naryan Mar record which were
exactly the same when using the other meteorological
stations (not shown) Finally NDVI values for the first
half of July had higher correlations with June T sug-
gesting a 1ndash2 week lag between T and NDVI (not
shown)
Shrub annual growth strongly correlated to summer
(especially the first half of July but also the second)
NDVI values (Fig 6c 1981ndash2005) Correlation coeffi-
cients were highest for the Regional-Upland area and
lowest for the Regional-Lowland NDVI although the
patterns were the same for all areas The stronger link
between shrub radial growth and Regional-Upland
NDVI with respect to Site NDVI might be due to the
relatively low aerial coverage of erect willow shrub
habitat within the Site area (Fig 2)
The application of the RCS method successfully pre-
served mid- to low-frequency components of shrub
growth RCS curve shows a clear lower frequency
component that indicates a significant increase in
Table 2 Salix lanata ring width chronology statistics
Time span
EPS485 since nc (ns) rg (SD) t (SD) r
Raw data
1921ndash2005 1942 119 (40) 0682
(0363)
51 (12) 0734
MS SD r1
Standard chronology
0416 0359 0075
MS SD
Residual chronology
0409 0363
EPS VarPC1 SNR
Period 1942ndash2005 (Detrended Series)
0958 0552 2297
EPS Expressed Population Signal nc number of cores ns
number of shrub individuals rg mean radial growth (mm)
SD standard deviation t mean series length (years) r mean
correlation between individual and mean chronology MS
mean sensitivity r1 first-order autocorrelation SNR signal-
to-noise ratio which is a measure of the common variance in a
chronology scaled by the total variance of the chronology
VarPC1 variance explained by the first principal component
Table 3 (A) Pearsonrsquos correlation coefficients between
S lanata residual ring width chronology and summer tem-
perature (defined as the June to August average) for 12 climate
stations covering the 62-year period 1942ndash2004 (see Fig 1) (B)
Pearsonrsquos correlation of Polar Urals L Sibirica ring with
residual chronology (Polar Urals see text) and S lanata residual
ring width chronology vs summer temperature for the stations
in (A) covering the period 1942ndash1990
Station
A B
r (r2) x (km)
Polar
Urals S lanata
Naryan Mar 0721 (0520) 225 034 067
Marre Sale 0701 (0491) 300 053 065
Salekhard 0591 (0350) 400 032 056
Arkhangelsk 0280 (0078) 880 001 03
Tarko Sale 0551 (0304) 930 039 052
Khanty
Mansisk
0537 (0288) 950 045 048
Vytegra 001 (0000) 1290 009 012
Vologda 0047 (0002) 1320 008 017
Kazan 0165 (0027) 1475 001 025
Omsk 0535 (0286) 1650 047 05
Khatanga 0016 (0000) 1700 003 007
Moscow 0162 (0026) 1725 017 001
Significant at Po001
Significant at Po005
x distance to the study site r Pearsonrsquos correlation coefficient
r2 variance explained
1548 B C F O R B E S et al
r 2009 Blackwell Publishing Ltd Global Change Biology 16 1542ndash1554
S lanata L radial growth along the study period
(Fig 3a) in a similar manner to summer season tem-
peratures in meteorological stations located in the
Regional-Upland area (Fig 3b)
Discussion
Results show that S lanata ring width growth in north-
ern Russia is strongly related with summer tempera-
ture as well as with NDVI Although the present study
was conducted on a single site the large areas over
which the chronology is related to both instrument and
proxy climate records suggest that it is regionally
representative Assuming these solid relationships to
be causal the results would indicate that summer
warming has enhanced deciduous shrub growth which
in turn has been responsible for the observed increases
in NDVI
Growth in arctic vegetation is generally expected to
increase under a warming climate (ACIA 2005 Chapin
et al 2005 Walker et al 2006 IPCC 2007) This greening
within the tundra biome contrasts with a relative brown-
ing in the boreal forest zone (Goetz et al 2005 Verbyla
2008) Remote sensing evidence for the widespread
greening comes largely from North America (Sturm
et al 2001 Goetz et al 2005 Tape et al 2006 Verbyla
2008) Dendrochronological data relevant to the lsquodiver-
gence problemrsquo ndash ie divergent trends of temperature
and tree growth in much of the circumboreal coniferous
forest ndash derive from both North American and Eurasian
taiga regions (Shiyatov et al 1996 Briffa et al 1998
Lopatin et al 2006 DrsquoArrigo et al 2008) To date net
increases in tundra phytomass detected by various
remote sensing procedures are widely attributed to
the contribution from erect deciduous shrubs a key
plant functional group of which Salix spp comprise one
the largest components north of the latitudinal treeline
The main driver for this woody encroachment into
tundra areas is presumed to be recent decadal climatic
warming (Sturm et al 2001 Bunn et al 2005 Goetz
et al 2005 Raynolds et al 2008) Deciduous shrubs
have been demonstrated to respond to experimental
and observed increases in summer temperature at Too-
lik Lake Alaska (Chapin et al 1995 Hobbie amp Chapin
1998 Wahren et al 2005) It remains nonetheless diffi-
cult to confirm the extent of large-scale vegetation
changes across the circumpolar Arctic (Callaghan
et al 2005) although there is strong indication from
the International Tundra Experiment for warming-re-
lated shrub increases well beyond Alaska (Walker et al
2006) Based on these findings Verbyla (2008) specu-
lates that the observed increase in annual maximum
Fig 4 Averaged response function coefficients for Salix lanata residual ring width chronology vs monthly temperature (right T) and
precipitation (left P) over five meteorological stations within the area (distances up to 400 km) obtained from the National Snow and Ice
Data Center (NSIDC see Materials and methods) Naryan Mar Pechora Ra Iz Salekhard and Ust Kara Response function coefficients
calculated separately for each meteorological station (not shown) resulted in the same overall pattern Analyses were performed from
September before the growing season to current August for the period 1961ndash2000 for which there is available T and P monthly
meteorological data Months abbreviated with capital letters correspond to the year previous to the growing season Positive (negative)
coefficients indicate positive (negative) ring-width vs climate relationships Fractions in the upper part of the plot indicate the number of
times the response coefficients were found significant (Po005) for example 45 in August T means that the relationship between ring-
width and August T was found significant when analyzed against four out of the five climate records used No fraction is displayed
when no significant coefficients were found
T U N D R A S H R U B S T R A C K R U S S I A N A R C T I C WA R M I N G 1549
r 2009 Blackwell Publishing Ltd Global Change Biology 16 1542ndash1554
NDVI in arctic Alaska and adjoining Canada may be
due to an increase in height and cover of shrubs and
graminoids Similarly Raynolds et al (2008) conclude
that increases in NDVI are also likely to occur where
vegetation physiognomy changes to include larger
plant life forms such as the boundaries between gra-
minoids and erect shrubs This study presents the first
complete chronology from an erect deciduous tundra
shrub detailing a response function that relates shrub
growth summer temperature and NDVI
Our results demonstrate that shrub ring width in an
abundant tundra willow with a nearly circumpolar
distribution is strongly related to summer temperature
for the period 1942ndash2005 Remarkably high correlations
occur at large distances across the tundra and taiga
zones of Eastern Europe and the West Siberian Basin
mirroring the large spatial correlation of summer tem-
peratures in this area Correlations with Summer T are
consistently higher than those used for boreal forest
temperature reconstructions in Eurasia (eg Grudd
et al 2002 Hantemirov amp Shiyatov 2002 Helama
et al 2002) comparable only with a study with the
evergreen arctic shrub Empetrum hermaphroditum Lange
ex Hagerup in the mountains of central Norway (Bar
et al 2007) We also found a clear relationship with
NDVI for upland vegetation at a regional scale for the
period 1981ndash2005 confirming a parallel greening trend
reported for similarly warming portions of arctic North
America (Jia et al 2003 Goetz et al 2005 Verbyla
2008) Despite the inherent difficulties in preserving
the low-frequency component of a ring width chronol-
ogy while efficiently removing its age-related trend the
RCS growth curve suggests a significant increase in
willow growth over the last six decades parallel to
the summer temperature increase for the region
(NASA-GISS 2009 most visible in the stations located
in the upland tundra and least visible in the coastal
areas) These findings are in line with studies that have
surmised an increase in the height and cover of erect
shrubs as a key component of the reported tundra green-
ing signal detected via NDVI since the early 1980s (Jia
et al 2003 Tape et al 2006 Walker et al 2006 Raynolds
et al 2008 Verbyla 2008) Furthermore the growth trend
agrees with observations by the indigenous Nenets here
and on neighboring Yamal Peninsula concerning recent
increases in willow height and abundance (Forbes amp
Stammler 2009) Their local observations provide an
independent source of qualitative knowledge that help
Fig 5 Correlation map between Salix lanata ring width residual chronology and summer temperature over North-Western Eurasia
Data consists on June to August mean surface temperature from a 251 latitude per 251 longitude grid obtained from the NCEP
Reanalysis database (httpwwwcdcnoaagov see Materials and methods) Time period is 1948ndash2005 Location of the Salix lanata
chronology is shown as a white filled square Note the high correlations occurring at long distances especially towards the southeast into
the West Siberian Basin well into the boreal zone
1550 B C F O R B E S et al
r 2009 Blackwell Publishing Ltd Global Change Biology 16 1542ndash1554
to confirm not only the quantitative data but also their
social-ecological relevance since changes in shrub
height and phytomass have direct and indirect impacts
on their livelihood For example herders note that
when the tallest shrubs exceed the antler height of
standing reindeer animals can disappear from sight
when browsing within thickets and subsequently be
lost during migration (Forbes amp Stammler 2009)
Before the present investigation the most direct evi-
dence for a regional response derived largely from a
time series air photo analysis of increasing shrub abun-
dance over a 50-year period on the Alaskan North Slope
(Sturm et al 2001 Tape et al 2006) That particular
study is cited in support of a number of recent remote
sensing analyses examining the broader scale relation-
ship between summer warmth tundra greening and
NDVI in North America (Walker et al 2002 Jia et al
2003 2006 Goetz et al 2005 Raynolds et al 2006 2008
Tape et al 2006) Together these analyses rest on the
reasonable assumption that temporal changes to NDVI
resulting from climate change might replicate the dif-
ferences that occur along spatial climate gradients be-
cause increased warming is expected to enhance shrub
growth (Walker et al 2002) Satellite-based analyses
have found that the amount of shrubs is strongly
spatially correlated with NDVI and summer warmth
particularly in acidic tundra arguably making it a
meaningful indicator of aboveground plant biomass at
both local and regional scales (Walker et al 2002
Raynolds et al 2006 2008) In support of this field-
based work employing hand-held sensors recently de-
termined that shrub phytomass especially its live foliar
(a)
(b) (c)
Fig 6 (a) Average 15-day NDVI values indicating peak total biomass in the second half of July Note that the highest and lowest overall
NDVI values correspond to the Upland and Lowland regions respectively (b) relationships between Regional 15-day NDVI and
monthly temperature for Naryan Mar meteorological station (as in Fig 1 obtained from the National Climatic Data Center ndash NCDC
httpwwwncdcnoaagovoancdchtml see Materials and methods) indicating peak productivity in the second half of June (c)
correlation between Salix lanata residual ring width chronology and 15-day NDVI values indicating a peak in the first half of July
Correlations computed from May to September (ie growing season) for the common period 1981ndash2005 NDVI regions black continuous
line Site black dashed line Regional grey continuous line Regional-Upland grey dashed line Regional-Lowland (see Fig 1 and
materials and data for definition and display of the areas)
T U N D R A S H R U B S T R A C K R U S S I A N A R C T I C WA R M I N G 1551
r 2009 Blackwell Publishing Ltd Global Change Biology 16 1542ndash1554
deciduous component was the major factor controlling
NDVI across a variety of northern Alaskan vegetation
types (Riedel et al 2005) Jia et al (2003) likewise
reported that 88 of the variance of deciduous shrub
foliar biomass was explained with ground-measured
NDVI Our data provide support for extending these
interpretations (1) retrospectively and (2) to the western
Eurasian Arctic which until now has lacked ground-
level quantification of a steady increase in willow shrub
growth to match the regionrsquos demonstrated warming
trend in recent decades
We have determined S lanata L to be a remarkably
high quality proxy for six decades of summer tempera-
ture over vast swaths of the tundra and taiga zones of
West Siberia and the East European Arctic The ob-
served higher performance of S lanata as a summer
temperature proxy at a regional scale when compared
with other high quality ring-width-based temperature
proxies further confirms this Given the divergence pro-
blem it is important to develop suitable archives for
reconstructing climate regimes in remote locations lack-
ing long-term meteorological records especially in the
tundra zone The lack of precipitation signal in the
presented S lanata chronology suggests that the drought
stress-caused temperature decoupling in boreal trees ndash
proposed as one of the main mechanisms for the
divergence problem (eg DrsquoArrigo et al 2008) ndash does
not affect this deciduous tundra shrub at least in the
studied area The ready preservation of shrub wood in
permafrost substrates (Shiyatov amp Hantemirov 2000)
and lakes coupled with the abundant and broad dis-
tribution of S lanata L makes this species an excellent
candidate for extending reliable climate reconstructions
much further into the past Although the sharp growth
releases experienced by S lanata individuals when
reaching the canopy within their respective thickets
implies potential difficulties in climate signal recovery
these are not insurmountable given a large number of
samples and the use of appropriate standardization
methods The strength of the regional relationship we
found between shrub growth and NDVI agrees well
with a recent circumpolar analysis (Raynolds et al
2006) Our analysis provides the best proxy assessment
to date that deciduous shrub phytomass has increased
significantly in response to an ongoing summer warm-
ing trend Furthermore the results fill an important gap
since ground-level data on decadal phytomass trends
are otherwise lacking for the Russian Arctic These
findings have relevance for tundra biodiversity surface
hydrology and feedbacks resulting in atmospheric
heating This is because an increase in shrub abundance
lies at the crux of a range of critical regime shifts in the
tundra biome including net ecosystem productivity
species loss snow cover and energy balance as driven
by albedo (ACIA 2005 Chapin et al 2005 Walker et al
2006 IPCC 2007) Given the vast expanses of shrub
tundra across northern Russia (Walker et al 2005) and
the large geographic range of S lanata L (Hulten amp
Fries 1986) additional chronologies from this species in
different landscapes would help to confirm if the trends
reported here are circumpolar
Acknowledgements
This research is a product of the ENSINOR project funded by theAcademy of Finlandrsquos lsquoRussia in Fluxrsquo program (Decision208147) Additional support came from the National ScienceFoundation Office of Polar Programs and the National Aero-nautics and Space Administration through the Northern Eur-asian Earth Science Partnership Initiative The EALAT project(Kautokeino Norway) contributed funds for the data analysisand write-up Pasha Groisman and Jiong Jia assisted respec-tively with obtaining Russian climate and corrected NDVI dataTimo Kumpula conducted ground truthing and calculated thesurface area of land cover classes The work of Marc MaciasFauria was funded by Professor EA Johnson at the Bio-geoscience Institute University of Calgary Canada
References
ACIA (2005) Arctic Climate Impact Assessment Cambridge University
Press Cambridge
Bar A Pape R Brauning A Loffler J (2007) Growth-ring variations of
dwarf shrubs reflect regional climate signals in alpine environments
rather than topoclimatic differences Journal of Biogeography 35
625ndash636
Beschel RE Webb D (1963) Axel Heiberg Island Preliminary Report 1961ndash
1962 pp 189ndash198 McGill University Montreal
Biondi F Waikul K (2004) DENDROCLIM 2002 a C 1 1 program for
statistical calibration of climate signals in tree-ring chronologies Com-
puters and Geosciences 30 303ndash311 doi 101016jcageo200311004
Bliss LC (1997) Arctic ecosystems of North America In Polar and Alpine
Tundra (ed Wielgolaski FE) pp 551ndash683 Elsevier Amsterdam
Briffa KR Jones PD Bartholin TS et al (1992) Fennoscandian summers
from AD 500 temperature changes on short and long timescales
Climate Dynamics 7 111ndash119
Briffa KR Schweingruber FH Jones PD Osborn TJ Shiyatov SG Vaganov
EA (1998) Reduced sensitivity of recent tree-growth to temperature at
high northern latitudes Nature 391 678ndash682
Bunn AG Goetz SJ Fiske GJ (2005) Observed and predicted responses of
plant growth to climate across Canada Geophysical Research Letters 32
L16710 doi 1010292005GL023646
Callaghan TV et al (2005) Arctic Climate Impact Assessment pp 243ndash352
Cambridge University Press Cambridge UK
Chapin FS III Shaver GR Giblin AE Nadelhoffer KJ Laundre JA (1995)
Responses of arctic tundra to experimental and observed changes in
climate Ecology 76 694ndash711
Chapin FS III Sturm M Serreze MC et al (2005) Role of land-surface
changes in Arctic summer warming Science 310 657ndash660
Cook ER Peters K (1981) The smoothing spline a new approach to
standardizing forest interior tree-ring width series for dendroclimatic
studies Tree-Ring Bulletin 41 45ndash53
DrsquoArrigo R Wilson R Liepert B Cherubini P (2008) lsquoOn the lsquodivergence
problemrsquo in northern forests a review of the tree-ring evidence and
possible causes Global Planetary Change 60 289ndash305
1552 B C F O R B E S et al
r 2009 Blackwell Publishing Ltd Global Change Biology 16 1542ndash1554
Esper J Cook ER Schweingruber FH (2002) Low-frequency signals in
long tree-ring chronologies for reconstructing past temperature varia-
bility Science 295 2250ndash2253 doi 101126science1066208
Forbes BC Stammler F (2009) Arctic climate change discourse the
contrasting politics of research agendas in the West and Russia Polar
Research 28 28ndash42
Forchhammer MC Christensen TR Hansen BU et al (2008) Zackenberg in
a circumpolar context Advances in Ecological Research 40 499ndash544
Fritts HC (1976) Tree Rings and Climate London Academic Press London
UK
Goetz SJ Bunn AG Fiske GJ Houghton RA (2005) Satellite-observed
photosynthetic trends across boreal North America associated with
climate and fire disturbance Proceedings of the National Academy of
Sciences 102 13521ndash13525
Grudd H Briffa KR Karlen W Bartholin TS Jones PD Kromer B (2002) A
7400-year tree-ring chronology in northern Swedish Lapland natural
climatic variability expressed on annual to millennial timescales
Holocene 12 657ndash665
Hantemirov RM Shiyatov SG (2002) A continuous multimillennial ring-
width chronology in Yamal northwestern Siberia Holocene 12
717ndash726 doi 1011910959683602hl585rp
Helama S Lindholm M Timonen M Merilainen J Eronen M (2002) The
supra-long Scots pine tree-ring record for Finnish Lapland Part 2
interannual to centennial variability in summer temperatures for 7500
years Holocene 12 681ndash687
Hobbie SE Chapin FS III (1998) The response of tundra plant biomass
aboveground production nitrogen and CO2 ux to experimental warm-
ing Ecology 79 1526ndash1544
Hulten E Fries M (1986) Atlas of North European Vascular Plants North of the
Tropic of Cancer Koeltz Scientific Konigstein
IPCC (2007) Climate Change 2007 Impacts Adaptation and Vulnerability
Cambridge University Press Cambridge
Jia GJ Epstein HE Walker DA (2003) Greening of arctic Alaska 1981ndash
2001 Geophysical Research Letters 30 31ndash33
Jia GJ Epstein HE Walker DA (2006) Spatial heterogeneity of tundra
vegetation response to recent temperature changes Global Change
Biology 12 42ndash55
Johnstone J Henry GHR (1997) Retrospective analysis of growth and
reproduction of Cassiope tetragona and relations to climate in the
Canadian High Arctic Arctic and Alpine Research 29 459ndash469
Jonsell B (ed) (2000) Flora Nordica 1 Lycopodiaceae ndash Polygonaceae Bergius
Foundation Stockholm
Kitti H Forbes BC Oksanen J (2009) Long- and short-term effects of
reindeer grazing on tundra wetland vegetation Polar Biology 32
253ndash261
Lopatin E Kolstrom T Spiecker H (2006) Determination of forest growth
trends in Komi Republic (northwestern Russia) combination of tree-
ring analysis and remote sensing data Boreal Environmental Research 11
341ndash353
Macias M Timonen M Kirchhefer AJ Lindholm M Eronen M Gutierrez
E (2004) Growth variability of Scots pine (Pinus sylvestris) along a west-
east gradient across northern Fennoscandia a dendroclimatic ap-
proach Arctic Antarctic and Alpine Research 36 565ndash574 doi 101657
1523-0430(2004)036[0565GVOSPP]20CO2
NASA-GISS (2009) NASA-Goddard Institute for Space Studies Surface Tem-
perature Analysis httpdatagissnasagovgistempmaps (accessed
14 January 2009)
Nikolaev AN Samsonova VV (2007) Proceedings International Conference on
Cryogenic Resources of Polar Regions pp 179ndash182 Russian Academy of
Sciences Puschino
Olofsson J Oksanen L Callaghan T Hulme PE Oksanen T Suominen O
(2009) Herbivores inhibit climate-driven shrub expansion on the tun-
dra Global Change Biology doi 101111j1365-2486200901935x
Podkorytov FM (1995) Reindeer Herding on Yamal Leningradskoi Atomoi
Electrostantsii Sosnovyi Bor (in Russian)
Ponomarev V Munsterman M Leummens H (eds) (2004) The Pechora
River Basin Russian Academy of Sciences Syktyvkar
Rayback SA Henry GHR (2006) Reconstruction of summer temperature
for a Canadian High Arctic site from retrospective analysis of the dwarf
shrub Cassiope tetragona Arctic Antarctic and Alpine Research 38
228ndash238
Raynolds MK Comiso JC Walker DA Verbyla D (2008) Relationship
between satellite-derived land surface temperatures arctic vegetation
types and NDVI Remote Sensing of Environment 112 1884ndash1894
Raynolds MK Walker DA Maier HA (2006) NDVI patterns and phyto-
mass distribution in the circumpolar Arctic Remote Sensing of Environ-
ment 102 271ndash281
Riedel SM Epstein HE Walker DA (2005) Biotic controls over spectral
reflectance of arctic tundra vegetation International Journal of Remote
Sensing 26 2391ndash2405
Schmidt NM Baittinger C Forchhammer MC (2006) Reconstructing
century-long snow regimes using estimates of High Arctic Salix arctica
radial growth Arctic Antarctic and Alpine Research 38 257ndash262
Shiyatov SG Hantemirov RM (2000) Tree-ring dating of scrub wood from
archeological settlement Yarte VI on Yamal Peninsula (in Russian w
English abstract) Dreynosti Yamala 1 112ndash120
Shiyatov SG Hantemirov RM Schweingruber FH Briffa KR Moell M
(1996) Potential long-chronology development on the northwest Siber-
ian Plain early results Dendrochronologia 14 13ndash29
Sturm M Racine C Tape K (2001) Increasing shrub abundance in the
Arctic Nature 411 546ndash547
Tape K Sturm M Racine CH (2006) The evidence for shrub expansion in
northern Alaska and the Pan-Arctic Global Change Biology 12 686ndash702
Tolmachev AI (2000) Flora of the Russian Arctic Vol III SalicaceaendashRanun-
culaceae English edn J Cramer Berlin
Tucker CJ Pinzon JE Brown ME et al (2005) An Extended AVHRR 8-km
NDVI data set compatible with MODIS and SPOT vegetation NDVI
data International Journal of Remote Sensing 26 4485ndash5598
Verbyla D (2008) The greening and browning of Alaska based on 1982ndash
2003 satellite data Global Ecology and Biogeography 17 547ndash555
Wahren C-HA Walker MD Bret-Harte MS (2005) Vegetation responses
in Alaskan arctic tundra after 8 years of a summer warming and
winter snow manipulation experiment Global Change Biology 11 537ndash
552
Walker DA (1987) Height and growth rings of Salix lanata ssp richardsonii
along the coastal temperature gradient of northern Alaska Canadian
Journal of Botany 65 988ndash993
Walker DA Epstein HE Jia JG et al (2002) Phytomass LAI and NDVI in
northern Alaska relationships to summer warmth soil pH plant
functional types and extrapolation to the circumpolar Arctic Journal
of Geophysical Research doi 1010292001JD000986
Walker DA Raynolds MK Daniels FJA et al (2005) The circumpolar arctic
vegetation map Journal of Vegetation Science 16 267ndash282
Walker MD Wahren CH Hollister RD et al (2006) Plant community
responses to experimental warming across the tundra biome Proceed-
ings of the National Academy of Sciences 103 1342ndash1346
Wigley TML Briffa KR Jones PD (1984) On the average value of
correlated time series with applications in dendroclimatology and
hydrometeorology Journal of Climate and Applied Meteorology 23
201ndash221
Woodcock H Bradley RS (1994) Salix arctica (Pall) its potential for
dendroclimatological studies in the High Arctic Dendrochronologia
12 11ndash22
Zalatan R Gajewski K (2006) Dendrochronological potential of Salix
alaxensis from the Kuujjua river area Western Canadian Arctic Tree-
Ring Research 62 75ndash82
T U N D R A S H R U B S T R A C K R U S S I A N A R C T I C WA R M I N G 1553
r 2009 Blackwell Publishing Ltd Global Change Biology 16 1542ndash1554
Supporting Information
Additional Supporting Information may be found in the online version of this article
Figure S1 Individual ring width measurements (mm) of Salix lanata at the study site in Eastern European Arctic The arithmetic
mean of all the individual series is shown as a thick black line to illustrate the overall growth pattern more clearly Note the char-
acteristic age-related trend with suppressed growth in the early years followed by a relatively sharp growth increase The vertical red
line marks the year 1942 from which the chronology has enough sample depth to be considered reliable (see Materials and Methods
and Results)
Figure S2 Thin black line is the average ageing curve resulting from all the Salix lanata ring-width cores aligned by age A 32-year
cubic spline function with 50 percent cut-off was fitted to the averaged series (thick black line) representing the Regional Growth
Curve
Table S1 Pearson correlation coefficients between the network of northern boreal forest tree-ring width chronologies developed by F
Schweingruber (see Fig 1 Table 1) and the average temperature for June to August from a network of meteorological stations in
northern Russia (see Fig 1 Table 3) Correlations computed over the common period 1942ndash1990 Significant coefficients (po005) are
shown in bold The last line shows ring-width vs summer T correlations for the S lanata chronology created in the present study
Note the overall higher coefficients shown by the S lanata chronology
Please note Wiley-Blackwell are not responsible for the content or functionality of any supporting materials supplied by the authors
Any queries (other than missing material) should be directed to the corresponding author for the article
1554 B C F O R B E S et al
r 2009 Blackwell Publishing Ltd Global Change Biology 16 1542ndash1554
Hantemirov 2000) ie the time periods represented
were not continuous up until the present Yet until
now no studies have managed to produce a response
function relating deciduous tundra shrub growth to
temperature despite mounting evidence in the last
few years for a link between summer warmth and
increasing live leaf phytomass in portions of the tundra
biome (lsquogreeningrsquo of the Arctic Jia et al 2003 Goetz
et al 2005 Raynolds et al 2008 Verbyla 2008)
Salix lanata L (sensu latu) is an abundant deciduous
dioecious willow with nearly circumpolar geographic
distribution from the northern boreal forest (forest-
tundra transition zone) to the northern limits of the
Low Arctic (dwarf and prostrate shrub zone) except in
Greenland where it is absent (Hulten amp Fries 1986)
Other than at its northern range limits the plant is
typically erect attaining a height of 1ndash3 m under favor-
able conditions with adequate snow cover (Jonsell
2000 Tolmachev 2000) but it also grows horizontally
in response to chronic snow loading and readily roots
adventitiously when stems come into contact with the
ground Several authors have commented on the diffi-
culties involved with reliably cross-dating arctic wil-
lows (Beschel amp Webb 1963 Woodcock amp Bradley
1994) but this species does produce well-defined
growth rings Moreover preserved dead Salix material
from at least two tundra species (S arctica Pall and
S dasyclados Wimm) has been previously cross-dated
suggesting the potential for extending chronologies
from living material (Woodcock amp Bradley 1994 Shiya-
tov amp Hantemirov 2000)
The aims of the present study are to (i) develop a ring
width chronology using S lanata from the East Euro-
pean Arctic (ii) investigate the growthndashclimate relation-
ship and thus the potential for proxy climate recon-
struction of this abundant and geographically
widespread species and (iii) explore possible evidence
for a tundra shrub growth trend to match an ostensible
arctic lsquogreeningrsquo detected by the Normalized Difference
Vegetation Index (NDVI Jia et al 2003 Goetz et al
2005 Raynolds et al 2006 Verbyla 2008)
Study area
The study area lies in the Nenets Autonomous Okrug
(Fig 1) about 20 km southeast of the coastal port of
Varandei between the lakes Big Toravei and Small
Toravei (6814000N 5813000E) This is a region of low arctic
tundra (Walker et al 2005) with uplands characterized
by dwarf shrub heath Sphagnum-sedge mires in the
lowlands and dense copses of Salix spp 50ndash250 cm tall
in moist to saturated riparian habitats and along lake
margins with rolling moderate slopes A supervised
classification based on very high-resolution Quickbird-2
satellite imagery determined the local ground cover of
erect Salix copse to be 20 (Fig 2) The study area is
12 3
45
6
78
910
11
12 13
14
15
0
RU
RL
R
S
UralMountains
YamalPeninsula
West
Siberian
Basin
North
Eastern
Europe
Kara Sea Barents Sea
Fig 1 Map of northern Eurasia showing the location of meteorological stations used in this study 0 Varandei 1 Naryan Mar 2 Ust
Kara 3 Marre Sale 4 Pechora 5 Ra Iz 6 Salekhard 7 Arkhangelsk 8 Tarko Sale 9 Khanty Mansisk 10 Vytegra 11 Vologda 12
Kazan 13 Omsk 14 Khatanga 15 Moscow The study area is highlighted by an empty white rectangle and expanded in the lower-right
corner of the image which depicts the different NDVI areas used in the study R regional NDVI (whole area) RU Regional-Upland RL
Regional-Lowland S site Lowercase letters and white stars indicate the location of the boreal tree-ring width chronologies developed
by F Schweingruber and available at the International Tree-Ring Data Bank at the National Oceanic and Atmospheric Administration
Paleoclimatology Program and World Data Center for Paleoclimatology (httpwwwncdcnoaagovpaleotreeringhtml) which were
compared with the Salix lanata chronology presented in this study a Shchely Bozh b Chariyakha river c Polar Urals d Kedvaran e
Shchuchye River f Khadyta River g Ukyu h Nadym River i Khadutte River j Voroney k Krasnovishersk l Nyuchpas m
Malchoyakha River n Indikyakha River o Lower Vangapur River p Sidorovsk
T U N D R A S H R U B S T R A C K R U S S I A N A R C T I C WA R M I N G 1543
r 2009 Blackwell Publishing Ltd Global Change Biology 16 1542ndash1554
situated within subzone D of the Circumpolar Arctic
Vegetation Map (CAVM Walker et al 2005) The
boundary between subzones C and D separates drier
northern tundra on mineral soils from southern rela-
tively moist tundra with moss carpets This is approxi-
mately equivalent to the boundary between the high
and low arctic (Bliss 1997) Subzone D is characterized
by erect shrubs (440 cm tall) in protected locations
such as riparian habitats and at the foot of steep slopes
particularly along lakeshores Substrates are classified
as peaty tundra gley soils with high organic content
(Ponomarev et al 2004) During 1995ndash2005 mean sum-
mer (JunendashAugust) temperature at Varandei the nearest
weather station was 75 1C and snow cover depths
between December and April averaged 68 cm This
region has experienced an estimated warming trend
of 1ndash2 1C for the month of July during the main study
period 1942ndash2005 (NASA-GISS 2009) Winter tempera-
tures (DecemberndashFebruary) for the same period do not
reveal a warming trend although from 1981 to 2005
temperature has increased from 02 to 05 1C (NASA-
GISS 2009) This study will focus on the growing
season (JunendashAugust) in order to address the aforemen-
tioned literature gap concerning the relationship be-
tween summer warmth and deciduous phytomass at
the regional scale
Materials and methods
Field methods
168 slices 2ndash3-cm-thick were collected from 40 discrete
individuals spread across 15 sample sites over an area
of approximately 3 25 km in the summer of 2006
These represent lsquouplandrsquo tundra that is relatively low-
lying ( 25 m asl) but still topographically distinct
from the adjoining mire-dominated coastal lowland
that is generally 100 cm asl (Fig 2) A minimum
of four slices between the root collar and the upper
canopy was taken from each individual in order to
properly account for reaction wood which forms in
response to mechanical stress eg wind exposure snow
loading soil movement and can result in asymmetric
stem growth In the few cases of obtaining two or more
samples from among dense polycormic clonal copses
care was taken to differentiate between distinct genets
Whenever possible neighboring female (7) and male
(24) plants were used in order to test for potential
variations in stem growth resulting from differential
allocation to reproductive effort or stem production
Olofsson et al (2009) have recently argued that her-
bivory must be considered in order to understand how
a changing climate may or may not affect shrub
Fig 2 Supervised land classification of the sampling area on a very high resolution Quickbird-2 image taken on 5 August 2005 The
percentages of land cover for each class are shown Note the sharp change between the upland (U) and lowland (L) at the northern edge
of the image the lowlands having a much greater proportion of peatland
1544 B C F O R B E S et al
r 2009 Blackwell Publishing Ltd Global Change Biology 16 1542ndash1554
abundance The leaves and twigs of S lanata constitute
important forage for several herbivores including rein-
deer (Rangifer tarandus L Podkorytov 1995) In smaller
erect individuals and related prostrate taxa such as
S arctica Pall herbivory could be a source of dendro-
chronological error within years (Schmidt et al 2006)
and early- and mid-season browsing and trampling are
demonstrated to significantly reduce Salix biomass in
shrubs 80 cm in height (Kitti et al 2009) In the study
area which comprises designated pasture territory
used by nomadic Nenets herders Salix spp are poten-
tially grazed in late summer up to a level of 18 m
We found no evidence of browsing in the field and only
erect individuals with heights ranging 2ndash25 m were
sampled
Climate and remote sensing data
Continuous climate records in the arctic tundra tend to
be relatively short-term and spatially restricted to coast-
al areas where most meteorological stations are located
particularly in North America (Zalatan amp Gajewski
2006) In the East European North (Fig 1) data sources
north of treeline are patchy spatially and temporally
and the distances between stations can be great At
nearby Varandei continuous climate records extend
back only to the 1990s Mean monthly temperature data
from 12 stations in Northern Russia 225 to 1725 km
from the study site and covering the period 1942ndash2004
were obtained from the National Climatic Data Cen-
ter (NCDC httpwwwncdcnoaagovoancdchtml)
Monthly precipitation and temperature data from five
nearby (ie distances o400 km) Russian Arctic stations
for 1961ndash2000 were available at the National Snow and
Ice Data Center (NSIDC) at Boulder Colorado Further
we used mean monthly surface temperature data from a
251 latitude per 251 longitude regional grid covering
the period 1948ndash2005 from the NCEP Reanalysis data-
base provided by the NOAA-CIRES Climate Diagnos-
tics Centre Boulder Colorado (httpwwwcdcnoaa
gov)
NDVI data are derived from the National Oceanic
and Atmospheric Administration (NOAA) Advanced
Very High Resolution Radiometer (AVHRR) meteorolo-
gical satellites and serve as a strong proxy for gross
photosynthesis They are therefore useful for estimating
levels of total live aboveground phytomass and leaf
area index (LAI) in tundra vegetation (Goetz et al 2005
Riedel et al 2005 Raynolds et al 2006) We obtained
biweekly NDVI records from the Global Inventory
Modeling and Mapping Studies (GIMMS) dataset
available through the Global Land Cover Facility
(httpglcfumiacsumdedudatagimms) The data-
set (Tucker et al 2005) has been corrected for calibra-
tion view geometry volcanic aerosols and other effects
not related to vegetation change and covers the period
1981ndash2005 at 8 km resolution We computed regional
averages of NDVI for four areas which varied in exten-
sion and in physiographic characteristics (Fig 1) (i) Site
comprised of a small area in the immediate vicinity of
the sampling site (4 pixels 256 km2) (ii) Regional a broad
area around the site (648 pixels 41472 km2) (iii) Regional-
Upland as (ii) but excluding coastal pixels and thus with
a smaller fraction of mires peatlands and water bodies
and a higher fraction of well-drained land (576 pixels
36864 km2) and (iv) Regional-Lowland as (ii) but includ-
ing only coastal pixels which showed consistent lower
NDVI values due a combination of cooler temperatures
(immediate proximity to the Barents Sea) and higher
fraction of water bodies (72 pixels 4608 km2)
Data analysis
Wood samples were sanded and measured with a
precision of 001 mm Cross-dating of the ring width
measurement series was performed following standard
dendrochronological procedures (Fritts 1976) Indivi-
dual ring width measurements showed a characteristic
age-related trend with early suppressed growth fol-
lowed by a relatively sharp growth increase (Support-
ing information Fig S1) Such a growth pattern was
interpreted as the time the individual shrub takes to
reach the lsquocanopyrsquo of the respective thicket from which
it was sampled Ring width measurements were initi-
ally detrended using a 32-year smoothing spline (Cook
amp Peters 1981) The Expressed Population Signal (EPS)
which is a function of series replication and mean inter-
series correlation was used to define the reliable part of
the chronology (EPS 85 Wigley et al 1984) Other
descriptive statistics were calculated for each chronol-
ogy to permit comparisons with other dendrochronolo-
gical data sets (Fritts 1976)
Dendrochronology in northern Russia has been re-
stricted to the boreal forest and forest-tundra zones
with research focused on the conifers Larix sibirica Ldb
L gmelini Pilger L cajanderi Mayr Picea obovata Ldb and
Pinus sylvestris L (eg Shiyatov et al 1996) That is the
resulting S lanata chronology cannot be compared with
any other Russian tundra shrub chronology In order to
test its agreement with other ring width chronologies in
the region a network of existing 16 tree-ring width
chronologies from various species in the northern bor-
eal forest located south of our study site and developed
by F Schweingruber (Fig 1 Table 1) was correlated
against the S lanata chronology Measurement data for
each chronology was obtained from the International
Tree-Ring Data Bank at the National Oceanic and Atmo-
spheric Administration Paleoclimatology Program and
T U N D R A S H R U B S T R A C K R U S S I A N A R C T I C WA R M I N G 1545
r 2009 Blackwell Publishing Ltd Global Change Biology 16 1542ndash1554
World Data Center for Paleoclimatology (http
wwwncdcnoaagovpaleotreeringhtml) Individual
measurement series were standardized by negative
exponential functions or nonascending straight lines
to remove the age-related growth trend a common
procedure in northern boreal forest stands (eg Macias
et al 2004)
Response functions between the ring width residual
chronology and monthly climate data (temperature and
precipitation) for the five closest climate stations (dis-
tance to the site 400 km) were performed using the
program DendroClim2002 (Biondi amp Waikul 2004) for
the period 1961ndash2000 for which we had full climatic
data Response function coefficients are multivariate
estimates from a principal component regression model
calculated to avoid colinearity between predictors com-
monly found in multivariable sets of meteorological
data Significance and stability of coefficients were
assessed by 1000 bootstrap estimates obtained by ran-
dom extraction with replacement from the initial data
set Climatendashgrowth relationships were analyzed from
the previous September to August of the growth year
Correlations between climate and the boreal forest tree-
ring width chronologies were computed in order to put
the climate signal of our S lanata chronology in context
Finally relationships between shrub growth and NDVI
data measurements were assessed by linear Pearsonrsquos
correlation coefficients
Owing to the very flexible 32-year smoothing spline
applied to the individual ring-width series in the stan-
dardization process any mid to low-frequency compo-
nent will be missing in the resulting ring width
chronology However assessing decadal shrub-growth
trends is of great interest in order to investigate if
current temperature and NDVI trends can be related
to increased deciduous shrub growth We attempted a
recovery of the longer-term component of the chronol-
ogy by applying the Regional Curve Standardization
approach (RCS Briffa et al 1992) to the individual
growth series a method specifically designed to pre-
serve low frequency variability in ring width chronol-
ogies (Fig S2) Sampling from the root collar at the base
of each stem provided the best available material from
the live portion of the individual
Results
A reliable ring width chronology (STD32) was pro-
duced for the period 1942ndash2005 (Fig 3a) with very high
interseries correlation and chronology statistics (Table
2) Owing to the flexible spline used in the standardiza-
tion process the chronology was largely free of low
Table 1 Network of northern boreal forest tree-ring chronologies developed by F Schweingruber and available at the International
Tree-Ring Data Bank at the National Oceanic and Atmospheric Administration Paleoclimatology Program and World Data Center
for Paleoclimatology (httpwwwncdcnoaagovpaleotreeringhtml)
Code Site Lat Lon Species Full period
Distance to
site (km)
Pearsonrsquos
correlation
a Shchely Bozh 6622 5633 Picea obovata 1784ndash1990 180 0320
b Chariyakha River 6688 5195 Pinus sylvestris 1653ndash1990 295 0419
c Polar Urals 6687 6563 Larix sibirica 914ndash1990 360 0491
d Kedvaran 6425 5357 Larix sibirica 1674ndash1991 450 0277
e Shchuchye River 6682 6928 Larix sibirica 1710ndash1990 490 0320
f Khadyta River 6720 6983 Larix sibirica 1782ndash1990 500 0546
g Ukyu 6260 5880 Picea obovata 1616ndash1991 590 0178
h Nadym River 6622 7167 Larix sibirica 1740ndash1990 610 0418
i Khadutte River 6747 7677 Larix sibirica 1585ndash1990 790 0381
j Voroney 6343 4355 Larix sibirica 1729ndash1990 830 0231
k Krasnovishersk 6038 5712 Larix sibirica 1730ndash1991 830 0172
l Nyuchpas 6070 5138 Pinus sylvestris 1651ndash1991 850 0176
m Malchoyakha River 6608 7768 Larix sibirica 1780ndash1990 870 0282
n Indikyakha River 6825 8018 Larix sibirica 1592ndash1990 920 0288
o Lower Vangapur River 6307 7632 Larix sibirica 1804ndash1994 990 0206
p Sidorovsk 6667 8233 Larix sibirica 1750ndash1990 1050 0250
Code shows the lowercase letters corresponding to each site in Fig 1
Po01 Po005 and Po001
Lat latitude Lon longitude in decimal degrees full period total time span covered by each chronology distance to site (km) is the
distance (straight line) from the S lanata site to each boreal forest site Pearsonrsquos correlations were computed over the maximum
common time span (1942ndash1990) and between the residual chronologies
1546 B C F O R B E S et al
r 2009 Blackwell Publishing Ltd Global Change Biology 16 1542ndash1554
frequency variability No difference was found in the
ring width between male and female individuals Posi-
tive correlations were found when comparing the
S lanata chronology with the network of northern
boreal forest chronologies (common period 1942ndash1990
Table 1) correlations were significant (Po005) with
nine out the 16 chronologies and at distances
4900 km Our S lanata chronology strongly correlated
with the Polar Urals chronology (r 5 049 Po0001)
successfully used in Northern Hemisphere temperature
reconstructions (eg Esper et al 2002)
Response function coefficients revealed a very strong
summer (especially July and August) temperature signal
and no precipitation signal Figure 4 depicts the average
response function coefficients for the five records of
monthly temperature and precipitation summarizing
the overall ring width vs climate relationships June
temperature was found to be significant when using the
Naryan Mar record ndash the closest meteorological station
located 225 km from the study site The only significant
positive response to December temperature was found
for Salekhard (400 km from the site) Correlation coeffi-
cients with summer temperature (defined as the June to
August average) for a set of climate stations covering
the 62-year period 1942ndash2004 were extremely high
(r407 at distances up to 300 km Table 3A) Omsk
summer temperatures in the southern Ural Region
were very highly related to the chronology despite this
station being some 1650 km distant from the sample
sites Correlations between STD32 and gridded summer
Rin
g-w
idth
inde
x
Sam
ple
num
ber
Tem
pera
ture
(degC
)
Year
(a)
(b)
Fig 3 (a) Salix lanata ring width STD32 ndash continuous line standardized with a 32 years smoothing spline ndash and RCS ndash dashed line
standardized with the regional curve standardization procedure ndash chronologies period 1942ndash2005 (see Materials and methods for further
explanation) Sample depth (number of individuals) is shown as a filled grey area Note the clear low frequency component in the
chronology obtained by RCS specifically designed to preserve it suggesting a significant increase in Salix lanata growth for the period
1942ndash2005 (b) summer season (defined as JunendashAugust average) temperature series for a coastal lowland (Marre Sale ndash 69721N 66821E
lower) an interior lowland (Naryan Mar ndash 67631N 53031E middle) and an upland interior (Salekhard ndash 66531N 66671E upper)
meteorological stations close to the studied stand for the same period 1942ndash2005 obtained from the National Climatic Data Center
(NCDC httpwwwncdcnoaagovoancdchtml see Materials and methods) Linear fits their equations and the trend-associated
P-values are displayed Note the lower coastal temperatures and the fact that the positive trend for summer temperature in Salekhard
(upland interior) is remarkably similar to that of the RCS chronology
T U N D R A S H R U B S T R A C K R U S S I A N A R C T I C WA R M I N G 1547
r 2009 Blackwell Publishing Ltd Global Change Biology 16 1542ndash1554
temperature data for 1948ndash2005 are depicted in Fig 5
with very high coefficients occurring at long distances
especially towards the south-east into the West Siberian
Basin well into the boreal zone
Moreover our S lanata chronology consistently
showed a stronger summer temperature signal than
the network of northern boreal forest tree-ring chron-
ologies when tested against the set of climate stations
across Northern Russia for the common period 1942ndash
1990 (Table S1) Table 3B shows this in the case of the
Polar Urals L sibirica chronology well known to paleo-
climatologists and located 360 km south-east of our
sampling site
Fifteen-day NDVI values (1981ndash2005) peaked in the
second half of July (interpreted as peak total biomass)
and sharply dropped in the second half of September
being highest and lowest in the Regional-Upland and
Regional-Lowland zones respectively (Fig 6a) NDVI
values for the Site area (256 km2) were closer to the
Regional-Upland NDVI values Relationships between
NDVI and temperature for a set of stations located
within a radius o400 km from the site peaked in the
second half of June (interpreted as peak productivity)
but were high since the second half of May when
significant snow cover remains on the ground but Salix
spp are already experiencing bud-break and the first
leaves begin to emerge from the snow-free portions of
the canopy Figure 6b shows the correlation patterns
between NDVI and the Naryan Mar record which were
exactly the same when using the other meteorological
stations (not shown) Finally NDVI values for the first
half of July had higher correlations with June T sug-
gesting a 1ndash2 week lag between T and NDVI (not
shown)
Shrub annual growth strongly correlated to summer
(especially the first half of July but also the second)
NDVI values (Fig 6c 1981ndash2005) Correlation coeffi-
cients were highest for the Regional-Upland area and
lowest for the Regional-Lowland NDVI although the
patterns were the same for all areas The stronger link
between shrub radial growth and Regional-Upland
NDVI with respect to Site NDVI might be due to the
relatively low aerial coverage of erect willow shrub
habitat within the Site area (Fig 2)
The application of the RCS method successfully pre-
served mid- to low-frequency components of shrub
growth RCS curve shows a clear lower frequency
component that indicates a significant increase in
Table 2 Salix lanata ring width chronology statistics
Time span
EPS485 since nc (ns) rg (SD) t (SD) r
Raw data
1921ndash2005 1942 119 (40) 0682
(0363)
51 (12) 0734
MS SD r1
Standard chronology
0416 0359 0075
MS SD
Residual chronology
0409 0363
EPS VarPC1 SNR
Period 1942ndash2005 (Detrended Series)
0958 0552 2297
EPS Expressed Population Signal nc number of cores ns
number of shrub individuals rg mean radial growth (mm)
SD standard deviation t mean series length (years) r mean
correlation between individual and mean chronology MS
mean sensitivity r1 first-order autocorrelation SNR signal-
to-noise ratio which is a measure of the common variance in a
chronology scaled by the total variance of the chronology
VarPC1 variance explained by the first principal component
Table 3 (A) Pearsonrsquos correlation coefficients between
S lanata residual ring width chronology and summer tem-
perature (defined as the June to August average) for 12 climate
stations covering the 62-year period 1942ndash2004 (see Fig 1) (B)
Pearsonrsquos correlation of Polar Urals L Sibirica ring with
residual chronology (Polar Urals see text) and S lanata residual
ring width chronology vs summer temperature for the stations
in (A) covering the period 1942ndash1990
Station
A B
r (r2) x (km)
Polar
Urals S lanata
Naryan Mar 0721 (0520) 225 034 067
Marre Sale 0701 (0491) 300 053 065
Salekhard 0591 (0350) 400 032 056
Arkhangelsk 0280 (0078) 880 001 03
Tarko Sale 0551 (0304) 930 039 052
Khanty
Mansisk
0537 (0288) 950 045 048
Vytegra 001 (0000) 1290 009 012
Vologda 0047 (0002) 1320 008 017
Kazan 0165 (0027) 1475 001 025
Omsk 0535 (0286) 1650 047 05
Khatanga 0016 (0000) 1700 003 007
Moscow 0162 (0026) 1725 017 001
Significant at Po001
Significant at Po005
x distance to the study site r Pearsonrsquos correlation coefficient
r2 variance explained
1548 B C F O R B E S et al
r 2009 Blackwell Publishing Ltd Global Change Biology 16 1542ndash1554
S lanata L radial growth along the study period
(Fig 3a) in a similar manner to summer season tem-
peratures in meteorological stations located in the
Regional-Upland area (Fig 3b)
Discussion
Results show that S lanata ring width growth in north-
ern Russia is strongly related with summer tempera-
ture as well as with NDVI Although the present study
was conducted on a single site the large areas over
which the chronology is related to both instrument and
proxy climate records suggest that it is regionally
representative Assuming these solid relationships to
be causal the results would indicate that summer
warming has enhanced deciduous shrub growth which
in turn has been responsible for the observed increases
in NDVI
Growth in arctic vegetation is generally expected to
increase under a warming climate (ACIA 2005 Chapin
et al 2005 Walker et al 2006 IPCC 2007) This greening
within the tundra biome contrasts with a relative brown-
ing in the boreal forest zone (Goetz et al 2005 Verbyla
2008) Remote sensing evidence for the widespread
greening comes largely from North America (Sturm
et al 2001 Goetz et al 2005 Tape et al 2006 Verbyla
2008) Dendrochronological data relevant to the lsquodiver-
gence problemrsquo ndash ie divergent trends of temperature
and tree growth in much of the circumboreal coniferous
forest ndash derive from both North American and Eurasian
taiga regions (Shiyatov et al 1996 Briffa et al 1998
Lopatin et al 2006 DrsquoArrigo et al 2008) To date net
increases in tundra phytomass detected by various
remote sensing procedures are widely attributed to
the contribution from erect deciduous shrubs a key
plant functional group of which Salix spp comprise one
the largest components north of the latitudinal treeline
The main driver for this woody encroachment into
tundra areas is presumed to be recent decadal climatic
warming (Sturm et al 2001 Bunn et al 2005 Goetz
et al 2005 Raynolds et al 2008) Deciduous shrubs
have been demonstrated to respond to experimental
and observed increases in summer temperature at Too-
lik Lake Alaska (Chapin et al 1995 Hobbie amp Chapin
1998 Wahren et al 2005) It remains nonetheless diffi-
cult to confirm the extent of large-scale vegetation
changes across the circumpolar Arctic (Callaghan
et al 2005) although there is strong indication from
the International Tundra Experiment for warming-re-
lated shrub increases well beyond Alaska (Walker et al
2006) Based on these findings Verbyla (2008) specu-
lates that the observed increase in annual maximum
Fig 4 Averaged response function coefficients for Salix lanata residual ring width chronology vs monthly temperature (right T) and
precipitation (left P) over five meteorological stations within the area (distances up to 400 km) obtained from the National Snow and Ice
Data Center (NSIDC see Materials and methods) Naryan Mar Pechora Ra Iz Salekhard and Ust Kara Response function coefficients
calculated separately for each meteorological station (not shown) resulted in the same overall pattern Analyses were performed from
September before the growing season to current August for the period 1961ndash2000 for which there is available T and P monthly
meteorological data Months abbreviated with capital letters correspond to the year previous to the growing season Positive (negative)
coefficients indicate positive (negative) ring-width vs climate relationships Fractions in the upper part of the plot indicate the number of
times the response coefficients were found significant (Po005) for example 45 in August T means that the relationship between ring-
width and August T was found significant when analyzed against four out of the five climate records used No fraction is displayed
when no significant coefficients were found
T U N D R A S H R U B S T R A C K R U S S I A N A R C T I C WA R M I N G 1549
r 2009 Blackwell Publishing Ltd Global Change Biology 16 1542ndash1554
NDVI in arctic Alaska and adjoining Canada may be
due to an increase in height and cover of shrubs and
graminoids Similarly Raynolds et al (2008) conclude
that increases in NDVI are also likely to occur where
vegetation physiognomy changes to include larger
plant life forms such as the boundaries between gra-
minoids and erect shrubs This study presents the first
complete chronology from an erect deciduous tundra
shrub detailing a response function that relates shrub
growth summer temperature and NDVI
Our results demonstrate that shrub ring width in an
abundant tundra willow with a nearly circumpolar
distribution is strongly related to summer temperature
for the period 1942ndash2005 Remarkably high correlations
occur at large distances across the tundra and taiga
zones of Eastern Europe and the West Siberian Basin
mirroring the large spatial correlation of summer tem-
peratures in this area Correlations with Summer T are
consistently higher than those used for boreal forest
temperature reconstructions in Eurasia (eg Grudd
et al 2002 Hantemirov amp Shiyatov 2002 Helama
et al 2002) comparable only with a study with the
evergreen arctic shrub Empetrum hermaphroditum Lange
ex Hagerup in the mountains of central Norway (Bar
et al 2007) We also found a clear relationship with
NDVI for upland vegetation at a regional scale for the
period 1981ndash2005 confirming a parallel greening trend
reported for similarly warming portions of arctic North
America (Jia et al 2003 Goetz et al 2005 Verbyla
2008) Despite the inherent difficulties in preserving
the low-frequency component of a ring width chronol-
ogy while efficiently removing its age-related trend the
RCS growth curve suggests a significant increase in
willow growth over the last six decades parallel to
the summer temperature increase for the region
(NASA-GISS 2009 most visible in the stations located
in the upland tundra and least visible in the coastal
areas) These findings are in line with studies that have
surmised an increase in the height and cover of erect
shrubs as a key component of the reported tundra green-
ing signal detected via NDVI since the early 1980s (Jia
et al 2003 Tape et al 2006 Walker et al 2006 Raynolds
et al 2008 Verbyla 2008) Furthermore the growth trend
agrees with observations by the indigenous Nenets here
and on neighboring Yamal Peninsula concerning recent
increases in willow height and abundance (Forbes amp
Stammler 2009) Their local observations provide an
independent source of qualitative knowledge that help
Fig 5 Correlation map between Salix lanata ring width residual chronology and summer temperature over North-Western Eurasia
Data consists on June to August mean surface temperature from a 251 latitude per 251 longitude grid obtained from the NCEP
Reanalysis database (httpwwwcdcnoaagov see Materials and methods) Time period is 1948ndash2005 Location of the Salix lanata
chronology is shown as a white filled square Note the high correlations occurring at long distances especially towards the southeast into
the West Siberian Basin well into the boreal zone
1550 B C F O R B E S et al
r 2009 Blackwell Publishing Ltd Global Change Biology 16 1542ndash1554
to confirm not only the quantitative data but also their
social-ecological relevance since changes in shrub
height and phytomass have direct and indirect impacts
on their livelihood For example herders note that
when the tallest shrubs exceed the antler height of
standing reindeer animals can disappear from sight
when browsing within thickets and subsequently be
lost during migration (Forbes amp Stammler 2009)
Before the present investigation the most direct evi-
dence for a regional response derived largely from a
time series air photo analysis of increasing shrub abun-
dance over a 50-year period on the Alaskan North Slope
(Sturm et al 2001 Tape et al 2006) That particular
study is cited in support of a number of recent remote
sensing analyses examining the broader scale relation-
ship between summer warmth tundra greening and
NDVI in North America (Walker et al 2002 Jia et al
2003 2006 Goetz et al 2005 Raynolds et al 2006 2008
Tape et al 2006) Together these analyses rest on the
reasonable assumption that temporal changes to NDVI
resulting from climate change might replicate the dif-
ferences that occur along spatial climate gradients be-
cause increased warming is expected to enhance shrub
growth (Walker et al 2002) Satellite-based analyses
have found that the amount of shrubs is strongly
spatially correlated with NDVI and summer warmth
particularly in acidic tundra arguably making it a
meaningful indicator of aboveground plant biomass at
both local and regional scales (Walker et al 2002
Raynolds et al 2006 2008) In support of this field-
based work employing hand-held sensors recently de-
termined that shrub phytomass especially its live foliar
(a)
(b) (c)
Fig 6 (a) Average 15-day NDVI values indicating peak total biomass in the second half of July Note that the highest and lowest overall
NDVI values correspond to the Upland and Lowland regions respectively (b) relationships between Regional 15-day NDVI and
monthly temperature for Naryan Mar meteorological station (as in Fig 1 obtained from the National Climatic Data Center ndash NCDC
httpwwwncdcnoaagovoancdchtml see Materials and methods) indicating peak productivity in the second half of June (c)
correlation between Salix lanata residual ring width chronology and 15-day NDVI values indicating a peak in the first half of July
Correlations computed from May to September (ie growing season) for the common period 1981ndash2005 NDVI regions black continuous
line Site black dashed line Regional grey continuous line Regional-Upland grey dashed line Regional-Lowland (see Fig 1 and
materials and data for definition and display of the areas)
T U N D R A S H R U B S T R A C K R U S S I A N A R C T I C WA R M I N G 1551
r 2009 Blackwell Publishing Ltd Global Change Biology 16 1542ndash1554
deciduous component was the major factor controlling
NDVI across a variety of northern Alaskan vegetation
types (Riedel et al 2005) Jia et al (2003) likewise
reported that 88 of the variance of deciduous shrub
foliar biomass was explained with ground-measured
NDVI Our data provide support for extending these
interpretations (1) retrospectively and (2) to the western
Eurasian Arctic which until now has lacked ground-
level quantification of a steady increase in willow shrub
growth to match the regionrsquos demonstrated warming
trend in recent decades
We have determined S lanata L to be a remarkably
high quality proxy for six decades of summer tempera-
ture over vast swaths of the tundra and taiga zones of
West Siberia and the East European Arctic The ob-
served higher performance of S lanata as a summer
temperature proxy at a regional scale when compared
with other high quality ring-width-based temperature
proxies further confirms this Given the divergence pro-
blem it is important to develop suitable archives for
reconstructing climate regimes in remote locations lack-
ing long-term meteorological records especially in the
tundra zone The lack of precipitation signal in the
presented S lanata chronology suggests that the drought
stress-caused temperature decoupling in boreal trees ndash
proposed as one of the main mechanisms for the
divergence problem (eg DrsquoArrigo et al 2008) ndash does
not affect this deciduous tundra shrub at least in the
studied area The ready preservation of shrub wood in
permafrost substrates (Shiyatov amp Hantemirov 2000)
and lakes coupled with the abundant and broad dis-
tribution of S lanata L makes this species an excellent
candidate for extending reliable climate reconstructions
much further into the past Although the sharp growth
releases experienced by S lanata individuals when
reaching the canopy within their respective thickets
implies potential difficulties in climate signal recovery
these are not insurmountable given a large number of
samples and the use of appropriate standardization
methods The strength of the regional relationship we
found between shrub growth and NDVI agrees well
with a recent circumpolar analysis (Raynolds et al
2006) Our analysis provides the best proxy assessment
to date that deciduous shrub phytomass has increased
significantly in response to an ongoing summer warm-
ing trend Furthermore the results fill an important gap
since ground-level data on decadal phytomass trends
are otherwise lacking for the Russian Arctic These
findings have relevance for tundra biodiversity surface
hydrology and feedbacks resulting in atmospheric
heating This is because an increase in shrub abundance
lies at the crux of a range of critical regime shifts in the
tundra biome including net ecosystem productivity
species loss snow cover and energy balance as driven
by albedo (ACIA 2005 Chapin et al 2005 Walker et al
2006 IPCC 2007) Given the vast expanses of shrub
tundra across northern Russia (Walker et al 2005) and
the large geographic range of S lanata L (Hulten amp
Fries 1986) additional chronologies from this species in
different landscapes would help to confirm if the trends
reported here are circumpolar
Acknowledgements
This research is a product of the ENSINOR project funded by theAcademy of Finlandrsquos lsquoRussia in Fluxrsquo program (Decision208147) Additional support came from the National ScienceFoundation Office of Polar Programs and the National Aero-nautics and Space Administration through the Northern Eur-asian Earth Science Partnership Initiative The EALAT project(Kautokeino Norway) contributed funds for the data analysisand write-up Pasha Groisman and Jiong Jia assisted respec-tively with obtaining Russian climate and corrected NDVI dataTimo Kumpula conducted ground truthing and calculated thesurface area of land cover classes The work of Marc MaciasFauria was funded by Professor EA Johnson at the Bio-geoscience Institute University of Calgary Canada
References
ACIA (2005) Arctic Climate Impact Assessment Cambridge University
Press Cambridge
Bar A Pape R Brauning A Loffler J (2007) Growth-ring variations of
dwarf shrubs reflect regional climate signals in alpine environments
rather than topoclimatic differences Journal of Biogeography 35
625ndash636
Beschel RE Webb D (1963) Axel Heiberg Island Preliminary Report 1961ndash
1962 pp 189ndash198 McGill University Montreal
Biondi F Waikul K (2004) DENDROCLIM 2002 a C 1 1 program for
statistical calibration of climate signals in tree-ring chronologies Com-
puters and Geosciences 30 303ndash311 doi 101016jcageo200311004
Bliss LC (1997) Arctic ecosystems of North America In Polar and Alpine
Tundra (ed Wielgolaski FE) pp 551ndash683 Elsevier Amsterdam
Briffa KR Jones PD Bartholin TS et al (1992) Fennoscandian summers
from AD 500 temperature changes on short and long timescales
Climate Dynamics 7 111ndash119
Briffa KR Schweingruber FH Jones PD Osborn TJ Shiyatov SG Vaganov
EA (1998) Reduced sensitivity of recent tree-growth to temperature at
high northern latitudes Nature 391 678ndash682
Bunn AG Goetz SJ Fiske GJ (2005) Observed and predicted responses of
plant growth to climate across Canada Geophysical Research Letters 32
L16710 doi 1010292005GL023646
Callaghan TV et al (2005) Arctic Climate Impact Assessment pp 243ndash352
Cambridge University Press Cambridge UK
Chapin FS III Shaver GR Giblin AE Nadelhoffer KJ Laundre JA (1995)
Responses of arctic tundra to experimental and observed changes in
climate Ecology 76 694ndash711
Chapin FS III Sturm M Serreze MC et al (2005) Role of land-surface
changes in Arctic summer warming Science 310 657ndash660
Cook ER Peters K (1981) The smoothing spline a new approach to
standardizing forest interior tree-ring width series for dendroclimatic
studies Tree-Ring Bulletin 41 45ndash53
DrsquoArrigo R Wilson R Liepert B Cherubini P (2008) lsquoOn the lsquodivergence
problemrsquo in northern forests a review of the tree-ring evidence and
possible causes Global Planetary Change 60 289ndash305
1552 B C F O R B E S et al
r 2009 Blackwell Publishing Ltd Global Change Biology 16 1542ndash1554
Esper J Cook ER Schweingruber FH (2002) Low-frequency signals in
long tree-ring chronologies for reconstructing past temperature varia-
bility Science 295 2250ndash2253 doi 101126science1066208
Forbes BC Stammler F (2009) Arctic climate change discourse the
contrasting politics of research agendas in the West and Russia Polar
Research 28 28ndash42
Forchhammer MC Christensen TR Hansen BU et al (2008) Zackenberg in
a circumpolar context Advances in Ecological Research 40 499ndash544
Fritts HC (1976) Tree Rings and Climate London Academic Press London
UK
Goetz SJ Bunn AG Fiske GJ Houghton RA (2005) Satellite-observed
photosynthetic trends across boreal North America associated with
climate and fire disturbance Proceedings of the National Academy of
Sciences 102 13521ndash13525
Grudd H Briffa KR Karlen W Bartholin TS Jones PD Kromer B (2002) A
7400-year tree-ring chronology in northern Swedish Lapland natural
climatic variability expressed on annual to millennial timescales
Holocene 12 657ndash665
Hantemirov RM Shiyatov SG (2002) A continuous multimillennial ring-
width chronology in Yamal northwestern Siberia Holocene 12
717ndash726 doi 1011910959683602hl585rp
Helama S Lindholm M Timonen M Merilainen J Eronen M (2002) The
supra-long Scots pine tree-ring record for Finnish Lapland Part 2
interannual to centennial variability in summer temperatures for 7500
years Holocene 12 681ndash687
Hobbie SE Chapin FS III (1998) The response of tundra plant biomass
aboveground production nitrogen and CO2 ux to experimental warm-
ing Ecology 79 1526ndash1544
Hulten E Fries M (1986) Atlas of North European Vascular Plants North of the
Tropic of Cancer Koeltz Scientific Konigstein
IPCC (2007) Climate Change 2007 Impacts Adaptation and Vulnerability
Cambridge University Press Cambridge
Jia GJ Epstein HE Walker DA (2003) Greening of arctic Alaska 1981ndash
2001 Geophysical Research Letters 30 31ndash33
Jia GJ Epstein HE Walker DA (2006) Spatial heterogeneity of tundra
vegetation response to recent temperature changes Global Change
Biology 12 42ndash55
Johnstone J Henry GHR (1997) Retrospective analysis of growth and
reproduction of Cassiope tetragona and relations to climate in the
Canadian High Arctic Arctic and Alpine Research 29 459ndash469
Jonsell B (ed) (2000) Flora Nordica 1 Lycopodiaceae ndash Polygonaceae Bergius
Foundation Stockholm
Kitti H Forbes BC Oksanen J (2009) Long- and short-term effects of
reindeer grazing on tundra wetland vegetation Polar Biology 32
253ndash261
Lopatin E Kolstrom T Spiecker H (2006) Determination of forest growth
trends in Komi Republic (northwestern Russia) combination of tree-
ring analysis and remote sensing data Boreal Environmental Research 11
341ndash353
Macias M Timonen M Kirchhefer AJ Lindholm M Eronen M Gutierrez
E (2004) Growth variability of Scots pine (Pinus sylvestris) along a west-
east gradient across northern Fennoscandia a dendroclimatic ap-
proach Arctic Antarctic and Alpine Research 36 565ndash574 doi 101657
1523-0430(2004)036[0565GVOSPP]20CO2
NASA-GISS (2009) NASA-Goddard Institute for Space Studies Surface Tem-
perature Analysis httpdatagissnasagovgistempmaps (accessed
14 January 2009)
Nikolaev AN Samsonova VV (2007) Proceedings International Conference on
Cryogenic Resources of Polar Regions pp 179ndash182 Russian Academy of
Sciences Puschino
Olofsson J Oksanen L Callaghan T Hulme PE Oksanen T Suominen O
(2009) Herbivores inhibit climate-driven shrub expansion on the tun-
dra Global Change Biology doi 101111j1365-2486200901935x
Podkorytov FM (1995) Reindeer Herding on Yamal Leningradskoi Atomoi
Electrostantsii Sosnovyi Bor (in Russian)
Ponomarev V Munsterman M Leummens H (eds) (2004) The Pechora
River Basin Russian Academy of Sciences Syktyvkar
Rayback SA Henry GHR (2006) Reconstruction of summer temperature
for a Canadian High Arctic site from retrospective analysis of the dwarf
shrub Cassiope tetragona Arctic Antarctic and Alpine Research 38
228ndash238
Raynolds MK Comiso JC Walker DA Verbyla D (2008) Relationship
between satellite-derived land surface temperatures arctic vegetation
types and NDVI Remote Sensing of Environment 112 1884ndash1894
Raynolds MK Walker DA Maier HA (2006) NDVI patterns and phyto-
mass distribution in the circumpolar Arctic Remote Sensing of Environ-
ment 102 271ndash281
Riedel SM Epstein HE Walker DA (2005) Biotic controls over spectral
reflectance of arctic tundra vegetation International Journal of Remote
Sensing 26 2391ndash2405
Schmidt NM Baittinger C Forchhammer MC (2006) Reconstructing
century-long snow regimes using estimates of High Arctic Salix arctica
radial growth Arctic Antarctic and Alpine Research 38 257ndash262
Shiyatov SG Hantemirov RM (2000) Tree-ring dating of scrub wood from
archeological settlement Yarte VI on Yamal Peninsula (in Russian w
English abstract) Dreynosti Yamala 1 112ndash120
Shiyatov SG Hantemirov RM Schweingruber FH Briffa KR Moell M
(1996) Potential long-chronology development on the northwest Siber-
ian Plain early results Dendrochronologia 14 13ndash29
Sturm M Racine C Tape K (2001) Increasing shrub abundance in the
Arctic Nature 411 546ndash547
Tape K Sturm M Racine CH (2006) The evidence for shrub expansion in
northern Alaska and the Pan-Arctic Global Change Biology 12 686ndash702
Tolmachev AI (2000) Flora of the Russian Arctic Vol III SalicaceaendashRanun-
culaceae English edn J Cramer Berlin
Tucker CJ Pinzon JE Brown ME et al (2005) An Extended AVHRR 8-km
NDVI data set compatible with MODIS and SPOT vegetation NDVI
data International Journal of Remote Sensing 26 4485ndash5598
Verbyla D (2008) The greening and browning of Alaska based on 1982ndash
2003 satellite data Global Ecology and Biogeography 17 547ndash555
Wahren C-HA Walker MD Bret-Harte MS (2005) Vegetation responses
in Alaskan arctic tundra after 8 years of a summer warming and
winter snow manipulation experiment Global Change Biology 11 537ndash
552
Walker DA (1987) Height and growth rings of Salix lanata ssp richardsonii
along the coastal temperature gradient of northern Alaska Canadian
Journal of Botany 65 988ndash993
Walker DA Epstein HE Jia JG et al (2002) Phytomass LAI and NDVI in
northern Alaska relationships to summer warmth soil pH plant
functional types and extrapolation to the circumpolar Arctic Journal
of Geophysical Research doi 1010292001JD000986
Walker DA Raynolds MK Daniels FJA et al (2005) The circumpolar arctic
vegetation map Journal of Vegetation Science 16 267ndash282
Walker MD Wahren CH Hollister RD et al (2006) Plant community
responses to experimental warming across the tundra biome Proceed-
ings of the National Academy of Sciences 103 1342ndash1346
Wigley TML Briffa KR Jones PD (1984) On the average value of
correlated time series with applications in dendroclimatology and
hydrometeorology Journal of Climate and Applied Meteorology 23
201ndash221
Woodcock H Bradley RS (1994) Salix arctica (Pall) its potential for
dendroclimatological studies in the High Arctic Dendrochronologia
12 11ndash22
Zalatan R Gajewski K (2006) Dendrochronological potential of Salix
alaxensis from the Kuujjua river area Western Canadian Arctic Tree-
Ring Research 62 75ndash82
T U N D R A S H R U B S T R A C K R U S S I A N A R C T I C WA R M I N G 1553
r 2009 Blackwell Publishing Ltd Global Change Biology 16 1542ndash1554
Supporting Information
Additional Supporting Information may be found in the online version of this article
Figure S1 Individual ring width measurements (mm) of Salix lanata at the study site in Eastern European Arctic The arithmetic
mean of all the individual series is shown as a thick black line to illustrate the overall growth pattern more clearly Note the char-
acteristic age-related trend with suppressed growth in the early years followed by a relatively sharp growth increase The vertical red
line marks the year 1942 from which the chronology has enough sample depth to be considered reliable (see Materials and Methods
and Results)
Figure S2 Thin black line is the average ageing curve resulting from all the Salix lanata ring-width cores aligned by age A 32-year
cubic spline function with 50 percent cut-off was fitted to the averaged series (thick black line) representing the Regional Growth
Curve
Table S1 Pearson correlation coefficients between the network of northern boreal forest tree-ring width chronologies developed by F
Schweingruber (see Fig 1 Table 1) and the average temperature for June to August from a network of meteorological stations in
northern Russia (see Fig 1 Table 3) Correlations computed over the common period 1942ndash1990 Significant coefficients (po005) are
shown in bold The last line shows ring-width vs summer T correlations for the S lanata chronology created in the present study
Note the overall higher coefficients shown by the S lanata chronology
Please note Wiley-Blackwell are not responsible for the content or functionality of any supporting materials supplied by the authors
Any queries (other than missing material) should be directed to the corresponding author for the article
1554 B C F O R B E S et al
r 2009 Blackwell Publishing Ltd Global Change Biology 16 1542ndash1554
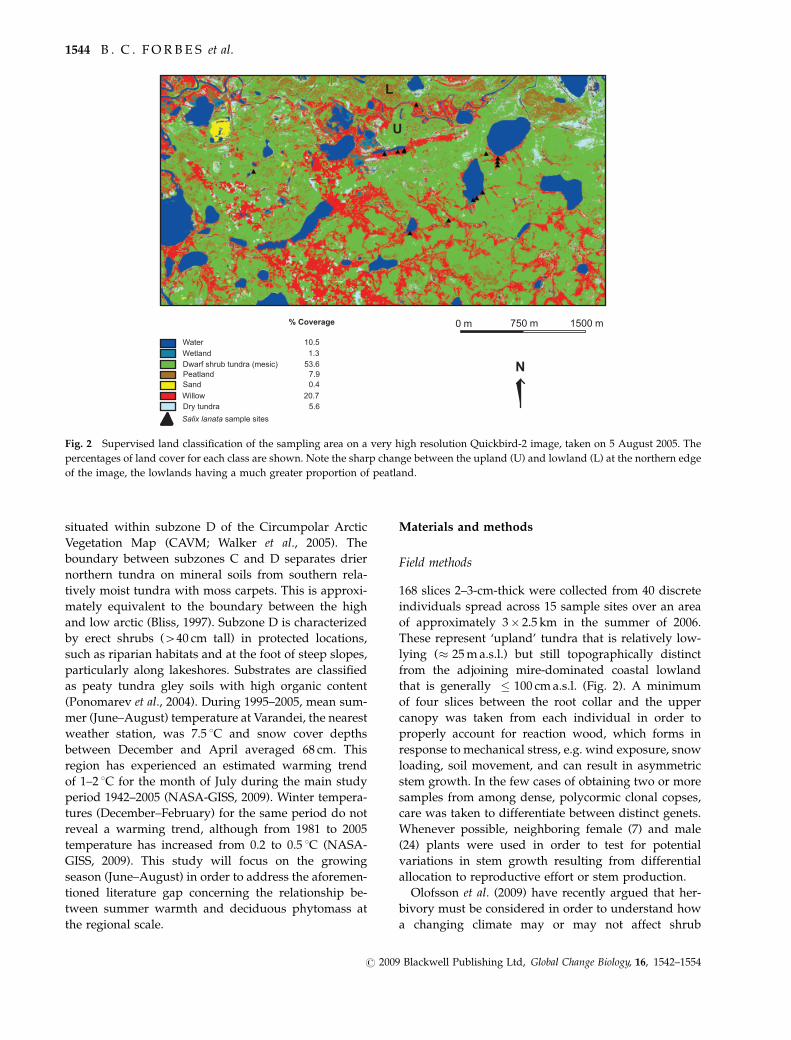
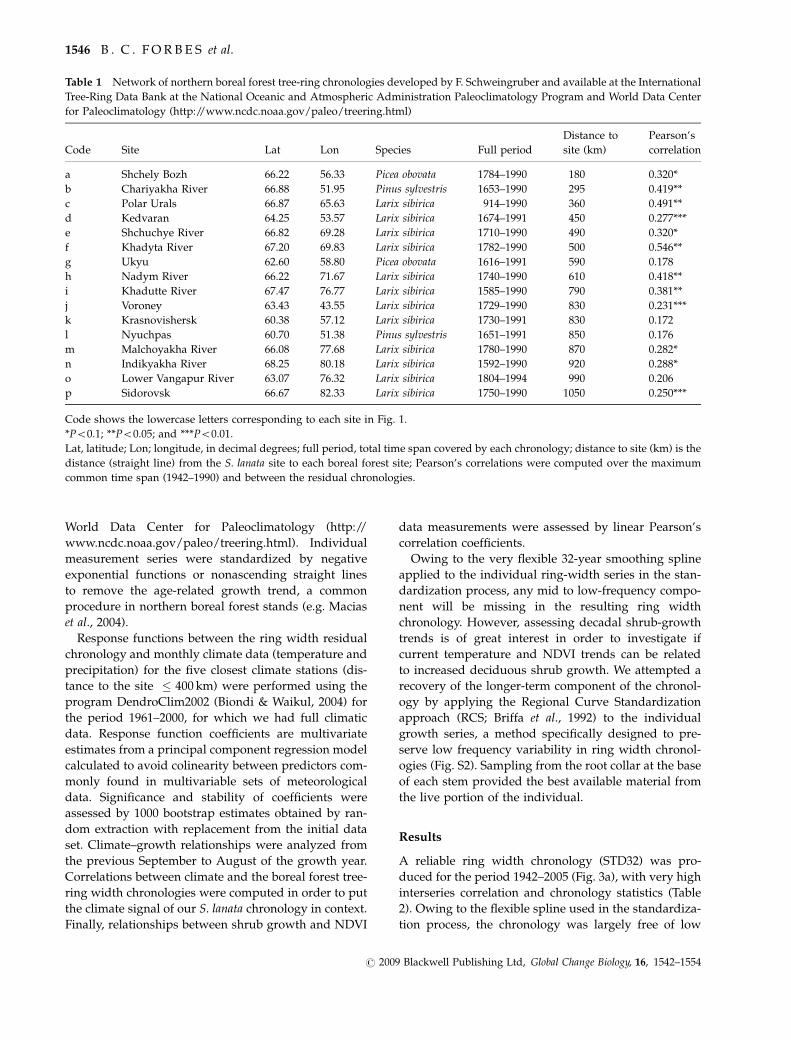
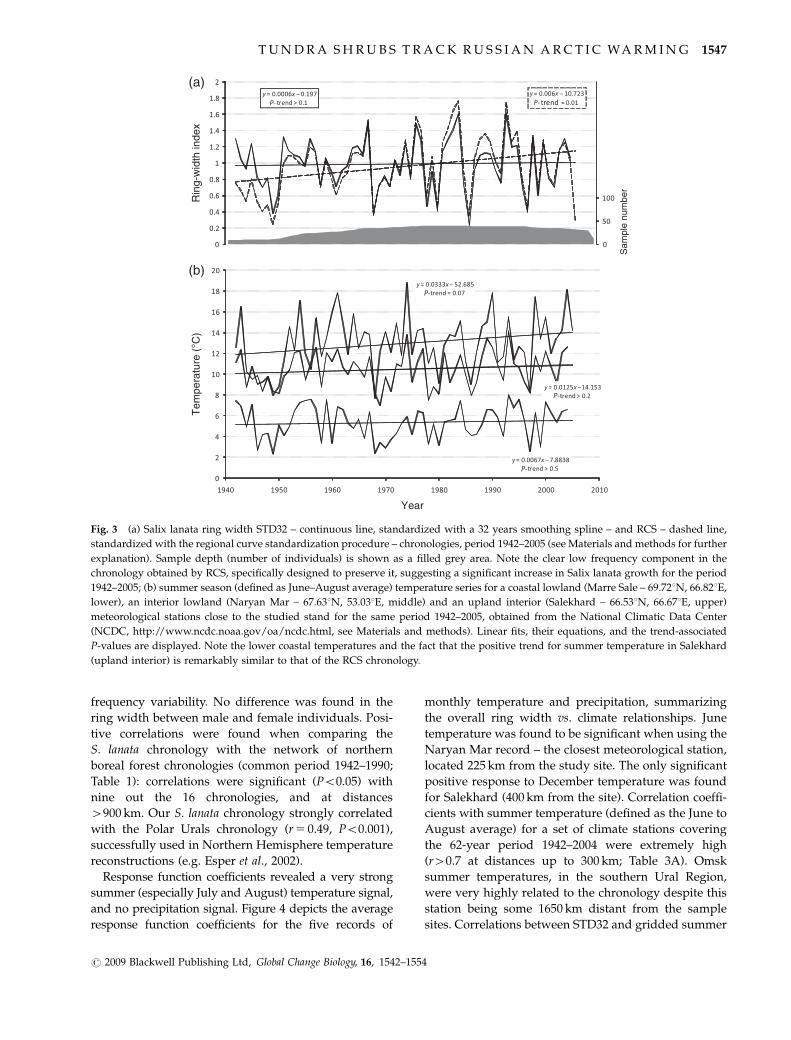
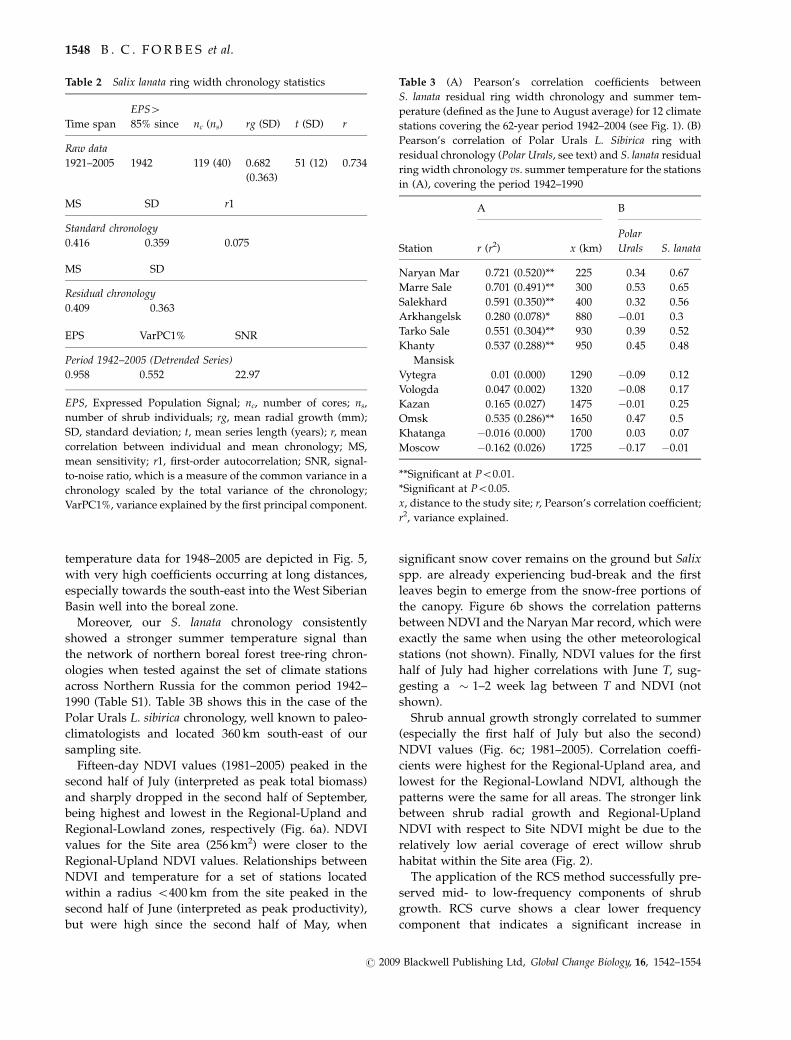
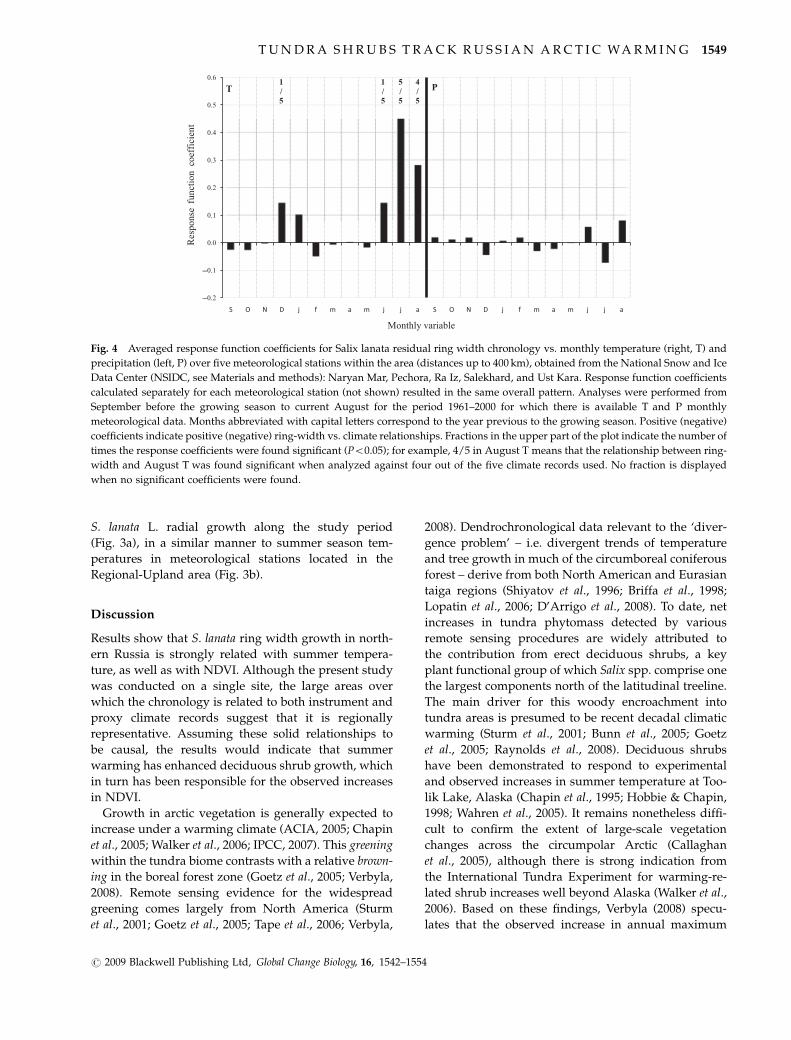
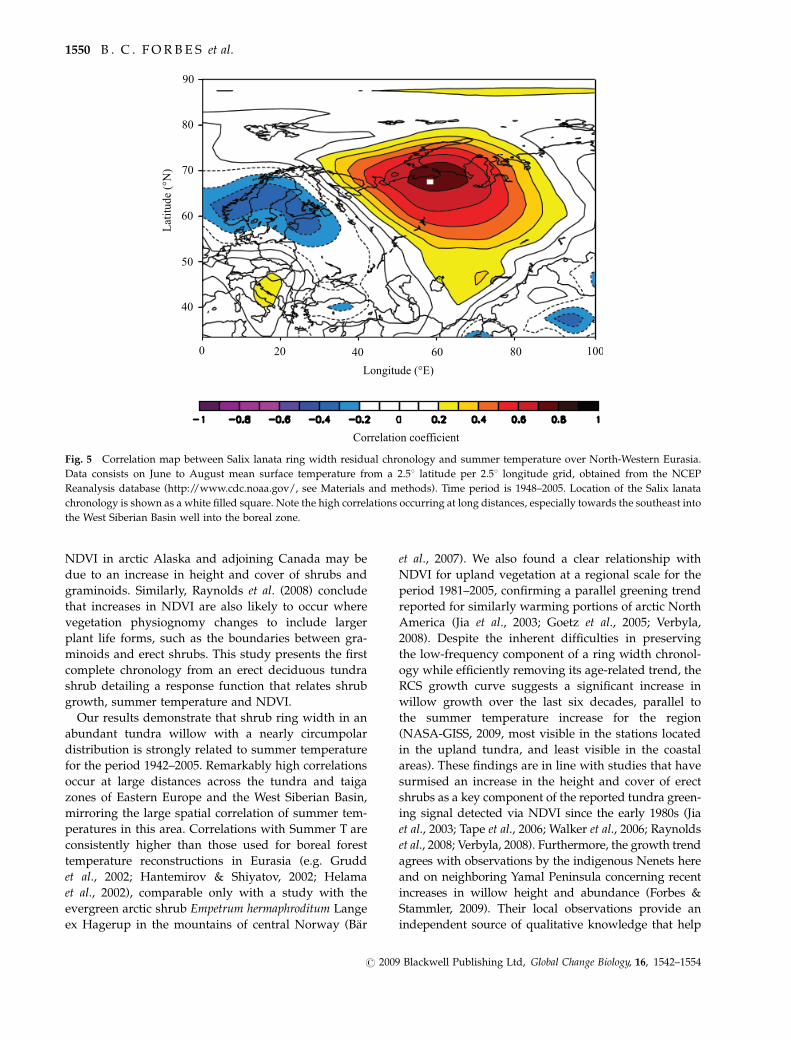