russian agri-food economy: today and tomorrow eugenia serova analytical centre for agri-food...
TRANSCRIPT

Russian Agri-Food Economy: Russian Agri-Food Economy: Today and TomorrowToday and Tomorrow
Eugenia SerovaAnalytical Centre for Agri-Food
EconomicsMoscow
http://www.iet.ru/afe

Major results of the agrarian reforms in the 1990s dynamics farms structure land tenure competitiveness agrarian policy
Prospective and problems policy, WTO rural development R&D

DynamicsDynamicsGrowth Rate of GAO
-15
-10
-5
0
5
10
1985
1990
1991
1992
1993
1994
1995
1996
1997
1998
1999
2000
2001
2002
2003
2004
I-IX
2005

DynamicsDynamicsGrowth Rate in Food Industry
-16
-6
4
14
1986
-199
0 1991
1992
1993
1994
1995
1996
1997
1998
1999
2000
2001
2002
2003
2004
I-IX
2005

DynamicsDynamicsAgri-Food Trade
- 15000
-10000
-5000
0
5000
10000
15000
1994 1995 1996 1997 1998 1999 2000 2001 2002 2003 2004US
$ m
io
export import balance

Farms structureFarms structureLand use shares by type of farms, %
98%
0% 2% Enterprises
Farmers
Hoseholds
86%
8%6%
1990 2000

Farms structureFarms structureGAO shares by type of farms, %
69%
31%
0%Enterprises
Households
Farmers 45%
51%
4%
1990 2000

Farms structureFarms structureVolume index of agricultural production, 1990=100%
0
20
40
60
80
100
120
19
90
19
92
19
94
19
96
19
98
20
00
20
02
%
Large-scale farms Households
0
20
40
60
80
100
1990
1992
1994
1996
1998
2000
2002
%
Share in GAO (nominal prices), %

Farms structureFarms structureFarm Production Concentration
0
10
20
30
40
50
60
70
80
90
100
0 10 20 30 40 50 60 70 80 90 100% farms
sh
are
in
sa
les
,%
2001
1995

Farms structureFarms structure Frequency of cost production of grain in Rostov area, RUR/t

Farms structureFarms structure Agroholdings in 2002-2003 (survey of IKAR)
Number of agroholdings 133
Land per agroholding, ‘000 ha 56.4
Number of farms per agroholding 9
Land per farm, ‘000 ha 6.6
Sales per agroholding, USD mln. ~20
Sales per farm, USD mln. ~2
Sales per ha, USD ~400

Farms structureFarms structure Distribution of households by gross ag. output, one rayon
case
25000
50000
75000
100000
125000
150000
175000
200000
225000
250000
0 1000 2000 3000 4000 5000 6000 7000 8000
households
‘000
RU
R

Land tenureLand tenure
29%
2%
69%
individual
legal entities
state&municipal
farmlands
Property titles for agricultural lands and farmlands, 2001
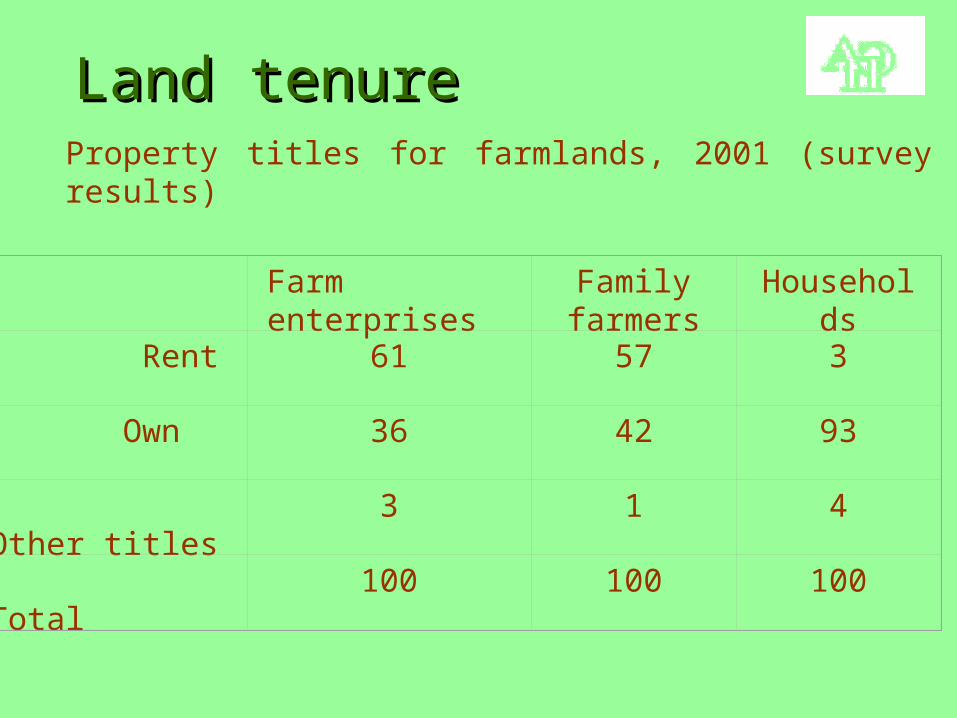
Land tenureLand tenureProperty titles for farmlands, 2001 (survey results)
Farm enterprises
Family farmers
Households
Rent 61 57 3
Own 36 42 93
Other titles
3 1 4
Total 100 100 100

CompetitivenessCompetitiveness
020406080
100120
1992 1993 1994 1995 1996 1997 1998 1999 2000 2001 2002 2003 2004
051015202530
grain (left axis) sugar beet sunflower

CompetitivenessCompetitiveness
892
18%
766
17%
748
17%
690
15%630
13%
690
13%859
15%
1068
16%0
1000
2000
3000
4000
5000
6000
7000
1994 1995 1996 1997 1998 1999 2000 2001
'00
0 t
Poultry Cattle Pigs Sheep &goats Other

CompetitivenessCompetitivenessProduction cost distribution, mode

CompetitivenessCompetitivenessAgri-food exports
0
500
1000
1500
2000
2500
3000
1994 1995 1996 1997 1998 1999 2000 2001 2002 2003 2004
US
D m
io

CompetitivenessCompetitivenessGrain Exports
0
2000
4000
6000
8000
10000
12000
14000
1994 1995 1996 1997 1998 1999 2000 2001 2002 2003 2004
barley wheat
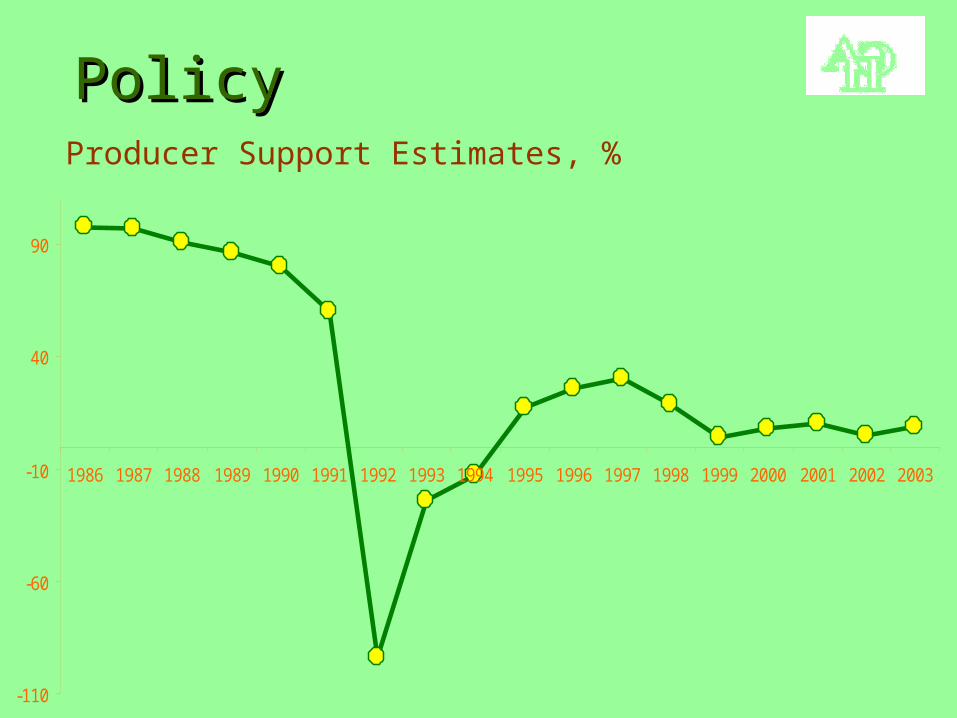
PolicyPolicy
-110
-60
-10
40
90
1986 1987 1988 1989 1990 1991 1992 1993 1994 1995 1996 1997 1998 1999 2000 2001 2002 2003
Producer Support Estimates, %

PolicyPolicyImport Tariff, AVE %
0
5
10
15
20
25
30
35
40
45
50
poul
try
red
mea
t
red
mea
t
fish
dairy
cear
eals
cere
als
flour
oil s
eeds
caca
o
past
a
vega
tabl
es
beve
arge
s
TRQ: beef and pork
Volume quota: poultry
Variable import duty: sugar

PolicyPolicyImport Tariff Structure
USAUSA EU-15EU-15 JapanJapan BrazilBrazil MexicoMexico KenyaKenya IndiaIndia RussiaRussia
MeanMean 11.9 20.5 80.1 35.6 44.4 100 116 13
MedianMedian 3.8 10.9 12 35 36 100 100 15
MinMin 0 0 0 0 0 100 10 0
MaxMax 378.7 218.5 2553.6 55 450.7 100 300 50
Std. Std. deviationdeviation
33 29.4 203.3 11.2 42.1 0 52.5 9
# of tariff # of tariff lineslines
1769 2200 1806 942 1080 665 690 847

PolicyPolicyAg. Budget Structure
0% 20% 40% 60% 80% 100%
2001
2002
2003
2004
Federal Regional Local

PolicyPolicyAg. Budget Dynamic, RUR
-
10 000,00
20 000,00
30 000,00
40 000,00
50 000,00
2000 2001 2002 2003 2004
Federal Consolidated

PolicyPolicyGreen Box Meqasures
0% 20% 40% 60% 80% 100%
1995
1996
1997
1998
1999
%
0,23
0,23
0,55
1,28
0,21
0,34
2,01
0,83
0,62
0,27
0,25
-0,80 0,20 1,20 2,20
Australia
Czech
Island
Korea
New Zealand
Norway
Poland
Switzerland
USA
OECD
Russia

Prospective and problemsProspective and problems
WTO Accession Rural Development Research Human Capital