rural urban differences in learning outcome
TRANSCRIPT

M O N I T O R I N G L E A R N I N G A C H I E V E M E N T ( M L A ) I N R I V E R S S T A T E
P U B L I C S C H O O L S
V o l u m e I I I :
Rural-Urban Differences in Learning Outcome
Final Report
Prepared for: Rivers State Ministry of Education.
By: Arbitrage Consult Ltd
October, 2013.
“Education is the most powerful weapon with which you can change the world”
Nelson Mandela

October 31, 2013
[MONITORING LEARNING ACHIEVEMENT (MLA) IN RIVERS STATE PUBLIC SCHOOLS]
Page | 2 [email protected]
Contents Acronyms ............................................................................................................................................................. 4
Executive Summary ............................................................................................................................................. 5
Chapter 1 ............................................................................................................................................................. 6
Introduction: .................................................................................................................................................... 6
1.1. Preamble.......................................................................................................................................... 6
1.2. Importance of Monitoring Learning Outcomes ............................................................................... 6
1.3. Learning Outcomes Differential ...................................................................................................... 7
1.4. Rural-Urban Dichotomy in learning Outcomes ............................................................................... 7
1.5. Methodology ................................................................................................................................... 8
1.6. Nature of the Problem ..................................................................................................................... 8
1.7. Aim ................................................................................................................................................... 8
1.8. Objectives ........................................................................................................................................ 8
1.9. Research questions .......................................................................................................................... 9
1.10. Hypothesis to be tested ............................................................................................................... 9
1.11. Significance of the Study ............................................................................................................. 9
1.12. Organization of Study .................................................................................................................. 9
Chapter 2 ........................................................................................................................................................... 10
2.0 Review of Rural-Urban Dichotomy from other Countries .................................................................. 10
2.1. What is Rural-Urban Dichotomy? .................................................................................................. 10
2.2. Why is this Important in Learning Outcomes? .............................................................................. 11
2.3. Rural-Urban Variation in Examining Student Learning Outcomes ................................................ 12
2.4. Rural-Urban learning outcomes and the Quality of Education ..................................................... 12
2.5. Why focus on Rural-Urban differences in learning outcomes? .................................................... 13
2.6. Economic Conditions, Rural-Urban Dichotomy and Learning outcomes ...................................... 13
Chapter 3 ........................................................................................................................................................... 14
Methodology and Analysis ............................................................................................................................ 14
3.1. Scope ............................................................................................................................................. 14
3.2. Sample Selection ........................................................................................................................... 14
3.3. Data Source and sample size ......................................................................................................... 14
3.4. Challenges ...................................................................................................................................... 15
3.5. Statistical Tests of Significance ...................................................................................................... 16
3.6. Data Analysis Framework .............................................................................................................. 16
Section one (primary schools data analysis) ............................................................................................. 18

October 31, 2013
[MONITORING LEARNING ACHIEVEMENT (MLA) IN RIVERS STATE PUBLIC SCHOOLS]
Page | 3 [email protected]
Section two (secondary schools data analysis). ........................................................................................ 27
Chapter 4 ........................................................................................................................................................... 36
Benchmarking Rural and Urban Schools Performances against Mastery Levels. ......................................... 36
4.1. Introduction: .................................................................................................................................. 36
4.2. Why the idea of Minimum Mastery Level or Minimum Levels of Learning? ................................ 36
4.3. Learning Continuum ...................................................................................................................... 37
4.4. Criterion-referenced Assessment .................................................................................................. 37
4.5. Are Urban Schools better than Rural Schools in Terms of Learning Outcomes? .......................... 45
Chapter 5 ........................................................................................................................................................... 47
Summary and Conclusion .......................................................................................................................... 47
Recommendation ...................................................................................................................................... 47
REFERENCES ...................................................................................................................................................... 48
APPENDIX 1: Rural Schools performances against Rural and State Mean Scores............................................. 50
APPENDIX 2: Urban Schools performances against Urban and State Mean Scores ......................................... 53

October 31, 2013
[MONITORING LEARNING ACHIEVEMENT (MLA) IN RIVERS STATE PUBLIC SCHOOLS]
Page | 4 [email protected]
Acronyms ACT- American College Testing ANOVA – Analysis of Variance DML – Desired Mastery Level EFA-FTI – Education for All – Fast Track Initiative LEA – Local Education Authority LGAs – Local Government Areas MDG – Millennium Development Goals MLA – Monitoring Learning Achievement MML – Minimum Mastery Levels

October 31, 2013
[MONITORING LEARNING ACHIEVEMENT (MLA) IN RIVERS STATE PUBLIC SCHOOLS]
Page | 5 [email protected]
Executive Summary For quite some time, a general perception of the comparative inferiority of rural schools has prevailed. This
view implies the existence of rural-urban differences in students' academic performance. The general
perception of rural-urban differences extends as well to many other socially desirable outcomes, such as
aptitude, intelligence, and aspiration. This study examined differences in learning achievement among rural
and urban school students.
Of the 916 public primary schools, 386 were located in the 9 rural LGAs while 530 were located in
the remaining 14 urban LGAs. On the other hand, of the 293 public secondary schools, 141 were
located in the 9 rural LGAs while 152 were located in the 14 remaining urban LGAs.
Out of the 13,740 pupils sampled at primary 4 schools level, 5,595 were from the rural schools and
8,145 were from the urban schools. From the 4,395 JSS 2 students sampled, 2,115 were rural
students while 2,280 were urban students.
Performance comparisons were made for rural-urban representative samples in Literacy, Numeracy,
Life Skills, English, Mathematics and General Science respectively.
This research found that rural schools pupils performed relatively better than their urban peers in Literacy
and Life Skills as did rural schools students in General Science, whereas urban schools pupils performed
relatively better than their rural counterparts in Numeracy as did urban schools students in Mathematics.
Interestingly and worthy of note, is that in English Language the urban schools students performed
considerably better than their rural counterparts and this is guaranteed based on the findings of this study if
the JSS 2 students are subjected to similar conditions.
So, we may conclude that at the primary level, rural pupils have maintained a very high level of competence
relative to their urban counterparts having surpassed them in Literacy and Life Skills similar to findings of
Alspaugh, 1992; Alspaugh & Harting, 1995; and Haller et al., 1993.
However, rural students need to show greater level of performance at JSS 2 level in Mathematics, and most
especially in English Language where the difference is considerably significant when compared to studies by
(Coe, Howley & Hughes, 1989a; Edington & Koehler, 1987; Greenberg & Teixeira, 1995; and Lindberg,
Nelson, & Nelson, 1985).
The findings of this study provide sufficient evidence that, all things being equal, rural students suffer
disadvantage in English Language simply as a result of their residence in rural areas or their attendance at
rural schools.
Therefore, policy should focus on how to further improve performance in English Language and
Mathematics at the secondary school level in rural areas. And to maintain rural schools’ competence at the
primary schools’ level in Literacy, Life Skills, as well as a deliberate push in numeracy. A derived criterion-
referenced assessment was used to map performance of rural-urban pupils and students. Based on the
criterion-referenced assessment, the state policy should now target the desired mastery level (DML) for
each learning domain for rural and urban located schools. It should also be a matter of policy to undertake
an upward review of the desired mastery level periodically. A periodic Monitoring Learning Achievement
(MLA) assessment will indicate progress being made toward achieving the target or desired mastery level
score in each learning domain.

October 31, 2013
[MONITORING LEARNING ACHIEVEMENT (MLA) IN RIVERS STATE PUBLIC SCHOOLS]
Page | 6 [email protected]
Chapter 1
Introduction:
1.1. Preamble
This issue of whether real differences in educational outcomes exist between rural school students and their peers in urban schools has been a topic of debate among researchers, educational planners and policy makers. The concern about potential rural-urban differences in education outcomes is not limited to this country, but rather appears to be a global issue. Ultimately, information on learning outcomes in the rural-urban regions will assist Rivers States in making informed decisions about interventions to improve educational quality and help policy makers monitor trends in the nature and quality of student learning achievements over time. National and regional assessments allow for the benchmarking of student learning performance against corresponding standards. In the context of national development assistance, focus on learning outcomes increases stakeholder attention on deliverables and results, and may increase accountability based on performance. For example, researches comparing students from rural and "metropolitan" (urban and suburban) areas on a variety of social, psychological, and educational outcome variables have been conducted in South Africa (Liddell, 1994; Mwamwenda, 1992), Nigeria (Akande, 1990), Australia (Northern Territory Department of Education, Darwin, Australia, 1992), India (Singh & Varma, 1995), and Peru (Stevenson, Chen, & Booth, 1990) to mention a few.
Because rural-urban disparity in cultural, economic, and political conditions can differ drastically from one country to another, findings from a study conducted in one country are not necessarily generalizable to another. For this reason, we limit our review of the literature and discussion to studies conducted in Nigeria only. The major reasons for the conjecture that students in rural areas receive an inferior education compared to their metropolitan counterparts can probably be described as "t-test" of rural community and lifestyle. Although it may be difficult to pinpoint the origin and all the important elements, Herzog and Pittman (1995) have provided insightful discussion about the major components that characterize the situation. In addition to the problem of societal bias and prejudice against ruralness, Herzog and Pittman paint a somewhat bleak picture of major societal trends that have not been kind to rural communities and schools. Herzog and Pittman describe demographic and economic trends as potentially damaging to rural schools. Emigration of young people and economic decline would clearly not be expected to improve the quality of rural schooling.
1.2. Importance of Monitoring Learning Outcomes
Good learning outcomes are focused on what the learner will know or be able to do by the end of a
defined period of time and indicate how that knowledge or skill will be demonstrated. One unit of
instruction – whether a course, assignment, or workshop – might have multiple learning outcomes
that span a range of levels of learning as described by Bloom’s Taxonomy and indicated by relevant,
active verbs.

October 31, 2013
[MONITORING LEARNING ACHIEVEMENT (MLA) IN RIVERS STATE PUBLIC SCHOOLS]
Page | 7 [email protected]
1.3. Learning Outcomes Differential
The learning outcomes approach reflects a conceptual shift towards making learning more meaningful and effective. For a variety of understandable reasons many students approach education as “alienated intellectual labor,” rather than something that is good for them, learning that enhances their lives. Making education more meaningful for these students requires that they acquire a sense of the educational project as enabling them to lead a richer and more empowered life rather than a task done primarily to satisfy the demands of others. By explicitly building educational experiences based on what students should be able to do with their knowledge, the learning outcomes approach helps the educational community understand the point of the activity.
1.4. Rural-Urban Dichotomy in learning Outcomes
The Socioeconomic Differentials in Rural-Urban regions in Rivers State.
Rural-urban differences in education can be found in many different countries around the world. However, Nigeria’s rural areas are “experiencing out-migration, higher unemployment and lower incomes.” A well-educated workforce is a necessary pre-condition to a region’s economic growth. Therefore, it is crucial for rural communities, and Nigeria as a whole, to find ways to narrow the rural-urban gap in education. Rivers State is the 5th most populous State in Nigeria. The 2006 National Population Census places the population of the state at 5,133,400. Based on the Monitoring Learning Achievements (MLA) survey conducted in July 2013, the estimated population for 2013 is about 6,177,088 and 36% of this population (2,220,750), constitute school age children (ages 5-19). Rivers State is particularly interested in the study of rural-urban differences in learning outcome because of its heavy spending in the educational sector and its policy toward achieving equity, access and efficiency in education.
Rivers State has a very dynamic nature in Nigeria, harboring a very large number of oil and gas related industries. Accordingly, there is an increase in the influx of people into the state from neighboring states, including expatriates. With the increase in population, the demand for basic education has increased. In spite of the existence of over 2,292 public primary and secondary schools, there exist over 1,690 private primary and secondary schools according to Rivers State School Census Report, 2012 – an indication that the existing public and private, primary and secondary schools are inadequate to accommodate the increasing demand for school age children’s education. What then accounts for rural-urban differences in learning outcomes? The available evidence suggests that socio-economic status of parents/guardians, and students could be responsible for the rural-urban differences in learning outcome simply because all public schools irrespective of their location have been provided with the same standard of facilities and teacher quality, since they are being trained and deployed centrally from the state’s education board. These determinants of learning outcomes are the subject of another volume (volume IV) in this series.

October 31, 2013
[MONITORING LEARNING ACHIEVEMENT (MLA) IN RIVERS STATE PUBLIC SCHOOLS]
Page | 8 [email protected]
1.5. Methodology
Scope The Scope of Study is limited to results of questionnaire survey of pupils, students, their parents, teachers and tests administered on pupils and students in six learning domains for primary 4 pupils and JSS 2 students in all public primary and secondary schools in the State. Data Source This research study is based on data collected from the Monitoring of Learning Achievement (MLA) conducted in Rivers State between July–August 2013, Rivers State Schools Census report, 2012, and the National Bureau of Statistics, Official Gazette (FGP 71/52007/2500(OL24) 2006. Data analysis Data was analyzed using descriptive and inferential statistics.
1.6. Nature of the Problem
Not surprisingly, like many other issues in education, the research comparing rural students with their urban counterparts in educational outcomes in general, and in academic achievement in particular, has yielded mixed findings (Khattri, Riley, & Kane, 1997). While some studies fail to find any statistically significant differences (Alspaugh, 1992; Snyder & West, 1992; Edington & Koehler, 1987; Haller, Monk, & Tien, 1993), other studies find that students in urban areas exhibit better performance than their rural counterparts in mathematics, reading, and science and on the ACT (Coe, Howley & Hughes, 1989a; Edington & Koehler, 1987; Greenberg & Teixeira, 1995; Lindberg, Nelson, & Nelson, 1985). In other studies, however, students from rural schools were found to have performed better than those from urban areas (Alspaugh, 1992; Alspaugh & Harting, 1995; Haller et al., 1993). With the recent Rivers State administration’s heavy spending in education to bridge the rural-urban gap, our enquiry is focused on the existence of rural-urban differences in learning outcomes.
1.7. Aim
We seek to investigate the differences (if any) in learning outcomes of rural-urban schools in Rivers
State, Nigeria.
1.8. Objectives
Specifically, our objectives are:
a. To investigate the performance of school age children (from ages 6-19) in various
learning domains;
b. To categorize these school age children according to their location: (rural/urban
regions);
c. To set a benchmark for the learning domains using the determined minimum and
desired mastery levels as reference;
d. To compare their performances with the set benchmarks of minimum and desired
mastery levels.

October 31, 2013
[MONITORING LEARNING ACHIEVEMENT (MLA) IN RIVERS STATE PUBLIC SCHOOLS]
Page | 9 [email protected]
1.9. Research questions
a. Does school location (urban/rural) have any relationship with learning outcome?
b. What factors account for differences in rural-urban learning outcomes?
c. What can be done about the difference (if any)?
1.10. Hypothesis to be tested
H 0: There exist no significant differences between the learning outcomes of students in rural areas
when compared to their urban peers in Rivers State.
H 1: There exist significant differences between the learning outcomes of students in rural areas
when compared to their urban peers in Rivers State.
1.11. Significance of the Study
The significance of the study is to present a decision making framework that can assist policymakers involved with education policy formulation on the Rural-Urban differences in learning outcome in Rivers state, Nigeria. However, private organizations and the entire public who are interested in reducing rural-urban differences in learning outcomes may find the results of this research report interesting. More importantly, the findings from this study will be useful to educational planners and policy makers as it will reveal the rural-urban differences as regards to learning performance. This will in turn enable the Government to direct her effort towards sustaining student’s interest and eventually the growth and development of education in Rivers state in particular.
1.12. Organization of Study
This report is organized into five chapters.
Chapter one comprises of general introduction such as: background to the study, statement of the
problem, objective of the study, significance of the study, scope of the study and research
methodology. Chapter two basically reviews rural-urban dichotomy and experiences of other
nations in monitoring learning performance. Chapter three highlights the scope, data sources,
difficulties encountered in the survey and data analysis of differences (if any) in learning outcomes
in Rivers State as compared to previous studies. Chapter four benchmarks schools performances in
the six learning domains against their respective mastery levels. Chapter five draws conclusion and
makes recommendations based on the findings.

October 31, 2013
[MONITORING LEARNING ACHIEVEMENT (MLA) IN RIVERS STATE PUBLIC SCHOOLS]
Page | 10 [email protected]
Chapter 2
2.0 Review of Rural-Urban Dichotomy from other Countries
2.1. What is Rural-Urban Dichotomy?
A comparison of the performance on standardized tests of students from small, usually rural, schools with those from larger, often urban, schools has not produced definite results. Several studies have not found any significant differences between the two groups. Monk and Haller (1986) found that students from smaller (often rural) schools achieved as well as students from larger schools. Kleinfeld (1985) did not find that high school size determine the quality of a student’s education, experience or achievement on standardized tests. Ward and Murray (1985) looked at factors affecting academic performance of selected high school students and found that those attending schools in rural areas performed as well as those in urban areas. Also, Alapaugh (1992), Snyder and West (1992) and Haller, Monk and Tien (1993) in their studies, failed to find any statistically significant difference between the two groups of students.
Other scholars have found, however that rural-urban differences do exist. Downey (1980) found that the ACT scores of rural students where two points lower than scores of urban students in each of the categories of ACT in Kansas. Another examination of student performance in Hawai public schools by McCleery (1979) found substandard achievement to be a pattern in rural areas. In Nigeria, Adewale (2002) studied the effect of parasitic infections on school performance among school age children in Ilorin. He found that in rural community where nutritional status is relatively low and health problems are prevalent, children academic performance is greatly hindered. In other studies, however, students from rural schools were found to have performed better than those from metropolitan areas (Alspaugh, 1992; Alspaugh and Harting, 1995; Haller, Monk and Tien, 1993). Some factors could be responsible for the potential rural-urban differences. One of these factors could be availability of resources like books, computers, art and science supplies and course offerings. The availability of fewer resources in many rural schools than those in urban areas are often related to more limited curricula for these rural schools, (DeYoung and Lawrence, 1995; Hall and Barker, 1995) Barker (1985) studied high schools and reported that smaller and rural high schools had significantly less art, data processing, calculus, psychology, sociology and advanced placement offerings.
In Nigeria, rural schools may not have facilities to study subjects like Computer Science, Fine-Art, Music and French Language. Another possible influence on hypothesized gaps in educational achievement between rural and urban populations is a long history of emigration by more educated people to urban areas in search of better job opportunities (DeYoung and Lawrence, 1995; Herzog and Pittman, 1995). Population loss contributes to the educational trend of school consolidation, although recent findings suggest that larger schools do not necessarily improve student performance (1991; Haller et al, 1993; Plecki). Herzog and Pittmen (1995) pointed out that school consolidation, partially supported by the conventional wisdom that bigger must mean better, has been the single most frequently implemented educational trend in the 20th century. Rural schools and their students may be the real casualties of this trend, as fewer students per school usually means less state funding allocated towards those schools, which in turn means fewer teachers, a sparser variety of course offerings, and less state-of-the art equipment and supplies.
Another factor could be that rural communities possess a much more limited view of existing occupational roles for rural youth, who then understandably restrict themselves when going on the job market and on to higher education (Downey, 1980). Brown (1985) attributed this

October 31, 2013
[MONITORING LEARNING ACHIEVEMENT (MLA) IN RIVERS STATE PUBLIC SCHOOLS]
Page | 11 [email protected]
to low family expectations of rural students’ career options. Such conclusions may be for the most part, supposition because opportunities presented on television may inform and intrigue. According to Kleinfeld (1985), schools that achieve the best results do exhibit a strong teacher/administration/community partnership and school-community agreement on educational programs. She also reported that there is a direct relationship between quality educational programs and the ability of the staff to work toward an educational partnership with the community. Smaller communities do tend to generate more community support for the school with the school becoming a center for community activity. This, in turn, theoretically provides the students with a greater feeling of belonging to something in which they can participate, and thus enable them to develop a better self-concept.
2.2. Why is this Important in Learning Outcomes?
There is broad consensus among the international community that the achievement of the education Millennium Development Goal (MDG) requires improvements in learning outcomes. Thus, the quality of education, as measured in terms of learning outcomes, is a major focus for the institution. As a key partner in the Education for All – Fast Track Initiative (EFA-FTI), the World Bank has increasingly engaged countries in discussions on how to pursue and measure progress based not only on enrollments and inputs, but also on learning outcomes. How countries assess these outcomes and link them with policies, practices, and interventions to improve teaching and learning are growing priorities for the global development community. The World Bank has also intensified direct support to countries in this area. As a result all primary, secondary, and general education projects approved by the World Bank’s Board of Executive Directors in (2007) address education quality and cover student learning assessments. There has been an increase in research programs and capacity building activities designed to reinforce the efforts of countries and donors to pay more attention to raising learning outcomes. The Bank’s Global Monitoring Report (2007), emphasizes the key role of learning outcomes in all education programs, and highlights the importance of measuring and focusing on improving learning outcomes.
A key study on Education Quality and Economic Growth demonstrates empirically the causal relationship between cognitive learning outcomes and economic growth. A five-volume tool kit on designing educational assessment systems has been published to help countries with the implementation of sustainable national assessments of student achievement. The World Bank has been engaged in increasing global attention to assessing learning outcomes and producing evidence on what works to raise learning outcomes in developing countries. Several publications assist developing countries in the design and implementation of effective, large scale education assessment systems. The Latin America and Caribbean Region released a flagship study entitled, Raising Student Learning in Latin America, which documents and disseminates evidence of what has worked to increase learning outcomes of students attending primary and secondary schools in the region. The organization has also been working with some countries wishing to experiment with more accessible low-cost forms of learning outcomes measurement and has helped them implement simple assessments of reading skills and progress in the early years. The Jomtien Declaration in 1990 and the follow-up Framework for Action adopted at the World Education Forum in Dakar, Senegal in April 2000, recognize the quality of education as a crucial component in the broad movement of achieving Education for All. Goal 6 of the Dakar Framework states that all aspects of education quality should be improved “so that recognized and measurable learning outcomes are achieved by all, especially in literacy, numeracy and essential life skills”.
October 31, 2013
[MONITORING LEARNING ACHIEVEMENT (MLA) IN RIVERS STATE PUBLIC SCHOOLS]
Page | 12 [email protected]
2.3. Rural-Urban Variation in Examining Student Learning Outcomes
Some of the benefits of testing or examining student learning outcomes are as follows: 1. Increased student awareness of and involvement in their own learning 2. A common language and framework for discussions about learning 3. A context for course design and revision 4. An approach to curriculum assessment and change 5. An important first step toward clear communication of expectations to students 6. A requirement of accrediting agencies. Many Rural-Urban schools feel they are already taking a learning outcome’s approach to
education and all they need to do is change some terminology on their course outlines, that is, ensure that their course objectives are measurable. Other Rural-Urban schools fear the imposition of a corporate model on education with outcomes being centrally imposed, courses being modularized, and schools being de-skilled and replaced with assessors and facilitators, and perhaps even computers. Lastly, many educational institutions see the emphasis on outcomes as pressure for making education more directly serve the short term needs of the economy and demands of the business community, rather than the development of the student’s critical thinking and intellectual independence. To ensure that these fears do not become realities, Rural-Urban schools must embrace and take ownership of the student learning outcome’s approach.
2.4. Rural-Urban learning outcomes and the Quality of Education
A learning outcome is the particular knowledge, skill or behavior that a student is expected to exhibit after a period of study. Learning outcomes reflect a nation’s concern with the level of knowledge acquisition among its student population. Measuring learning outcomes provides information on what particular knowledge (cognitive), skill or behavior (affective) students have gained after instruction is completed. They are typically measured by administering assessments in the schools at regional (Rural-Urban) levels. The state decides what the purpose of the assessment is, what population will be assessed, what is to be assessed, how it is to be assessed, and how the measures are to be reported and utilized. Policy makers might decide to focus on a limited amount of domains and grade levels while others will focus on the measurement of student knowledge in a wide range of domains and grade levels. Education systems across the regions are based on the principle that education quality is defined by its contribution to the development of cognitive skills and behavioral traits, attitudes and values that are judged necessary for good citizenship and effective life in the community.

October 31, 2013
[MONITORING LEARNING ACHIEVEMENT (MLA) IN RIVERS STATE PUBLIC SCHOOLS]
Page | 13 [email protected]
2.5. Why focus on Rural-Urban differences in learning outcomes?
Researchers can now document that the quality of human resources in the Rural-Urban regions, as measured by assessment scores, is closely related to individual earnings, productivity and economic growth. This evidence shifts policy makers’ attention increasingly from inputs to outcomes, i.e. what learners should ultimately have learned at the end of a significant educational experience. While it is important to know how much money is being spent on such issues as teacher education and physical facilities, policy makers recognize that it is equally important to know what children are learning in the classroom irrespective of location (Rural-Urban): What kind of knowledge, skills and attitudes does the education system develop? How do assessed learning outcomes reflect the stated goals and objectives of national education systems? What factors are associated with students’ learning achievement? Do particular local government areas in the Rural-Urban population perform poorly? How well are students being prepared to succeed in an increasingly knowledge-based economy? Policy makers argue that students will need higher levels of knowledge and skills- particularly in the areas of mathematics and science - if they are to participate meaningfully in the world of work.
2.6. Economic Conditions, Rural-Urban Dichotomy and Learning outcomes
Educational outcomes may be more positive in urban areas simply because urban economic conditions provide greater returns on investment in education. Thus, urban students have greater incentives to stay in, and work hard at, school. In rural areas, unemployment rates are higher, bouts of unemployment last longer, and labor force participation is lower—largely because there are fewer job opportunities. Job growth is generally much higher in urban areas. Managerial, professional and other “knowledge economy” jobs are concentrated in urban areas, while unskilled occupations are more concentrated in rural areas. This is partly because the fastest growing sector—oil and gas industry—is primarily situated in urban centers, and partly because rural economies tend to be too small and not diverse enough to offset changes in the state’s economy. Rural youth are well aware of the opportunities (or lack thereof) that will be available to them when they finish school. If staying in school, working youth have very high educational aspirations and maintain high academic standards. However, these best and brightest are most often pulled away from their rural communities in pursuit of educational and occupational opportunities. The loss of smart, educated young people to big cities can further contribute to the low educational aspirations of rural youth by leaving behind few highly educated role models.

October 31, 2013
[MONITORING LEARNING ACHIEVEMENT (MLA) IN RIVERS STATE PUBLIC SCHOOLS]
Page | 14 [email protected]
Chapter 3 Methodology and Analysis
3.1. Scope
Rivers state government education reforms started during the first term of Governor Chibuike
Amaechi’s regime in May 2009. This reform is comprehensive; encompassing infrastructural
development, human-up skilling and material supplies. The scope of this study covers the period
when the state commenced the implementation of the reforms to July, 2013 when this MLA survey
was conducted. Restricted to public Schools alone, it covered all the 23 L.G.As in the three
senatorial districts of the state, with emphasis on public primary and secondary schools in both
rural and urban areas in order to ensure a balanced spread. The Scope of Study is limited only to
results of household survey and tests administered on pupils and students in six learning domains
for primary 4 pupils and JSS 2 students in all public primary and secondary schools in the State.
3.2. Sample Selection and Size
For the purpose of this MLA study, we randomly selected 15 pupils from Primary four and 15
students from junior secondary school two (JSS2) in all the public primary and secondary schools
across the twenty-three local governments in the state, who are believed to have spent at least a
period of 18 months and above in their respective present primary and secondary schools. Of the
916 public primary schools, 386 were rural while 530 were urban. Subsequently, of the 293 public
secondary schools, 141 were rural while 152 were urban. A total of 5,595 rural and 8,145 urban
primary 4 pupils were sampled while 2,115 rural and 2,280 urban JSS 2 students were sampled.
The proportion of rural primary schools to urban primary schools is 42.1% to 57.9% while rural
secondary schools to urban secondary schools is 48.1% to 51.9%.
3.3. Data Source
This research study is limited to primary data collected from the Monitoring of Learning
Achievement (MLA) conducted in Rivers State between July–August 2013, secondary and
administrative data gathered from Rivers State Schools Census report, 2012, and the National
Bureau of Statistics, Official Gazette (FGP 71/52007/2500(OL24) 2006.
The table below displays the LGAs and their classification whether rural or urban as well as the
number of schools from which pupils and students alike were selected for the assessment.

October 31, 2013
[MONITORING LEARNING ACHIEVEMENT (MLA) IN RIVERS STATE PUBLIC SCHOOLS]
Page | 15 [email protected]
Table1. Number of Questionnaires Distributed in Schools across the LGAs
S/N LGAs Classification Rural (R), Urban (U)
NO. OF PRY SCHOOLS
NO. OF SEC SCHOOLS
PUPILS
STUDENTS
1 ABUA/ODUA R 49 31 735 465
2 AHOADA-EAST R 38 19 570 285
3 AHOAD-WEST U 60 11 900 165
4 ANDONI R 58 10 870 150
5 AKUKU-TORU U 22 6 330 90
6 ASARI-TORU U 27 10 405 150
7 BONNY U 21 3 315 45
8 DEGEMA R 24 6 360 90
9 ELEME U 22 5 330 75
10 EMOHUA U 51 21 765 315
11 ETCHE R 80 44 1200 660
12 GOKANA U 39 9 585 135
13 IKWERRE U 39 14 585 210
14 KHANA U 79 22 1185 330
15 OBIO/AKPOR U 43 19 645 285
16 ONELGA R 71 19 1065 285
17 OGU/BOLO R 15 3 225 45
18 OKRIKA U 34 6 510 90
19 OMUMA R 21 4 315 60
20 OPOBO/NKORO R 17 5 255 75
21 OYIGBO U 21 2 315 30
22 PORT HARCOURT U 50 11 750 165
23 TAI U 35 13 525 195
TOTAL Rural (9), Urban (14)
Rural (386), Urban (530)
Rural (141), Urban (152)
Rural (5,595), Urban (8,145)
Rural (2,115), Urban (2,280)
Source: MLA survey conducted by Arbitrage in Rivers State, 2013.
Total no of schools surveyed (primary and secondary schools) was 1,209.
3.4. Challenges
i. Some respondent Information was voided as a result of inconsistencies noticed.
ii. Omission of vital Information by some respondents qualified the responses for exclusion from
the sample.
iii. Obvious falsification of responses by some respondents, led to the exclusion of the responses.
iv. Late submission of survey instruments by secretaries of some LEA’s resulted in the exclusion of
the responses.

October 31, 2013
[MONITORING LEARNING ACHIEVEMENT (MLA) IN RIVERS STATE PUBLIC SCHOOLS]
Page | 16 [email protected]
3.5. Statistical Tests of Significance
3.5.1. What does "statistical significance" really mean?
Many researchers get very excited when they have discovered a "statistically significant" finding,
without really comprehending what it means.
When a statistic is significant, it simply means that you are very sure that the statistic is
reliable. It doesn't mean the finding is important or that it has any decision-making usefulness. In
other words, statistical significance is the probability that an effect is not likely due to stroke of
luck (or accident) alone.
3.5.2. One-Tailed and Two-Tailed Significance Tests
One important concept in significance testing is whether you use a one-tailed or two-tailed
test of significance. The answer is that it depends on your hypothesis. When your research
hypothesis states the direction of the difference or relationship, then you use a one-tailed
probability. For example, a one-tailed test would be used to test these null hypotheses: Females
will not score significantly higher than males on an IQ test. The one-tailed probability is exactly half
the value of the two-tailed probability.
Modern computer software can calculate exact probabilities for most test statistics. If you
have an exact probability from computer software, simply compare it to your critical alpha level. If
the exact probability is less than the critical alpha level, your finding is significant, and if the exact
probability is greater than your critical alpha level, your finding is not significant. Using a table is not
necessary when you have the exact probability for a statistic. This analysis therefore adopts the
one-tailed significance tests.
3.6. Data Analysis Framework
The analysis of tests scores will be carried out in two sections viz. section one for primary schools
and section two for secondary schools under the following statistical tools;
A. T-test Analysis
T- test is a statistical examination of two population means. A two-sample t-test examines whether
two samples are different and is commonly used when the variances of two normal distributions
are unknown and when an experiment uses a small sample size. For example, a t-test could be used
to compare the average score of rural students’ performance in English Language to the average
score of urban students’ performance in the same English Language learning domain.
B. Analysis of Variance (ANOVA)
Analysis of variance (ANOVA) is a collection of statistical models used to analyze the differences between group means and their associated procedures (such as "variation" among and between groups). In ANOVA setting, the observed variance in a particular variable is partitioned into components attributable to different sources of variation. In its simplest form, ANOVA provides

October 31, 2013
[MONITORING LEARNING ACHIEVEMENT (MLA) IN RIVERS STATE PUBLIC SCHOOLS]
Page | 17 [email protected]
a statistical test of whether or not the means of several groups are equal, and therefore generalizes t-test to more than two groups. Doing multiple two-sample t-tests would result in an increased chance of committing a type I error. For this reason, ANOVAs are useful in comparing (testing) three or more means (groups or variables) for statistical significance.
C. Post-Hoc Analysis
In the design and analysis of experiments, post-hoc analysis (from Latin post hoc, "after this") consists of looking at the data—after the experiment has concluded—for patterns that were not specified a priori. It is sometimes called by critics data dredging to evoke the sense that the more one looks the more likely something will be found. More subtly, each time a pattern in the data is considered, a statistical test is effectively performed. This greatly inflates the total number of statistical tests and necessitates the use of multiple testing procedures to compensate. However, this is difficult to do precisely and in fact most results of post-hoc analyses are reported as they are with unadjusted p-values. These p-values must be interpreted in light of the fact that they are a small and selected subset of a potentially large group of p-values. Results of post-hoc analyses should be explicitly labeled as such in reports and publications to avoid misleading readers.
D. Correlation Analysis
Correlation is a statistical measure that indicates the extent to which two or more variables fluctuate together. A positive correlation indicates the extent to which those variables increase or decrease in parallel; a negative correlation indicates the extent to which one variable increases as the other decreases. When the fluctuation of one variable reliably predicts a similar fluctuation in another variable, there’s often a tendency to think that means that the change in one causes the change in the other. However, correlation does not imply causation. There may be, for example, an unknown factor that influences both variables similarly.
Here’s one example: A correlation between a remarkable performance of students in English Language and the likelihood that they will perform equally good in Mathematics. However, this will only report a correlation, and not causation. It is likely that some other factor – such as the determinants of learning outcomes found in the volume IV of this MLA series– may be the influential factors.

October 31, 2013
[MONITORING LEARNING ACHIEVEMENT (MLA) IN RIVERS STATE PUBLIC SCHOOLS]
Page | 18 [email protected]
Section one (primary schools data analysis).
This section considers the analysis of the primary schools tests scores, table narratives and
interpretation of statistics involved which is technical in nature and in fact the basis for the
recommendations of this report.
Table2. Summary of Primary Schools Pupils Tests Scores (Primary 4)
S/N LGA Classification Rural (R), Urban (U)
No. of Primary Schools
Literacy Numeracy Life Skills
1 ABUA/ODUA R 49 67.1 57.5 75.2
2 AHOADA EAST R 38 55.7 39.2 66.4
3 AHOADA WEST U 60 47.4 47.3 54.9
4 AKUKU-TORU R 58 60.8 46.6 70.6
5 ANDONI U 22 48.7 48.0 78.3
6 ASARI-TORU U 27 63.9 38.4 70.3
7 BONNY U 21 62.9 67.3 70.2
8 DEGEMA R 24 58.9 35.4 72.0
9 ELEME U 22 56.1 57.8 71.3
10 EMOHUA U 51 53.5 46.2 69.3
11 ETCHE R 80 67.0 46.0 73.0
12 GOKANA U 39 58.6 49.1 54.8
13 IKWERRE U 39 63.4 57.1 76.4
14 KHANA U 79 57.4 48.4 69.6
15 OBIO/AKPOR U 43 63.2 43.8 82.6
16 OGU/BOLO R 15 68.3 61.3 71.6
17 OKRIKA R 34 61.0 54.3 77.5
18 OMUMA U 21 71.8 51.7 65.1
19 ONNE R 71 60.6 49.2 73.7
20 OPOBO/NKORO R 17 62.8 55.9 70.9
21 OYIGBO U 21 71.1 50.5 72.7
22 PORT-HARCOURT U 50 61.2 49.2 72.1
23 TAI U 35 63.4 42.2 73.2
TOTAL Rural (9), Urban (14)
Rural (386), Urban (530)
Literacy Numeracy Life Skills
Mean Score 61.1 49.7 70.9
Minimum Score
47.4 35.4 54.8
Maximum Score
71.8 67.3 82.6
Source: MLA survey conducted by Arbitrage in Rivers State, 2013.
Table 2, Gives a summary of the mean scores of 5,595 public rural primary school pupils as well as
the 8,145 public urban schools pupils of the 23 local government areas in Rivers State who were

October 31, 2013
[MONITORING LEARNING ACHIEVEMENT (MLA) IN RIVERS STATE PUBLIC SCHOOLS]
Page | 19 [email protected]
captured in the MLA survey. The domains of interest are literacy, numeracy and life skills with their
corresponding MML as seen above. The rural schools mean score for the three learning domains
varies from nearly 72 percent for life skills the highest to about 49.3 percent for numeracy the
lowest. In urban schools, the highest mean score of about 70 percent was also in life skills while the
lowest mean score was also in numeracy. This means that pupils generally performed poorly less
than 50 percent in numeracy while the general performance in literacy and life skills was above 60
percent each.
When compared with the state average overall performance, the rural schools performed
marginally better in each of the learning domains than schools located in the urban areas. In
literacy and numeracy learning domains, only four and five rural L.G.As respectively performed
poorly below their rural counterparts as well as the overall mean state performance whereas urban
mean scores were lower than the overall average the state in literacy and numeracy domains with
more urban L.G.As 5 and 8 respectively performing below the state mean scores. The performances
recorded in life skills showed a better than average performance in most of the rural and urban
L.G.As.
Table 3: Urban-Rural Schools Mean Scores in Literacy GROUP 1 URBAN PRIMARY SCHOOL STUDENTS MEAN SCORES 4
7.4
60
.8
63
.9
62
.8
56
.1
53
.5
58
.6
63
.4
57
.4
63
.2
61
.0
71
.1
61
.2
64
.3
GROUP 2 RURAL PRIMARY SCHOOL STUDENTS MEAN SCORES 6
7.1
55
.7
48
.7
58
.9
67
.0
68
.3
71
.8
60
.6
62
.8
Source: MLA survey conducted by Arbitrage in Rivers State, 2013.
Table 3 above displays the spread of mean scores of the schools in literacy from the 23 L.G.As, but broadly
classified into two categories, group 1 (Urban) and group 2 (Rural).

October 31, 2013
[MONITORING LEARNING ACHIEVEMENT (MLA) IN RIVERS STATE PUBLIC SCHOOLS]
Page | 20 [email protected]
Table 4: Urban-Rural Schools Distribution in Literacy GROUP 1 (URBAN) MEAN 60.3
GROUP 2 (RURAL) MEAN 62.3
GROUP 1 STANDARD DEVIATION 5.6
GROUP 2 STANDARD DEVIATION 7.2
GROUP 1 MAXIMUM 71.1
GROUP 2 MAXIMUM 71.8
GROUP 1 MINIMUM 47.4
GROUP 2 MINIMUM 48.7
GROUP 1 RANGE 23.7
GROUP 2 RANGE 23.0
t-test = 0.466734 Source: MLA survey conducted by Arbitrage in Rivers State, 2013.
In table 4 above; for their distinctive urban and rural schools mean and standard deviation, the urban and
rural schools for most part of the test, scored within the interval spread corresponding to (54.7, 65.9) and
(55.2, 69.4) respectively. However, the maximum, minimum and range denotes how clustered the
distribution that underlies the MLA sample survey is, looking at the very miniature difference existing in the
groups pairs. Comparing the pairs of sample statistics, there is no clear distinction in the spread. Hence, from
the procedure used to test for significance, the calculated probability (t-test statistic) 0.47 is greater than
0.05, therefore we conclude that, although there is a difference between the two group means, the
difference is not statistically significant, i.e. the difference may be due to chance.
Source: MLA survey conducted by Arbitrage in Rivers State, 2013.
Rural schools slightly performed better than their urban counterparts in Literacy, although the difference
may be due to chance considering the intra-individual variability, that is, the same individual differing in tests
taken at different times or in other differing conditions.
59
60
61
62
63
GROUP 1 (URBAN) GROUP 2 (RURAL)
Fig.1; Urban-Rural Schools Performance in Literacy

October 31, 2013
[MONITORING LEARNING ACHIEVEMENT (MLA) IN RIVERS STATE PUBLIC SCHOOLS]
Page | 21 [email protected]
Table 5: Urban-Rural Schools Mean Scores in Numeracy GROUP 1 URBAN PRIMARY SCHOOL STUDENTS MEAN SCORES
47
.3
46
.6
38
.4
67
.3
57
.8
46
.2
49
.1
57
.1
48
.4
43
.8
54
.3
50
.5
49
.2
42
.0
GROUP 2 RURAL PRIMARY SCHOOL STUDENTS MEAN SCORES
57
.5
39
.2
48
.0
35
.4
46
61
.3
51
.7
49
.2
55
.9
Source: MLA survey conducted by Arbitrage in Rivers State, 2013.
Table 5 above displays the spread of mean scores of the schools in Numeracy from the 23 L.G.As, and
broadly classified into group 1 (Urban) and group 2 (Rural).
Table 6: Urban-Rural Schools Distribution in Numeracy GROUP 1 (URBAN) MEAN 49.8
GROUP 2 (RURAL) MEAN 49.3
GROUP 1 SD 7.3
GROUP 2 SD 8.4
GROUP 1 (URBAN) MAXIMUM 67.2
GROUP 2 (RURAL) MAXIMUM 61.3
GROUP 1 MINIMUM 38.3
GROUP 2 MINIMUM 35.4
GROUP 1 RANGE 28.8
GROUP 2 RANGE 25.9
t-test= 0.87935 Source: MLA survey conducted by Arbitrage in Rivers State, 2013.
In line with their discrete urban and rural schools mean score and standard deviation in table 5, the urban
and rural schools largely scored within the interval spread corresponding to (44.9, 54.4) and (45, 54.5)
respectively. However, the maximum, minimum and range denotes how clustered the distribution that
underlies the MLA sample survey is, looking at the minute difference existing in the groups pairs. Judging by
the pairs of sample statistics, there is no clear discrepancy in the spread. Hence, from the procedure used to
test for significance, the calculated probability (t-test statistic) 0.87 is greater than 0.05, therefore we
conclude that, although there is a difference between the two group means, the difference is not statistically
significant, i.e. the difference may not be due to stroke of luck alone.

October 31, 2013
[MONITORING LEARNING ACHIEVEMENT (MLA) IN RIVERS STATE PUBLIC SCHOOLS]
Page | 22 [email protected]
Source: MLA survey conducted by Arbitrage in Rivers State, 2013.
Urban schools slightly achieved better than their rural counterparts in Numeracy, although the difference
may be coincidental considering inherent individual variation, that is, the same individual varying in tests
taken at different times or in other dissimilar conditions.
Table 7: Urban-Rural Schools Mean Scores in Life Skills.
GROUP 1 URBAN PRIMARY SCHOOL STUDENTS MEAN SCORES
54.
9
70.
5
70.
3
70.
1
71.
2
69.
2
54.
8
76.
4
69.
5
82.
5
77.
4
72.
6
72.
1
73.
0
GROUP 2 RURAL PRIMARY SCHOOL STUDENTS MEAN SCORES
75.
1
66.
3
78.
2
72.
0
73.
0
71.
6
65.
0
73.
6
70.
8
Source: MLA survey conducted by Arbitrage in Rivers State, 2013. Table 7 above displays the spread of mean scores of the schools in Life Skills from the 23 L.G.As, but broadly
classified into two categories, group 1 (Urban) and group 2 (Rural).
49
49.1
49.2
49.3
49.4
49.5
49.6
49.7
49.8
49.9
GROUP 1 (URBAN) GROUP 2 (RURAL)
Fig.2; Urban-Rural Schools Performance in Numeracy
October 31, 2013
[MONITORING LEARNING ACHIEVEMENT (MLA) IN RIVERS STATE PUBLIC SCHOOLS]
Page | 23 [email protected]
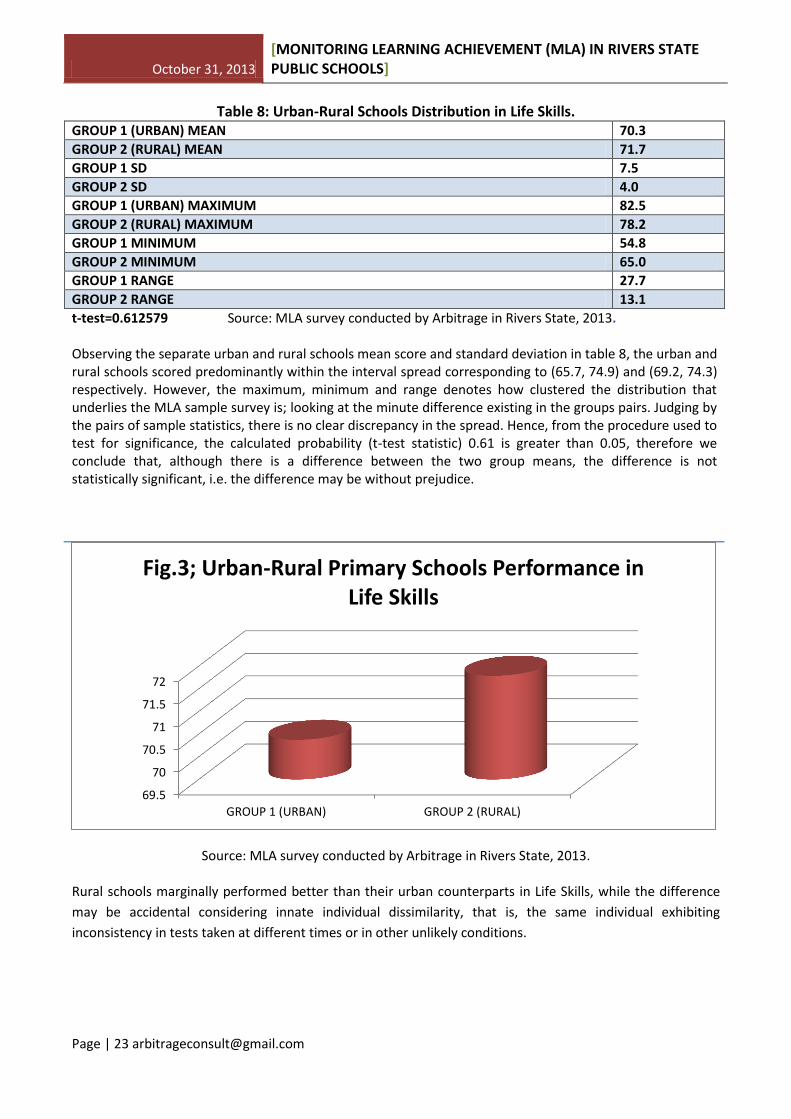
Table 8: Urban-Rural Schools Distribution in Life Skills. GROUP 1 (URBAN) MEAN 70.3
GROUP 2 (RURAL) MEAN 71.7
GROUP 1 SD 7.5
GROUP 2 SD 4.0
GROUP 1 (URBAN) MAXIMUM 82.5
GROUP 2 (RURAL) MAXIMUM 78.2
GROUP 1 MINIMUM 54.8
GROUP 2 MINIMUM 65.0
GROUP 1 RANGE 27.7
GROUP 2 RANGE 13.1
t-test=0.612579 Source: MLA survey conducted by Arbitrage in Rivers State, 2013. Observing the separate urban and rural schools mean score and standard deviation in table 8, the urban and rural schools scored predominantly within the interval spread corresponding to (65.7, 74.9) and (69.2, 74.3) respectively. However, the maximum, minimum and range denotes how clustered the distribution that underlies the MLA sample survey is; looking at the minute difference existing in the groups pairs. Judging by the pairs of sample statistics, there is no clear discrepancy in the spread. Hence, from the procedure used to test for significance, the calculated probability (t-test statistic) 0.61 is greater than 0.05, therefore we conclude that, although there is a difference between the two group means, the difference is not statistically significant, i.e. the difference may be without prejudice.
Source: MLA survey conducted by Arbitrage in Rivers State, 2013.
Rural schools marginally performed better than their urban counterparts in Life Skills, while the difference
may be accidental considering innate individual dissimilarity, that is, the same individual exhibiting
inconsistency in tests taken at different times or in other unlikely conditions.
69.5
70
70.5
71
71.5
72
GROUP 1 (URBAN) GROUP 2 (RURAL)
Fig.3; Urban-Rural Primary Schools Performance in Life Skills

October 31, 2013
[MONITORING LEARNING ACHIEVEMENT (MLA) IN RIVERS STATE PUBLIC SCHOOLS]
Page | 24 [email protected]
Table 9: ANOVA for Literacy, Numeracy and Life Skills Learning Domains. LITERACY NUMERACY LIFE SKILLS
N Valid: 23 23 23
N Missing: 0 0 0
Mean: 61.0 49.6 70.9
Std. Deviation: 6.1 7.5 6.3
ANOVA Table Source of Variance Sum of Squares Degrees of Freedom Mean Squares F-test ratio
Factor A 5210.6 2.0 2605.3 71.6
Factor S 1391.1 22.0 63.2
A x S 1599.9 44.0 36.3
Total 8201.8 68.0
Eta Squared 0.765
Source: MLA survey conducted by Arbitrage in Rivers State, 2013.
The ANOVA results indicate that at least two of the repeated measures (group means) of the 3 learning
domains differed significantly. In practice, to formulate policies and for further scientific analysis there is
need for a post hoc test to determine which particular repeated measures (group means or standard
deviation) of the 3 learning domains vary significantly with respect to the F-ratio test statistic.
Table 10: A priori Test (Post Hoc Test)
Post Hoc test
Comparison Mean Difference T-Value Eta Squared
LITERACY LITERACY and NUMERACY 11.4 6.4 0.645
LITERACY and LIFE SKILLS 9.8 6.2 0.633
NUMERACY NUMERACY and LIFE SKILLS 21.2 10.7 0.834
Source: MLA survey conducted by Arbitrage in Rivers State, 2013.
The sole aim of the table 10 ANOVA above; is to detect variance while the Post Hoc confirms that there is a
departure of the estimated dispersion or central tendency parameter from its notional value and standard
error. A significant mean difference of 11.4 and a total variation of about 64.5% exist within and across the
Literacy and Numeracy. A mean difference of 9.8 and a total variation of about 63.3% exist within and across
Literacy and Life Skills. Finally, a mean difference of 21.2 and a total variation of about 83.4% exist within
and across Numeracy and Life Skills.
It then becomes a prerequisite to determine the correlation of the learning domains for effective policy
implementation.

October 31, 2013
[MONITORING LEARNING ACHIEVEMENT (MLA) IN RIVERS STATE PUBLIC SCHOOLS]
Page | 25 [email protected]
Source: MLA survey conducted by Arbitrage in Rivers State, 2013.
Fig.4 presents a pictorial analysis of the public primary schools performances in the 3 learning domains
across the 23 L.G.As in Rivers State.
.000
10.000
20.000
30.000
40.000
50.000
60.000
70.000
80.000
LITERACYNUMERACY
LIFE SKILLS
61.076
49.668
70.935
Fig.4; Mean Distribution of Primary Schools Learning Domains

October 31, 2013
[MONITORING LEARNING ACHIEVEMENT (MLA) IN RIVERS STATE PUBLIC SCHOOLS]
Page | 26 [email protected]
Table 11; Is a Correlation Matrix Displaying the Degree of Association or Dispersion Existing Between Primary Schools Learning Domains.
LITERACY NUMERACY LIFE SKILLS
LITERACY 1
N -
P -
NUMERACY .261 1
N 23 -
P .23 -
LIFE SKILLS .280 .076 1
N 23 23 -
P .20 .73 -
Source: MLA survey conducted by Arbitrage in Rivers State, 2013.
The correlation appears in the off-diagonal positions. The table is symmetrical, so the same information that is in the top-right is also in the bottom left. Hypothesis tested: There is no relationship between any 2 pairs of educational domains i.e. in Literacy, Numeracy and Life skills. The Spearman's Rho (P) indicates the direction and strength of the relationship which implies a reliable predictor and not a necessary cause of strength or weakness as the case may be. (A) Literacy and Life skills had a statistically significant positive relationship, the strength being 0.280, which means that a change in literacy learning domain will reliably predict a positive change in life skills learning domain. (B) Numeracy and Life skills had a statistically significant positive relationship, the strength being 0.076, which means that a change in numeracy learning domain will reliably predict a positive change in life skills learning domain. (C) Literacy and Numeracy had a statistically significant positive relationship, the strength being 0.261, which means that a change in literacy learning domain will reliably predict a positive change in the numeracy learning domain.

October 31, 2013
[MONITORING LEARNING ACHIEVEMENT (MLA) IN RIVERS STATE PUBLIC SCHOOLS]
Page | 27 [email protected]
Section two (secondary schools data analysis).
Table 12; Summary or Public Secondary Schools Mean Scores
S/N LGAs CLASSIFICATION RURAL (R), URBAN (U)
NUMBER OF SECONDARY
SCHOOLS
ENGLISH AVERAGE
MATHEMATICS AVERAGE
GENERAL SCIENCE
AVERAGE
1 ABUA/ODUA R 31 55.9 40.0 72.1
2 AHOADA-EAST R 19 38.8 41.6 65.5
3 AHOAD-WEST U 11 66.8 39.0 55.2
4 ANDONI R 10 29.5 49.1 46.7
5 AKUKU-TORU U 6 44.6 61.2 49.3
6 ASARI-TORU U 10 57.0 43.0 65.7
7 BONNY U 3 53.6 64.0 30.5
8 DEGEMA R 6 38.2 32.9 65.3
9 ELEME U 5 51.5 48.5 72.4
10 EMOHUA U 21 52.3 47.6 64.7
11 ETCHE R 44 47.8 43.2 65.3
12 GOKANA U 9 49.1 42.6 47.3
13 IKWERRE U 14 45.5 48.9 36.0
14 KHANA U 22 36.8 42.8 52.3
15 OBIO/AKPOR U 19 54.1 36.9 72.7
16 OGU/BOLO R 3 58.3 56.2 70.6
17 OKRIKA U 6 55.4 59.4 74.0
18 OMUMA R 4 47.1 37.2 39.3
19 ONNE R 19 52.3 47.8 66.6
20 OPOBO/NKORO R 5 39.8 37.8 45.7
21 OYIGBO U 2 50.6 40.9 60.7
22 PORT HARCOURT
U 11 72.9 35.9 67.0
23 TAI U 13 47.0 43.5 58.2
TOTAL Rural (9), Urban (14)
Rural (141), Urban (152)
ENGLISH MATHEMATICS GENERAL SCIENCE
MEAN SCORE 49.8 45.2 58.4
MINIMUM SCORE
29.5 32.9 30.5
MAXIMUM SCORE
72.9 64.0 74.0
Source: MLA survey conducted by Arbitrage in Rivers State, 2013.
October 31, 2013
[MONITORING LEARNING ACHIEVEMENT (MLA) IN RIVERS STATE PUBLIC SCHOOLS]
Page | 28 [email protected]
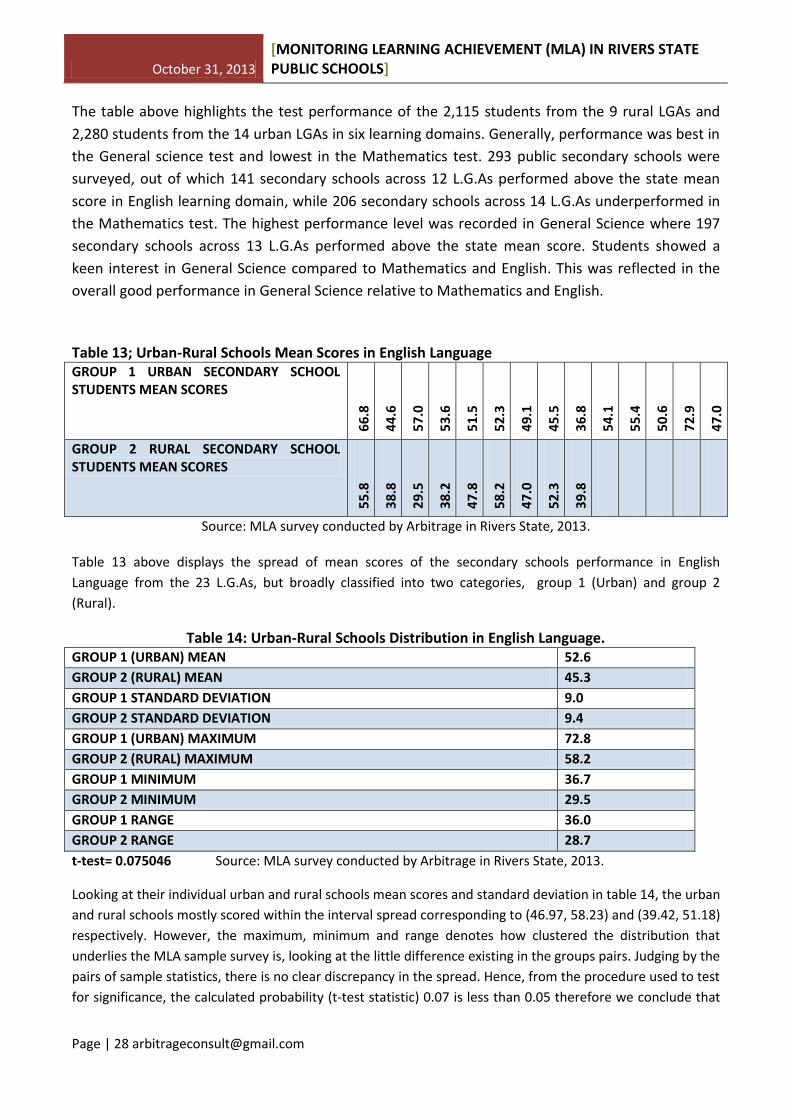
The table above highlights the test performance of the 2,115 students from the 9 rural LGAs and
2,280 students from the 14 urban LGAs in six learning domains. Generally, performance was best in
the General science test and lowest in the Mathematics test. 293 public secondary schools were
surveyed, out of which 141 secondary schools across 12 L.G.As performed above the state mean
score in English learning domain, while 206 secondary schools across 14 L.G.As underperformed in
the Mathematics test. The highest performance level was recorded in General Science where 197
secondary schools across 13 L.G.As performed above the state mean score. Students showed a
keen interest in General Science compared to Mathematics and English. This was reflected in the
overall good performance in General Science relative to Mathematics and English.
Table 13; Urban-Rural Schools Mean Scores in English Language GROUP 1 URBAN SECONDARY SCHOOL STUDENTS MEAN SCORES
66
.8
44
.6
57
.0
53
.6
51
.5
52
.3
49
.1
45
.5
36
.8
54
.1
55
.4
50
.6
72
.9
47
.0
GROUP 2 RURAL SECONDARY SCHOOL STUDENTS MEAN SCORES
55
.8
38
.8
29
.5
38
.2
47
.8
58
.2
47
.0
52
.3
39
.8
Source: MLA survey conducted by Arbitrage in Rivers State, 2013.
Table 13 above displays the spread of mean scores of the secondary schools performance in English
Language from the 23 L.G.As, but broadly classified into two categories, group 1 (Urban) and group 2
(Rural).
Table 14: Urban-Rural Schools Distribution in English Language. GROUP 1 (URBAN) MEAN 52.6
GROUP 2 (RURAL) MEAN 45.3
GROUP 1 STANDARD DEVIATION 9.0
GROUP 2 STANDARD DEVIATION 9.4
GROUP 1 (URBAN) MAXIMUM 72.8
GROUP 2 (RURAL) MAXIMUM 58.2
GROUP 1 MINIMUM 36.7
GROUP 2 MINIMUM 29.5
GROUP 1 RANGE 36.0
GROUP 2 RANGE 28.7
t-test= 0.075046 Source: MLA survey conducted by Arbitrage in Rivers State, 2013.
Looking at their individual urban and rural schools mean scores and standard deviation in table 14, the urban
and rural schools mostly scored within the interval spread corresponding to (46.97, 58.23) and (39.42, 51.18)
respectively. However, the maximum, minimum and range denotes how clustered the distribution that
underlies the MLA sample survey is, looking at the little difference existing in the groups pairs. Judging by the
pairs of sample statistics, there is no clear discrepancy in the spread. Hence, from the procedure used to test
for significance, the calculated probability (t-test statistic) 0.07 is less than 0.05 therefore we conclude that

October 31, 2013
[MONITORING LEARNING ACHIEVEMENT (MLA) IN RIVERS STATE PUBLIC SCHOOLS]
Page | 29 [email protected]
there is a significant difference between the two group means, and the difference is statistically significant,
i.e. the difference is assured if subjected to similar conditions.
Source: MLA survey conducted by Arbitrage in Rivers State, 2013.
Urban secondary schools considerably performed better than their rural counterparts in English Language. In
addition, the difference is assured in likely conditions despite their variable inborn traits.
Table 15: Urban-Rural Schools Mean Scores in Mathematics GROUP 1 URBAN SECONDARY SCHOOL STUDENTS MEAN SCORES
39.
0
61.
1
43.
0
64.
0
48.
4
47.
5
42.
5
48.
9
42.
8
36.
9
59.
4
40.
9
35.
8
43.
4
GROUP 2 RURAL SECONDARY SCHOOL STUDENTS MEAN SCORES
40.
0
41.
5
49.
1
32.
8
43.
1
56.
1
37.
2
47.
8
37.
8
Source: MLA survey conducted by Arbitrage in Rivers State, 2013.
Table 15 above displays the spread of mean scores of the secondary schools in Mathematics from the 23
L.G.As, but broadly classified into group 1 (Urban) and group 2 (Rural).
40
42
44
46
48
50
52
54
GROUP 1 (URBAN) MEAN GROUP 2 (RURAL) MEAN
Fig.5; URBAN-RURAL SCHOOLS PERFORMANCE IN ENGLISH LANGUAGE.

October 31, 2013
[MONITORING LEARNING ACHIEVEMENT (MLA) IN RIVERS STATE PUBLIC SCHOOLS]
Page | 30 [email protected]
Table 16: Urban-Rural Schools Distribution in Mathematics
GROUP 1 (URBAN) MEAN 46.7
GROUP 2 (RURAL) MEAN 42.8
GROUP 1 STANDARD DEVIATION 8.9
GROUP 2 STANDARD DEVIATION 7.1
GROUP 1 MAXIMUM 64.0
GROUP 2 MAXIMUM 56.1
GROUP 1 MINIMUM 35.8
GROUP 2 MINIMUM 32.8
GROUP 1 RANGE 28.1
GROUP 2 RANGE 23.3
t-test= 0.28879 Source: MLA survey conducted by Arbitrage in Rivers State, 2013.
In line with urban and rural groups mean score and standard deviation in table 16, the urban and rural
groups generally scored within the interval spread of and corresponding to (41.13, 52.27) and (38.36, 47.24)
respectively. However, the maximum, minimum and range denotes how clustered the distribution that
underlies the MLA sample survey is, looking at the insignificant difference existing in the groups pairs.
Judging by the pairs of sample statistics, there is no clear discrepancy in the spread. Hence, from the
procedure used to test for significance, the calculated probability (t-test statistic) 0.29 is greater than 0.05,
therefore we conclude that, although there is a difference between the two group means, the difference is
not statistically significant, i.e. the difference may be due to chance.
Source: MLA survey conducted by Arbitrage in Rivers State, 2013.
The urban secondary schools marginally performed better than their rural counterparts in Mathematics,
while the difference may be accidental considering their variable inborn traits, that is, the same individual
displaying inconsistency in tests taken at different times or in other improbable conditions.
40
41
42
43
44
45
46
47
GROUP 1 (URBAN) MEAN GROUP 2 (RURAL) MEAN
Fig.6; URBAN-RURAL SCHOOLS PERFORMANCE IN MATHEMATICS

October 31, 2013
[MONITORING LEARNING ACHIEVEMENT (MLA) IN RIVERS STATE PUBLIC SCHOOLS]
Page | 31 [email protected]
Table 17: Urban-Rural Schools Mean Scores in General Science GROUP 1 URBAN SECONDARY SCHOOL STUDENTS MEAN SCORES
55
.5
49
.3
65
.6
30
.5
72
.3
64
.7
47
.3
36
.0
52
.3
72
.7
73
.9
60
.7
67
.0
58
.2
GROUP 2 RURAL SECONDARY SCHOOL STUDENTS MEAN SCORES
72
.1
65
.4
46
.7
65
.3
65
.3
70
.5
39
.2
66
.5
45
.6
Source: MLA survey conducted by Arbitrage in Rivers State, 2013.
Table 17 above displays the spread of mean scores of the secondary schools’ mean scores in General Science
from the 23 L.G.As, but broadly classified into group 1 (Urban) and group 2 (Rural).
Table 18: Urban-Rural Schools Distribution in General Science GROUP 1 (URBAN) MEAN 57.6
GROUP 2 (RURAL) MEAN 59.6
GROUP 1 SD 13.4
GROUP 2 SD 12.2
GROUP 1 MAXIMUM 73.9
GROUP 2 MAXIMUM 72.1
GROUP 1 MINIMUM 30.5
GROUP 2 MINIMUM 39.2
GROUP 1 RANGE 43.4
GROUP 2 RANGE 32.8
t-test = 0.713189 Source: MLA survey conducted by Arbitrage in Rivers State, 2013.
Looking at their individual urban and rural groups mean score and standard deviation in table 18, the urban
and rural schools mostly scored within the interval spread corresponding to (49.22, 65.98) and (51.97, 67.23)
respectively. However, the maximum, minimum and range denotes how clustered the distribution that
underlies the MLA sample survey is, looking at the tiny difference existing in the groups pairs. Judging by the
pairs of sample statistics, there is no clear discrepancy in the spread. Hence, from the procedure used to test
for significance, the calculated probability (t-test statistic) 0.71 is greater than 0.05, therefore we conclude
that, although there is a difference between the two group means, the difference is not statistically
significant, i.e. the difference may not be deliberate.

October 31, 2013
[MONITORING LEARNING ACHIEVEMENT (MLA) IN RIVERS STATE PUBLIC SCHOOLS]
Page | 32 [email protected]
Source: MLA survey conducted by Arbitrage in Rivers State, 2013.
The rural secondary schools marginally performed better than their urban counterparts in General Science, while the difference may be accidental considering their variable inborn traits, that is, the same individual conflicting in tests taken at different times or in other different conditions.
56
57
58
59
60
GROUP 1 (URBAN) MEAN GROUP 2 (RURAL) MEAN
Fig.7: URBAN-RURAL SCHOOLS PERFORMANCE IN GENERAL SCIENCE.
October 31, 2013
[MONITORING LEARNING ACHIEVEMENT (MLA) IN RIVERS STATE PUBLIC SCHOOLS]
Page | 33 [email protected]
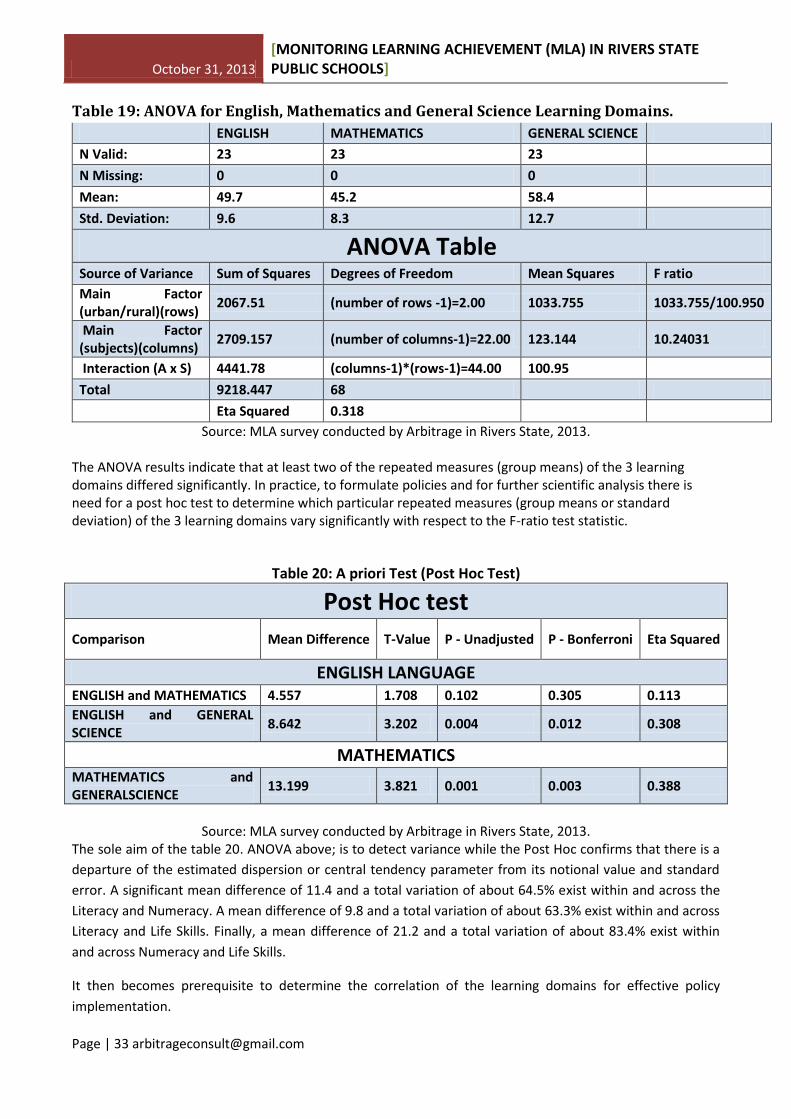
Table 19: ANOVA for English, Mathematics and General Science Learning Domains.
ENGLISH MATHEMATICS GENERAL SCIENCE
N Valid: 23 23 23
N Missing: 0 0 0
Mean: 49.7 45.2 58.4
Std. Deviation: 9.6 8.3 12.7
ANOVA Table Source of Variance Sum of Squares Degrees of Freedom Mean Squares F ratio
Main Factor (urban/rural)(rows)
2067.51 (number of rows -1)=2.00 1033.755 1033.755/100.950
Main Factor (subjects)(columns)
2709.157 (number of columns-1)=22.00 123.144 10.24031
Interaction (A x S) 4441.78 (columns-1)*(rows-1)=44.00 100.95
Total 9218.447 68
Eta Squared 0.318
Source: MLA survey conducted by Arbitrage in Rivers State, 2013.
The ANOVA results indicate that at least two of the repeated measures (group means) of the 3 learning domains differed significantly. In practice, to formulate policies and for further scientific analysis there is need for a post hoc test to determine which particular repeated measures (group means or standard deviation) of the 3 learning domains vary significantly with respect to the F-ratio test statistic.
Table 20: A priori Test (Post Hoc Test)
Post Hoc test
Comparison Mean Difference T-Value P - Unadjusted P - Bonferroni Eta Squared
ENGLISH LANGUAGE ENGLISH and MATHEMATICS 4.557 1.708 0.102 0.305 0.113
ENGLISH and GENERAL SCIENCE
8.642 3.202 0.004 0.012 0.308
MATHEMATICS MATHEMATICS and GENERALSCIENCE
13.199 3.821 0.001 0.003 0.388
Source: MLA survey conducted by Arbitrage in Rivers State, 2013.
The sole aim of the table 20. ANOVA above; is to detect variance while the Post Hoc confirms that there is a
departure of the estimated dispersion or central tendency parameter from its notional value and standard
error. A significant mean difference of 11.4 and a total variation of about 64.5% exist within and across the
Literacy and Numeracy. A mean difference of 9.8 and a total variation of about 63.3% exist within and across
Literacy and Life Skills. Finally, a mean difference of 21.2 and a total variation of about 83.4% exist within
and across Numeracy and Life Skills.
It then becomes prerequisite to determine the correlation of the learning domains for effective policy
implementation.

October 31, 2013
[MONITORING LEARNING ACHIEVEMENT (MLA) IN RIVERS STATE PUBLIC SCHOOLS]
Page | 34 [email protected]
Source: MLA survey conducted by Arbitrage in Rivers State, 2013.
Fig.8 presents a pictorial analysis of the public secondary schools performances in the 3 learning domains
across the 23 L.G.As in Rivers State.
.000
10.000
20.000
30.000
40.000
50.000
60.000
ENGLISH
MATHEMATICSGENERALSCIENCE
49.773
45.215
58.415
Fig.8; Mean Distribution of Secondary Schools Learning Domains

October 31, 2013
[MONITORING LEARNING ACHIEVEMENT (MLA) IN RIVERS STATE PUBLIC SCHOOLS]
Page | 35 [email protected]
Table 21; Is a Correlation Matrix Displaying the Degree of Association or Dispersion Existing Between Secondary Schools Learning Domains.
ENGLISH MATHEMATICS GENERAL SCIENCE
ENGLISH 1
N -
P -
MATHEMATICS -.003 1
N 23 -
P .99 -
GENERAL SCIENCE .357 -.203 1
N 23 23 -
P .09 .35 -
Source: MLA survey conducted by Arbitrage in Rivers State, 2013.
The correlation appears in the off-diagonal positions.
The table is symmetrical, so the same information that is in the top-right is also in the bottom left.
Hypothesis tested: There is no relationship between any 2 pairs of educational domains i.e. in
English, Mathematics and General science.
The Spearman's Rho (P) indicates the direction and strength of the relationship which is a reliable
predictor and not basically a cause of the strength or weakness as the case may be.
(A) English and General Science had a statistically significant positive relationship, the strength
being 0.357, which means that a change in English Language learning domain will reliably predict a
positive change in the General Science learning domain.
(B) Mathematics and General Science had a statistically significant negative relationship, the
strength being -0.203, which means that a change in Mathematics learning domain will unfailingly
predict a negative change of in the General Science learning domain.
(C) English and Mathematics had a statistically significant negative relationship, the strength being -
0.003, which means that a change in English Language learning domain will consistently predict a
negative change in the Mathematics learning domain.

October 31, 2013
[MONITORING LEARNING ACHIEVEMENT (MLA) IN RIVERS STATE PUBLIC SCHOOLS]
Page | 36 [email protected]
Chapter 4
Benchmarking Rural and Urban Schools Performances against Mastery Levels.
1.1. Introduction: In this chapter, we highlight some differences (if any) which is aimed at improving learning
outcomes of rural-urban schools. Disparity is perceived to be a hindrance; there is therefore, the
need to bridge the rural-urban gap in learning outcomes through setting MML and improving
teacher quality and delivery with adequate provision of learning materials and accessibility of
school irrespective of seasons.
1.2. Why the idea of Minimum Mastery Level or Minimum Levels of Learning?
1. The need to lay down Minimum Mastery Levels of Learning (MML) emerges from the basic
concern that irrespective of caste, creed, location or sex, all children must be given access
to education of a comparable standard. The major focus of the policy formulation behind
the MML exercise is upon equity and reduction of existing disparities. The effort is to
combine quality concerns with concerns for equity keeping in view the developmental
needs of children from the disadvantaged and deprived sections of the society, the
dropouts, working children, and girls, who constitute the majority of school-going age
population in this country, and to whom, in all likelihood, at least for some time to come,
primary education will be the only opportunity for structured learning. This basic concern
underscores the approach adopted by the MLA team in defining the minimum Mastery
levels of learning.
2. Minimum Mastery levels of learning can, perhaps, be specified in a variety of ways. For
instance, MMLs can be stated as expected learning outcomes defined as observable
terminal behaviors. One may also go for a classification analysis of learning objectives such
as knowledge, comprehension, application, analysis, synthesis, evaluation and so on and
accordingly indicate the expected learning outcomes. One can also state the MMLs in terms
of learning competencies expected to be mastered by every child by the end of a particular
class or stage of education. These different approaches for stating the MMLs are not
mutually exclusive. Of the various alternatives available, the team has chosen to state the
MMLs in terms of a criterion-referenced assessment (mean control charts). Each
competency can be further delineated in terms of sub-competencies while specifying the
content inputs or measures of learning.
3. It may be noted that the set of MMLs would actually represent the rational criteria adopted
for judging the adequacy of the curricular inputs provided and the learning outcomes to be
expected. There can be no finality with respect to any set of MMLs. This applies to the set
of MMLs developed by the team also. Two basic considerations kept in view while
formulating the MMLs are:
(i) The cognitive capabilities of the children at different classes or grades
corresponding to different stage of development; and
(ii) The empirical reality in terms of the enabling environmental conditions that
characterize the primary education programs.

October 31, 2013
[MONITORING LEARNING ACHIEVEMENT (MLA) IN RIVERS STATE PUBLIC SCHOOLS]
Page | 37 [email protected]
4. An attempt has been made by the team to provide a technical analysis of the meaning of
Minimum Mastery Levels of Learning. That is, using learning competencies expected to be
mastered by every child by the end of a particular class or stage of education; which is a
criterion-referenced assessment employing the quality control approach procedure of X-bar
(mean) charts to portray the expectation in learning achievements.
1.3. Learning Continuum
The endeavor has been to set MMLs in as simple and comprehensible manner as possible,
specifying the competencies to be mastered under each learning domain from primary school
through secondary school. Learning has been seen as a 'continuum', in which the domains are
sequenced hierarchically so that the clusters of competencies in one domain build as directly as
possible on the competencies in the preceding domain. It is firmly believed that if the children
progress systematically through this continuum, mastering the concerned sets or competencies in
each domain before they move on to the next, learning each subsequent domain will be more
enjoyable and meaningful, and the achievement of minimum levels of learning will be facilitated.
1.4. Criterion-referenced Assessment
Criterion-referenced assessment is an assessment where an individual’s performance is
assessed based on a specific learning objective or performance standard and not compared to the
performance of other students or test takers as in norm-referenced assessment. It tends to
evaluate how well students are performing on specific goals or standards rather than how their
performance compares to a norm group of test takers. In criterion-referenced assessment, each
person is their own unique individual and is only compared to them. It involves teaching students
based on their needs with respect to a set standard/objective; and assessing them based on their
knowledge of such target standards. Thus, measuring against such fixed goals can be used to
examine the success of an educational reform program which seeks to raise the achievement of all
students unto new and improved standards .Hence, instead of comparing them to their peers of
same age or class; they are simply compared to their prior performance.
However, there exist some pitfalls in this assessment method as scholars argue about the
challenge posed by criterion-referenced assessment with regards to what becomes the acceptable
standard or yard-stick of measurement between all stakeholders involved. They argue that
academic standard will be lowered; and academic rigour and discipline will be lost when
competition is totally removed from the assessment system.
Given the preceding analysis it is now possible to objectively define the MML as the sum of
the mean score and thrice the standard deviation divided by the square root of the number of
L.G.As of the relevant learning domain, which corresponds to the upper control limit of the control
charts in each learning domain. So scoring above the upper limit signifies a mastery of the subject

October 31, 2013
[MONITORING LEARNING ACHIEVEMENT (MLA) IN RIVERS STATE PUBLIC SCHOOLS]
Page | 38 [email protected]
whereas scoring below the lower limit signals a failure in learning but within the control limits
indicates a possibility to attain the minimum mastery level. The technical analysis was prepared based
on the pupils and students performances in the tests administered to them during the MLA survey in July,
2013, as seen in table (22)
Table22. A Derived Criterion-Referenced Assessment Score Sheet for Rivers State Schools
PRIMARY SCHOOLS SECONDARY SCHOOLS
LEARNING DOMAINS LITERACY NUMERACY LIFE SKILLS
ENGLISH MATHEMATICS GENERAL SCIENCE
MINIMUM MASTERY LEVELS
57.2 44.9 66.9 44.5 40.0 50.5
DESIRED MASTERY LEVELS 64.9 54.3 74.8 54.8 50.4 66.3
Source: MLA survey conducted by Arbitrage in Rivers State, 2013.
The minimum mastery level (MML) as stated in table 22 above represents the least satisfactory
performance. It follows that pupils who score 57.2% in the Literacy learning domain have
performed satisfactorily in that domain as have those who score 44.9% in Numeracy or 66.9% in
Life Skills. The desired mastery level (DML) on the other hand depicts the expected performance. A
score of 64.9% in the Literacy domain is translated as a very promising performance. This applies to
all the other domains as stated in the table above.

October 31, 2013
[MONITORING LEARNING ACHIEVEMENT (MLA) IN RIVERS STATE PUBLIC SCHOOLS]
Page | 39 [email protected]
Source: MLA survey conducted by Arbitrage in Rivers State, 2013.
Fig.9, Shows that schools in 5 rural and 6 urban L.G.As achieved the desired mastery level (64.9).
There are schools in 3 rural and 6 urban L.G.As falling within the control limits, implying that they
have achieved the minimum mastery level (57.2) in literacy learning domain. However, there are
schools in 1 rural and 2 urban L.G.As who scored below the lower control limit thus performing
below expectation. In Literacy, 55.5% of the schools in 9 rural L.G.As and 42.8% of the schools in 14
urban L.G.As attained the desired mastery level. On the other hand, 33.3% of schools in rural and
42.8% of schools in urban L.G.As achieved minimum mastery levels while 11.1% of schools in rural
L.G.As and 14.2% of schools in urban L.G.As performed below expectation. Overall 90% of the
schools performance in Literacy was above 50%.
0.0
10.0
20.0
30.0
40.0
50.0
60.0
70.0
80.0
FIG.9; MASTERY LEVEL IN LITERACY
LITERACY AVERAGE STATE MEAN SCORE MML DML

October 31, 2013
[MONITORING LEARNING ACHIEVEMENT (MLA) IN RIVERS STATE PUBLIC SCHOOLS]
Page | 40 [email protected]
Source: MLA survey conducted by Arbitrage in Rivers State, 2013.
In Fig.10, schools in 3 rural and 4 urban L.G.As attained the desired mastery level (54.3), while
schools in 4 rural and 7 urban L.G.As achieved the minimum mastery level (44.9). Schools in the
remaining L.G.As performed below expectation. In numeracy learning domain, the schools in Bonny
performed the best with mean score 67.3, while the schools in Degema performed the least with
mean score 35.4. Overall, about 34% of the entire schools performed above the 50% mark in
Numeracy.
0.0
10.0
20.0
30.0
40.0
50.0
60.0
70.0
80.0
FIG.10; MASTERY LEVEL IN NUMERACY.
NUMERACY AVERAGE STATE MEAN SCORE MML DML

October 31, 2013
[MONITORING LEARNING ACHIEVEMENT (MLA) IN RIVERS STATE PUBLIC SCHOOLS]
Page | 41 [email protected]
Source: MLA survey conducted by Arbitrage in Rivers State, 2013.
Fig.11, Shows that schools in 2 rural and 3 urban L.G.As attained the desired mastery level (74.8),
while schools in 6 rural and 5 urban L.G.As achieved the minimum mastery level. The remaining
schools in 7 L.G.As all fell below the benchmark (66.9) for Life Skills. This implies that, they are yet
to master Life Skills curriculum as expected.
0.0
10.0
20.0
30.0
40.0
50.0
60.0
70.0
80.0
90.0
FIG.11; MASTERY LEVEL IN LIFE SKILLS.
LIFE SKILLS AVERAGE STATE MEAN SCORE MML DML

October 31, 2013
[MONITORING LEARNING ACHIEVEMENT (MLA) IN RIVERS STATE PUBLIC SCHOOLS]
Page | 42 [email protected]
Source: MLA survey conducted by Arbitrage in Rivers State, 2013.
In Fig.12, schools in 2 rural and 3 urban L.G.As achieved the desired benchmark (54.8) while schools
in 4 rural and 9 urban L.G.As attained the minimum mastery score (44.5). The remaining schools in
5 L.G.As did not meet the target. Categorically, we state that Port-Harcourt was the best achiever of
desired mastery level in English Language. Overall, about 47% of the entire schools scored at least
50% in English Language.
0.0
10.0
20.0
30.0
40.0
50.0
60.0
70.0
80.0
FIG.12; MASTERY LEVEL IN ENGLISH.
ENGLISH AVERAGE STATE MEAN SCORE MML DML
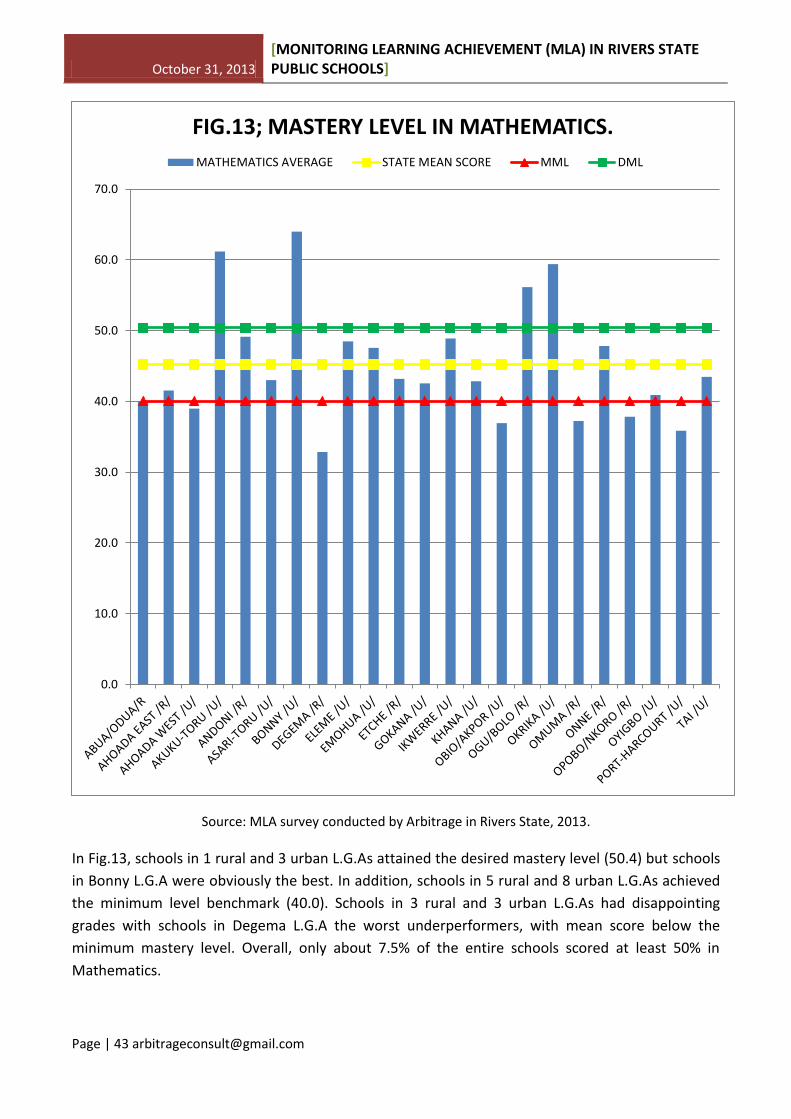
October 31, 2013
[MONITORING LEARNING ACHIEVEMENT (MLA) IN RIVERS STATE PUBLIC SCHOOLS]
Page | 43 [email protected]
Source: MLA survey conducted by Arbitrage in Rivers State, 2013.
In Fig.13, schools in 1 rural and 3 urban L.G.As attained the desired mastery level (50.4) but schools
in Bonny L.G.A were obviously the best. In addition, schools in 5 rural and 8 urban L.G.As achieved
the minimum level benchmark (40.0). Schools in 3 rural and 3 urban L.G.As had disappointing
grades with schools in Degema L.G.A the worst underperformers, with mean score below the
minimum mastery level. Overall, only about 7.5% of the entire schools scored at least 50% in
Mathematics.
0.0
10.0
20.0
30.0
40.0
50.0
60.0
70.0
FIG.13; MASTERY LEVEL IN MATHEMATICS.
MATHEMATICS AVERAGE STATE MEAN SCORE MML DML

October 31, 2013
[MONITORING LEARNING ACHIEVEMENT (MLA) IN RIVERS STATE PUBLIC SCHOOLS]
Page | 44 [email protected]
Source: MLA survey conducted by Arbitrage in Rivers State, 2013.
In Fig.14, schools in 3 rural and 4 urban L.G.As attained the desired mastery level (66.3). Other
schools in 3 rural and 6 urban L.G.As achieved the minimum mastery level (50.5). A third team of
schools in 3 rural and 4 urban L.G.As performed below expectation with schools in Bonny scoring
the least. Generally, at least 80% of the entire schools scored above 50 % in General Science.
0.0
10.0
20.0
30.0
40.0
50.0
60.0
70.0
80.0
FIG.14; MASTERY LEVEL IN GENERAL SCIENCE.
GENERAL SCIENCE AVERAGE STATE MEAN SCORE MML DML
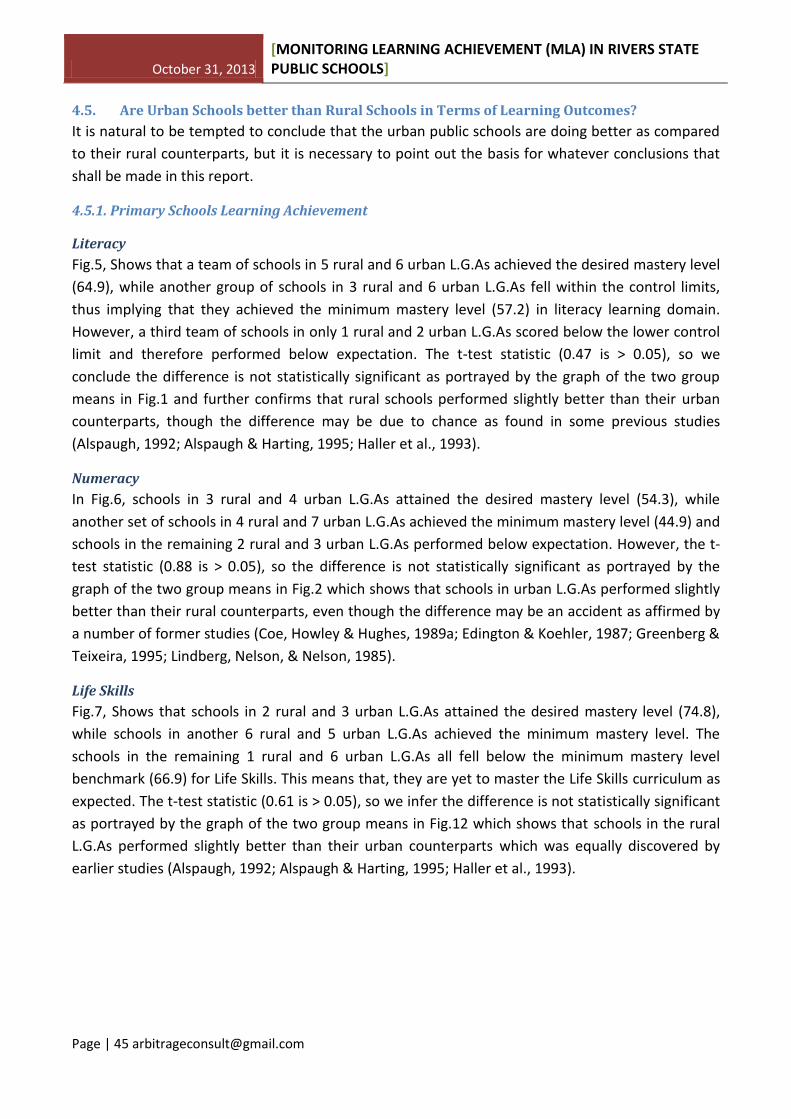
October 31, 2013
[MONITORING LEARNING ACHIEVEMENT (MLA) IN RIVERS STATE PUBLIC SCHOOLS]
Page | 45 [email protected]
4.5. Are Urban Schools better than Rural Schools in Terms of Learning Outcomes?
It is natural to be tempted to conclude that the urban public schools are doing better as compared
to their rural counterparts, but it is necessary to point out the basis for whatever conclusions that
shall be made in this report.
4.5.1. Primary Schools Learning Achievement
Literacy
Fig.5, Shows that a team of schools in 5 rural and 6 urban L.G.As achieved the desired mastery level
(64.9), while another group of schools in 3 rural and 6 urban L.G.As fell within the control limits,
thus implying that they achieved the minimum mastery level (57.2) in literacy learning domain.
However, a third team of schools in only 1 rural and 2 urban L.G.As scored below the lower control
limit and therefore performed below expectation. The t-test statistic (0.47 is > 0.05), so we
conclude the difference is not statistically significant as portrayed by the graph of the two group
means in Fig.1 and further confirms that rural schools performed slightly better than their urban
counterparts, though the difference may be due to chance as found in some previous studies
(Alspaugh, 1992; Alspaugh & Harting, 1995; Haller et al., 1993).
Numeracy
In Fig.6, schools in 3 rural and 4 urban L.G.As attained the desired mastery level (54.3), while
another set of schools in 4 rural and 7 urban L.G.As achieved the minimum mastery level (44.9) and
schools in the remaining 2 rural and 3 urban L.G.As performed below expectation. However, the t-
test statistic (0.88 is > 0.05), so the difference is not statistically significant as portrayed by the
graph of the two group means in Fig.2 which shows that schools in urban L.G.As performed slightly
better than their rural counterparts, even though the difference may be an accident as affirmed by
a number of former studies (Coe, Howley & Hughes, 1989a; Edington & Koehler, 1987; Greenberg &
Teixeira, 1995; Lindberg, Nelson, & Nelson, 1985).
Life Skills
Fig.7, Shows that schools in 2 rural and 3 urban L.G.As attained the desired mastery level (74.8),
while schools in another 6 rural and 5 urban L.G.As achieved the minimum mastery level. The
schools in the remaining 1 rural and 6 urban L.G.As all fell below the minimum mastery level
benchmark (66.9) for Life Skills. This means that, they are yet to master the Life Skills curriculum as
expected. The t-test statistic (0.61 is > 0.05), so we infer the difference is not statistically significant
as portrayed by the graph of the two group means in Fig.12 which shows that schools in the rural
L.G.As performed slightly better than their urban counterparts which was equally discovered by
earlier studies (Alspaugh, 1992; Alspaugh & Harting, 1995; Haller et al., 1993).

October 31, 2013
[MONITORING LEARNING ACHIEVEMENT (MLA) IN RIVERS STATE PUBLIC SCHOOLS]
Page | 46 [email protected]
4.5.2. Secondary Schools Learning Achievement
English
In Fig.12, a first team of schools in only 2 rural and 3 urban L.G.As achieved the desired mastery
level benchmark (54.8), while another team of schools in 4 rural and 9 urban L.G.As attained the
minimum mastery level score (44.5), a latter team of schools in 3 rural and 4 urban L.G.As did not
meet the target. Categorically, we state that Port-Harcourt was the best achiever of desired
mastery level in English. The t-test statistic (0.07 is < 0.05), so we conclude the difference is
statistically significant and therefore obligates we reject the null hypothesis and accept the
alternative that there exist significant differences between the learning outcomes of students in
rural areas when compared to their urban peers in Rivers State. Fig.8 shows that urban schools
performed considerably better than their rural counterparts, and this is guaranteed if the students
are exposed to similar conditions as established by some other prior studies (Coe, Howley &
Hughes, 1989a; Edington & Koehler, 1987; Greenberg & Teixeira, 1995; Lindberg, Nelson, & Nelson,
1985).
Mathematics
In Fig.13, a former group of schools in 1 rural and 3 urban L.G.As attained the desired mastery level
(50.4) with schools in Bonny obviously the best. Another set of schools in 5 rural and 8 urban L.G.As
achieved the minimum mastery level benchmark (40.0). The last set of schools in 3 rural and 3
urban L.G.As had disappointingly low grades with schools in Degema being the worst
underperformers. The t-test statistic (0.29 which is > 0.05) signaled a non-statistical difference with
Fig.9 further buttressing the fact that urban schools performed fairly better than their rural
counterparts although, this may be caused by chance; in accordance to some erstwhile studies
(Coe, Howley & Hughes, 1989a; Edington & Koehler, 1987; Greenberg & Teixeira, 1995; Lindberg,
Nelson, & Nelson, 1985).
General Science
In Fig.14, a band of schools in 3 rural and 4 urban L.G.As attained the desired mastery level (66.3),
while another team of schools in 3 rural and 6 urban L.G.As achieved the minimum mastery level
(50.5). In addition, a final group, of schools in 3 rural and 4 urban L.G.As performed below
expectation with Bonny being the worst. The t-test statistic (0.71 which is > 0.05) did not exhibit
any statistical difference to reject the null hypothesis that there exists no significant difference,
hence, rural schools slightly excelled above their urban counterparts. Reason may be caused by
chance (Alspaugh, 1992; Alspaugh & Harting, 1995; Haller et al., 1993).

October 31, 2013
[MONITORING LEARNING ACHIEVEMENT (MLA) IN RIVERS STATE PUBLIC SCHOOLS]
Page | 47 [email protected]
Chapter 5
Summary and Conclusion
Performance comparisons were made for state representative samples of specifically primary 4
pupils (5,595 rural and 8,145 urban) and JSS 2 students (2,115 rural and 2,280 urban) in Literacy,
Numeracy, Life Skills, English, Mathematics and General Science. The research found that rural
pupils performed relatively better than their urban peers in Literacy and Life Skills at primary 4 level
as did the rural students in General Science at JSS 2 level, while urban pupils performed relatively
better than their rural counterparts in Numeracy at primary 4 level and in Mathematics at JSS 2
level.
Interestingly and worthy of note, is that in English Language the urban schools’ students performed
considerably better than their rural counterparts and this is guaranteed based on the findings of
this study if the JSS 2 students are subjected to similar conditions.
So, we may conclude that at primary 4 levels the rural schools’ students have maintained a very
high level of competence relative to their urban counterparts having surpassed them in Literacy
and Life Skills similar to findings of (Alspaugh, 1992; Alspaugh & Harting, 1995; Haller et al., 1993).
However, rural schools’ students need to show same or even greater determination at JSS 2 level in
Mathematics and most especially in English Language where the difference is considerably
significant.
The findings of this study provide sufficient evidence that, all things being equal, rural students
suffer disadvantage in English Language simply as a result of their residence in rural areas or their
attendance at rural schools.
Recommendation
Improving Learning Outcomes in Rural Schools?
Disparity is perceived to be a hindrance; there is therefore, the need:
1. For a rural head-start program.
2. For extension classes for rural pupils and students most especially in Mathematics and
English Language.
3. For special salary weighting allowances for rural-based teachers.
4. To develop a social safety net with emphasis on education focused conditional cash transfer.
5. To bridge the rural-urban gap in learning outcomes through setting MML and improving teacher quality and delivery with adequate provision of learning materials and accessibility of school irrespective of seasons.

October 31, 2013
[MONITORING LEARNING ACHIEVEMENT (MLA) IN RIVERS STATE PUBLIC SCHOOLS]
Page | 48 [email protected]
REFERENCES
1. A.O.Ajayi and B. Sokan (eds) (2011), Primary school Facilities, Materials, Utilisation and Improvement in Publishing.
2. Adedeji, S.O. (1998). Nigerian Education; Trends and Issues. Ile Ife, University of Ife Press Limited. pp. (16-17)
3. Adesina, S. (1981). Rural and Nonrural Secondary Science Teachers: Evidence from the Longitudinal Study of American Youth. Journal of Research in Rural Education, 8, 110.rural educators.
4. Ahmed, U.B. (1999). What is Educational Planning? In Adesina, S.(Ed) Introduction to Educational Planning, University of Ife Press Ltd 1-10.
5. Ajayi, A.O. (1996). An overview of Mass Failure will continue until… Nigeria Tribune, Thursday 25 Nov.
6. Akande, A. (1990). Influences of Urban-Rural Upbringing on Nigerian Students' Test Anxiety. Psychological Reports, 67, 1261-1262.
7. Akande, O.M. (1985). Organisation for Economic Cooperation and Development. 8. Akinkugbe,O. O. (1994). Hints on Teaching Practice and General Principles of Education.
Lagos, OSKO Associates. 9. Akintayo M.O. (1997). Nigeria and Education: The Challenges Ahead. Intec Printers Limited,
Ibadan. 10. Akinwumiju, J.A. and Orimoloye, P.S. (1987) .Effective Management of Primary Education. 11. Alasia, A. (2003). Rural and urban educational attainment: An investigation 12. Alspaugh, J. W. (1992). Socioeconomic measures and achievement: Urban vs. rural. Rural
Educator, 13,2-7. 13. Bowlby, G. (2005). Looker, D. (2001).Human capital and rural development: what are the
policy research issues for Canadian youth: 14. Canadian Journal of Education, 25, 4 (2000) 328-343. Differences between changing times. 15. Coe, P., Howley, C. B., & Hughes, M. (1989b). The condition of rural education in Virginia: A
profile. Charleston, WV: Appalachia Educational Laboratory. (ERIC Document Reproduction Service No. ED 319 577)
16. Coe, P., Howley, C. B., & Hughes, M. (I989a). The Condition of Rural Education in Kentucky: A profile. Charleston, WV: Appalachia Educational Laboratory. (ERIC Document Reproduction Service No. ED 319 579)
17. Cohen, J. (1988). Statistical Power Analysis for the Behavioral Sciences 18. Coladarci, T., & Cobb, C. D. (1996). Extracurricular participation, Conference Proceedings CD
of the National Association for Research in Education Matters: Insights on Education, Learning and Training in Canada.
19. Fafuwa, B.: (1979), History of Education in Nigeria 20. George Allen & Unwin Publishers, London.2. Grimmett, P. & Echols, F. (2000). Teacher and
administrator shortages. 21. Moir, E. & Gless, J. (2001). Quality induction: An investment in teachers. Teacher Education
Quarterly, 28, 109-114. 22. National Bureau of Statistics, Federal Republic of Nigeria Official Gazatte (FGP
71/52007/2,500(0L24). (2006) 23. National Demographic Survey, 2010; A publication of the National Bureau of Statistics.

October 31, 2013
[MONITORING LEARNING ACHIEVEMENT (MLA) IN RIVERS STATE PUBLIC SCHOOLS]
Page | 49 [email protected]
24. Nielsen, W. (2004). Accessing senior science courses in rural BC: A cultural border crossing metaphor. Paper presented at the annual meeting of the Canadian Society for Studies. Winnipeg, May 2004.
25. Nielsen, W., Nashon, S. M., & Mutonyi, H. (2005). Offering Senior Science in Small Rural British Columbia Schools: Perceptual Expectations of Students.
26. Rural School Development Outreach Project. (ERIC Document Reproduction Service No. ED 401 115) school size, and achievement and self-esteem among high school students: A national look.
27. Small Rural British Columbia Schools: Perceptual Expectations of Students. Statistics Canada Catalogue number 21-601-MIE1999039. Statistics Canada Catalogue number 81-004-XIE.
28. Suleiman A. Ahmad, Yunusa Abubakar, Jacob Itse Dabo (2013): Information and communication technology acceptance for teaching and learning among secondary school teachers in Nigeria. ISSN: 2186-845X ISSN: 2186-8441 Print Vol. 2. No.1. January 2013.
29. The Jomtien Declaration in 1990 and the follow-up Framework for Action adopted at the World Education Forum in Dakar, Senegal in April 2000.
30. UBE Report 2003, A publication of the Universal Basic Education Commission.3. 31. Westing, D.L. & Whitten, T.M. (1996). Rural special education teachers’ plans to continue or
leave their teaching positions. Exceptional Children, 62, 319-335.

October 31, 2013
[MONITORING LEARNING ACHIEVEMENT (MLA) IN RIVERS STATE PUBLIC SCHOOLS]
Page | 50 [email protected]
APPENDIX 1: Rural Schools performances against Rural and State Mean Scores
The above bar chart (Fig.1A) displays the disparities in the mean scores of the rural public primary
schools from rural and State mean scores in Literacy. It can clearly be seen that schools in Omuma
L.G.A performed the best in Literacy with schools in Ogu/Bolo, Abua/Odua and Opobo/Nkoro also
exceeding both rural and state mean scores while schools in Andoni were among the worst
performers in literacy followed by schools in Ahoada East and Degema respectively.
0
10
20
30
40
50
60
70
80
Fig.1A; RURAL PRIMARY SCHOOLS LITERACY
L.G.A AVERAGE RURAL MEAN SCORE STATE MEAN SCORE

October 31, 2013
[MONITORING LEARNING ACHIEVEMENT (MLA) IN RIVERS STATE PUBLIC SCHOOLS]
Page | 51 [email protected]
Fig.1B: portrays the performance of the rural public primary schools in Numeracy where schools in
Ogu/Bolo L.G.A outshined schools in the other 3 rural L.G.A’s who surpassed the Rural and State
mean scores. Schools in Degema L.G.A were the worst performers and immediately followed by
schools in Ahoada East L.G.A. In numeracy about 102 schools from 4 L.G.A’s surpassed the rural and
state mean scores while about 271 schools from the remaining 5 L.G.As performed below the
benchmark.
0
10
20
30
40
50
60
70
Fig.1B; RURAL PRIMARY SCHOOLS NUMERACY
L.G.A AVERAGE RURAL MEAN SCORE STATE MEAN SCORE
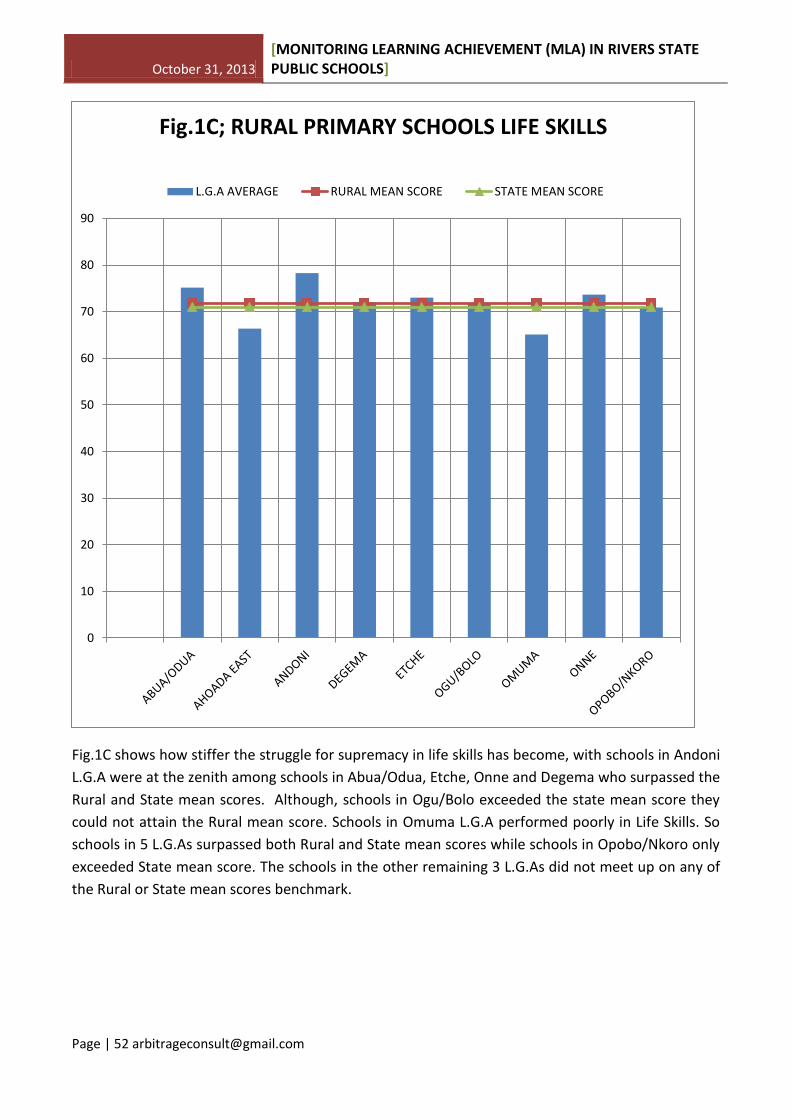
October 31, 2013
[MONITORING LEARNING ACHIEVEMENT (MLA) IN RIVERS STATE PUBLIC SCHOOLS]
Page | 52 [email protected]
Fig.1C shows how stiffer the struggle for supremacy in life skills has become, with schools in Andoni
L.G.A were at the zenith among schools in Abua/Odua, Etche, Onne and Degema who surpassed the
Rural and State mean scores. Although, schools in Ogu/Bolo exceeded the state mean score they
could not attain the Rural mean score. Schools in Omuma L.G.A performed poorly in Life Skills. So
schools in 5 L.G.As surpassed both Rural and State mean scores while schools in Opobo/Nkoro only
exceeded State mean score. The schools in the other remaining 3 L.G.As did not meet up on any of
the Rural or State mean scores benchmark.
0
10
20
30
40
50
60
70
80
90
Fig.1C; RURAL PRIMARY SCHOOLS LIFE SKILLS
L.G.A AVERAGE RURAL MEAN SCORE STATE MEAN SCORE

October 31, 2013
[MONITORING LEARNING ACHIEVEMENT (MLA) IN RIVERS STATE PUBLIC SCHOOLS]
Page | 53 [email protected]
APPENDIX 2: Urban Schools performances against Urban and State Mean Scores
In Fig.2A above, schools in Oyigbo L.G.A were the best performers in Literacy, with schools in Tai,
Asari-Toru, Ikwerre, Obio/Akpor, Bonny and Okirika all trailing behind respectively besides
exceeding the Urban and State mean scores. The worst performers were schools in Ahoada West
L.G.A followed by schools in Emohua, Eleme and Khana L.G.As.
0
10
20
30
40
50
60
70
80
Fig.2A; URBAN PRIMARY SCHOOLS LITERACY
L.G.A AVERAGE URBAN MEAN SCORE STATE MEAN SCORE

October 31, 2013
[MONITORING LEARNING ACHIEVEMENT (MLA) IN RIVERS STATE PUBLIC SCHOOLS]
Page | 54 [email protected]
Fig.2B shows that schools in 5 L.G.As actually scored above the Urban and State mean scores with
schools in Bonny obviously the best in Numeracy while the schools in the other remaining 9 L.G.As
scored below the Urban and State mean scores, with schools in Asari-Toru being the worst
performers.
0
10
20
30
40
50
60
70
80
Fig.2B: URBAN PRIMARY SCHOOLS NUMERACY
L.G.A AVERAGE URBAN MEAN SCORE STATE MEAN SCORE

October 31, 2013
[MONITORING LEARNING ACHIEVEMENT (MLA) IN RIVERS STATE PUBLIC SCHOOLS]
Page | 55 [email protected]
Fig.2C displays Obio/Akpor ahead in Life Skills with Okrika, Ikwerre, Tai, Oyigbo, Port-Harcourt and
Eleme L.G.A’s surpassing the urban/state mean scores. However, all other L.G.A’s rallying so close
to the urban/state mean scores with the exception of Gokana who are afar off the cut-off scores. In
Life Skills, 6 of the urban L.G.A’s performed above the cut-off scores.
0
10
20
30
40
50
60
70
80
90
Fig.2C; URBAN PRIMARY SCHOOLS LIFE SKILLS
L.G.A AVERAGE URBAN MEAN SCORE STATE MEAN SCORE

October 31, 2013
[MONITORING LEARNING ACHIEVEMENT (MLA) IN RIVERS STATE PUBLIC SCHOOLS]
Page | 56 [email protected]
Fig.2D, Port-Harcourt finally stamps its supremacy in English having Scored well above both
Urban/State mean scores with Asari-Toru and Okrika the only other two L.G.A’s to surpass both
cut-off scores. Obio/Akpor, Bonny and Onne are among those who surpassed the Urban/State
mean scores leaving all remaining L.G.A’s below the cut-off scores but Khana the least of all in
English.
0
10
20
30
40
50
60
70
80
Fig.2D: PERCENTAGE MEAN SCORE (ENGLISH) IN URBAN SECONDARY SCHOOLS
LGA AVERAGE URBAN MEAN SCORE STATE MEAN SCORE
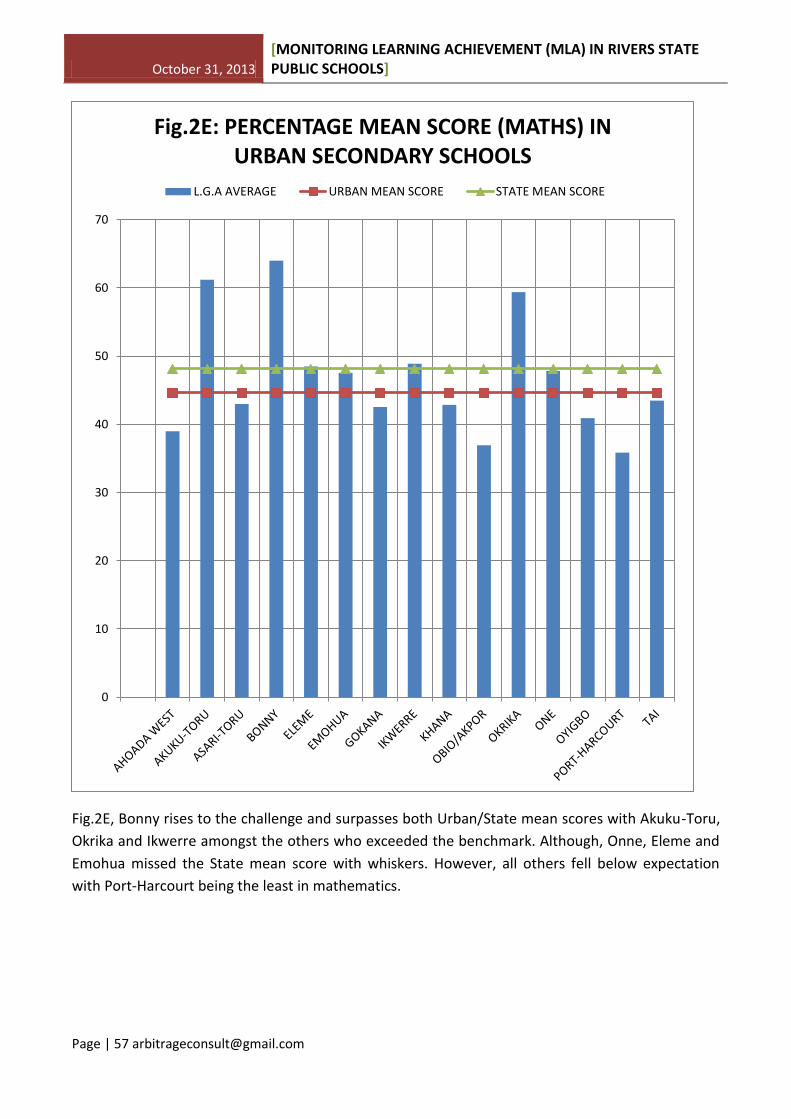
October 31, 2013
[MONITORING LEARNING ACHIEVEMENT (MLA) IN RIVERS STATE PUBLIC SCHOOLS]
Page | 57 [email protected]
Fig.2E, Bonny rises to the challenge and surpasses both Urban/State mean scores with Akuku-Toru,
Okrika and Ikwerre amongst the others who exceeded the benchmark. Although, Onne, Eleme and
Emohua missed the State mean score with whiskers. However, all others fell below expectation
with Port-Harcourt being the least in mathematics.
0
10
20
30
40
50
60
70
Fig.2E: PERCENTAGE MEAN SCORE (MATHS) IN URBAN SECONDARY SCHOOLS
L.G.A AVERAGE URBAN MEAN SCORE STATE MEAN SCORE
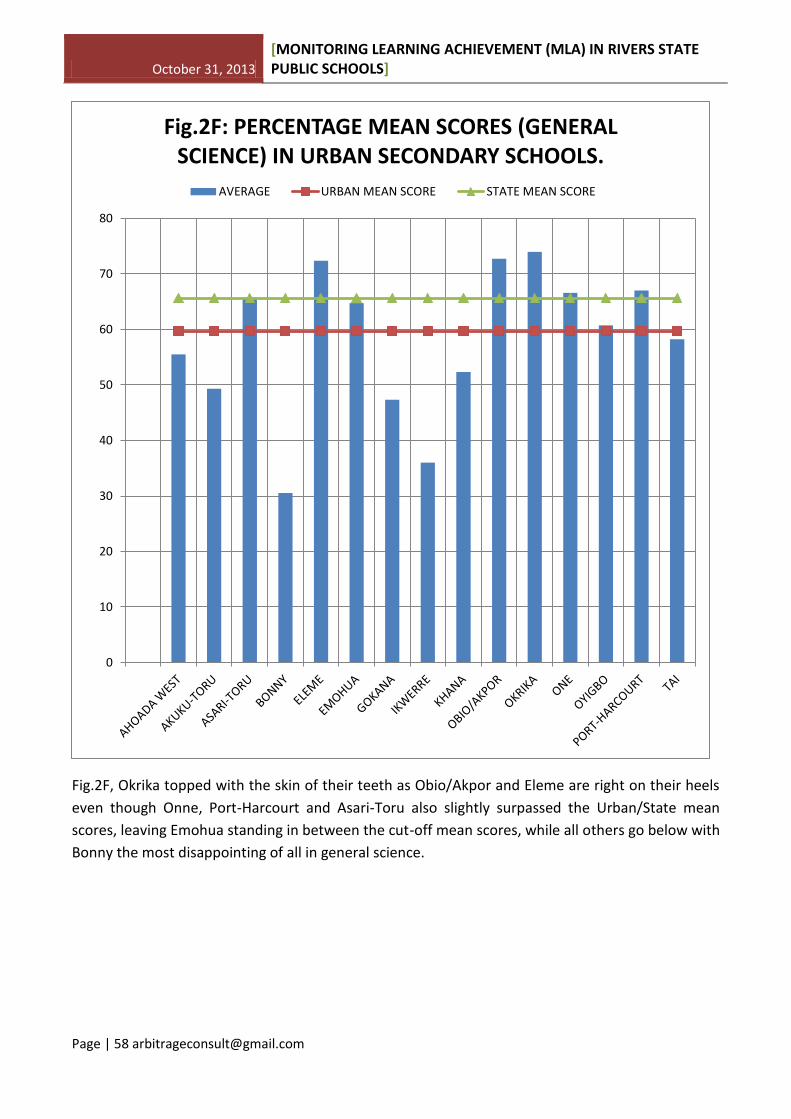
October 31, 2013
[MONITORING LEARNING ACHIEVEMENT (MLA) IN RIVERS STATE PUBLIC SCHOOLS]
Page | 58 [email protected]
Fig.2F, Okrika topped with the skin of their teeth as Obio/Akpor and Eleme are right on their heels
even though Onne, Port-Harcourt and Asari-Toru also slightly surpassed the Urban/State mean
scores, leaving Emohua standing in between the cut-off mean scores, while all others go below with
Bonny the most disappointing of all in general science.
0
10
20
30
40
50
60
70
80
Fig.2F: PERCENTAGE MEAN SCORES (GENERAL SCIENCE) IN URBAN SECONDARY SCHOOLS.
AVERAGE URBAN MEAN SCORE STATE MEAN SCORE