rural study: rural ayrshire and the isles of arran ... b... · figure 2.4: distribution of age...
TRANSCRIPT
Report for South Ayrshire Council Prepared by
In collaboration with
Date 11 June 2013
EKOS Limited, St. George’s Studios, 93-97 St. George’s Road, Glasgow, G3 6JA
Reg 145099
Telephone: 0141 353 1994 Web: www.ekos-consultants.co.uk
Rural Study: Rural Ayrshire and the Isles of Arran & Cumbraes
(Annex – B)

Direct enquiries regarding this report should be submitted to:
Regina Trenkler-Fraser, Associate Director, EKOS
Email: [email protected]
Tel: 0141 353 8317
As part of our green office policy all EKOS reports are printed double sided on 100%
sustainable paper
Contents
1. Introduction 1
2. Demographics 4
3. Housing 14
4. Poverty and Deprivation 22
5. Access to Services and Transport 27
6. Employment 34
7. Skills, Qualifications and Quality of Employment 43
8. Business Base 47
9. Unemployment 58
10. Other Sectors 60
11. Comparator Review 64

Annex B – Statistical Analysis – Rural Study: Rural Ayrshire and the Isles of Arran and the Cumbraes
1
Socio-Economic Statistics and Analysis
1. Introduction
This Annex presents the statistical analysis of the rural area of North, East and
South Ayrshire which has been conducted in relation to the ‘Rural Study: Rural
Ayrshire and the Isles of Arran & Cumbraes’. The study has been commissioned by
South Ayrshire Council.
This report presents the detailed findings of the socio-economic review of available
data from sources such as the Scottish National Statistics (SNS), the Scottish Index
of Multiple Deprivation (SIMD), Scottish Household Survey, Annual Population
Survey, NOMIS (Office of National Statistics), Annual Business Inquiry (ABI),
Scottish Census Results On Line (SCROL), and others.
As the current Census data (2011) is unavailable in Scotland, we needed to present
data from the 2001 Census.
In addition, our research has included a comparator LEADER area (Forth Valley and
Lomond LEADER). In order not to present an over-complex analysis, we have added
the comparative analysis as a separate chapter of this Annex.
A summary of the key findings of the statistical analysis is presented in the main
body of the ‘Rural Study’ report.
1.1 Area Definition
The statistical analysis has been undertaken at a number of levels to reflect the
various geographical and thematic characteristics of the study area including the
differences in defining rural Scotland.
Scottish Government Definition of Rural Scotland and LEADER
The Scottish Government urban rural classification system contains a number of
increasingly refined definitions of the urban and rural areas in Scotland.
Annex B – Statistical Analysis – Rural Study: Rural Ayrshire and the Isles of Arran and the Cumbraes
2
Based on the three-fold urban/rural definition, ‘rural’ is defined as any settlement with
a population of less than 3,000. By analysing drive times to larger settlements this is
further divided into:
Accessible rural: those with a less than 30 minute drive time to the nearest
settlement with a population of 10,000 or more;
Remote rural: those with a greater than 30 minute drive time to the nearest
settlement with a population of 10,000 or more.
However, the areas included in the LEADER Programme go further than the
‘accessible and remote rural’ definitions. The European Commission defines
LEADER areas as any settlement up to 10,000 population. This coincides with the
six-fold Scottish urban rural definition1 whereby remote and accessible towns are
also deemed to be ‘rural’.
Accessible Small Towns: Settlements of between 3,000 and 10,000 people
and within 30 minutes drive of a settlement of 10,000 or more; and
Remote Small Towns: Settlements of between 3,000 and 10,000 people and
with a drive time of over 30 minutes to a settlement of 10,000 or more.
In addition, the eligibility for LEADER (Axis 4 funding under the SRDP) is slightly
more flexible as it accepts even towns with more than 10,000 inhabitants (Other
Urban Towns – according to the six-fold Scottish urban rural definition) if the
geographic and thematic justification is made for their inclusion into the respective
LEADER area (in the case of Ayrshire LEADER there are 18 ‘other urban’
datazones).
Study Area
In order to maintain a broad understanding of the rural area in Ayrshire, the analysis
has been undertaken for rural (accessible and remote rural areas with less than
3,000 population), LEADER (rural, towns, and other urban areas) as well as urban
areas within each of the three local authority areas within Ayrshire:
North Ayrshire;

Annex B – Statistical Analysis – Rural Study: Rural Ayrshire and the Isles of Arran and the Cumbraes
3
East Ayrshire; and
South Ayrshire.
To determine the rural/LEADER/urban split each local authority has been analysed
at datazone2 level. In total, Ayrshire is made up of 480 datazones: 179 in North
Ayrshire; 154 in East Ayrshire and 147 in South Ayrshire.
The datazones for each local authority area have then been grouped in terms of the
urban/rural definition (see above) and the LEADER area. Table 2.1 details the
breakdown of local authority area.
Table 1.1: Local Authority by Urban/Rural/LEADER Split
Rural (accessible and remote)
LEADER (inclusive of rural, towns and urban
datazones)
Urban
(towns and urban) Total
North Ayrshire 20 64 159 179
East Ayrshire 44 92 110 154
South Ayrshire 29 44 118 147
Total Ayrshire 93 200 387 480
Source: Scottish Government Urban Rural Classification
Figure 1.1 provides a visual representation of the LEADER area and the extent to
which the area also includes towns and urban areas. The LEADER area is outlined
in red.
Source: Scottish Neighbourhood Statistics (SNS)
2 “Data zones are groups of 2001 Census output areas and have populations of between 500 and 1,000 household
residents. Where possible, they have been made to respect physical boundaries and natural communities” Scottish Government.
2044 29
44
48
15
115 62
103
0
50
100
150
200
North Ayrshire East Ayrshire South Ayrshire
Figure 1.1: LEADER and Urban Datazones by Local Authority
Rural LEADER Towns and Urban LEADER Urban Datazones

Annex B – Statistical Analysis – Rural Study: Rural Ayrshire and the Isles of Arran and the Cumbraes
4
2. Demographics
Population
The total Ayrshire population in 2011 of 366,890 accounted for 6.4% of the total
population in Scotland. Although the distribution of the population across the three
local authorities is relatively even, North Ayrshire is the largest local authority area
with 135,130 residents accounting for 37% of Ayrshire’s total population, Table 2.1..
Table 2.1: Population (2011)
Population As a % of Total Ayrshire
Population
North Ayrshire 135,130 37%
East Ayrshire 120,200 33%
South Ayrshire 111,560 30%
Total Ayrshire 336,890 100%
Source: SNS – mid year population estimate
Each local authority area population has been further split into rural (accessible and
remote) and urban (including towns) locations, as Figure 2.1 shows.
Source: SNS – mid year population estimate
12%29% 22% 21%
88%71% 78% 79%
0%
20%
40%
60%
80%
100%
North Ayrshire East Ayrshire South Ayrshire Ayrshire
Figure 2.1: Population by Rural/Urban Split (2011)
Rural Urban
Annex B – Statistical Analysis – Rural Study: Rural Ayrshire and the Isles of Arran and the Cumbraes
5
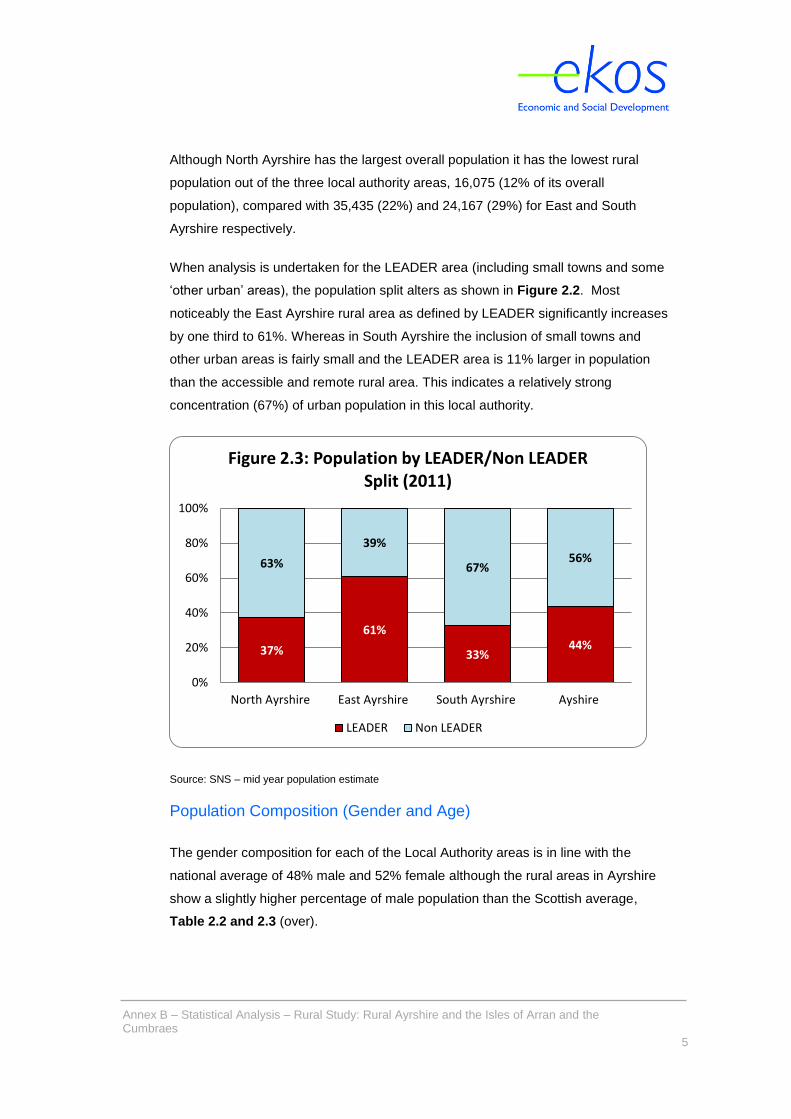
Although North Ayrshire has the largest overall population it has the lowest rural
population out of the three local authority areas, 16,075 (12% of its overall
population), compared with 35,435 (22%) and 24,167 (29%) for East and South
Ayrshire respectively.
When analysis is undertaken for the LEADER area (including small towns and some
‘other urban’ areas), the population split alters as shown in Figure 2.2. Most
noticeably the East Ayrshire rural area as defined by LEADER significantly increases
by one third to 61%. Whereas in South Ayrshire the inclusion of small towns and
other urban areas is fairly small and the LEADER area is 11% larger in population
than the accessible and remote rural area. This indicates a relatively strong
concentration (67%) of urban population in this local authority.
Source: SNS – mid year population estimate
Population Composition (Gender and Age)
The gender composition for each of the Local Authority areas is in line with the
national average of 48% male and 52% female although the rural areas in Ayrshire
show a slightly higher percentage of male population than the Scottish average,
Table 2.2 and 2.3 (over).
37%
61%
33%44%
63%
39%
67%56%
0%
20%
40%
60%
80%
100%
North Ayrshire East Ayrshire South Ayrshire Ayshire
Figure 2.3: Population by LEADER/Non LEADER Split (2011)
LEADER Non LEADER

Annex B – Statistical Analysis – Rural Study: Rural Ayrshire and the Isles of Arran and the Cumbraes
6
Table 2.2: Gender (2011)
Male Female
Rural North Ayrshire 49% 51%
Rural East Ayrshire 50% 50%
Rural South Ayrshire 49% 51%
LEADER N Ayrshire 48% 52%
LEADER E Ayrshire 48% 52%
LEADER S Ayrshire 49% 51%
North Ayrshire 47% 53%
East Ayrshire 48% 52%
South Ayrshire 48% 52%
Scotland 48% 52%
Source: SNS – mid year population estimate
Table 2.3: Gender (2011)
Male Female
Total Rural Ayrshire 49% 51%
LEADER Ayrshire 48% 52%
Source: SNS – mid year population estimate
In terms of age distribution, the Scottish population presented a 17%, 66%, 17% split
of the three age groups (0-15, 16-64 and 65 and over). The rural areas of Ayrshire
are similar to the national and local authority averages although with a slightly higher
proportion of over 65 year olds due to a slightly smaller percentage of working age
population.
Figure 2.3 (over) illustrates how the rural and urban areas compare in their age
distribution across the three local authority areas in Ayrshire.

Annex B – Statistical Analysis – Rural Study: Rural Ayrshire and the Isles of Arran and the Cumbraes
7
Source: SNS – mid year population estimate
Figure 2.3 shows that the distribution of age groups between rural and urban areas
is not significantly different in any of the three local authorities. Only in rural North
Ayrshire, there is a slightly higher percentage of 65 year olds and over (21%) than in
its urban counterpart (19%).
Rural and LEADER age distribution follows the same distribution pattern, with the
working age population ranging from 62% to 65% of the total population (slightly
below the Scottish average of 66%), Figure 2.4.
Source: SNS
17% 18% 17% 18% 17% 16%
62% 65% 63% 63% 65% 62%
21% 18% 20% 19% 18% 22%
0%
20%
40%
60%
80%
100%
Rural NAyrshire
Rural EAyrshire
Rural SAyrshire
Urban NAyrshire
Urban EAyrshire
Urban SAyrshire
Figure 2.3: Distribution of Age Groups of Urban and Rural Areas in the Three Local Authorities in 2011
0-15 16-64 65 and over
17% 18% 17% 17% 17% 17%
62% 65% 63% 62% 65% 63%
21% 18% 20% 22% 18% 20%
0%
20%
40%
60%
80%
100%
Rural NorthAyrshire
Rural EastAyrshire
Rural SouthAyrshire
LEADERNorth
Ayrshire
LEADER EastAyrshire
LEADERSouth
Ayrshire
Figure 2.4: Distribution of Age Groups of Rural and LEADER Areas in the Three Local Authorities in 2011
0-15 16-64 65 and over
Annex B – Statistical Analysis – Rural Study: Rural Ayrshire and the Isles of Arran and the Cumbraes
8
Source: SNS
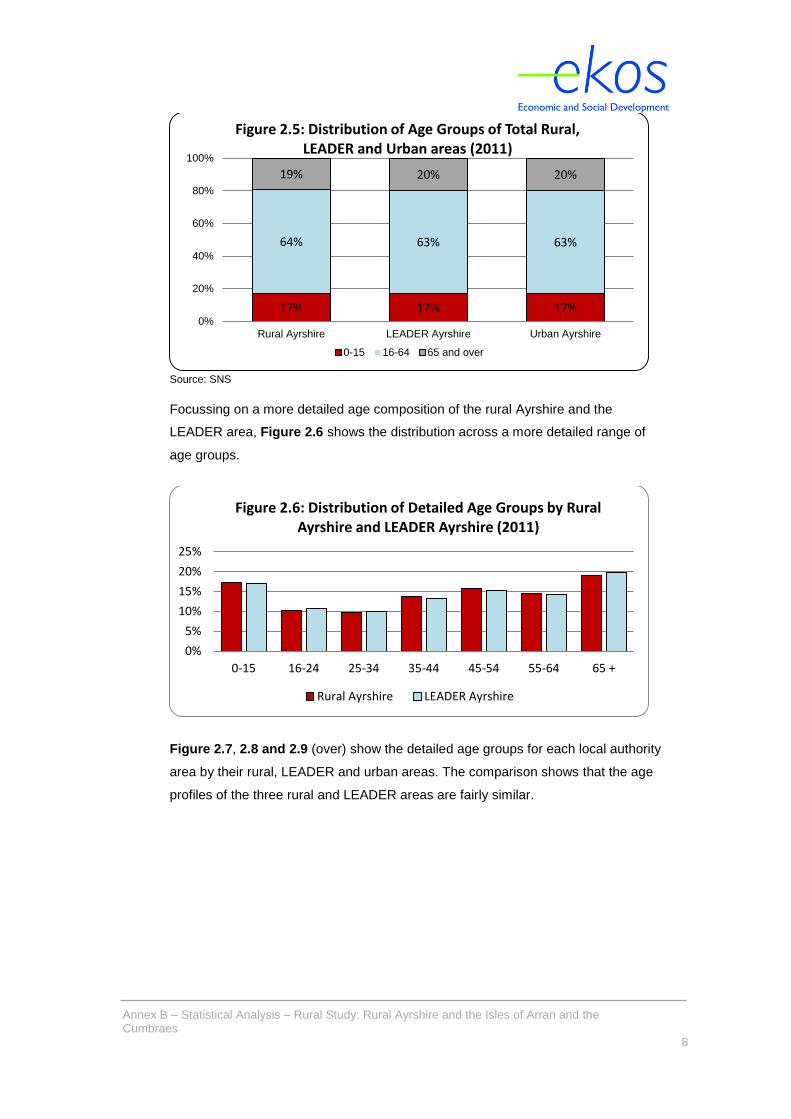
Focussing on a more detailed age composition of the rural Ayrshire and the
LEADER area, Figure 2.6 shows the distribution across a more detailed range of
age groups.
Figure 2.7, 2.8 and 2.9 (over) show the detailed age groups for each local authority
area by their rural, LEADER and urban areas. The comparison shows that the age
profiles of the three rural and LEADER areas are fairly similar.
17% 17% 17%
64% 63% 63%
19% 20% 20%
0%
20%
40%
60%
80%
100%
Rural Ayrshire LEADER Ayrshire Urban Ayrshire
Figure 2.5: Distribution of Age Groups of Total Rural, LEADER and Urban areas (2011)
0-15 16-64 65 and over
0%
5%
10%
15%
20%
25%
0-15 16-24 25-34 35-44 45-54 55-64 65 +
Figure 2.6: Distribution of Detailed Age Groups by Rural Ayrshire and LEADER Ayrshire (2011)
Rural Ayrshire LEADER Ayrshire

Annex B – Statistical Analysis – Rural Study: Rural Ayrshire and the Isles of Arran and the Cumbraes
9
Source: SNS – mid year population estimate (Figure 2.6. to 2.8)
Those aged 65 and over account for the largest percentage of the population across
all three local authorities for rural, LEADER and urban areas. At the same time, the
0%
5%
10%
15%
20%
25%
0-15 16-24 25-34 35-44 45-54 55-64 65 +
Figure 2.7: Distribution of Detailed Age Groups across the Rural Areas of Ayrshire Local Authorities (2011)
Rural North Ayrshire Rural East Ayrshire Rural South Ayrshire
0%
5%
10%
15%
20%
25%
0-15 16-24 25-34 35-44 45-54 55-64 65 +
Figure 2.8: Distribution of Detailed Age Groups across the LEADER Areas of Local Authorities (2011)
LEADER North Ayrshire LEADER East Ayrshire LEADER South Ayrshire
0%
5%
10%
15%
20%
25%
0-15 16-24 25-34 35-44 45-54 55-64 65 +
Figure 2.9: Distribution of Detailed Age Groups across the Urban Areas of Ayrshire Local Authorities (2011)
Urban North Ayrshire Urban East Ayrshire Urban South Ayrshire

Annex B – Statistical Analysis – Rural Study: Rural Ayrshire and the Isles of Arran and the Cumbraes
10
youngest age group 0-15 year olds is the second largest group, whereas the age
groups of young adults (16-24 and 25-34) represent the smallest groups in all rural,
LEADER and urban areas.
The distribution in the respective urban areas is very similar, apart from a slightly
larger percentage of 16-24 year olds residing in urban than in the rural areas as
Figure 2.7 to Figure 2.9 illustrate.
Population Trend
Although the population change of the three local authorities in Ayrshire has been
relatively stable (slight decline of up to -1% in South Ayrshire), the population
throughout the rural and LEADER areas of Ayrshire have experienced growth over
the ten years between 2001 and 2011. The rural areas, and particularly the rural
area of North Ayrshire, have experienced a substantial increase of almost one fifth
(18%) during this time as Table 2.4 and 2.5 indicate.
Table 2.4: Total Population Trend 2001-2011
2001 2011 Change % Change
Rural N Ayrshire 13,658 16,075 2,417 18%
Rural E Ayrshire 32,899 35,435 2,536 8%
Rural S Ayrshire 23,561 24,972 1,411 6%
LEADER N Ayrshire 47,620 50,476 2,856 6%
LEADER E Ayrshire 72,422 73,191 769 1%
LEADER S Ayrshire 34,974 36,297 1,323 4%
N Ayrshire 135,800 135,200 -600 -0.4%
E Ayrshire 120,300 120,200 -100 -0.1%
S Ayrshire 112,200 111,600 -600 -1%
Scotland 5,064,200 5,254,800 190,600 4%
Source: SNS – mid year population estimate
Table 2.5: Total Rural and LEADER Population Trend 2001-2011
2001 2011 Change % Change
Rural Ayrshire 70,118 76,482 6,364 9%
LEADER Ayrshire 155,016 159,964 4,948 3%
Source: SNS – mid year population estimate

Annex B – Statistical Analysis – Rural Study: Rural Ayrshire and the Isles of Arran and the Cumbraes
11
Figure 2.10 and Figure 2.11 details the trends in age groups in rural and LEADER
areas.
Source: SNS – mid year population estimate
Figure 2.10 illustrates that particularly rural North Ayrshire has experienced an
increase across all age groups between 2001 and 2011. This is most noticeable by
the increase of circa 40% for those aged 16-24. Although the 16-24 year olds have
also increased in rural East and South Ayrshire (24% and 15% respectively), their
other young age groups (0-15, 16-24 and 25-34) have declined.
The population trends of the LEADER area are similar to the rural areas as shown in
Figure 2.11. The main difference being that not only East and South Ayrshire but
also LEADER North Ayrshire has experienced a decrease for age groups 0-15 and
25-44, indicating that the remote and accessible towns of North Ayrshire are
decreasing their numbers of young people.
-40%
-20%
0%
20%
40%
60%
0-15 16-24 25-34 35-44 45-54 55-64 65 +
Figure 2.10: Population Trend in Rural Ayrshire between 2001-2011 by Age Groups
Rural North Ayrshire Rural East Ayrshire Rural South Ayrshire

Annex B – Statistical Analysis – Rural Study: Rural Ayrshire and the Isles of Arran and the Cumbraes
12
Source: SNS – mid year population estimate
Figure 2.12 presents the population trend by age group for the total rural area of
Ayrshire and its LEADER area.
Migration
Information regarding migration to and from areas is only available at the local
authority level and above. The three Ayrshire local authorities have been compared
with the national average in Table 2.6 (over).
-40%
-20%
0%
20%
40%
0-15 16-24 25-34 35-44 45-54 55-64 65 +
Figure 2.11: LEADER Population Change by % (2001-2011)
LEADER North Ayrshire LEADER East Ayrshire LEADER South Ayrshire
-30%
-20%
-10%
0%
10%
20%
30%
0-15 16-24 25-34 35-44 45-54 55-64 65 +
Figure 2.12: Population Trend by Age Groups (2001 -2011)
Rural Ayrshire LEADER Ayrshire

Annex B – Statistical Analysis – Rural Study: Rural Ayrshire and the Isles of Arran and the Cumbraes
13
Table 2.6: Migration within Scotland by Local Authority
2006/07 2010/11 Change % Change
In-Migration
North Ayrshire 4,358 3,579 -779 -18%
East Ayrshire 3,708 3,160 -548 -15%
South Ayrshire 3,916 3,484 -432 -11%
Scotland 91,768 87,879 -3,889 -4%
Out-Migration
North Ayrshire 3,993 3,577 -416 -10%
East Ayrshire 3,409 3,264 -145 -4%
South Ayrshire 3,456 3,045 -411 -12%
Scotland 64,957 60,921 -4,036 -6%
Net Migration
North Ayrshire 365 2 -363 -99%
East Ayrshire 299 -104 -403 -135%
South Ayrshire 460 439 -21 -5%
Scotland 26,811 26,958 147 1%
Source: Local Area Migration (2011)
Between the 2006/07 and 2010/2011, all areas in Ayrshire have experienced a
decrease in both in and out migration, i.e. whilst previously between 3,400 and over
4,000 moved in or out of areas, four years later both migration directions have
reduced on average by 400 people indicating reduced mobility. In percentage terms,
this reduction in migration is far stronger than at the Scottish level, for example
whereas in-migration has reduced by 4% in Scotland, in North Ayrshire the
equivalent value is 18%. Only in terms of negative change in out-migration, East
Ayrshire is below the Scottish average.
In terms of net migration, in 2006/07 all three local authorities registered a positive
net-migration between 299 and 460 more people migrating into the area than out.
This changed in 2010/2011, whereby North, and East Ayrshire reported a significant
drop in net migration (-99% and -135%, respectively). In the case of East Ayrshire,
there are now 104 more people moving out of the area than in. Despite a 5%
decline since 2006/07, South Ayrshire still reports a positive net-migration of 439.
Ethnic Groups
For ethnic groups, information is only available at local authority and national level, it
should also be noted that the information is taken from the 2001 census. Table 2.6
details all three Ayrshire local authorities to be predominantly white (99.3% for each);

Annex B – Statistical Analysis – Rural Study: Rural Ayrshire and the Isles of Arran and the Cumbraes
14
this is 1.3 percentage points higher than the national average. There seems to be a
particularly lower percentage of Pakistani and other South Asian ethnic groups living
in Ayrshire (between 0.1% and 0.2 %) than compared to the Scottish average of
0.8%.
Table 2.7: Ethnic Groups by Local Authority/National Level by Five Category
Classification
White Indian
Pakistani and other
South Asian Chinese Other
East Ayrshire 99.3% 0.1% 0.2% 0.2% 0.2%
North Ayrshire 99.3% 0.2% 0.1% 0.2% 0.2%
South Ayrshire 99.3% 0.2% 0.1% 0.2% 0.2%
Scotland 98% 0.3% 0.8% 0.3% 0.6%
Source: SCROL (2001)
3. Housing
This section focuses on the housing make up of the three rural and LEADER areas
within Ayrshire. It should be noted that apart from data for housing costs, information
is drawn from the Census data.
Ownership
Tables 3.1 and 3.2, over, details ownership of households within the rural and
LEADER area in relation to the local authority and national average.

Annex B – Statistical Analysis – Rural Study: Rural Ayrshire and the Isles of Arran and the Cumbraes
15
Table 3.1: Housing Tenure (2001)
Owned
Outright
Owned Mortgage/
Loan
Shared Owner-
ship Council Rented
Private Let
Other Social
Rented from
Employer
Rented from
Relative Other
Rural North Ayrshire 40% 32% 0.3% 11% 8% 4% 2% 2% 1%
Rural East Ayrshire 23% 33% 0.2% 35% 4% 3% 1% 1% 0.4%
Rural South Ayrshire 30% 38% 0.4% 20% 7% 1% 2% 1% 0.5%
LEADER North Ayrshire 33% 36% 0.3% 21% 3% 5% 1% 1% 0.4%
LEADER East Ayrshire 21% 37% 0.2% 35% 3% 3% 0.5% 1% 0.3%
LEADER South Ayrshire 29% 37% 0.3% 23% 2% 6% 1% 1% 0.4%
North Ayrshire 23% 38% 0.3% 28% 6% 4% 0.3% 1% 0.3%
East Ayrshire 20% 39% 0.2% 34% 3% 3% 0.3% 1% 0.3%
South Ayrshire 30% 40% 0.4% 21% 2% 5% 1% 1% 0.3%
Scotland 23% 39% 1% 23% 6% 6% 1% 1% 0.4%
Source: SNS
Table 3.2: Housing Tenure (2001)
Owned
Outright
Owned Mortgage/
Loan
Shared Owner-
ship Council Rented
Private Let
Other Social
Rented from
Employer
Rented from
Relative Other
Rural Ayrshire 28% 35% 0.3% 25% 3% 6% 1% 1% 1%
LEADER Ayrshire 26% 36% 0.2% 28% 3% 4% 1% 1% 0.4%
Source: SNS

Annex B – Statistical Analysis – Rural Study: Rural Ayrshire and the Isles of Arran and the Cumbraes
16
The data shows that the majority of houses within the rural and LEADER areas of
Ayrshire are either owned outright or by a mortgage, Figure 3.1 and 3.2. summarise
the findings.
SNS
SNS
Rural North Ayrshire has the highest percentage with nearly three quarters of
households in the rural location being owned outright or by mortgage/loan (72%)
10% higher than the national level (62%).
50%
55%
60%
65%
70%
75%
80%
Rural NAyrshire
Rural EAyrshire
Rural SAyrshire
LEADERNorth
Ayrshire
LEADEREast
Ayrshire
LEADERSouth
Ayrshire
NorthAyrshire
EastAyrshire
SouthAyrshire
Scotland
Figure 3.1: Combined housing owned outright or mortgaged
North Ayrshire East Ayrshire South Ayrshire Scotland
65%63%
50%
55%
60%
65%
70%
75%
80%
Rural Ayrshire LEADER Ayrshire
Figure 3.2: Combined housing owned outright or mortgage/loan for Total Rural Ayrshire and LEADER area

Annex B – Statistical Analysis – Rural Study: Rural Ayrshire and the Isles of Arran and the Cumbraes
17
Rural and LEADER areas of East Ayrshire are below the local authority and national
levels for housing owned outright or by a mortgage/loan. Over one third of people in
all three areas (rural/LEADER and local authority) live in council rented properties.
Housing Costs
The cost of housing has significantly increased over the ten year period of 2001 to
2011 between 46% (North Ayrshire) and 50% (East Ayrshire) in line with the
increases at the Scottish level (48%). The average house prices, however,
throughout Ayrshire have remained below the national average as Table 3.3
indicates. As in 2001, average house prices in 2011 are highest in South Ayrshire.
Table 3.3: Average House Prices at Local and National Level (2001-2011)
2001 2011 % Change
North Ayrshire £57,268 £123,185 115%
East Ayrshire £61,058 £121,842 100%
South Ayrshire £73,335 £152,166 107%
Total Ayrshire £63,887 £132,398 107%
Scotland £78,220 £163,264 109%
Source: SNS
Analysis has been undertaken to determine the percentage of rural and LEADER
datazones below the average house price for each of the three local authorities in
Ayrshire for 2001 and 2011, Table 3.4.
Table 3.4: Percentage of Datazones below Average Local Authority House
Prices (2001-2011)
Rural LEADER
2001 2011 2001 2011
North Ayrshire 20% 16% 50% 48%
East Ayrshire 57% 71% 73% 75%
South Ayrshire 55% 62% 66% 70%
Total Ayrshire 51% 51% 67% 66%
Source: SNS
Annex B – Statistical Analysis – Rural Study: Rural Ayrshire and the Isles of Arran and the Cumbraes
18
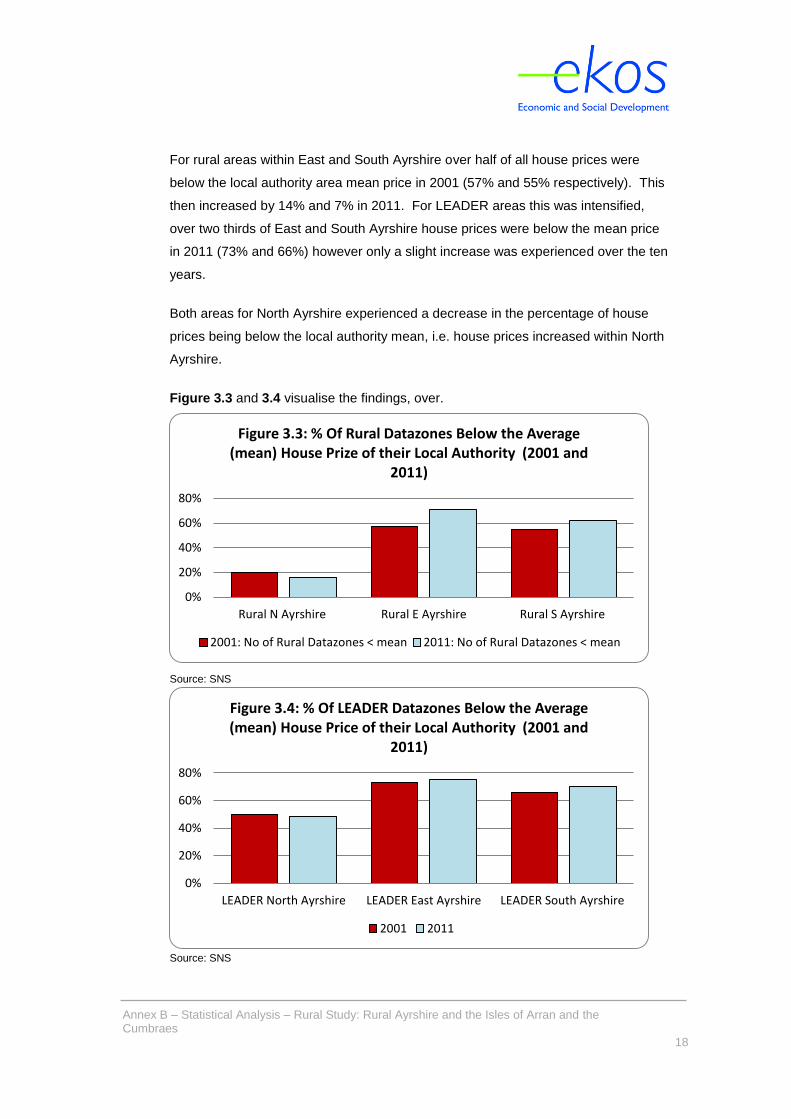
For rural areas within East and South Ayrshire over half of all house prices were
below the local authority area mean price in 2001 (57% and 55% respectively). This
then increased by 14% and 7% in 2011. For LEADER areas this was intensified,
over two thirds of East and South Ayrshire house prices were below the mean price
in 2011 (73% and 66%) however only a slight increase was experienced over the ten
years.
Both areas for North Ayrshire experienced a decrease in the percentage of house
prices being below the local authority mean, i.e. house prices increased within North
Ayrshire.
Figure 3.3 and 3.4 visualise the findings, over.
Source: SNS
Source: SNS
0%
20%
40%
60%
80%
Rural N Ayrshire Rural E Ayrshire Rural S Ayrshire
Figure 3.3: % Of Rural Datazones Below the Average (mean) House Prize of their Local Authority (2001 and
2011)
2001: No of Rural Datazones < mean 2011: No of Rural Datazones < mean
0%
20%
40%
60%
80%
LEADER North Ayrshire LEADER East Ayrshire LEADER South Ayrshire
Figure 3.4: % Of LEADER Datazones Below the Average (mean) House Price of their Local Authority (2001 and
2011)
2001 2011

Annex B – Statistical Analysis – Rural Study: Rural Ayrshire and the Isles of Arran and the Cumbraes
19
Based on the mean house price of each local authority, Figure 3.3 shows that in
2001 in North Ayrshire, four rural datazones (20% of all rural datazones) registered
house prices below the local authority’s average house price. This has slightly
changed in 2011 where only 16%, three rural datazones, had lower than average
house prices. This is in contrast to East and South Ayrshire, where a much higher
percentage of their rural datazones reported below average house prices and where
this situation has increased from 2001 and 2011. In 2011, 31 of 44 rural datazones
in East Ayrshire and 18 of 29 rural datazones in South Ayrshire were below their
local authorities’ mean house prices.
Figure 3.5 shows the percentage of LEADER data zones with below average house
prices in 201 and 2011. The figure shows clearly that the inclusion of small remote
and accessible towns has increased the number of datazones with below average
house prices substantially in the North Ayrshire case (nearly 50% of all datazones in
the LEADER area). For East and South Ayrshire there has been a smaller increase
around 10%.
Source: SNS
0%
20%
40%
60%
80%
Rural Ayrshire LEADER Ayrshire
Figure 3.5: % Of Total Rural and LEADER Datazones Below the Average (mean) House Price of their Local
Authority (2001 and 2011)
2001 2011

Annex B – Statistical Analysis – Rural Study: Rural Ayrshire and the Isles of Arran and the Cumbraes
20
Occupancy Levels
Further analysis of occupancy levels has been undertaken by determining the
percentage of datazones in each location where the percentage of vacant property is
5% or more and where secondary homes represent more than 10% of houses,
Figure 3.6.
Source: SNS
Figure 3.6 shows that in all three local authorities there has been an increase in
vacancy levels between 2007 and 2011. Rural North Ayrshire has the highest level
of datazones with 5% and more vacancy rates in domestic property with an
increasing trend from 8 rural datazones in 2007 to 12 rural datazones in 2011. Due
to the islands, Arran and the Cumbraes, the presence of secondary homes is
particularly high (ranging from 13% to 36%) in eight rural datazones in North
Ayrshire.
02468
1012
2007 2011 2007 2011
Vacant: 5% or more Second/Holiday Homes: 10% or more
Figure 3.6: Number of Rural datazones with 5% vacancy levels or more of property and 10% or more for second
homes
Rural North Ayrshire Rural East Ayrshire Rural South Ayrshire

Annex B – Statistical Analysis – Rural Study: Rural Ayrshire and the Isles of Arran and the Cumbraes
21
Figure 3.7 shows the same analysis as Figure 3.6 above but for LEADER
datazones.
Source: SNS
The data remains relatively similar to that of the rural location with the most
noticeable difference being the increase in the number of datazones within North
Ayrshire for domestic households with vacancy levels of 5% or more in 2011 (23
datazones in comparison to rural North Ayrshire of 12 datazones), and an increase
of 10 over the five year period.
Figure 3.8 shows the increase in vacancy levels in the Total Rural Ayrshire and the
LEADER area between 2007 and 2011.
Source: SNS
0
5
10
15
20
25
2007 2011 2007 2011
Vacant: 5% or more Second/Holiday Homes: 10% or more
Figure 3.7: Number of LEADER datazones with 5% vacancy levels or more of property and 10% or more for
second homes
LEADER North Ayrshire LEADER East Ayrshire LEADER South Ayrshire
0
10
20
30
40
50
2007 2011 2007 2011
Vacant: 5% or more Second/Holiday Homes: 10% or more
Figure 3.8: Number of Total Rural and LEADER datazones with 5% vacancy levels or more of property and 10% or
more for second homes
Rural Ayrshire LEADER Ayrshire

Annex B – Statistical Analysis – Rural Study: Rural Ayrshire and the Isles of Arran and the Cumbraes
22
4. Poverty and Deprivation
This section details the level of poverty and deprivation within each of the local
authorities in Ayrshire. We have based our analysis on the most recent Scottish
Index of Multiple Deprivation (SIMD) data (2012).
Analysis has been undertaken to determine the number of urban and rural
datazones in Ayrshire that are categorised as being within the 15% most deprived
areas. This category represents an aggregate value across all seven SIMD domains
(income, employment, health, education, housing, geographic access and crime).
Source: SIMD (2012)
Figure 4.1 indicates that the urban area of North Ayrshire has the highest number of
datazones within the 15% most deprived areas in Scotland (45 representing 28% of
all urban datazones) however only one of the 20 rural datazones within North
Ayrshire falls ino this category. In East Ayrshire, there are 24 urban datazones
within this category (22% of all urban datazones), and 8 rural datazones
representing 18% of its rural area. Whilst there are 17 urban, there are no rural
datazones within the 15% most deprived SIMD category in South Ayrshire.
Looking at the individual seven SIMD domains of deprivation separately, Figure 4.2
shows that more rural areas in Ayrshire are significantly affected in the one or the
other domain.
1 8 0 9
45 2417
86
0
20
40
60
80
100
North Ayrshire East Ayrshire South Ayrshire Ayrshire
Figure 4.1: Rural and Urban Ayrshire Datazones within the 15% most deprved SIMD in Scotland 2012
rural urban

Annex B – Statistical Analysis – Rural Study: Rural Ayrshire and the Isles of Arran and the Cumbraes
23
Source: Scottish Index of Multiple Deprivation (2012)
Figure 4.2 shows that the most dominant issue of deprivation in rural areas is
geographic access. Most of the rural datazones in South Ayrshire (21 out of 29;
69%) are included in the category of the 15% most deprived datazones in Scotland.
Also in North Ayrshire (13 out of 20; 65%) suffer from access issues. In East
Ayrshire, however, less rural datazones (34%) are affected by poor geographic
access. The illustration further demonstrates that many more datazones in rural
East Ayrshire are affected by significant deprivation issues (six out of seven SIMD
domains) than the rural areas in North and South Ayrshire. For example, in North
Ayrshire it is mainly one datazone which suffers from multiple deprivation, being in
the worst 15% regarding income, employment, health, education, and housing. Apart
from geographic access, rural South Ayrshire is the least deprived area with only
three other domains – health; education; and crime registered as problematic in one
to three datazones.
Analysis was also undertaken to determine the number of LEADER/non LEADER
datazones categorised as being within the 15% most deprived areas; Figure 4.3
details this.
1 2 1 1 1
13
0
6
10 11
7
0
15
5
0 0
3 20
21
1
0
5
10
15
20
25
Income Employment Health Education Housing Geo Access Crime
Figure 4.2: Number of Datazones within the 15% Most Deprived SIMD (2012)
Rural N Ayrshire (20) Rural E Ayrshire (44) Rural S Ayrshire (29)

Annex B – Statistical Analysis – Rural Study: Rural Ayrshire and the Isles of Arran and the Cumbraes
24
Source: Scottish Index of Multiple Deprivation (2012)
The inclusion of accessible and remote small towns has a substantial impact on the
number of datazones within the 15% most deprived SIMD zones in rural/LEADER
areas adding six datazones in North Ayrshire, a further eight in East Ayrshire and
three in South Ayrshire. East Ayrshire has an equal split of datazones within the 15%
most deprived areas within LEADER and non-LEADER defined areas (16 datazones
each). However, apart from East Ayrshire, multiple deprivation is a significantly
worse problem in urban/non LEADER areas in North and South Ayrshire than in their
rural/LEADER areas.
Figures 4.4 and 4.5 depict the breakdown of the seven SIMD domain categories for
each of the LEADER local authority areas, total rural Ayrshire and the LEADER area
providing the number of datazones within each area within the worst 15% most
deprived SIMD.
7 163
26
39 16
14
69
0102030405060708090
100
North Ayrshire East Ayrshire South Ayrshire Ayrshire
Figure 4.3: Number of LEADER and Non Leader Datazones within 15% Most Deprived SIMD (2012)
LEADER Non LEADER
Annex B – Statistical Analysis – Rural Study: Rural Ayrshire and the Isles of Arran and the Cumbraes
25
Source: Scottish Index of Multiple Deprivation (2012)
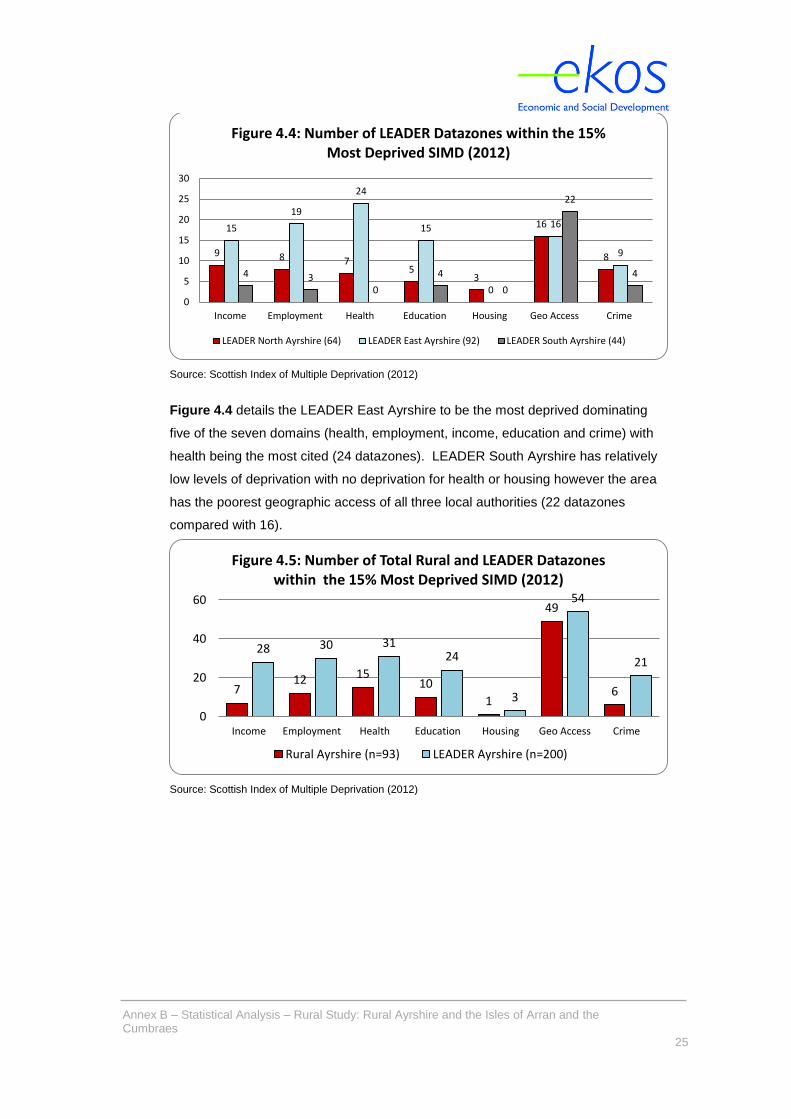
Figure 4.4 details the LEADER East Ayrshire to be the most deprived dominating
five of the seven domains (health, employment, income, education and crime) with
health being the most cited (24 datazones). LEADER South Ayrshire has relatively
low levels of deprivation with no deprivation for health or housing however the area
has the poorest geographic access of all three local authorities (22 datazones
compared with 16).
Source: Scottish Index of Multiple Deprivation (2012)
9 8 75
3
16
8
15
19
24
15
0
16
9
4 30
4
0
22
4
0
5
10
15
20
25
30
Income Employment Health Education Housing Geo Access Crime
Figure 4.4: Number of LEADER Datazones within the 15% Most Deprived SIMD (2012)
LEADER North Ayrshire (64) LEADER East Ayrshire (92) LEADER South Ayrshire (44)
712 15
10
1
49
6
28 30 3124
3
54
21
0
20
40
60
Income Employment Health Education Housing Geo Access Crime
Figure 4.5: Number of Total Rural and LEADER Datazones within the 15% Most Deprived SIMD (2012)
Rural Ayrshire (n=93) LEADER Ayrshire (n=200)
Annex B – Statistical Analysis – Rural Study: Rural Ayrshire and the Isles of Arran and the Cumbraes
26
Fuel Poverty
Recent data regarding fuel poverty is available at local authority level only. Although
in 2004-07 local authority data was split by rural and urban location (six fold rural
classifications), this information has since been discontinued and is only available at
local authority level for 2009-11. Figures 4.6 and 4.7 detail the urban/rural split in
2004/07.
Source: Scottish Household Survey
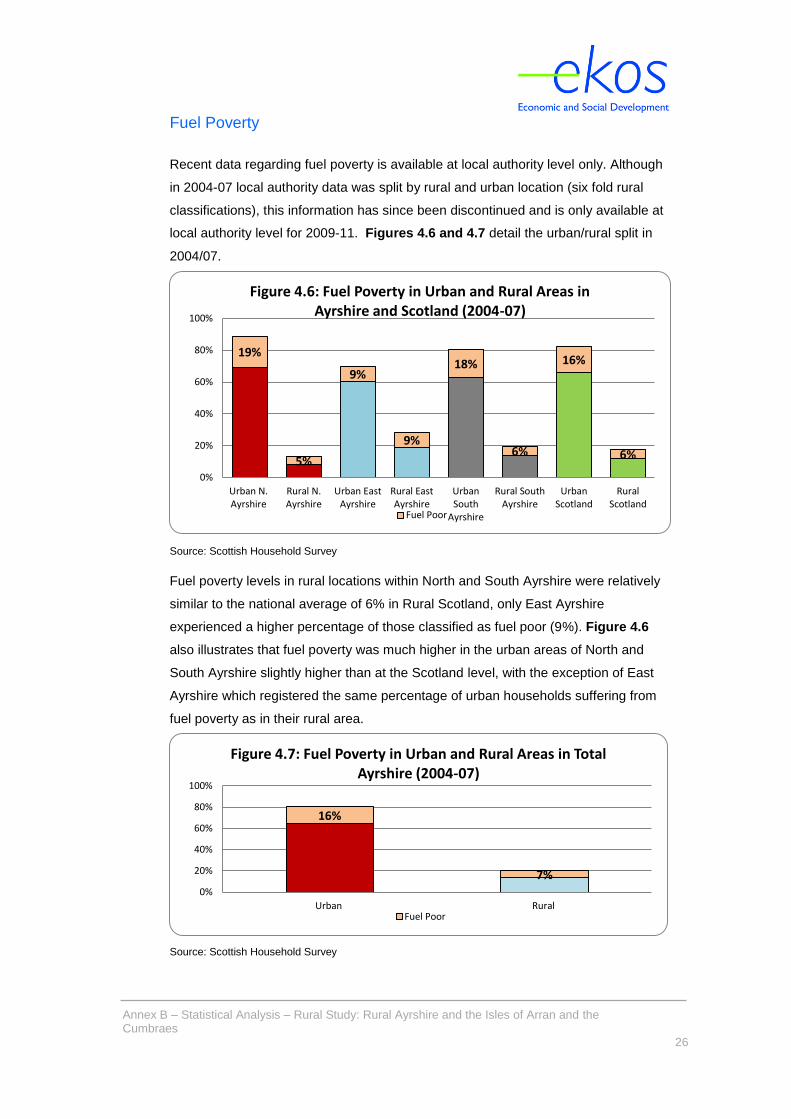
Fuel poverty levels in rural locations within North and South Ayrshire were relatively
similar to the national average of 6% in Rural Scotland, only East Ayrshire
experienced a higher percentage of those classified as fuel poor (9%). Figure 4.6
also illustrates that fuel poverty was much higher in the urban areas of North and
South Ayrshire slightly higher than at the Scotland level, with the exception of East
Ayrshire which registered the same percentage of urban households suffering from
fuel poverty as in their rural area.
Source: Scottish Household Survey
19%
5%
9%
9%
18%
6%
16%
6%
0%
20%
40%
60%
80%
100%
Urban N.Ayrshire
Rural N.Ayrshire
Urban EastAyrshire
Rural EastAyrshire
UrbanSouth
Ayrshire
Rural SouthAyrshire
UrbanScotland
RuralScotland
Figure 4.6: Fuel Poverty in Urban and Rural Areas in Ayrshire and Scotland (2004-07)
Fuel Poor
16%
7%0%
20%
40%
60%
80%
100%
Urban Rural
Figure 4.7: Fuel Poverty in Urban and Rural Areas in Total Ayrshire (2004-07)
Fuel Poor

Annex B – Statistical Analysis – Rural Study: Rural Ayrshire and the Isles of Arran and the Cumbraes
27
Figure 4.8 illustrates the increase in fuel poverty from 2004 to 2010.
Source: Scottish Household Survey
The percentage of households classified as fuel poor has increased year on year
since 2004-2007 for all local authority areas, with the exception of North Ayrshire
which experienced a minor decline in 2005-08. A combination of increasing fuel
prices and the economic crisis are most likely responsible for this increase. This also
indicates that recent energy efficiency programmes and home insulation initiatives
have not yet been able to counteract this increasing negative trend.
5. Access to Services and Transport
This section focuses on the access to services and transport within the
rural/LEADER areas of Ayrshire in comparison to the relevant total local authority
area and national average where appropriate. Further information can be
ascertained from Annex C – Capital Asset Report of the Rural Study report providing
further detail to the major transport links by local authority area including maps.
Drive Time
Analysis of datazones within less than a five mile drive of key services has been
undertaken and detailed in terms of percentage out of the total number of datazones
within each area for rural, LEADER and local authority areas, Table 5.1 and Table
5.2 (over).
0%
5%
10%
15%
20%
25%
30%
35%East Ayrshire
NorthAyrshire
SouthAyrshire
Figure 4.8: Increase in Fuel Poverty by Local Authority from 2004 to 2010
2004-2007
2005-2008
2007-2009
2008-2010

Annex B – Statistical Analysis – Rural Study: Rural Ayrshire and the Isles of Arran and the Cumbraes
28
Table 5.1: Percentage of Datazones within 5 miles of Key Services (2006-09)
GP Post Office Primary School
Secondary School
Shopping Facilities
2006 2009 2006 2009 2006 2009 2006 2009 2006 2009
Rural North Ayrshire (n=20) 55% 80% 70% 80% 85% 100% 20% 35% 15% 55%
Rural East Ayrshire (n=44) 61% 93% 80% 100% 80% 100% 9% 61% 5% 36%
Rural South Ayrshire (n=29) 69% 86% 86% 86% 100% 100% 3% 31% 0% 17%
LEADER North Ayrshire (n=64) 83% 92% 91% 94% 95% 100% 42% 55% 56% 75%
LEADER North Ayrshire (n=92) 80% 97% 90% 100% 90% 100% 30% 71% 32% 60%
LEADER North Ayrshire (n=44) 80% 89% 91% 100% 100% 100% 36% 55% 32% 45%
North Ayrshire (n=179) 94% 97% 97% 98% 98% 100% 65% 82% 67% 91%
East Ayrshire (n=154) 76% 98% 94% 100% 94% 100% 44% 82% 53% 76%
South Ayrshire (n=147) 85% 97% 97% 97% 100% 100% 65% 86% 64% 84%
Source: SNS
The percentage of datazones within five miles of all key services in Table 5.1 has
increased between 2006 and 2009 indicating an improvement, with all datazones
within the areas now having access to a primary school within a reasonable distance
as well as over 70% of all areas having access to a GP and Post Office.
However, access to secondary schools and shopping facilities, although having
increased over the three year period, remains varied. For example, only 17% of rural
South Ayrshire (5 datazones) could access shopping facilities within 5 miles drive,
compared to 55% of rural North Ayrshire.
Table 5.2: Percentage of Datazones within 5 miles of Key Services (2006-09)
GP Post Office Primary School
Secondary School
Shopping Facilities
2006 2009 2006 2009 2006 2009 2006 2009 2006 2009
Rural Ayrshire (n=93)
62% 88% 80% 91% 87% 100% 10% 46% 5% 34%
LEADER Ayrshire (n=200)
81% 94% 91% 98% 94% 100% 36% 62% 40% 62%
Source: SNS

Annex B – Statistical Analysis – Rural Study: Rural Ayrshire and the Isles of Arran and the Cumbraes
29
Travel to Work
It should be highlighted that available data has been taken from the 2001 census
therefore is a number of years out of date as well as only being available at local
authority level or greater.
The most popular method to travel to work for all three local authority areas is by car
(driver or passenger|) accounting for circa two thirds for each area (65%, 69%, and
68% relatively), this was followed by on foot circa 12%, Table 5.3.
Table 5.3: Method - Travel to Work (2001)
North Ayrshire East Ayrshire South Ayrshire
Car - driver 54.6% 57.6% 58.4%
On foot 12.4% 12.7% 12.0%
Car - passenger 10.8% 11.2% 9.2%
Bus, minibus or coach 10.7% 9.8% 8.6%
Works mainly at or from home 6.9% 6.5% 7.1%
Bicycle 1.4% 0.5% 1.6%
Other 0.6% 0.5% 0.6%
Taxi 0.5% 0.4% 0.6%
Train 1.7% 0.3% 1.4%
Motorcycle etc 0.4% 0.3% 0.5%
Source: NOMIS – 2001 Census (Travel to Work Flow)
Rail Travel
A number of sources were used to decipher the rail links including Scotrail and
travellinescotland.com.
Analysis was then undertaken by a “good walking distance” which was determined
as a distance walk of 30 minutes or less i.e. roughly two miles. Table 5.4 detailed
the number of LEADER datazones within a good (up to 2miles), mixed (more than
2miles including geographically large datazones with good and poor access) or poor
(more than 5 miles) distance to rail travel.

Annex B – Statistical Analysis – Rural Study: Rural Ayrshire and the Isles of Arran and the Cumbraes
30
Table 5.4: Percentage of LEADER Datazones within Good/Mixed/Poor Distance
to Rail Travel (2013)
Good (Less than 30
minutes walk)
Mixed (geographically
large
datazones)3
Poor (More than 30
minutes walk)
North Ayrshire 67% 9% 23%
North Ayrshire (excluding islands) 78% 11% 11%
East Ayrshire 38% 10% 52%
South Ayrshire 32% 34% 34%
Ayrshire 46% 15% 39%
Source: Scotrail, www.travellinescotland.com
Overall Ayrshire has varied access to rail links with under half of all datazones being
located within a 30 minute walk or less. Each area is detailed below.
North Ayrshire
Excluding the isles of Arran and the Cumbraes, North Ayrshire has the best rail links,
with the majority (78%) of datazones within a 30 minute walk of train station. This
includes the following services:
Largs is connected to Glasgow by an hourly service stopping at
Glengarnock, Kilwinning, Stevenston, Saltcoats, Ardrossan South Beach,
West Kilbride and Fairlie; and
Ardrossan ferry is linked to Glasgow by an hourly service stopping at
Glengarnock, Dalry, Kilwinning, Stevenston, Saltcoats, Ardrossan South
Beach and Ardrossan Town.
South Ayrshire
One third of the LEADER datazones within South Ayrshire is located within a thirty
minute walk or less (32%), with a further third representing a mixed area (34%) and
3 In the case of geographically large datazones, access to train stations may vary depending on where the station is located, for example in Rural Cumnock distance to the nearest train station varies between 1 and 10 miles from one end of the datazone to the other.
Annex B – Statistical Analysis – Rural Study: Rural Ayrshire and the Isles of Arran and the Cumbraes
31
a further third (34%) with poor access to railway stations. South Ayrshire is serviced
by one train line. The service includes:
Ayr is linked to Glasgow with trains leaving around every 15 minutes, also
linking Prestwick International Airport with Glasgow ; and
Stranraer is linked by a service to Kilmarnock stopping at Barrhill, Girvan,
Maybole, Ayr, Prestwick Town, Prestwick Int. Airport and Troon. There is
also a service to Glasgow stopping at Barrhill, Girvan, Maybole, Ayr and
Kilwinning.
East Ayrshire
East Ayrshire generally has poor rail links to Glasgow with more than half of the
LEADER datazones with poor access to rail services (52%). The exceptions to this
are the areas around Kilmarnock and New Cumnock:
New Cumnock is linked to Glasgow on an infrequent service stopping at
Auchinleck, Kilmarnock, Kilmaurs, Stewarton and Dunlop; and
Kilmarnock is linked with Glasgow by a half hourly service stopping at
Kilmaurs, Stewarton and Dunlop.
Bus Travel
All of Ayrshire is covered by the Mybus scheme which is a bookable bus service for
the disabled and over 80s. Some parts are covered by the ‘Mybus rural scheme’
which is a bookable service for anyone in inaccessible areas.
North Ayrshire with its large number of population centres has the best bus links to
Glasgow. There are few areas in North Ayrshire that do not have bus access to a
train station or a direct bus to Glasgow, and those areas that do not are mainly
single farms. Arran and the Cumbraes have relatively frequent bus links around the
island connected to the ferry services to the mainland.
East Ayrshire has mixed bus links to Glasgow. The areas around Cumnock, New
Cumnock and Auchinleck are well served by the X76 which goes directly to Glasgow
via Catrine and Kilmarnock as well as a number of local bus services linked to the

Annex B – Statistical Analysis – Rural Study: Rural Ayrshire and the Isles of Arran and the Cumbraes
32
train station at New Cumnock. Rural areas around Kilmarnock are well served with
bus links and has the Mybus rural service as far out as Lugton, Waterside and
Darvel. Doon Valley however, has poor bus links to Glasgow with a journey to Ayr
required using the 52 bus service which is a frequent service but taking around an
hour.
In South Ayrshire, Ayr has frequent bus links to Glasgow. Other larger towns also
have bus transport links to Glasgow. However, there are some areas with much less
frequent links, such as rural Carrick.
Much of South Ayrshire has poor bus links to Glasgow due to distance, sparse
population and lack of access to arterial roads. However, most population centres
have bus services to Ayr or other towns with links to Glasgow. The areas around
Coylton and the Coalfields have frequent bus links which take no more than half an
hour. The area around Dundonald, Loans and Symington has good local bus links to
the train station at Prestwick and the A77 where the X77 bus service goes to
Glasgow. Carrick has relatively poor links mainly due to its large area and sparse
population. Population centres in this area often have infrequent services to Ayr or
Girvan, and travelling to Glasgow can take a long time. Much of rural Carrick is
served by the Mybus rural service however.
Ferry Travel
There are three ferry services operating within North Ayrshire:
Largs to Greater Cumbrae;
Ardrossan to Brodick (Isle of Arran); and
Clanoig (Isle of Arran) to Lochranza (Argyll and Bute).
Each of the three services are described below.
Largs to Greater Cumbrae
Greater Cumbrae is connected to Largs by a frequent ferry operated by Caledonian
MacBrayne with the crossing lasting ten minutes. In the winter the earliest ferry
departing Largs is at 6:45am and 7:00am from Greater Cumbrae. Ferries are then
every half hour until 20:15 from Largs and 20:30 from Greater Cumbrae. In the

Annex B – Statistical Analysis – Rural Study: Rural Ayrshire and the Isles of Arran and the Cumbraes
33
spring and autumn there is an additional later ferry on a Friday departing Largs at
22:15 and Greater Cumbrae at 22:30 o’clock.
The service becomes more frequent during the summer with ferries departing every
15 minutes. There is a reduced service on Sunday with the same frequency but first
ferries are from 9:15am from Largs and 9:30am from Greater Cumbrae and last
ferries 20:15 from Largs and 20:30 from Greater Cumbrae. In the summer prices are
£5.40 per person return and £23.20 per car and in the winter they are £3.65 per
person return and £19.10 per car (2013 prices).
Ardrossan to Brodick
This ferry service links the largest settlement on Arran to the mainland and is
operated by Caledonian MacBrayne. In the winter the first ferry from Ardrossan
departs and 7:00am and from Brodick at 8:20am. The service is infrequent with
ferries every two hours and 45 minutes with the last service departing Ardrossan at
18:00 and Brodick at 19:20 o’clock.
In the spring and autumn a later ‘Friday only’ service is introduced departing
Ardrossan at 20:30 and Brodick at 21:40 o’clock. In the summer ferries become
more frequent with the first ferry at 7:00am from both Ardrossan and Brodick and
every one hour and 20 minutes thereafter with the last services leaving at 19:20 from
both ports with the later Friday services continuing. There is a later service
introduced in the summer on a Saturday with the last ferry leaving Ardrossan at
22:00 o’clock. Throughout the year there is a reduced service on Sundays which is
the same as the winter timetable but with first ferry departing Ardrossan at 9:45am
and Brodick at 11:05am. In the summer the first service from Brodick is 9:05am and
the last service from Ardrossan is 20:00 o’clock. In 2013, prices during the summer
are £6.55 per person return and £48.00 per car. In the winter the prices are £4.95
per person return and £31.50 per car.
Claonaig to Lochranza
The Claonaig to Lochranza route is a summertime only service linking the North of
Arran with Argyll and Bute and is also operated by Caledonian MacBrayne. The first
ferry departs Lochranza at 8:15am and Claonaig at 8:50am. The service is then
every one hour and 15 minutes until the last ferry departs Lochranza at 18:25 and
Annex B – Statistical Analysis – Rural Study: Rural Ayrshire and the Isles of Arran and the Cumbraes
34
Claonaig at 19:00 o’clock. On a Sunday the first ferry is not until 9:30am from
Lochranza and 10:05am from Claonaig. 2013 Prices on this service are £5.95 per
person return and £26.25 per car.
6. Employment
This section details employment within Ayrshire.
Working Age Population
The working age population, defined as individuals aged between 16-64 years old, is
detailed in Table 6.1 and Table 6.2. Across all three geographic areas (rural,
LEADER and local authority), Ayrshire has a slightly lower percentage of working
age population than the national level (66%).
Table 6.1: Working Age Population (2011)
Number % of total population
Rural North Ayrshire 10,046 62%
Rural East Ayrshire 22,953 65%
Rural South Ayrshire 15,762 63%
LEADER N Ayrshire 31,074 62%
LEADER E Ayrshire 47,296 65%
LEADER S Ayrshire 22,738 63%
North Ayrshire 85,400 63%
East Ayrshire 77,800 65%
South Ayrshire 69,300 62%
Scotland 344,9100 66%
Source: SNS – mid year population estimate
Table 6.2: Working Age Population (2011)
Number % of total population
Total Rural Ayrshire 48,761 64%
Total LEADER Ayrshire 101,108 63%
Total Ayrshire 232,500 69%
Source: SNS – mid year population estimate

Annex B – Statistical Analysis – Rural Study: Rural Ayrshire and the Isles of Arran and the Cumbraes
35
Economic Activity Rate
The economic activity rate is calculated as the number of people economically active
aged between 16-64 years, i.e. working age population. A person is categorised as
economically active if they are in employment or are actively seeking employment
and claiming Job Seekers Allowance.
Information is unavailable lower than the local authority level for the economic
activity rate.
Table 6.3: Economic Activity Rate 16-64 years old (2007-2011)
2007 2011 % point change
N Ayrshire 73.9% 70.7% -3.2
E Ayrshire 75.4% 74.7% -0.7
South Ayrshire 78.1% 74.2% -3.9
Scotland 77.5% 77% -0.5
Source: Nomis – Annual Population Survey
The economic activity rate (Table 6.3) for each of the three local authority areas has
decreased between 2007 and 2011, most noticeably South Ayrshire has
experienced a decrease of nearly four percentage points , falling from 78.1% to
74.2% resulting in all local authorities being below the national economic activity rate
of 77% of the working age population.
Employment Rate
The employment rate measures the number of people in employment as a rate of
the working age population. Data is available at local authority level and above
detailed in Table 6.4.
Table 6.4: Employment Rate 16 to 64 year old (2007-2011) %
2007 2011 % point change
N Ayrshire 69.2% 61.0% -8.2
E Ayrshire 70.2% 66.7% -3.5
South Ayrshire 74.3% 65.9% -8.4
Scotland 73.8% 70.7% -3.1
Source: Nomis - Annual Population Survey
Annex B – Statistical Analysis – Rural Study: Rural Ayrshire and the Isles of Arran and the Cumbraes
36
As with the economic activity rate, the employment rate has fallen for the local
authority areas as well as Scotland. North and South Ayrshire noticed a decrease of
over eight percentage points.
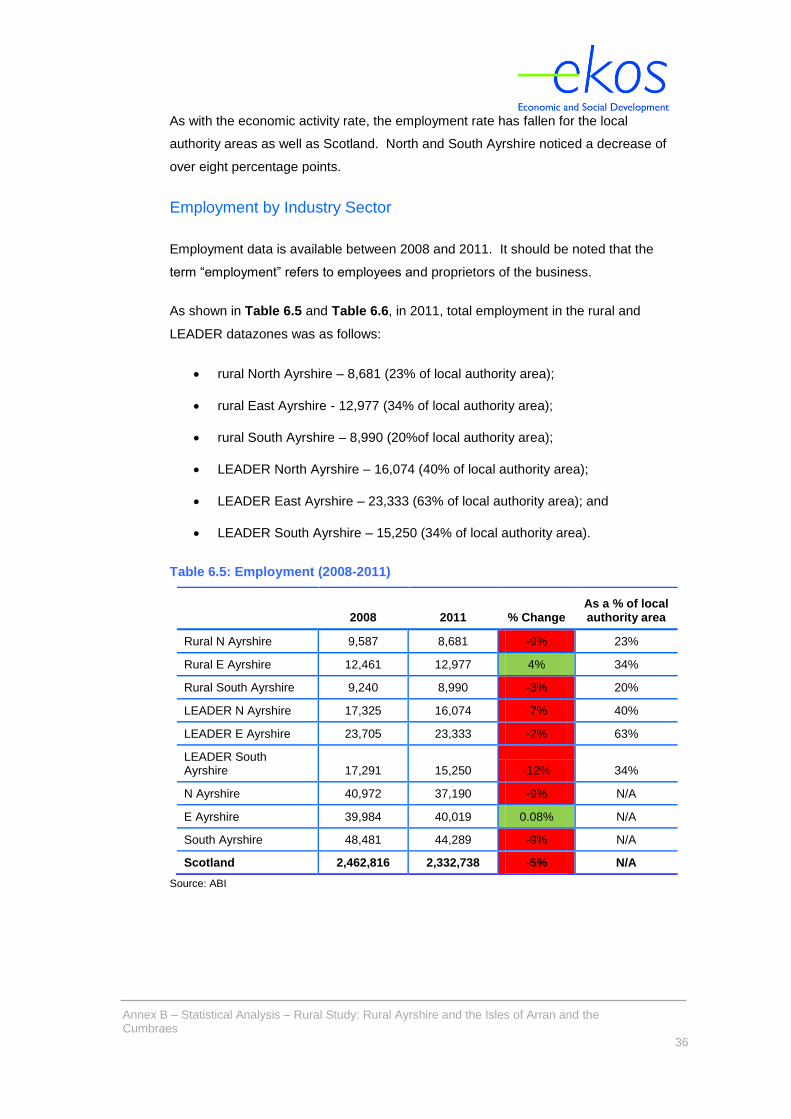
Employment by Industry Sector
Employment data is available between 2008 and 2011. It should be noted that the
term “employment” refers to employees and proprietors of the business.
As shown in Table 6.5 and Table 6.6, in 2011, total employment in the rural and
LEADER datazones was as follows:
rural North Ayrshire – 8,681 (23% of local authority area);
rural East Ayrshire - 12,977 (34% of local authority area);
rural South Ayrshire – 8,990 (20%of local authority area);
LEADER North Ayrshire – 16,074 (40% of local authority area);
LEADER East Ayrshire – 23,333 (63% of local authority area); and
LEADER South Ayrshire – 15,250 (34% of local authority area).
Table 6.5: Employment (2008-2011)
2008 2011 % Change As a % of local authority area
Rural N Ayrshire 9,587 8,681 -9% 23%
Rural E Ayrshire 12,461 12,977 4% 34%
Rural South Ayrshire 9,240 8,990 -3% 20%
LEADER N Ayrshire 17,325 16,074 -7% 40%
LEADER E Ayrshire 23,705 23,333 -2% 63%
LEADER South Ayrshire 17,291 15,250 -12% 34%
N Ayrshire 40,972 37,190 -9% N/A
E Ayrshire 39,984 40,019 0.08% N/A
South Ayrshire 48,481 44,289 -9% N/A
Scotland 2,462,816 2,332,738 -5% N/A
Source: ABI
Annex B – Statistical Analysis – Rural Study: Rural Ayrshire and the Isles of Arran and the Cumbraes
37
Table 6.6: Employment (2008-2011)
2008 2011 % Change As a % of local authority area
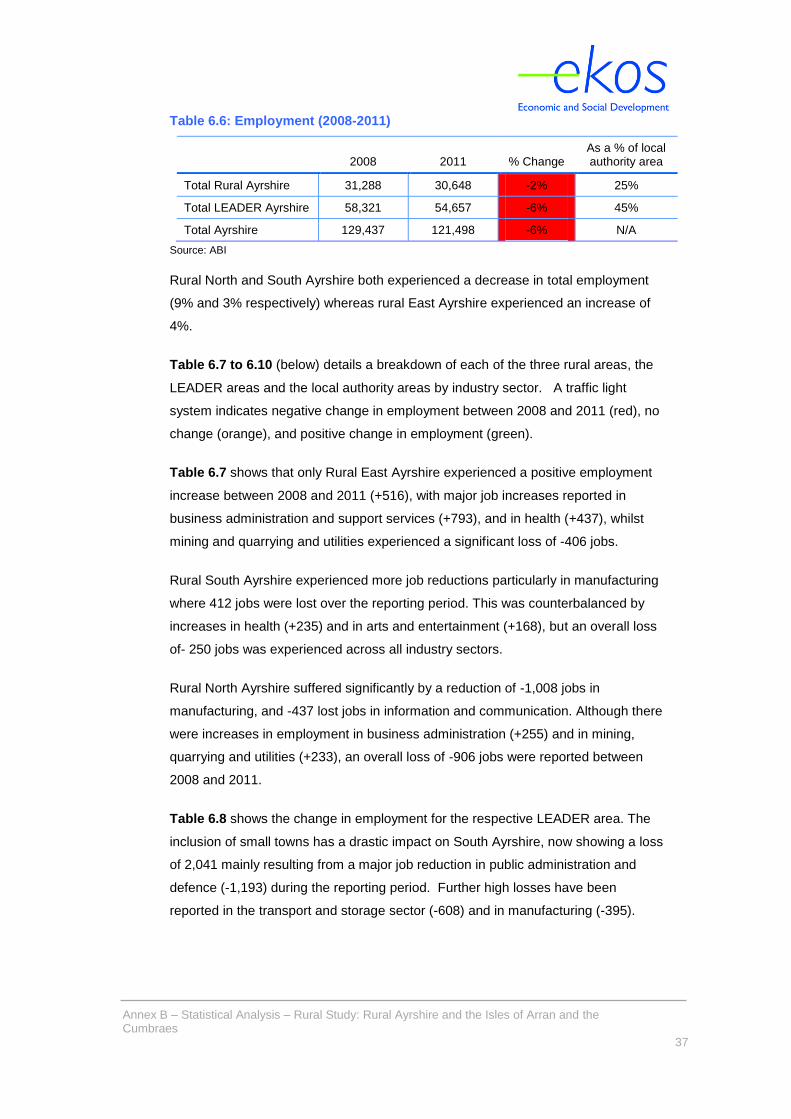
Total Rural Ayrshire 31,288 30,648 -2% 25%
Total LEADER Ayrshire 58,321 54,657 -6% 45%
Total Ayrshire 129,437 121,498 -6% N/A
Source: ABI
Rural North and South Ayrshire both experienced a decrease in total employment
(9% and 3% respectively) whereas rural East Ayrshire experienced an increase of
4%.
Table 6.7 to 6.10 (below) details a breakdown of each of the three rural areas, the
LEADER areas and the local authority areas by industry sector. A traffic light
system indicates negative change in employment between 2008 and 2011 (red), no
change (orange), and positive change in employment (green).
Table 6.7 shows that only Rural East Ayrshire experienced a positive employment
increase between 2008 and 2011 (+516), with major job increases reported in
business administration and support services (+793), and in health (+437), whilst
mining and quarrying and utilities experienced a significant loss of -406 jobs.
Rural South Ayrshire experienced more job reductions particularly in manufacturing
where 412 jobs were lost over the reporting period. This was counterbalanced by
increases in health (+235) and in arts and entertainment (+168), but an overall loss
of- 250 jobs was experienced across all industry sectors.
Rural North Ayrshire suffered significantly by a reduction of -1,008 jobs in
manufacturing, and -437 lost jobs in information and communication. Although there
were increases in employment in business administration (+255) and in mining,
quarrying and utilities (+233), an overall loss of -906 jobs were reported between
2008 and 2011.
Table 6.8 shows the change in employment for the respective LEADER area. The
inclusion of small towns has a drastic impact on South Ayrshire, now showing a loss
of 2,041 mainly resulting from a major job reduction in public administration and
defence (-1,193) during the reporting period. Further high losses have been
reported in the transport and storage sector (-608) and in manufacturing (-395).

Annex B – Statistical Analysis – Rural Study: Rural Ayrshire and the Isles of Arran and the Cumbraes
38
The positive employment gain experienced in the rural area, has also been reduced
to a negative figure through the inclusion of small towns in the East Ayrshire
LEADER area, now showing a -375 employment record between 2008-2011. Whilst
business administration and health are still growing sectors, further decreases in
mining, quarrying and utilities, (-605), manufacturing (-459), construction (-387) and
accommodation and food services (-260) are now reported.
In the LEADER North Ayrshire area, the inclusion of small towns has led to a further
loss of 345 jobs in the area primarily due to job losses in manufacturing and
education. Across the North Ayrshire LEADER area employment has reduced by -
1,251.
Although small in actual numbers, the decrease of employment in the agricultural,
forestry and fishing sector should be noted. Particularly for North Ayrshire, this
sector has reduced by almost 50% (from 45 employess in 2008 to 26 in 2011), and
by a third in the East Ayrshire LEADER area. The negative trend was less stark in
South Ayrshire.
Table 6.9 shows employment by industry sector in 2011 and its percentage change
since 2008 for Total Rural Ayrshire and its LEADER area. The table demonstrates
that the only industry sectors experiencing positive change in both areas are
Business Administration and Support Services, Professional, Scientific and
Technical, Health, Property and Arts and recreational sector. Further small increases
are also experienced in the Total Rural Area of Ayrshire in Retail and Transport &
Storage.
Table 6.10 shows employment by industry sector in 2011 and its percentage change
since 2008 across the three local authority areas and at the Scottish Level. The
industry sectors with most negative employment developments include the Finance
and Insurance sectors which reduced by 19% at the Scottish level, but had a much
more profound impact in the three local authority areas reducing by 32%, 40% and
35% for North, East and South Ayrshire respectively. In addition, the three local
authorities suffered proportionately more by reductions in the manufacturing sector
where there was an 11% drop at Scottish level, but a 25%, 17% and 12% reduction
in North, East and South Ayrshire respectively.

Annex B – Statistical Analysis – Rural Study: Rural Ayrshire and the Isles of Arran and the Cumbraes
39
Table 6.7: Employment by Rural Datazone (2008-11)
Rural North Ayrshire Rural East Ayrshire Rural South Ayrshire
2008 2011 Change 2008 2011 Change 2008 2011 Change
Agriculture, forestry & fishing 31 16 -15 99 39 -60 169 140 -29
Mining, quarrying & utilities 698 931 233 1,287 881 -406 194 125 -69
Manufacturing 2,876 1,868 -1,008 512 377 -135 2,845 2,433 -412
Construction 599 676 77 895 674 -221 557 455 -102
Motor trades 112 124 12 126 127 1 67 37 -30
Wholesale 535 378 -157 394 472 78 392 392 0
Retail 853 863 10 387 385 -2 475 554 79
Transport & storage 362 459 97 531 572 41 325 248 -77
Accommodation & food services 911 890 -21 406 316 -90 1,343 1,377 34
Information & communication 512 73 -439 42 43 1 80 117 37
Financial & insurance 38 27 -11 54 14 -40 24 32 8
Property 24 35 11 58 71 13 65 55 -10
Professional, scientific & technical 161 269 108 188 212 24 279 349 70
Business administration & support services 221 476 255 809 1,602 793 489 436 -53
Public administration & defence 391 333 -58 503 496 -7 57 50 -7
Education 382 245 -137 575 594 19 505 413 -92
Health 308 476 168 5,255 5,692 437 1,134 1,369 235
Arts, entertainment, recreation & other services 573 542 -31 340 410 70 240 408 168
Total 9,587 8,681 -906 12,461 12,977 516 9,240 8,990 -250
Source: Nomis – BRES 2008-2011

Annex B – Statistical Analysis – Rural Study: Rural Ayrshire and the Isles of Arran and the Cumbraes
40
Table 6.8: Employment by LEADER Datazone (2008-11)4
LEADER North Ayrshire LEADER East Ayrshire Leader South Ayrshire
2008 2011 Change 2008 2011 Change 2008 2011 Change
Agriculture, forestry & fishing 45 26 -19 134 91 -43 203 187 -16
Mining, quarrying & utilities 762 997 235 1,453 848 -605 197 129 -68
Manufacturing 3,773 2,559 -1,214 2,083 1,624 -459 3,030 2,635 -395
Construction 1,298 1,253 -45 1,583 1,196 -387 868 756 -112
Motor trades 205 217 12 444 347 -97 334 298 -36
Wholesale 712 540 -172 538 599 61 422 430 8
Retail 1,987 1,899 -88 1,600 1,484 -116 810 876 66
Transport & storage 687 786 99 873 990 117 1,041 433 -608
Accommodation & food services 1,713 1,898 185 1,019 759 -260 1,604 1,608 4
Information & communication 556 114 -442 89 93 4 92 129 37
Financial & insurance 122 100 -22 220 126 -94 63 58 -5
Property 53 81 28 138 143 5 146 145 -1
Professional, scientific & technical 429 682 253 497 445 -52 370 431 61
Business administration & support services 735 738 3 1,421 2,322 901 563 530 -33
Public administration & defence 645 614 -31 910 805 -105 1,326 133 -1,193
Education 1,157 931 -226 1,263 1,282 19 990 868 -122
Health 1,383 1,678 295 6,734 7,360 626 4,774 5,091 317
Arts, entertainment, recreation & other services 1,063 961 -102 698 808 110 458 513 55
Total 17,325 16,074 -1,251 21,697 21,322 -375 17,291 15,250 -2,041
4 Agriculture, forestry and fishing data is marginally larger than equivalent Local Authority data, this is owing to the slight overlap of LEADER

Annex B – Statistical Analysis – Rural Study: Rural Ayrshire and the Isles of Arran and the Cumbraes
41
Table 6.9: Employment by Total Rural and Total LEADER (2008-11)5
Total Rural Total LEADER
2008 2011 Change Change % 2008 2011 Change Change %
Agriculture, forestry & fishing 299 1,953 -104 -35% 382 304 -78 -20%
Mining, quarrying & utilities 2,179 1,937 -242 -11% 2,412 1,974 -438 -18%
Manufacturing 6,233 4,678 -1,555 -25% 8,886 6,818 -2,068 -23%
Construction 2,051 1,805 -246 -12% 3,749 3,205 -544 -15%
Motor trades 3,05 288 -17 -6% 983 862 -121 -12%
Wholesale 1,321 1242 -79 -6% 1,672 1,569 -103 -6%
Retail 1,715 1,802 87 5% 4,397 4,259 -138 -3%
Transport & storage 1,218 1,279 61 5% 2,601 2,209 -392 -15%
Accommodation & food services 2,660 2,583 -77 -3% 4,336 4,265 -71 -2%
Information & communication 634 233 -401 -63% 737 336 -401 -54%
Financial & insurance 116 73 -43 -37% 405 284 -121 -30%
Property 147 161 14 10% 337 369 32 9%
Professional, scientific & technical 628 830 202 32% 1,296 1,558 262 20%
Business administration & support services 1,519 2,514 995 66% 2,719 3,590 871 32%
Public administration & defence 951 879 -72 -8% 2,881 1,552 -1,329 -46%
Education 1,462 1,252 -210 -14% 3,410 3,081 -329 -10%
Health 6,697 7,537 840 13% 12,891 14,129 1,238 10%
Arts, entertainment, recreation & other services 1,153 1,360 207 18% 2,219 2,282 63 3%
Total 31,288 30,648 -640 -2% 56,313 52,646 -3,667 -7%

Annex B – Statistical Analysis – Rural Study: Rural Ayrshire and the Isles of Arran and the Cumbraes
42
Table 6.10: Employment by Local Authority (2008-11)
North Ayrshire East Ayrshire South Ayrshire Scotland
2011 Change %
Change 2011 Change %
Change 2011 Change %
Change 2011 Change %
Change
Agriculture, forestry & fishing 21 -63 -75% 83 -56 -40% 218 -52 -19% 34,685 -1,635 -5%
Mining, quarrying & utilities 1,334 171 15% 1,292 -581 -31% 232 -44 -16% 64,055 5,848 10%
Manufacturing 4,085 -1,388 -25% 3,123 -642 -17% 4,631 -655 -12% 179,577 -21,535 -11%
Construction 2,348 -187 -7% 2,111 -501 -19% 1,798 -222 -11% 128,751 -26,098 -17%
Motor trades 540 60 13% 728 -149 -17% 951 -127 -12% 37,637 -273 -1%
Wholesale 1,129 -293 -21% 1,089 46 4% 1,114 -110 -9% 67,678 -1,0361 -13%
Retail 5,139 -282 -5% 4,024 -416 -9% 6,125 -432 -7% 238,131 -12,375 -5%
Transport & storage 1,401 -77 -5% 1,551 59 4% 2,390 -778 -25% 97,838 -3,886 -4%
Accommodation & food services 3,442 -373 -10% 1,643 -306 -16% 5,044 205 4% 165,905 -12,845 -7%
Information & communication 355 -498 -58% 224 -92 -29% 420 58 16% 56,716 -3,215 -5%
Financial & insurance 385 -182 -32% 491 -329 -40% 597 -321 -35% 84,183 -19,719 -19%
Property 290 -128 -31% 243 -72 -23% 497 -142 -22% 30,383 2,677 10%
Professional, scientific & technical 1,439 599 71% 1,124 -40 -3% 1,592 181 13% 144,913 4,316 3%
Business administration & support services 1,882 74 4% 4,485 840 23% 1,052 -326 -24% 178,825 -1,414 -1%
Public administration & defence 1,981 -178 -8% 3,085 937 44% 1,914 -1,965 -51% 148,317 -1,179 -1%
Education 3,145 -815 -21% 2,814 -181 -6% 3,490 -164 -4% 190,567 -20,302 -10%
Health 6,100 120 2% 10,024 1,445 17% 9,530 667 8% 380,595 1,814 0.5%
Arts, entertainment, recreation & other services 2,175 -342 -14% 1,884 72 4% 2,696 38 1% 103,983 -9,894 -9%
Total 37,190 -3,782 -9% 40,019 35 0.1% 44,289 -4192 -9% 2,332,738 -130,078 -5%
Source: Nomis – BRES 2008-2011

Annex B – Statistical Analysis – Rural Study: Rural Ayrshire and the Isles of Arran and the Cumbraes
43
7. Skills, Qualifications and Quality of
Employment
The section analyses the skills and qualification of the Ayrshire population. Figure
7.1 details the percentage of those of working age that have a NVQ qualification.
Source: Annual Population Survey
South Ayrshire performs the best in terms of percentage throughout all four
categories across the three local authority area with the exception of ‘other
qualifications’. It should be noted that all three local authority areas qualification
attainments is lower than the national average. Table 7.1 details the change in
qualification attainments from 2007 to 2011.
0
10
20
30
40
50
60
70
80
90
% with NVQ4+ % with NVQ3+ % with NVQ2+ % with NVQ1+ % with otherqualifications
Figure 7.1: % of working age population with NVQ Qualifications
N Ayrshire E Ayrshire S Ayrshire Scotland

Annex B – Statistical Analysis – Rural Study: Rural Ayrshire and the Isles of Arran and the Cumbraes
44
Table 7.1: NVQ Attainment (2007-2011)
North Ayrshire East Ayrshire South Ayrshire Scotland
2011 % Point Change 2011
% Point Change 2011
% Point Change 2011
% Point Change
% with NVQ4+ - aged 16-64 27.3 -2.3 26.0 0.9 34.5 1.6 37.2 4.1
% with NVQ3+ - aged 16-64 50.6 -1.6 45.8 -1.9 53.5 -2.7 57.6 3.1
% with NVQ2+ - aged 16-64 67.7 1.0 64.9 3.0 71.8 2.1 72.4 3.8
% with NVQ1+ - aged 16-64 78.1 -1.2 75.3 3.5 81.7 0.8 82.3 3.4
% with other qualifications - aged 16-64 7.9 1.4 7.6 0.7 7.1 0.1 6.2 -1.2
% with no qualifications - aged 16-64 14.0 -0.2 17.1 -4.2 11.2 -0.9 11.6 -2.1
Source: Source: Annual Population Survey

Annex B – Statistical Analysis – Rural Study: Rural Ayrshire and the Isles of Arran and the Cumbraes
45
Quality of Employment
Table 7.2 details the quality of profession by each local authority. For both North
and East Ayrshire the most common profession level is skilled trade (15.6% and
15.4% respectively). In South Ayrshire, the largest professional group with circa 18%
of its working age population is within a professional occupation, similar to that of
Scotland.
Table 7.2: Quality of Profession (%) (2011)
North
Ayrshire East
Ayrshire South
Ayrshire Scotland
Professional 12.3 12.1 18.4 18.3
Associate prof & tech 13.4 9.9 13.8 13.6
Elementary 11.1 12.9 10.9 11.8
Skilled trades 15.6 15.4 13.8 11.5
Administrative & secretarial 10.8 11.6 8.8 10.8
Caring, leisure & other service 10.3 12.3 11.0 9.6
Sales & customer service 9.8 8.1 8.3 9.3
Managers, directors & senior officials 8.8 7.0 7.6 8.4
Process, plant & machine operatives 7.5 10.5 6.6 6.6
Source: Annual Population Survey 2007-2011
Table 7.3 details the change in the quality of profession from 2007 to 2011. The
most significant change is a decrease of 2.5 percentage points for those within the
professional occupation in East Ayrshire.

Annex B – Statistical Analysis – Rural Study: Rural Ayrshire and the Isles of Arran and the Cumbraes
46
Table 7.3: Change in Quality of Profession (2007-2011)
North Ayrshire East Ayrshire South Ayrshire Scotland
2011 % Point Change 2011
% Point Change 2011
% Point Change 2011
% Point Change
Professional 12.3 -1.4 12.1 -2.5 18.4 2.4 18.3 0.3
Associate prof & tech 13.4 1.5 9.9 -0.5 13.8 2.4 13.6 1
Elementary 11.1 0 12.9 0.8 10.9 -1.7 11.8 0.3
Skilled trades 15.6 2 15.4 0.9 13.8 0 11.5 -0.5
Administrative and secretarial 10.8 -0.8 11.6 1.7 8.8 -2 10.8 -0.9
Caring, leisure and other service 10.3 0.1 12.3 -0.6 11.0 1.1 9.6 0.3
Sales and customer service 9.8 -0.9 8.1 0.3 8.3 -1.1 9.3 0.4
Managers, directors and senior officials 8.8 1.1 7.0 -0.1 7.6 -1.7 8.4 -0.2
Process, plant and machine operatives 7.5 -1.7 10.5 -0.2 6.6 0.2 6.6 -0.5
Source: Annual Population Survey 2007-2011
Annex B – Statistical Analysis – Rural Study: Rural Ayrshire and the Isles of Arran and the Cumbraes
47
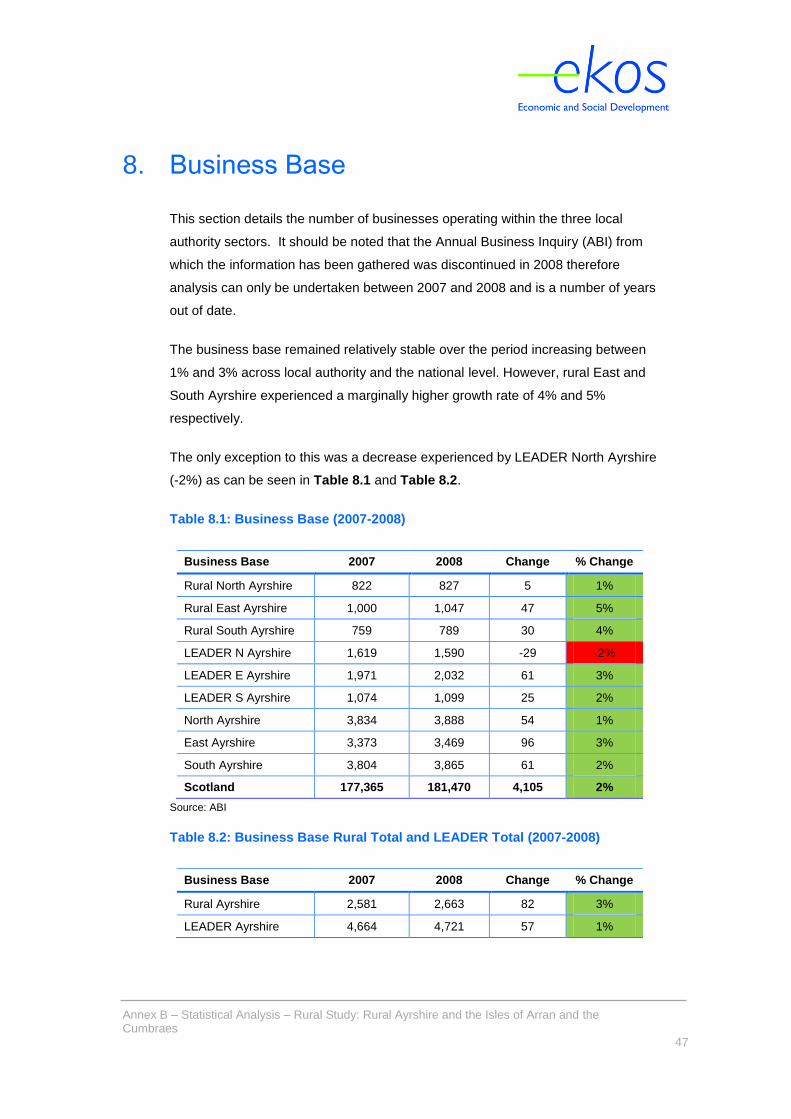
8. Business Base
This section details the number of businesses operating within the three local
authority sectors. It should be noted that the Annual Business Inquiry (ABI) from
which the information has been gathered was discontinued in 2008 therefore
analysis can only be undertaken between 2007 and 2008 and is a number of years
out of date.
The business base remained relatively stable over the period increasing between
1% and 3% across local authority and the national level. However, rural East and
South Ayrshire experienced a marginally higher growth rate of 4% and 5%
respectively.
The only exception to this was a decrease experienced by LEADER North Ayrshire
(-2%) as can be seen in Table 8.1 and Table 8.2.
Table 8.1: Business Base (2007-2008)
Business Base 2007 2008 Change % Change
Rural North Ayrshire 822 827 5 1%
Rural East Ayrshire 1,000 1,047 47 5%
Rural South Ayrshire 759 789 30 4%
LEADER N Ayrshire 1,619 1,590 -29 -2%
LEADER E Ayrshire 1,971 2,032 61 3%
LEADER S Ayrshire 1,074 1,099 25 2%
North Ayrshire 3,834 3,888 54 1%
East Ayrshire 3,373 3,469 96 3%
South Ayrshire 3,804 3,865 61 2%
Scotland 177,365 181,470 4,105 2%
Source: ABI
Table 8.2: Business Base Rural Total and LEADER Total (2007-2008)
Business Base 2007 2008 Change % Change
Rural Ayrshire 2,581 2,663 82 3%
LEADER Ayrshire 4,664 4,721 57 1%

Annex B – Statistical Analysis – Rural Study: Rural Ayrshire and the Isles of Arran and the Cumbraes
48
Almost all businesses operating within the rural and LEADER areas were SME’s
employing between 1-49 employees, with the vast majority being very small
enterprises employing between 1 to 10 employees. Figure 8.1 and Figure 8.2,
detail at various geographic levels.
Source: ABI
Source: ABI
86% 85% 85% 87% 85% 83%
11% 11% 11% 11% 12% 12%
0%
20%
40%
60%
80%
100%
Rural NorthAyrshire
Rural EastAyrshire
Rural SouthAyrshire
LEADERNorth
Ayrshire
LEADER EastAyrshire
LEADERSouth
Ayrshire
Figure 8.1: Business Base by Employee Size (2008)
1 to 10 11 to 49 50 to 199 200 or more
85% 85%
11% 12%
0%
20%
40%
60%
80%
100%
Rural Ayrshire LEADER Ayrshire
Figure 8.2: Business Base by Employee Size for Total Rural and LEADER areas (2008)
1 to 10 11 to 49 50 to 199 200 or more

Annex B – Statistical Analysis – Rural Study: Rural Ayrshire and the Isles of Arran and the Cumbraes
49
As the following tables show, all areas experienced an increase in business base
over the period 2007-2008 with the exception of LEADER North Ayrshire which
experienced a decrease of -2%.
Rural East Ayrshire experienced the largest increase in its business base of 5%
accounting for 47 businesses of which 43 employed between 1 and 10 employees,
detailed further in Table 8.3, 8.4, and 8.5 (over).

Annex B – Statistical Analysis – Rural Study: Rural Ayrshire and the Isles of Arran and the Cumbraes
50
Table 8.3 Business Base by Employee Numbers – Rural Locations (2007-2008)
Rural North Ayrshire Rural East Ayrshire Rural South Ayrshire
2007 2008 Change 2007 2008 Change 2007 2008 Change
1-10 694 710 16 850 893 43 641 669 28
11- 49 101 93 -8 117 120 3 84 84 -
50-199 18 17 -1 29 30 1 26 27 1
200 or more 9 7 - 2 4 4 - 8 9 1
Total 822 827 5 1,000 1,047 47 759 789 30
Source: ABI
Table 8.4: Business Base by Employee Numbers - LEADER Locations (2007-2008)
LEADER North Ayrshire LEADER East Ayrshire LEADER South Ayrshire
2007 2008 Change 2007 2008 Change 2007 2008 Change
1 to 10 1,363 1,380 17 1,667 1,723 56 894 915 21
11 to 49 208 180 -28 241 243 2 128 133 5
50 to 199 38 25 -13 57 60 3 40 38 -2
200 or more 10 5 -5 6 6 - 12 13 1
Total 1,619 1,590 -29 1,971 2,032 61 1074 1099 25
Source: ABI

Annex B – Statistical Analysis – Rural Study: Rural Ayrshire and the Isles of Arran and the Cumbraes
51
Table 8.5: Business Base by Employee Numbers –Total Rural and LEADER Locations (2007-2008)
Rural Ayrshire LEADER Ayrshire
2007 2008 Change 2007 2008 Change
1 to 10 2,185 2,272 87 3,924 4,018 94
11 to 49 302 297 -5 577 556 -21
50 to 199 73 74 1 135 123 -12
200 or more 21 20 -1 28 24 -4
Total 2,581 2,663 82 4,664 4,721 57
Source: ABI
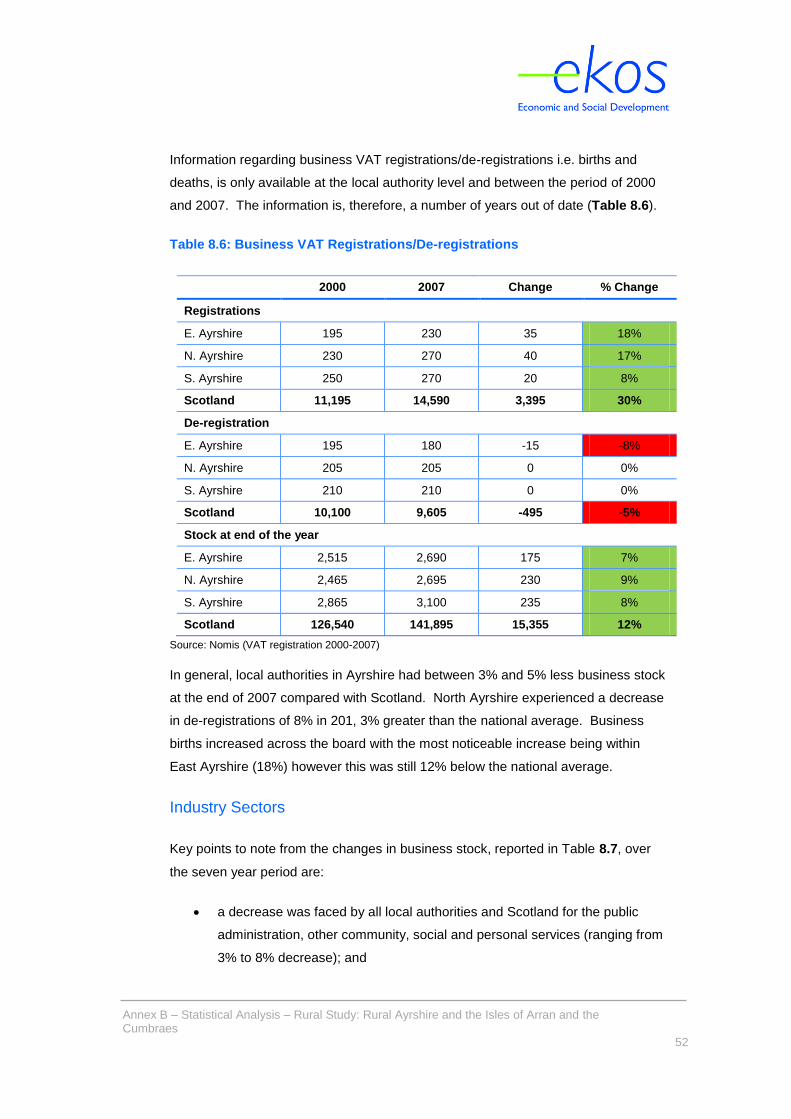
Annex B – Statistical Analysis – Rural Study: Rural Ayrshire and the Isles of Arran and the Cumbraes
52
Information regarding business VAT registrations/de-registrations i.e. births and
deaths, is only available at the local authority level and between the period of 2000
and 2007. The information is, therefore, a number of years out of date (Table 8.6).
Table 8.6: Business VAT Registrations/De-registrations
2000 2007 Change % Change
Registrations
E. Ayrshire 195 230 35 18%
N. Ayrshire 230 270 40 17%
S. Ayrshire 250 270 20 8%
Scotland 11,195 14,590 3,395 30%
De-registration
E. Ayrshire 195 180 -15 -8%
N. Ayrshire 205 205 0 0%
S. Ayrshire 210 210 0 0%
Scotland 10,100 9,605 -495 -5%
Stock at end of the year
E. Ayrshire 2,515 2,690 175 7%
N. Ayrshire 2,465 2,695 230 9%
S. Ayrshire 2,865 3,100 235 8%
Scotland 126,540 141,895 15,355 12%
Source: Nomis (VAT registration 2000-2007)
In general, local authorities in Ayrshire had between 3% and 5% less business stock
at the end of 2007 compared with Scotland. North Ayrshire experienced a decrease
in de-registrations of 8% in 201, 3% greater than the national average. Business
births increased across the board with the most noticeable increase being within
East Ayrshire (18%) however this was still 12% below the national average.
Industry Sectors
Key points to note from the changes in business stock, reported in Table 8.7, over
the seven year period are:
a decrease was faced by all local authorities and Scotland for the public
administration, other community, social and personal services (ranging from
3% to 8% decrease); and

Annex B – Statistical Analysis – Rural Study: Rural Ayrshire and the Isles of Arran and the Cumbraes
53
an increase in real estate, renting and business activities was experienced
by all areas and accounted for the largest increase for East and South
Ayrshire and Scotland.

Annex B – Statistical Analysis – Rural Study: Rural Ayrshire and the Isles of Arran and the Cumbraes
54
Table 8.7: Changes in Business Stock by Industry (2000, 2007)
North Ayrshire East Ayrshire South Ayrshire Scotland
2007 % Change 2007 % Change 2007 % Change 2007 % Change
Agriculture; Forestry and fishing 530 -15% 265 -5% 470 -9% 19,070 -6%
Mining and quarrying; Electricity, gas and water supply 0 0% 5 0% 0 -100% 405 25%
Manufacturing 170 0% 205 -11% 160 -6% 8,745 -1%
Construction 340 32% 390 26% 320 21% 16,710 25%
Wholesale, retail and repairs 590 2% 600 -2% 665 -4% 27,075 -2%
Hotels and restaurants 240 11% 340 12% 350 13% 13,115 14%
Transport, storage and communication 115 12% 140 10% 135 17% 5,650 11%
Financial intermediation 10 100% 10 0% 10 0% 1,030 11%
Real Estate, renting and business activities 465 32% 535 43% 705 42% 38,825 42%
Public administration; Other community, social and personal services 200 -8% 175 -7% 240 -6% 9,195 -3%
Education; health and social work 30 0% 30 20% 45 29% 2,075 25%
Total 2,690 9% 2,695 7% 3,100 8% 141,895 12%
Source: Nomis - VAT Registrations/Deregistrations by Industry
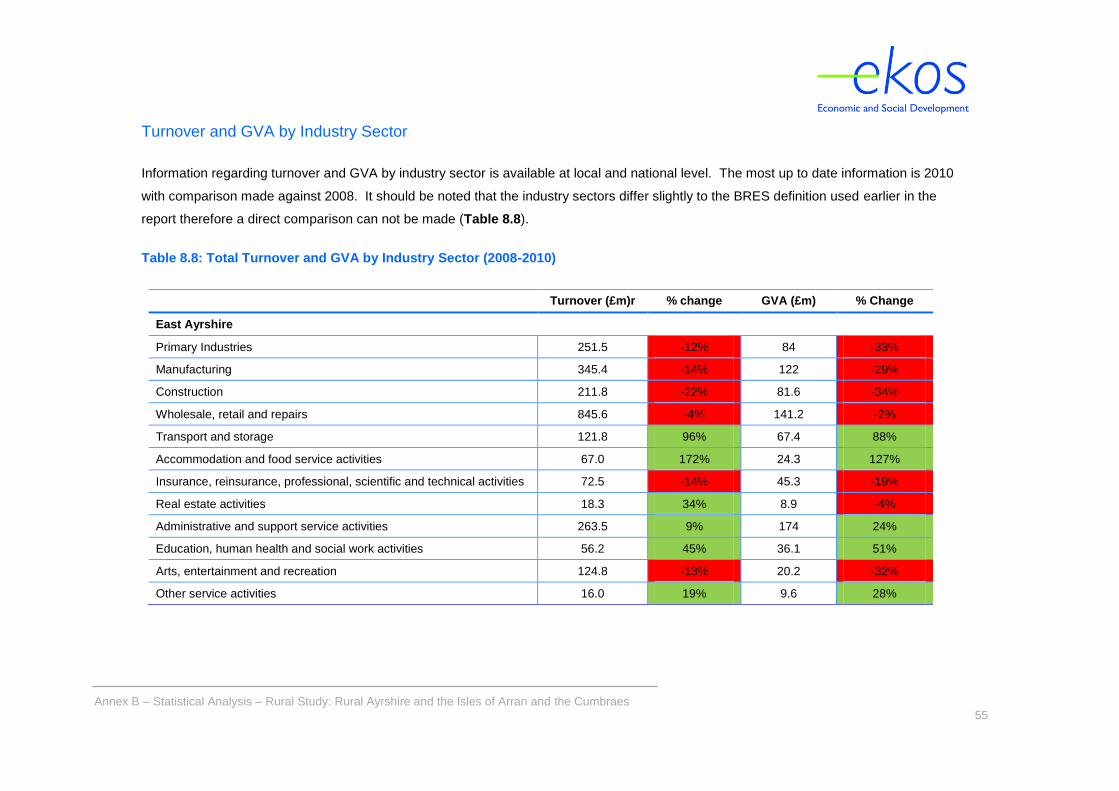
Annex B – Statistical Analysis – Rural Study: Rural Ayrshire and the Isles of Arran and the Cumbraes
55
Turnover and GVA by Industry Sector
Information regarding turnover and GVA by industry sector is available at local and national level. The most up to date information is 2010
with comparison made against 2008. It should be noted that the industry sectors differ slightly to the BRES definition used earlier in the
report therefore a direct comparison can not be made (Table 8.8).
Table 8.8: Total Turnover and GVA by Industry Sector (2008-2010)
Turnover (£m)r % change GVA (£m) % Change
East Ayrshire
Primary Industries 251.5 -12% 84 -33%
Manufacturing 345.4 -14% 122 -29%
Construction 211.8 -22% 81.6 -34%
Wholesale, retail and repairs 845.6 -4% 141.2 -2%
Transport and storage 121.8 96% 67.4 88%
Accommodation and food service activities 67.0 172% 24.3 127%
Insurance, reinsurance, professional, scientific and technical activities 72.5 -14% 45.3 -19%
Real estate activities 18.3 34% 8.9 -4%
Administrative and support service activities 263.5 9% 174 24%
Education, human health and social work activities 56.2 45% 36.1 51%
Arts, entertainment and recreation 124.8 -13% 20.2 -32%
Other service activities 16.0 19% 9.6 28%

Annex B – Statistical Analysis – Rural Study: Rural Ayrshire and the Isles of Arran and the Cumbraes
56
North Ayrshire
Primary Industries * * * *
Manufacturing 1,040.6 -10% 325.4 12%
Construction 196.6 -17% 90.2 -20%
Wholesale, retail and repairs 892.7 -2% 162.8 -11%
Transport and storage 120.0 -6% 64 -16%
Accommodation and food service activities 106.5 86% 41.6 60%
Information and communication 49.2 -22% 27.5 -30%
Insurance, reinsurance, professional, scientific and technical activities 68.9 -12% 41.4 -21%
Real estate activities 27.5 20% 12.2 -25%
Administrative and support service activities 122.2 37% 56.2 32%
Education, human health and social work activities 70.6 40% 44.1 44%
Arts, entertainment and recreation 172.5 -5% 23 -44%
Other service activities * * * *
South Ayrshire
Primary Industries * * * *
Manufacturing 1,040.6 -10% 325.4 12%
Construction 196.6 -17% 90.2 -20%
Wholesale, retail and repairs 892.7 -2% 162.8 -11%
Transport and storage 120.0 -6% 64 -16%
Accommodation and food service activities 106.5 86% 41.6 60%
Information and communication 49.2 -22% 27.5 -30%
Insurance, reinsurance, professional, scientific and technical activities 68.9 -12% 41.4 -21%
Real estate activities 27.5 20% 12.2 -25%
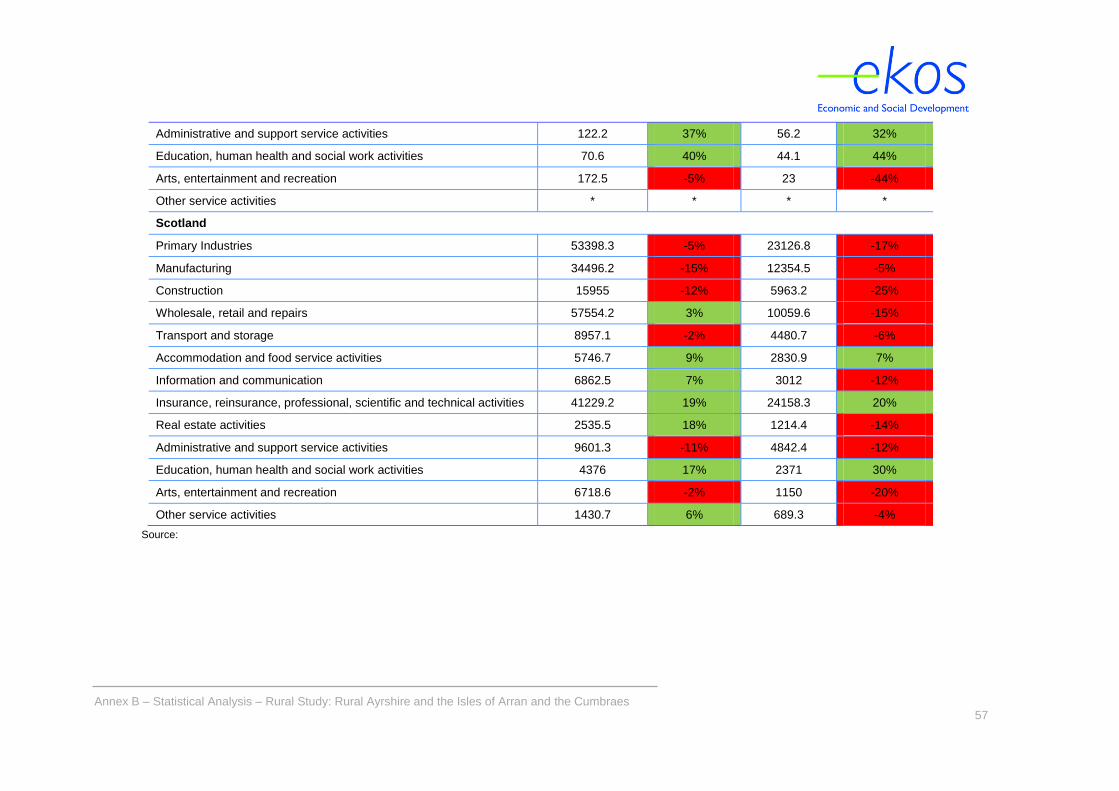
Annex B – Statistical Analysis – Rural Study: Rural Ayrshire and the Isles of Arran and the Cumbraes
57
Administrative and support service activities 122.2 37% 56.2 32%
Education, human health and social work activities 70.6 40% 44.1 44%
Arts, entertainment and recreation 172.5 -5% 23 -44%
Other service activities * * * *
Scotland
Primary Industries 53398.3 -5% 23126.8 -17%
Manufacturing 34496.2 -15% 12354.5 -5%
Construction 15955 -12% 5963.2 -25%
Wholesale, retail and repairs 57554.2 3% 10059.6 -15%
Transport and storage 8957.1 -2% 4480.7 -6%
Accommodation and food service activities 5746.7 9% 2830.9 7%
Information and communication 6862.5 7% 3012 -12%
Insurance, reinsurance, professional, scientific and technical activities 41229.2 19% 24158.3 20%
Real estate activities 2535.5 18% 1214.4 -14%
Administrative and support service activities 9601.3 -11% 4842.4 -12%
Education, human health and social work activities 4376 17% 2371 30%
Arts, entertainment and recreation 6718.6 -2% 1150 -20%
Other service activities 1430.7 6% 689.3 -4%
Source:

Annex B – Statistical Analysis – Rural Study: Rural Ayrshire and the Isles of Arran and the Cumbraes
58
9. Unemployment
This section details information regarding unemployment which is defined by the
Claimant Count. The claimant count measures the number of people unemployed
by those claiming job seekers allowance. Table 9.1 details the unemployment rate
of those of working age i.e. 16 to 64 years old.
Table 9.1: Unemployment Rate – 16-64 years old (%)
2007 2011 % Point Change
North Ayrshire 6.3 13.8 7.5
East Ayrshire 6.9 10.7 3.8
South Ayrshire 4.9 11.1 6.2
Scotland 4.8 8.2 3.4
Source: Nomis - ABI
In all three local authorities, the unemployment rate was above the national rate.
This difference has increased by 2011.The unemployment rate has experienced an
increase across all three of the local authority areas as well as at the national level.
North Ayrshire experienced the largest increase, 7.5 percentage points, of over twice
as much as the national level increase resulting in an unemployment rate of 13.8%.
Table 9.2 and Table 9.3 detail the change in Claimant Count between 2007 and
2012 across all geographic areas.
Table 9.2: Claimant Count (Feb 2007-2012)
2007 2012 Change % Change
Rural North Ayrshire 45 215 170 378%
Rural E Ayrshire 460 970 510 111%
Rural South Ayrshire 200 440 240 120%
LEADER N Ayrshire 645 1,155 510 79%
LEADER E Ayrshire 1,250 2,480 1,230 98%
LEADER S Ayrshire 385 815 430 112%
North Ayrshire 4,030 5,820 1790 44%
East Ayrshire 3,010 4,905 1,895 63%
South Ayrshire 2,145 3,335 1,190 55%
Scotland 89,360 151,565 62,205 70%
Source: Nomis – Claimant Count

Annex B – Statistical Analysis – Rural Study: Rural Ayrshire and the Isles of Arran and the Cumbraes
59
All areas have experienced an increase in the number of people claiming Jobs
Seekers Allowance between the period of February 2007 and February 2012. Rural
North Ayrshire experienced the largest proportionate increase, 378% over the five
year period. All rural and LEADER areas were significantly above their local
authority and the Scottish level (70%).
Table 9.3: Total Rural and Total LEADER Claimant Count (Feb 2007-2012)
2007 2012 Change % Change
Rural Ayrshire 705 1,625 920 127%
LEADER Ayrshire 2,280 4,450 2,170 95%
Source: Nomis – Claimant Count
Incapacity Benefit/Severe Disability Allowance Claimants
Incapacity Benefits (IB) and Severe Disability Allowance (SDA) Claimants is defined
as individuals that are unable to work and meet certain conditions. Table 9.4 and
Table 9.5 show the relevant data between February 2007 and February 2012.
Table 9.4: IB/SDA Claimants (Feb 2007- Feb 2012)
2007 2012 Change % Change
Rural North Ayrshire 575 345 -230 -40.0%
Rural East Ayrshire 2,425 1,375 -1,050 -43.3%
Rural South Ayrshire 1,275 775 -500 -39.2%
LEADER N Ayrshire 2,405 1,415 -990 -41.2%
LEADER E Ayrshire 5,095 2,900 -2,195 -43.1%
LEADER S Ayrshire 2,105 1250 -855 -40.6%
North Ayrshire 8,980 5,270 -3,710 -41.3%
East Ayrshire 7,850 4,550 -3,300 -42.0%
South Ayrshire 6,160 3,780 -2,380 -38.6%
Scotland 308,630 177,460 -131,170 -42.5%
Source: Nomis – DWP Benefits
Table 9.4 shows that the number of IB/SDA claimants has decreased for all areas by
roughly -40%. South Ayrshire and rural South Ayrshire experience the smallest
percentage decrease (38.6% and 39.2% respectively). Rural and LEADER East
Ayrshire experienced the largest percentage decrease c.43%, greater than the
Scottish level.

Annex B – Statistical Analysis – Rural Study: Rural Ayrshire and the Isles of Arran and the Cumbraes
60
Table 9.5: Total Rural and Total LEADER IB/ESA Claimants (Feb 2007- Feb
2012)
2007 2012 Change % Change
Rural Ayrshire 4,275 2,495 -1,780 -42%
LEADER Ayrshire 9,605 5,565 -4040 -42%
10. Other Sectors
10.1 Community and Social Enterprise
Social Enterprise
Each local authority has third sector interface organisations that support social
enterprise development in Ayrshire. The Ayrshire Community Trust (TACT) supports
social enterprises in North Ayrshire, the Council of Voluntary Organisations East
Ayrshire (CVOEA) in East Ayrshire, and Voluntary Action South Ayrshire (VASA) in
South Ayrshire.
These organisations offer advice and support for social enterprises. They provide
assistance with legal issues, compliance with regulations and act as a gateway to
funding organisations. Also available is help with organisation and management
structure as well as training opportunities, often in conjunction with local further
education providers.
Voluntary Actions South Ayrshire (VASA) were able to provide a rough guide to the
number of social enterprises operating within the whole of South Ayrshire, as of
2006 there was roughly 130-150 social enterprises.
Arran has circa12 social enterprise (including six golf courses, one child care, village
hall, social clubs, Arran National Trust).

Annex B – Statistical Analysis – Rural Study: Rural Ayrshire and the Isles of Arran and the Cumbraes
61
10.2 Renewable Industry Sector
Information is readily available for the provision and future development of wind
turbines within Ayrshire via various internet sites. Information has been analysed at
local authority level (Table 10.1).
Wind Farms
Table 10.1: Wind Farms
Active turbines Planned turbines
North Ayrshire 71 21
East Ayrshire 235* 236
South Ayrshire 88 77
Ayrshire 394 334
Scotland - -
The current 394 wind turbines in Ayrshire are split into seven different sites. The
major sites are Hadyard hill in North Ayrshire with 52 turbines, Arecleoch in South
Ayrshire with 60 turbines and Whitelee partially in East Ayrshire with 235 turbines.
Whitelee is a particularly large windfarm and straddle East Ayrshire and South
Lanarkshire.
Of the 334 planned turbines, the majority are in East Ayrshire with a 75 turbines
extension of Whitlee, the 59 turbine Harelaw renewable energy park and five other
smaller projects ranging in size from seven to 27 turbines. Two projects are planned
for North Ayrshire and five planned for South Ayrshire with none exceeding 23
turbines (source of information: local authorities' websites).
Furthermore, there are a number of projects at the scoping stage of development. It
is too early to give a precise estimate of the amount of turbines planned. Of these
projects, two are in East Ayrshire, four are in North Ayrshire and six are in South
Ayrshire.
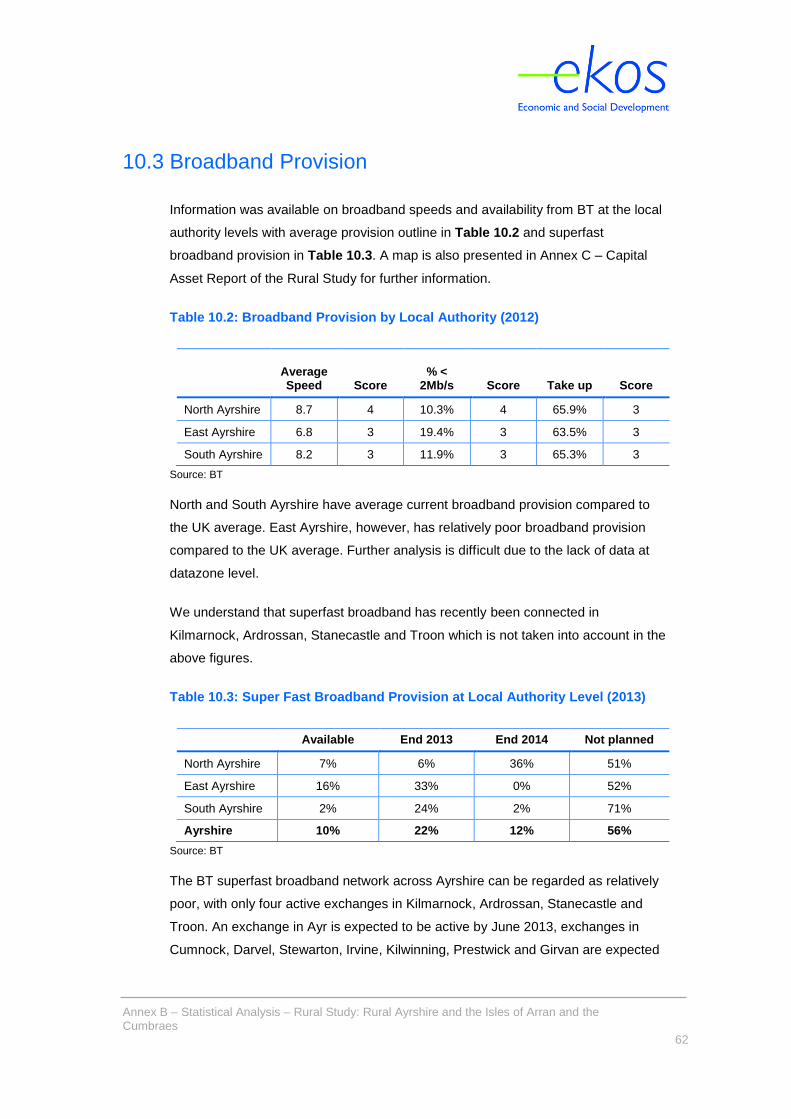
Annex B – Statistical Analysis – Rural Study: Rural Ayrshire and the Isles of Arran and the Cumbraes
62
10.3 Broadband Provision
Information was available on broadband speeds and availability from BT at the local
authority levels with average provision outline in Table 10.2 and superfast
broadband provision in Table 10.3. A map is also presented in Annex C – Capital
Asset Report of the Rural Study for further information.
Table 10.2: Broadband Provision by Local Authority (2012)
Average Speed Score
% < 2Mb/s Score Take up Score
North Ayrshire 8.7 4 10.3% 4 65.9% 3
East Ayrshire 6.8 3 19.4% 3 63.5% 3
South Ayrshire 8.2 3 11.9% 3 65.3% 3
Source: BT
North and South Ayrshire have average current broadband provision compared to
the UK average. East Ayrshire, however, has relatively poor broadband provision
compared to the UK average. Further analysis is difficult due to the lack of data at
datazone level.
We understand that superfast broadband has recently been connected in
Kilmarnock, Ardrossan, Stanecastle and Troon which is not taken into account in the
above figures.
Table 10.3: Super Fast Broadband Provision at Local Authority Level (2013)
Available End 2013 End 2014 Not planned
North Ayrshire 7% 6% 36% 51%
East Ayrshire 16% 33% 0% 52%
South Ayrshire 2% 24% 2% 71%
Ayrshire 10% 22% 12% 56%
Source: BT
The BT superfast broadband network across Ayrshire can be regarded as relatively
poor, with only four active exchanges in Kilmarnock, Ardrossan, Stanecastle and
Troon. An exchange in Ayr is expected to be active by June 2013, exchanges in
Cumnock, Darvel, Stewarton, Irvine, Kilwinning, Prestwick and Girvan are expected

Annex B – Statistical Analysis – Rural Study: Rural Ayrshire and the Isles of Arran and the Cumbraes
63
to be active by the end of 2013 and exchange upgrades in Kilbirnie, Alloway, Beith
and Dalry are planned by the end of 2014.
Network Coverage will still be poor after all of the planned upgrades with 56% of
rural areas without access to superfast broadband. The situation is particularly
difficult in south Ayrshire with 71% of rural areas without access to superfast
broadband for the foreseeable future.
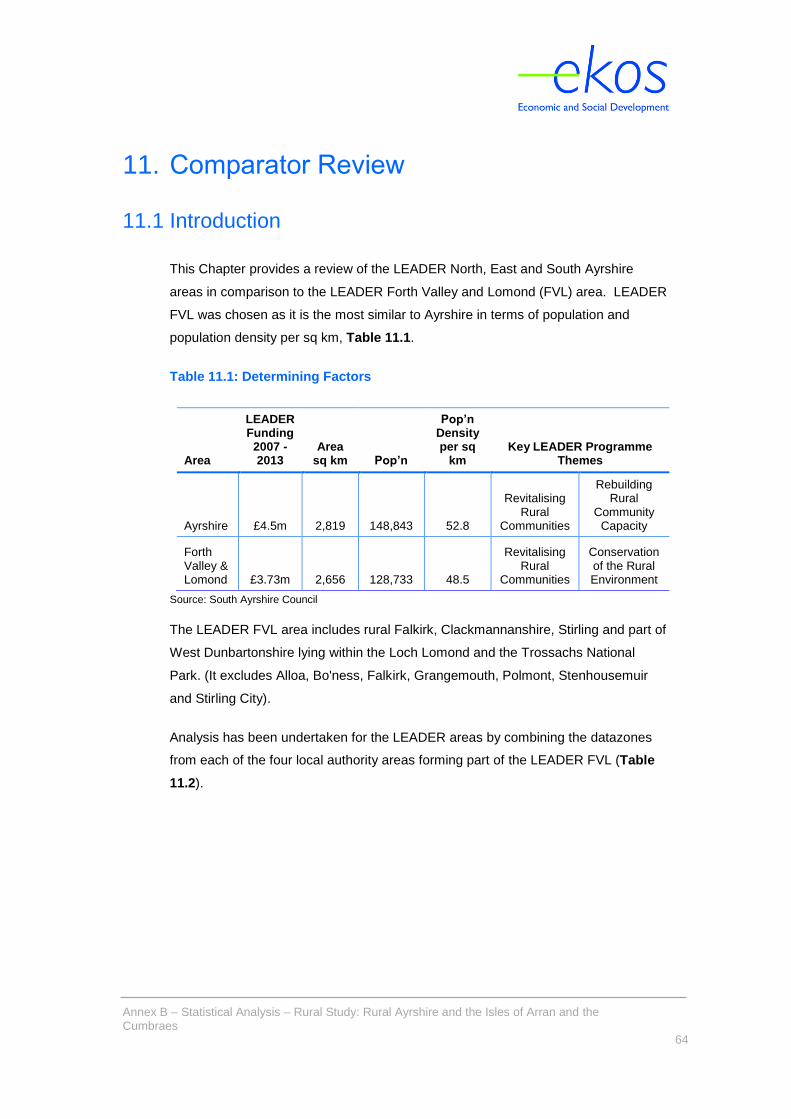
Annex B – Statistical Analysis – Rural Study: Rural Ayrshire and the Isles of Arran and the Cumbraes
64
11. Comparator Review
11.1 Introduction
This Chapter provides a review of the LEADER North, East and South Ayrshire
areas in comparison to the LEADER Forth Valley and Lomond (FVL) area. LEADER
FVL was chosen as it is the most similar to Ayrshire in terms of population and
population density per sq km, Table 11.1.
Table 11.1: Determining Factors
Area
LEADER Funding
2007 -2013
Area sq km Pop’n
Pop’n Density per sq
km Key LEADER Programme
Themes
Ayrshire £4.5m 2,819 148,843 52.8
Revitalising Rural
Communities
Rebuilding Rural
Community Capacity
Forth Valley & Lomond £3.73m 2,656 128,733 48.5
Revitalising Rural
Communities
Conservation of the Rural Environment
Source: South Ayrshire Council
The LEADER FVL area includes rural Falkirk, Clackmannanshire, Stirling and part of
West Dunbartonshire lying within the Loch Lomond and the Trossachs National
Park. (It excludes Alloa, Bo'ness, Falkirk, Grangemouth, Polmont, Stenhousemuir
and Stirling City).
Analysis has been undertaken for the LEADER areas by combining the datazones
from each of the four local authority areas forming part of the LEADER FVL (Table
11.2).

Annex B – Statistical Analysis – Rural Study: Rural Ayrshire and the Isles of Arran and the Cumbraes
65
Table 11.2: LEADER/Non LEADER Split
LEADER Non LEADER Total
North Ayrshire 64 115 179
East Ayrshire 92 62 154
South Ayrshire 44 103 147
Total Ayrshire 200 280 480
FVL 177 312 489
Source: South Ayrshire Council, Stirling Council and SNS
Figure 11.1 details the breakdown figuratively.
The LEADER/Non LEADER split in FVL is the same as in North Ayrshire whilst East
Ayrshire has a greater proportion of LEADER areas.
Source: South Ayrshire Council, Stirling Council and SNS
11.2 Demographics
Population
In 2011, LEADER FVL had a total population of 143,543 relatively similar to the total
population within LEADER Ayrshire (155,428) with the gender make up across all
three of the Ayrshire areas as well as FVL following closely to the national average
of male 48% and female 52%, Table 11.3.
36%
60%
30%43% 36%
64%
40%
70%57% 64%
0%
20%
40%
60%
80%
100%
North Ayrshire East Ayrshire South Ayrshire Total Ayrshire FVL
Figure 11.1: LEADER/Non LEADER Split
LEADER Non LEADER

Annex B – Statistical Analysis – Rural Study: Rural Ayrshire and the Isles of Arran and the Cumbraes
66
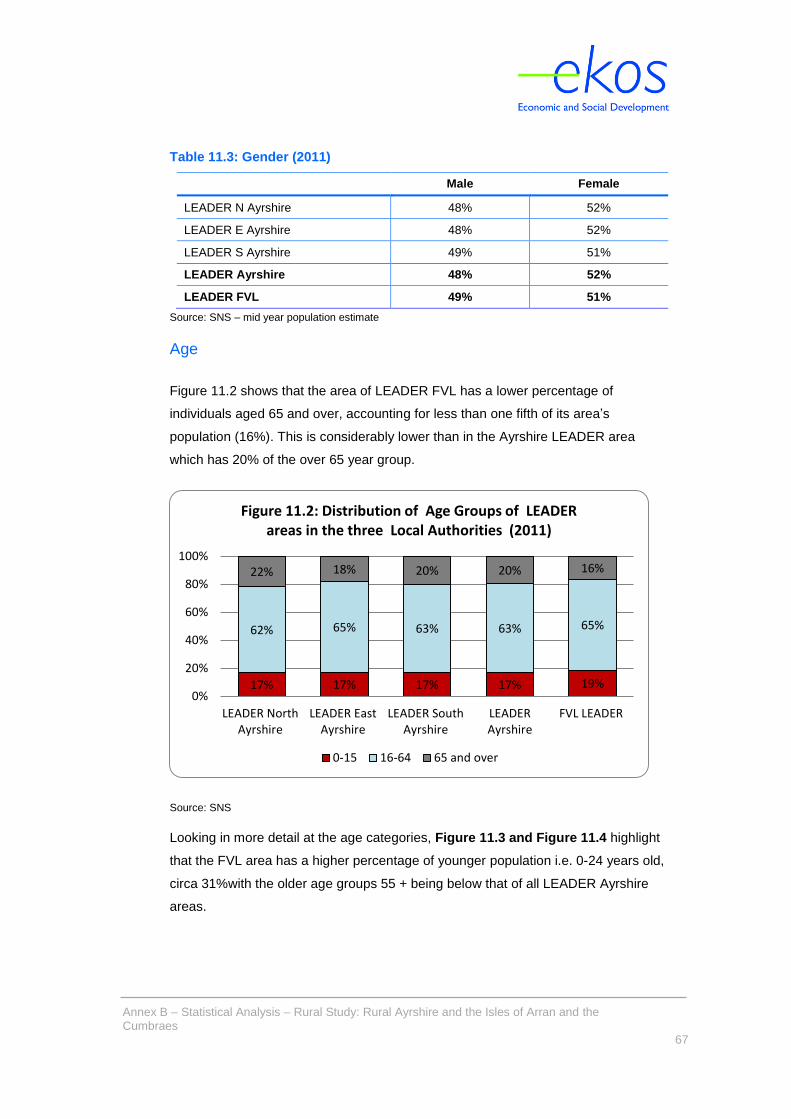
Annex B – Statistical Analysis – Rural Study: Rural Ayrshire and the Isles of Arran and the Cumbraes
67
Table 11.3: Gender (2011)
Male Female
LEADER N Ayrshire 48% 52%
LEADER E Ayrshire 48% 52%
LEADER S Ayrshire 49% 51%
LEADER Ayrshire 48% 52%
LEADER FVL 49% 51%
Source: SNS – mid year population estimate
Age
Figure 11.2 shows that the area of LEADER FVL has a lower percentage of
individuals aged 65 and over, accounting for less than one fifth of its area’s
population (16%). This is considerably lower than in the Ayrshire LEADER area
which has 20% of the over 65 year group.
Source: SNS
Looking in more detail at the age categories, Figure 11.3 and Figure 11.4 highlight
that the FVL area has a higher percentage of younger population i.e. 0-24 years old,
circa 31%with the older age groups 55 + being below that of all LEADER Ayrshire
areas.
17% 17% 17% 17% 19%
62% 65% 63% 63% 65%
22% 18% 20% 20% 16%
0%
20%
40%
60%
80%
100%
LEADER NorthAyrshire
LEADER EastAyrshire
LEADER SouthAyrshire
LEADERAyrshire
FVL LEADER
Figure 11.2: Distribution of Age Groups of LEADER areas in the three Local Authorities (2011)
0-15 16-64 65 and over

Annex B – Statistical Analysis – Rural Study: Rural Ayrshire and the Isles of Arran and the Cumbraes
68
Source: SNS
Source: SNS
Population Trend
Over the ten year period of 2001 to 2011, both LEADER areas experienced an
increase in population, ranging from a low of 1% to a high of 9% with LEADER FVL
experiencing the largest increase, Table 11.4.
0%
5%
10%
15%
20%
25%
0-15 16-24 25-34 35-44 45-54 55-64 65 +
Figure 11.3:Distribution of Detailed Age Groups across the LEADER Areas of Local Authorities (2011)
LEADER N Ayrshire LEADER E Ayrshire
LEADER S Ayrshire LEADER FVL
0%
5%
10%
15%
20%
25%
0-15 16-24 25-34 35-44 45-54 55-64 65 +
Figure 11.4:Distribution of Detailed Age Groups across the LEADER and FVL (2011)
LEADER Ayrshire LEADER FVL

Annex B – Statistical Analysis – Rural Study: Rural Ayrshire and the Isles of Arran and the Cumbraes
69
Table 11.4: Total Population Trend 2001-2011
2001 2011 Change % Change
LEADER North Ayrshire 47,620 50,476 2,856 6%
LEADER East Ayrshire 72,422 73,191 769 1%
LEADER South Ayrshire 34,974 36,297 1,323 4%
LEADER Ayrshire 152,428 157,153 4,725 3%
LEADER FVL 131,470 143,453 11,983 9%
Source: SNS – mid year population estimate
Focusing in more depth on the trend in age categories, Figure 11.5 and Figure
11.6, LEADER Ayrshire and LEADER FVL follow a similar population trend with 0-15
year old and 25-44 experiencing a decrease with the remaining four age groups, 16-
24 and 45+ experiencing an increase. However, the LEADER FVL area specifically
experienced an increase of circa one quarter (25%) of 16-24 year olds and a higher
increase in the 55-64 age group.
Source: SNS
-25%
-15%
-5%
5%
15%
25%
0-15 16-24 25-34 35-44 45-54 55-64 65 +
Figure 11.5: LEADER Population Change by % (2001-2011)
LEADER N Ayrshire LEADER E Ayrshire
LEADER S Ayrshire LEADER FVL

Annex B – Statistical Analysis – Rural Study: Rural Ayrshire and the Isles of Arran and the Cumbraes
70
Source: SNS
11.3 Housing
This sections details housing within the Ayrshire and FVL LEADER areas. The data
demonstrate that the FVL area is fairly similar in structure than the Ayrshire LEADER
area, but has a higher percentage of owned property with mortgage or loan, Table
11.5.
-20%
-10%
0%
10%
20%
30%
0-15 16-24 25-34 35-44 45-54 55-64 65 +
Figure 11.6: LEADER Population Change by % (2001-2011)
LEADER Ayrshire LEADER FVL

Annex B – Statistical Analysis – Rural Study: Rural Ayrshire and the Isles of Arran and the Cumbraes
71
Table 11.5: Housing Tenure (2001)
Owned
Outright
Owned Mortgage/
Loan Shared Own’p
Council Rented
Private Let
Other Social
Rented from
Employer
Rented from
Relative Other
LEADER North Ayrshire 33% 36% 0.3% 21% 3% 5% 1% 1% 0.4%
LEADER East Ayrshire 21% 37% 0.2% 35% 3% 3% 0.5% 1% 0.3%
LEADER South Ayrshire 29% 37% 0.3% 23% 2% 6% 1% 1% 0.4%
LEADER Ayrshire 26% 36% 0.2% 28% 3% 4% 1% 1% 0.4%
LEADER FVL 25% 39% 0.5% 26% 3% 4% 1% 1% 0.4%
Source: SNS
LEADER Ayrshire has a slightly higher percentage of Council Rented accommodation with East Ayrshire having the highest percentage of
council rented houses (35%), considerably higher than the three other areas including FVL.
Figure 11.7 illustrates the combined values for house ownership, owned outright and by mortgage/loan. The figure demonstrates that
LEADER FVL has a higher percentage than its Ayrshire counterpart, but at the same time, North and South Ayrshire have individually the
highest values.

Annex B – Statistical Analysis – Rural Study: Rural Ayrshire and the Isles of Arran and the Cumbraes
72
Source: SNS
11.4 Poverty and Deprivation
Data has been sourced from the Scottish Index of Multiple Deprivation (SIMD) to
determine the level of deprivation in each of the areas. Figure 11.8 details the
number of datazones within each area categorised within the 15% most deprived
areas.
The four local authorities relating to the LEADER FVL area have a total of 56 of the
15% most deprived datazones with roughly one third (18 datazones) of these being
located within LEADER areas (32%). When comparing SIMD to the total area within
Ayrshire, FVL has a marginally higher level of deprivation (5%) however when
compared to the individual areas within Ayrshire, LEADER East Ayrshire is the most
deprived with 50% of all 15% most deprived datazones within East Ayrshire being
located within the LEADER area.
50%
55%
60%
65%
70%
LEADER NorthAyrshire
LEADER EastAyrshire
LEADER SouthAyrshire
LEADERAyrshire
LEADER FVL
Figure 11.7:Combined housing owned outright or mortgage/loan

Annex B – Statistical Analysis – Rural Study: Rural Ayrshire and the Isles of Arran and the Cumbraes
73
Source: Scottish Index of Multiple Deprivation (2012)
Figure 11.9 and Figure 11.10 provide further detail by the six most commonly cited
categories: Income; Employment; Health; Education; Housing; Crime; and
Geographic access (Figure 3.10 only).
By comparing the data between the two LEADER areas (Figure 3.10), the data show
that the Ayrshire LEADER area is – apart from housing where it shows similar values
- more deprived than FVL in every SIMD domain.
Source: SIMD
7 163
26 18
39 16
14
69
52
0
20
40
60
80
100
North Ayrshire East Ayrshire South Ayrshire Ayrshire FVL
Figure 11.8: Number of LEADER and Non Leader Datazones within 15% Most Deprived SIMD (2012)
LEADER Non LEADER
0
5
10
15
20
25
30
Income Employment Health Education Housing Crime
Figure 11.9: Number of LEADER Datazones within the 15% Most Deprived SIMD (2012)
LEADER North Ayrshire (64) LEADER East Ayrshire (92)
LEADER South Ayrshire (44) LEADER FVL (77)

Annex B – Statistical Analysis – Rural Study: Rural Ayrshire and the Isles of Arran and the Cumbraes
74
Source: SIMD
Drive Time
Drive time has been determined by analysing the percentage of datazones within a
five mile drive or less of various facilities, Table 11.6 details the results.
Table 11.6: Percentage of Datazones within 5 miles of Key Services (2006-
2009)
GP Post Office Primary School
Secondary School
Shopping Facilities
2006 2009 2006 2009 2006 2009 2006 2009 2006 2009
LEADER North Ayrshire (n=64) 83% 92% 91% 94% 95% 100% 42% 55% 56% 75%
LEADER North Ayrshire (n=92) 80% 97% 90% 100% 90% 100% 30% 71% 32% 60%
LEADER North Ayrshire (n=44) 80% 89% 91% 100% 100% 100% 36% 55% 32% 45%
Total LEADER Ayrshire (n=200)
81% 94% 91% 98% 94% 100% 36% 62% 40% 62%
LEADER FVL (n=177) 81% 94% 97% 100% 97% 98% 35% 82% 56% 84%
Source: SNS
All areas have experienced an increase between 2006 and 2009 whereby the FVL
LEADER area has improved more than Ayrshire in both access to secondary school
and shopping facilities (82% and 84% respectively).
0
10
20
30
40
50
60
Income Employment Health Education Housing Crime Geo Access
Figure 11.10: Number of LEADER Datazones within the 15% Most Deprived SIMD (2012)
LEADER Ayrshire (200) LEADER FVL (77)

Annex B – Statistical Analysis – Rural Study: Rural Ayrshire and the Isles of Arran and the Cumbraes
75
11.5 Employment
This section details employment within the Ayrshire and FVL LEADER areas.
Working Age Population
The working age population, defined as individuals aged between 16-64 years old, is
detailed in Table 11.6. LEADER FVL has a slightly higher percentage of working
age population as LEADER East Ayrshire (63% and 65%) respectively.
Table 11.6: Working Age Population (2011)
Number % of total population
LEADER N Ayrshire 31,074 62%
LEADER E Ayrshire 47,296 65%
LEADER S Ayrshire 22,738 64%
LEADER Ayrshire 101,108 63%
LEADER FVL 92,905 65%
Source: SNS – mid year population estimate
Employment by Industry Sector
Employment data is available between 2008 and 2011. It should be noted that the
term “employment” refers to employees and proprietors of the business.
Employment as of 2011 in the following areas was:
LEADER Ayrshire – 54,657 employees; and
LEADER Forth Valley and Lomond – 41,839 employees.
As Table 11.7 shows, both LEADER areas have experienced a loss in
employment, however in total the Ayrshire LEADER area has lost double the
amount of employees than FVL (-3,664 and -1,806 respectively). Greatest losses
have been experienced in Ayrshire’s manufacturing sector and in public
administration and defence. However, Ayrshire has increased employment well in
sectors such as business administration and support services (an area where FVL
LEADER has decreased in employment) and in health where both LEADER areas
gained significant increases.

Annex B – Statistical Analysis – Rural Study: Rural Ayrshire and the Isles of Arran and the Cumbraes
76
Table 11.7: Employment by Total LEADER Ayrshire and FVL Datazone (2008-11)
LEADER Ayrshire LEADER FVL
2008 2011 Change 2008 2011 Change
Agriculture, forestry & fishing 382 304 -78 284 183 -101
Mining, quarrying & utilities 2,412 1,974 -438 899 765 -134
Manufacturing 8,886 6,818 -2,068 5,850 5,561 -289
Construction 3,749 3,205 -544 4,159 3,337 -822
Motor trades 983 862 -121 596 586 -10
Wholesale 1,672 1,569 -103 1,381 1,610 229
Retail 4,397 4,259 -138 3,541 3,536 -5
Transport & storage 2,601 2,209 -392 1,946 1,865 -81
Accommodation & food services 4,336 4,265 -71 5,596 5,087 -509
Information & communication 737 336 -401 491 369 -122
Financial & insurance 405 284 -121 297 134 -163
Property 337 369 32 666 452 -214
Professional, scientific & technical 1,296 1,558 262 1,734 2,078 344
Business administration & support services 2,719 3,590 871 1,937 1,334 -603
Public administration & defence 2,881 1,552 -1,329 1,237 1,161 -76
Education 3,410 3,081 -329 5,980 5,731 -249
Health 12,891 14,129 1,238 5,245 6,343 1,098
Arts, entertainment, recreation & other services 2,219 2,282 63 1,806 1,707 -99
Total 58,321 54,657 -3,664 43,645 41,839 -1,806
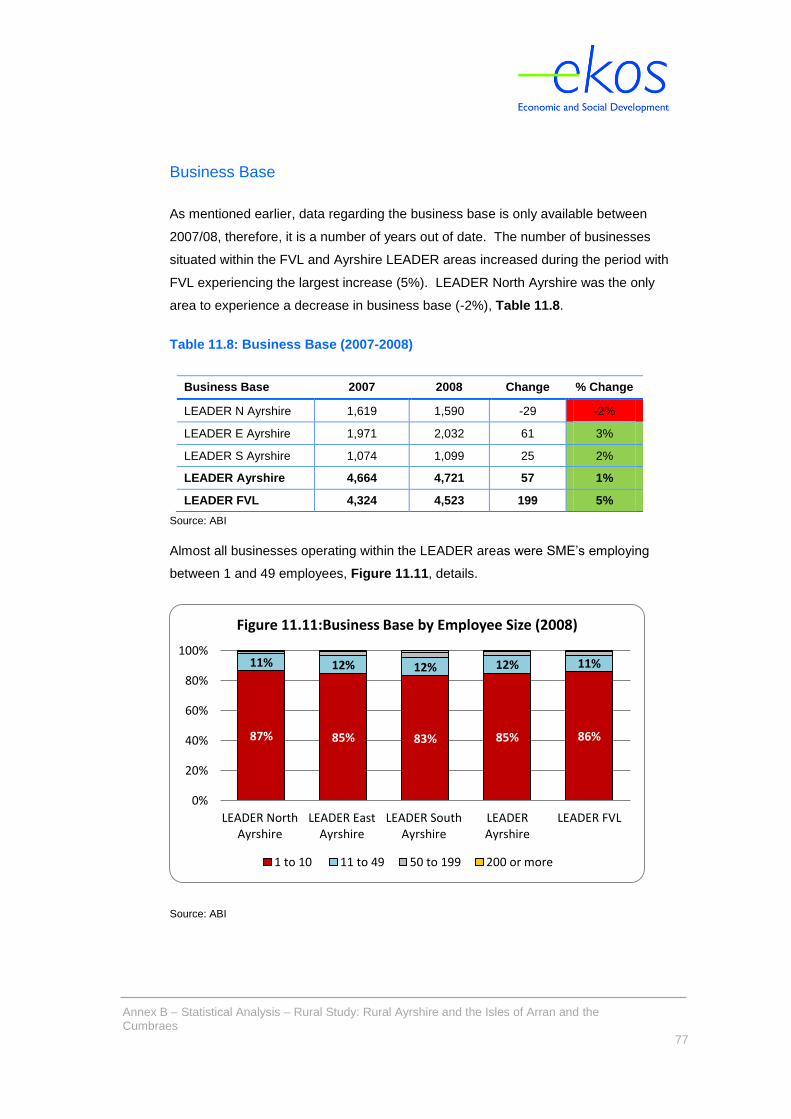
Annex B – Statistical Analysis – Rural Study: Rural Ayrshire and the Isles of Arran and the Cumbraes
77
Business Base
As mentioned earlier, data regarding the business base is only available between
2007/08, therefore, it is a number of years out of date. The number of businesses
situated within the FVL and Ayrshire LEADER areas increased during the period with
FVL experiencing the largest increase (5%). LEADER North Ayrshire was the only
area to experience a decrease in business base (-2%), Table 11.8.
Table 11.8: Business Base (2007-2008)
Business Base 2007 2008 Change % Change
LEADER N Ayrshire 1,619 1,590 -29 -2%
LEADER E Ayrshire 1,971 2,032 61 3%
LEADER S Ayrshire 1,074 1,099 25 2%
LEADER Ayrshire 4,664 4,721 57 1%
LEADER FVL 4,324 4,523 199 5%
Source: ABI
Almost all businesses operating within the LEADER areas were SME’s employing
between 1 and 49 employees, Figure 11.11, details.
Source: ABI
87% 85% 83% 85% 86%
11% 12% 12% 12% 11%
0%
20%
40%
60%
80%
100%
LEADER NorthAyrshire
LEADER EastAyrshire
LEADER SouthAyrshire
LEADERAyrshire
LEADER FVL
Figure 11.11:Business Base by Employee Size (2008)
1 to 10 11 to 49 50 to 199 200 or more

Annex B – Statistical Analysis – Rural Study: Rural Ayrshire and the Isles of Arran and the Cumbraes
78
Focusing in more detail at business base trend by employee size, Table 11.9 and
Table 11.10, all areas experienced an increase in the number of businesses
employing between 1-10 members of staff. However, the FVL LEADER area
experienced almost double as much growth than the Ayrshire LEADER area.
In the business size group 11-49 employees, Ayrshire LEADER area suffered a
decrease in numbers mainly due to the losses experienced in North Ayrshire. For
FVL LEADER the data show a small, but positive increase.
The number of larger businesses (50-199 employees) decreased in both LEADER
areas to similar extent. And the figure for large companies was too small to be
disclosed for confidentiality reasons in both LEADER areas.

Annex B – Statistical Analysis – Rural Study: Rural Ayrshire and the Isles of Arran and the Cumbraes
79
Table 11.9: Business Base by Employee Numbers - LEADER Locations (2007-2008)
LEADER North Ayrshire LEADER East Ayrshire LEADER South Ayrshire
2007 2008 Change 2007 2008 Change 2007 2008 Change
1 to 10 1,363 1,380 17 1,667 1,723 56 894 915 21
11 to 49 208 180 -28 241 243 2 128 133 5
50 to 199 38 25 -13 57 60 3 40 38 -2
200 or more * * - * * / * * +
Source: ABI
* data is too small to be disclosed for confidentiality reasons, - indicates a decrease, / no change and + an increase
Table 11.10: Business Base by Employee Numbers - LEADER Locations (2007-2008)
LEADER Ayrshire LEADER FVL
2007 2008 Change 2007 2008 Change
1 to 10 3,924 4,018 94 3,710 3,908 198
11 to 49 577 556 -21 480 488 8
50 to 199 135 123 -12 114 103 -11
200 or more * * + * * +

Annex B – Statistical Analysis – Rural Study: Rural Ayrshire and the Isles of Arran and the Cumbraes
80
11.6 Unemployment
This section details information regarding unemployment which is defined by the
Claimant Count. The claimant count measures the number of people unemployed
by those claiming job seekers allowance.
Similar to Ayrshire trends, FVL has experienced an increase in those individuals
claiming Jobs Seekers Allowance (JSA) captured in Claimant Count data, Table
11.11. All areas experienced an increase from 79% upwards. FVL experienced the
largest percentage increase (206%), but also started at a much lower point than
LEADER Ayrshire with the actual number of claimants in 2012 being less than that of
the Ayrshire LEADER area (1,600 claimants in FVL and 2,170 claimants in Ayrshire).
Table 11.11: Claimant Count (Feb 2007-2012)
2007 2012 Change % Change
LEADER North Ayrshire 645 1,155 510 79%
LEADER East Ayrshire 1,250 2,480 1,230 98%
LEADER South Ayrshire 385 815 430 112%
LEADER Ayrshire 2,280 4,450 2,170 95%
LEADER FVL 775 2,375 1,600 206%
Source: Nomis – Claimant Count
The percentage of male claimants decreased across all areas with the opposite
occurring for female claimants, mostly LEADER Ayrshire experienced an 18.1
percentage point change from male to female claimants, Table 11.12.
Table 11.12: Percentage Change by Gender (Feb 2007-2012)
Male Female
2012 % Point Change 2012
% Point Change
LEADER North Ayrshire 435 -4.0% 135 4.0%
LEADER East Ayrshire 825 -38.7% 440 38.7%
LEADER South Ayrshire 210 -7.6% 95 7.6%
LEADER Ayrshire 1470 -18.1% 670 18.1%
LEADER FVL 1,905 -10.8% 470 10.8%
Source: Nomis – Claimant Count
Due to data rounding (all data is rounded to the nearest 5%) total numbers are marginally different when compared to Table 11.11.
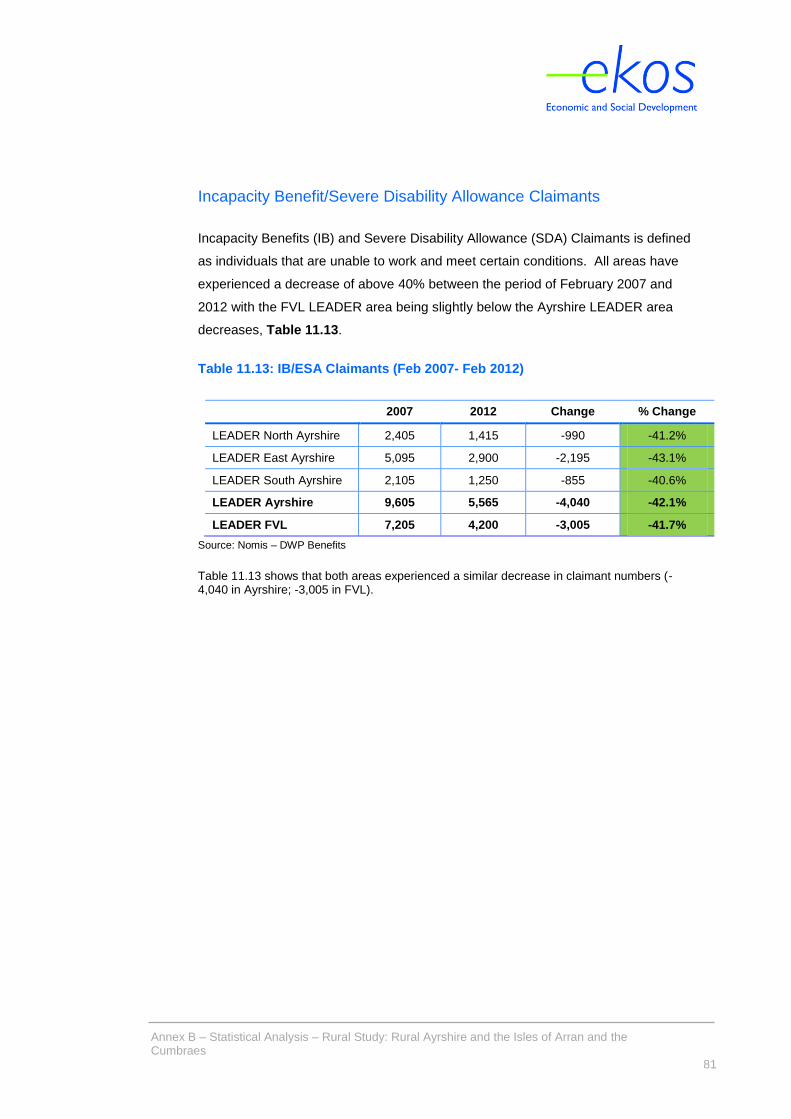
Annex B – Statistical Analysis – Rural Study: Rural Ayrshire and the Isles of Arran and the Cumbraes
81
Incapacity Benefit/Severe Disability Allowance Claimants
Incapacity Benefits (IB) and Severe Disability Allowance (SDA) Claimants is defined
as individuals that are unable to work and meet certain conditions. All areas have
experienced a decrease of above 40% between the period of February 2007 and
2012 with the FVL LEADER area being slightly below the Ayrshire LEADER area
decreases, Table 11.13.
Table 11.13: IB/ESA Claimants (Feb 2007- Feb 2012)
2007 2012 Change % Change
LEADER North Ayrshire 2,405 1,415 -990 -41.2%
LEADER East Ayrshire 5,095 2,900 -2,195 -43.1%
LEADER South Ayrshire 2,105 1,250 -855 -40.6%
LEADER Ayrshire 9,605 5,565 -4,040 -42.1%
LEADER FVL 7,205 4,200 -3,005 -41.7%
Source: Nomis – DWP Benefits
Table 11.13 shows that both areas experienced a similar decrease in claimant numbers (-4,040 in Ayrshire; -3,005 in FVL).