rural settlements and deforestation in the amazon - anpec · rural settlements and deforestation in...
TRANSCRIPT
Rural Settlements and Deforestation in the Amazon
Juliano Assunçãoa,b,, Romero Rochac
aClimate Policy Initiative (CPI) & (NAPC/PUC-Rio)bDepartment of Economics, PUC-Rio
cDepartment of Economics, UFRJ & Climate Policy Initiative (CPI)
Abstract
Since the 1970s, the creation of Rural Settlements with state assistance has been oneof several strategies by the Federal Government of Brazil to colonize remote regionswith low population. Even though the area dedicated to these settlements remainedrelatively stable for decades, between 2002 and 2014 Rural Settlements in the Amazonregion jumped from 220 thousand square kilometers to 376 thousand square kilometers,an increase of 71%. This paper shows that most part of this increase was located in remoteareas with low population and in municipalities with high forest coverage. We also use a�xed-e�ect model to calculate the impact of the Rural Settlements created between 2002and 2014 on deforestation. We �nd that the impact is positive and statistically signi�cant.Rural Settlements are responsible for 30% of total deforestation in the Amazon Biome.We also �nd that the e�ect is heterogeneous, and depends on the type of Rural Settlement,with Rural Settlements types located in remote areas being responsible for most part ofthe impact of Rural Settlements on deforestation.
Resumo
Desde os anos 70, a criação de assentamentos rurais tem sido uma das estratégiasdo Governo Federal para colonizar áreas remotas com pouca população. Apesar da áreadestinada a assentamentos rurais ter �cado estável por décadas, entre 2002 e 2014 a áreaque eles ocupam na região Amazônica pulou de 220 mil quilômetros quadrados para 376mil quilômetros quadrados, um crescimento de 71%. Este artigo mostra que a maiorparte deste aumento aconteceu em áreas remotas com pouca população e em municípioscom cobertura �orestal alta. O modelo de efeitos �xos foi usado para calcular o impactodos assentamentos rurais criados entre 2002 e 2014 no desmatamento da Amazônia eo resultado encontrado indica que os assentamentos rurais são responsáveis por 30% dodesmatamento do Bioma Amazônia neste período. Também foram encontrados resultadosheterogêneos, sendo a categoria "assentamentos diferenciados", geralmente localizada emáreas remotas, a responsável pela maior parte deste efeito.
Keywords: deforestation, Amazon, property size, conservation policy, desmatamento,Amazônia, tamanho de propriedade, política de conservaçãoÁrea ANPEC: Área 11 - Economia Agrícola e do Meio AmbienteJEL codes: Q23, Q24, Q28
Email addresses: [email protected] (Juliano Assunção), [email protected] (RomeroRocha)

1. Introduction
Although in many countries "settlement"is a term used to designate a group of peoplewho establish themselves in an area to live and produce, Rural Settlement in Brazilusually means some portion of land occupied by farmers who receive that land as partof an agrarian reform e�ort. This land usually comes from a previous owner who hadunproductive land or from some public lands that do not have any private owner. Therural settlers who bene�t from the agrarian reform usually also receive state assistance tohelp with their production. This assistance is usually in the form of subsidized �nancingor technical assistance from the government.
Historically, the literature has presented an important link between Amazon RuralSettlements and deforestation. The creation of Rural Settlements, the literatureargues, could increase deforestation for many reasons. First, settlements could increasepopulation density in the areas where they are located. Second, environmental law in theAmazon requires that at least 80% of each rural household's land be preserved with nativevegetation. It is usually more di�cult for small-scale farmers to keep this percentage oftheir land intact as native forest and still produce for the market. When the tract of landis larger, it is more likely that farmers can meet this requirement. At the same time,Rural Settlements and agrarian reform in Brazil are usually seen as one of the ways toreduce poverty and inequality, which raises the dichotomy of social development versusenvironmental conservation (Caviglia-Harris and Harris, 2011; Turner, 2007).
The aim of this paper is to investigate whether state assisted Rural Settlementscontributed to an increase in deforestation in the Amazon between 2002 and 2014.Conservation policies targeted large deforestation polygons and, depending on the state,had an impact on large properties; however, there was also a huge increase of settlementproject areas in the Amazon Biome, which jumped from 220 thousand square kilometresin 2002 to 376 thousand square kilometres in 2014. These settlements are usually largetracts of land that have been divided into small plots that are distributed to small-scalefarmers with state assistance. These plots are used for crop production, cattle beefactivities, and milk production.
We intend to identify how these projects expanded in the Amazon region from 2002to 2014 and whether they were a barrier to the e�ectiveness of conservation policies.Have the new settlements created a force pushing to the deforestation direction, and thustrending away from conservation? Was this force quantitatively important? This paperintends to address these questions.
From the 1960s to the 1980s, small-scale farmers with state assistance deforestedlarge areas of tropical forest in Southeast Asia and Latin America, including theAmazon. As globalization and urbanization increased during the 1980s, the agents ofdeforestation changed in Brazil and Indonesia. Well-capitalized ranchers, farmers, andloggers, producing for consumers in distant markets, became more prominent in theseplaces and this globalization weakened the historically strong relationship between localpopulation growth and forest cover (Rudel et al., 2009).
This change was reinforced by Brazilian Federal Government policies. Incentives werecreated to develop the enterprise agricultural sector, such as: exemptions of agriculturalincome from income taxation; rules of public land allocation based on claims that aremore secure when the land is cleared; a progressive land tax that contains provisions
2
that encourage the conversion of forest to crop land or pasture; a tax credit schemeaimed toward corporate livestock ranches that subsidizes ine�cient ranches establishedon cleared forest land; and subsidized credit available for SUDAM-approved ranches(Binswanger, 1991; Fearnside, 2005).
The result of these changes and policies was that large landholders became responsiblefor most of Brazilian Amazon deforestation. Pacheco (2012) shows that, in absolute terms,areas dominated by large and medium landowners clear a higher amount of Amazon forestthan areas dominated by smallholders. However, smallholders are able to keep a smallershare of their farm as native forest, since they have less land dedicated to agriculturalproduction. Godar et al. (2014) show that while areas dominated by large landownerswere responsible for 47% of accumulated deforestation in the Amazon, areas dominatedby smallholders were responsible for only 13.9% of Amazon area deforested.
Property-level analyses are con�ned to small geographical areas, but also con�rm theseresults (Walker et al., 2000; D`Antona et al., 2006; Aldrich et al., 2006; Michalski et al.,2010; Godar et al., 2012). Using data from four di�erent municipalities, Walker et al.(2000) show that the relative participation of large cattle ranching producers dependson the type of activity predominant in the municipality. In areas designed for RuralSettlements, with high in-migration of small-scale producers, the relative participationof large cattle ranchers on deforestation is smaller; however, in areas designed for largeranching initiatives originally undertaken by SUDAM, the relative participation of largecattle ranchers could reach as much as 100%.
These questions became even more important with the introduction of a new set ofconservation policies that targeted large deforestation polygons. Amazon deforestationrates escalated in the early 2000s, but after peaking at over 27 thousand square kilometresin 2004, they decreased sharply to about 5 thousand square kilometres in 2014 (INPE(2015)). The strengthening of Amazon monitoring and law enforcement e�orts starting in2004 was one of the main drivers of this deforestation slowdown (Assunção et al., 2013a,2015a).
Central to these e�orts was the implementation of the remote sensing-based Real-Time System for Detection of Deforestation (DETER). Yet, the satellite used in DETERis only capable of detecting forest clearings where the total contiguous area exceeds 0.25square kilometres. Because DETER is used to target law enforcement activities in theAmazon, clearings smaller than this threshold are less likely to be caught by law enforcers.The recent change in deforestation composition suggests that the dynamics of Amazonforest clearings may have changed in response to DETER's technical shortcoming.
With this caveat in the monitoring system, Assunção et al. (2015b) show that relativeparticipation of small-scale farmers on total deforestation increased in Pará, the state withhigher deforestation rates in the Amazon. Godar et al. (2014) also show that commandand control policies implemented in the 2000s reduce deforestation by 81% in areasdominated by large landowners and by only 73% in areas dominated by smallholders.Therefore, the importance of settlements to this change in the small-scale agriculturedeforestation become an important research issue.
Many Rural Settlements are created after invasions of unproductive land by ruralorganizations, such as the Landless Movement (Movimento dos Sem-Terra), whichsuggests the impact of the judicial insecurity of property rights. In this case, the increaseof Rural Settlements could a�ect deforestation through this judicial insecurity (Araujo
3

et al., 2009; de Janvry et al., 2015).There is also a literature that links population density and roads to deforestation
(Caviglia-Harris and Harris, 2011; Imbernon, 1997; Pfa� et al., 2007; Chomitz andThomas, 2003). As many of the settlements projects a�ect the number of people livingin these places and also the infrastructure needed to transport agricultural production,the settlements could be causing an increase in deforestation.
Our work also speaks to the literature on the drivers of deforestation. The impactof socioeconomic and geographic factors on deforestation has long been documented.Population, road density, climate, rural credit, and agricultural commodity prices, amongothers, have been shown to be important drivers of forest clearing activity (Cropper andGri�ths, 1994; Panayotou and Sungsuwan, 1994; Andersen, 1996; Barbier and Burgess,1996; Chomitz and Gray, 1996; Cropper et al., 1997; Angelsen and Kaimowitz, 1999;Pfa�, 1999; Barbier and Burgess, 2001; Ferraz, 2001; Pfa� et al., 2007; Chomitz andThomas, 2003; Araujo et al., 2009). More recent works have looked speci�cally at the2000s Amazon slowdown, aiming at disentangling the leading causes of the decrease indeforestation (Hargrave and Kis-Katos, 2013; Assunção et al., 2013b,a; Assunção andRocha, 2014; Assunção et al., 2015a,b).
We contribute to this literature by showing the impact of policies that could createincentives for deforestation, such as the creation of new settlements, and partially o�setthe impact of conservation policies. We also investigate the heterogeneous e�ects of RuralSettlements on deforestation. First, we separate the impact of Rural Settlements, by typeof settlement. Second, we investigate heterogeneous e�ects depending on the location ofthe settlement.
We use a georreferenced dataset publicized by the National Institute of Colonizationand Agrarian Reform (INCRA) with the area occupied by Rural Settlements, bysettlement type. We merge this dataset with municipality deforestation data obtainedfrom processed satellite imagery that was made publicly available by the NationalInstitute for Space Research (INPE).
We then use a di�erence-in-di�erence approach to calculate the impact of the shareof municipality area covered by settlements on deforestation. We control for municipalityand time-�xed e�ects, and other variables which could a�ect deforestation.
We show that the share of municipality covered by settlements positively a�ectsdeforestation. Quantitatively, using our preferred speci�cation, Rural Settlements areresponsible for 30% of 2014's total deforestation in the Amazon Biome.
To try to understand the mechanism of the e�ect of Rural Settlements on deforestationwe calculate some heterogeneous e�ects. There are four types of Rural Settlements. TheColonization Rural Settlements (the old ones, with no variation in our sample period), theconventional Rural Settlements (the more common, managed by INCRA, a federal agencythat takes care of property rights in Brazil), State and Municipal Rural Settlements,and Special Rural Settlements, which are the ones with some environmental condition.(These are designed to serve families who wish to work with more sustainable productiontechniques, such as using fewer or no pesticides, or with more sustainable extractiveactivities, such as sustainable forestry projects).
We �nd that Special Rural Settlements do have a positive and signi�cant e�ect ondeforestation. Yet, the location of these settlements were very concentrated in areas withvery high forest coverage and a low rate of deforestation. The idea is that even with the
4
use of sustainable practices, these settlements cause some deforestation. As these areashad no deforestation before, we identify some increase in deforestation rates in thesemunicipalities. Special Settlements are responsible for 15% of 2014's total deforestationin the Amazon Biome.
Conventional settlements also have a positive but statistically non-signi�cant e�ect ondeforestation. This may be because the increase of this type of settlement between 2002and 2014 was lower than the increase of special settlements, which implies less statisticalpower to measure the e�ect, as we are controlling for �xed e�ects.
When running OLS estimates we also �nd that conventional settlements andcolonization settlements have higher positive correlation with deforestation. But thiscorrelation is completely spurious. These settlements were located in places wheredeforestation is higher today, but not necessarily, because they were there. Whencontrolling for �xed e�ect both types of settlements become statistically non-signi�cantto explain deforestation.
Therefore, Rural Settlements are causing part of deforestation in the Amazon, as havebeen claimed by literature. Our paper, however, takes a step forward and measures thee�ect of Rural Settlements on deforestation controlling for many other e�ects. WhileAlencar et al. (2016) shows that deforestation within Rural Settlements represents 30%of Amazon deforestation, they were not taking into account that those areas could bedeforested even without any Rural Settlement presence. In other words, they werenot isolating the e�ect of Rural Settlements. Yet, part of deforestation outside RuralSettlements could be caused by the settlers.
Our calculation di�ers from the Alencar et al. (2016) one in two aspects: �rst, wemeasure the impact of Rural Settlements on deforestation in the Amazon within oroutside Rural Settlements; second, we also isolate the impact of Rural Settlements ondeforestation from the impact of other factors on deforestation.
The rest of this paper is organized as follows: Section 2 provides a detailed descriptionof the data used in the paper; Section 3 explains the empirical strategy used to calculatethe impact of priority municipalities on deforestation; Section 4 discusses the results ofthe paper; and Section 5 addresses the conclusions and policy implications of our results.
2. Data, Descriptive Statistics, and Stylized Facts
This section introduces the data used in this paper, presents descriptive statistics,and discusses stylized facts to characterize aggregate trends for our variables of interest.
2.1. Deforestation
Data on deforestation is built from satellite-based images that are processed atthe municipality level and publicly released by PRODES/INPE. Because PRODESdata is reported annually, we �rst convert our municipality-by-month settlement panelinto a municipality-by-year settlement panel. We de�ne deforestation as the annualdeforestation increment, that is, the area in square kilometers of forest cleared over thetwelve months leading up to August of a given year.1
1More precisely, the annual deforestation increment of year t measures the area in square kilometersdeforested between the 1st of August of t− 1 and the 31st of July of t.
5

For any given municipality, cloud coverage during the period of remote sensing maycompromise the accuracy of satellite images, requiring images to be produced at a di�erenttime. As a result, image records for di�erent years may span from less to more than twelvemonths. To control for measurement error, variables indicating unobservable areas areincluded in all regressions. This data is also publicly available at the municipality-by-yearlevel from 2002 to 2014 from PRODES/INPE.
To smooth the cross-sectional variation in deforestation that arises from municipalitysize heterogeneity, we use a normalized measure of the annual deforestation increment.The normalization ensures that our analysis considers relative variations in deforestationincrements within municipalities. The variable is constructed by dividing thedeforestation increment variable by the size of municipality.
2.2. Rural Settlements and Deforestation
We use data on settlements compiled by the National Institute of Colonization andAgrarian Reform (INCRA), with information about the area occupied by the settlements,by type of settlement. We use this information to calculate the total area of settlementby municipality and build the panel municipality-year from 2002 to 2014.2.
To make fair comparisons we consider only Rural Settlements located in the AmazonBiome. Brazil has deforestation data also from municipalities outside of the AmazonBiome but within a geopolitical region called Legal Amazon. However, municipalitiesoutside the Amazon Biome have very di�erent vegetation from municipalities within theAmazon Biome and deforestation problems are concentrated on the Amazon Biome. Asmost part of the new settlements were created within the Amazon Biome, we keep onlymunicipalities in this region.
Deforestation rates have declined in the Amazon since 2004 and the area occupied byRural Settlements has increased. Figure 1 presents the evolution of both deforestationand Rural Settlements in the Amazon Biome from 2002 to 2014. Notice that deforestationwas 25 thousand square kilometres in 2002 and decreased to around 5 thousand squarekilometres in 2014. At the same time, the area occupied by Rural Settlements increasedfrom 220 thousand square kilometres in 2002 to 376 thousand square kilometres in 2014.Despite the opposite direction of the evolution of these two variables, it is important toverify whether regions where deforestation declined by less were also regions where RuralSettlements increased by more. We do that in the regressions, testing what happenedwith deforestation rates in municipalities where rural settlements increased more.
We also present in Figure 2 maps that show the evolution of Rural Settlements overthe forest coverage in the Amazon in 2002 and 2011 by settlement type. We presentin the �gure only the types with some variation. The area of Colonization Settlementsbecome stable, and then, we keep them out of the �gure. The green area of the map isthe forest coverage. The visual evidence is very impressive for Special Settlements. It ispossible to notice that the area of these settlement types (in red) increases mainly overthe area covered by native forest (in green) between 2002 and 2011. For conventionalsettlements the increase in the area is less visible, and it was more uniformly distributedamong municipalities with low and high forest coverage.
2we have data on settlements from 1970 to 2015, but we use in the main calculations only from 2002 to2014, which are the years we also have deforestation data
6
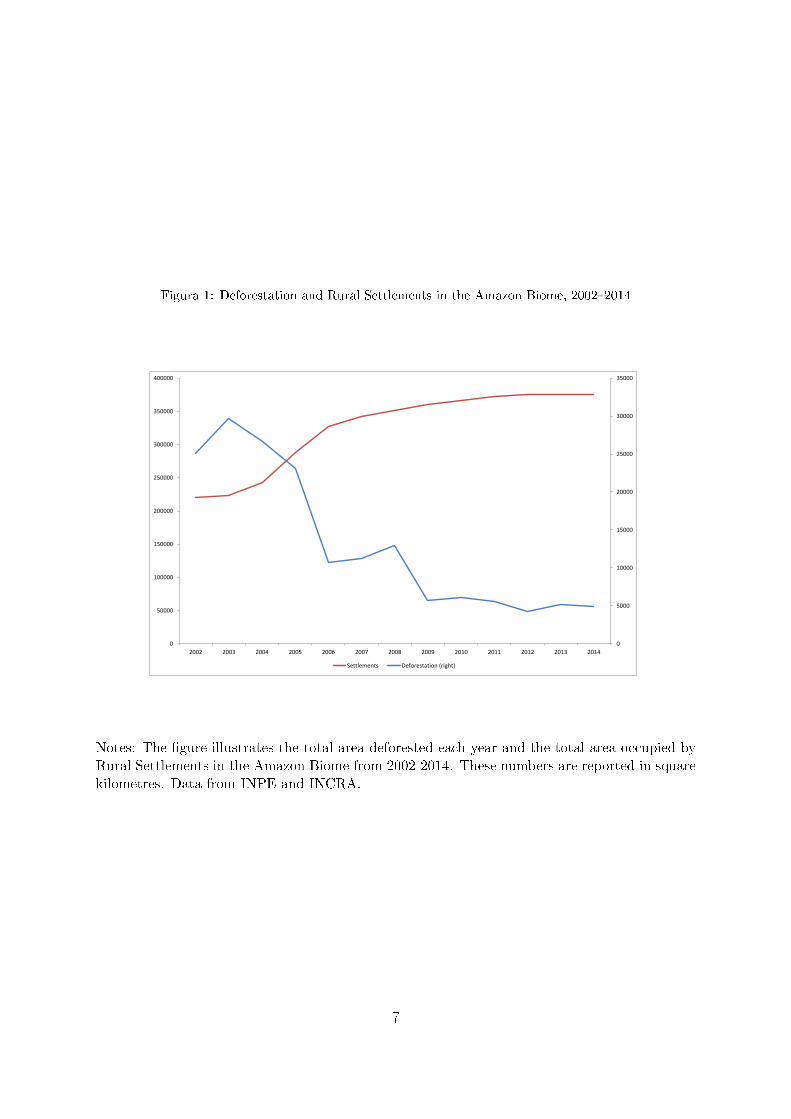
Figura 1: Deforestation and Rural Settlements in the Amazon Biome, 2002�2014
0
5000
10000
15000
20000
25000
30000
35000
0
50000
100000
150000
200000
250000
300000
350000
400000
2002 2003 2004 2005 2006 2007 2008 2009 2010 2011 2012 2013 2014
Settlements Deforestation (right)
Notes: The �gure illustrates the total area deforested each year and the total area occupied by
Rural Settlements in the Amazon Biome from 2002-2014. These numbers are reported in square
kilometres. Data from INPE and INCRA.
7

Figura 2: Settlement Area in the Amazon
(a) Special Settlements 2002 (b) Special Settlements 2011
(c) Conventional Settlements 2002 (d) Conventional Settlements 2011
(e) State and Municipal Settlements 2002 (f) State and Municipal Settlements 2011
Notes: The �gure illustrates the evolution of settlements by type in relation to the forest coverage
in the legal Amazon between 2002 and 2011.
Source: INCRA.
8

In summary, the data presented shows that most of INCRA and states and municipalRural Settlements created in the 2000s were placed in areas highly covered by rainforests,in opposition to INCRA claims. As the usual economic activities of producers inthese settlement projects are agricultural activities (usually planted crops and livestock),deforesting part of the land is inherent to their activities and, therefore, more thanexpected. At the same time, these areas are far from the agricultural expansion frontier,which could mitigate the impact of the creation of settlements on deforestation.
In the next sections we present evidence that, in fact, INCRA settlements as a wholehave had impact on deforestation. When we divide the impact by settlements types, theSpecial Settlements types have had a positive impact on deforestation, while the impactof the other types are statistically non-signi�cant.
2.3. Prices and Other Policies
Agricultural prices are endogenous to local agricultural production. Thus, to controlfor �uctuations pressuring deforestation at the municipality level, we must constructoutput price series that capture exogenous variations in the demand for agriculturalcommodities produced locally. As argued in Assunção et al. (2015a), agriculturalcommodity prices recorded in the southern Brazilian state of Paraná are highly correlatedwith average local crop prices calculated for the Legal Amazon sample municipalities.Hence, we use the Paraná agricultural commodity price series weighted by the relativeimportance of each product for each municipality production dataset as exogenousindicators of local market conditions within our empirical context.
We also use data with information about other conservation policies put into practiceby the Federal Government in the studied period. First, we use the informationabout the Priority Municipalities. In 2008, the Federal Government created a list ofmunicipalities in priority need of prevention and combat to deforestation, named PriorityMunicipalities. Secondly, we use data from IBAMA with information about the numberof areas embargoed by IBAMA in each municipality. We use, then, the total numberof embargoes in each municipality as a measure of the intensity of monitoring and lawenforcement at the municipality level.
These embargoes are often accompanied by other sanctioning instruments, such asseizure and destruction of production goods, tools and materials, and �nes. Becausepanel data for the use of these instruments are not available, we use the number ofembargoes as a proxy for command and control e�orts as a whole. Essentially, we areinterested in exploring embargoes as a means of capturing the e�ect of environmentalpolice (IBAMA) presence, not of the sanctioning instrument itself on deforestation.
To maintain consistency across our panel data, we consider the PRODES year �August 1st, t− 1 through July 31st, t � as the relevant unit of time in our sample. Thus,for each municipality, the total number of embargoes in a given year captures all �nesapplied in that municipality in the twelve months leading up to August of that year. Weuse, then, the lag of the number of embargoes to avoid endogeneity problems. We haveinformation on the lag of embargoes from 2002 to 2014.
3. Empirical Strategy
In this section we discuss the empirical strategy used in this paper to identify thee�ect of Rural Settlements on deforestation. In the Subsection 3.1 we discuss the main
9

strategy used. In Subsection 3.2 we discuss the econometric problems with our estimationand possible solutions for them.
3.1. Main Strategy
The challenge faced in this paper is how to adequately measure the impact of RuralSettlements on deforestation. We have the percentage of the municipality territorycovered by settlements and the percentage of municipality territory deforested each year,from 2002 to 2014. We, then, use this information to run a di�erence-in-di�erenceapproach with municipality and year �xed-e�ects to get the impact of settlement ondeforestation.
The strategy has several drawbacks. First, there are many other variables that coulda�ect the location of Rural Settlements and deforestation at the same time. For example,many policies created by the Ministry of Environment were active in the Amazon in thestudied period. These policies could also a�ect both the location of Rural Settlementsand deforestation at the same time.
Second, another possible problem may be the relationship between agricultural pricesand Rural Settlements. It is well known that agricultural prices a�ect deforestation(Assunção et al., 2015a). It is also possible that the way in which prices have a�ectedlocal production impacts the choice for Rural Settlements location. For example, farmerscould choose locations that are good for planting products if the price is high at themoment of settlement establishment.
Finally, our dependent variable is measured with some error because there are someyears that the satellite cannot see the whole Amazon territory and because there aresome parts of the area covered by clouds.
Fortunately, we have data information and some strategies that allow us to deal withsome of these challenges. First, we have data about other environmental policies, suchas the priority status of each municipality, the number of embargoes per municipality,and the share of municipality territory covered by protected areas. Second, we haveinformation on prices. As explained in Section 2.3 we have information about howcommodity prices a�ect each municipality. Therefore, we can control for price variationand get the impact of Rural Settlements on deforestation orthogonal to price variation.Finally, we also have information on the parts of the Amazon that are not observed bythe satellite. Then, we can control for this to mitigate the measurement error.
However, even controlling for these variables, we still have some concerns aboutthe exogeneity of the variable. There are many unobservable or even only partiallyobserved characteristics of the locations that could a�ect both the establishment of RuralSettlements and deforestation at the same time. For example, the extension of pavedroads (Cropper et al., 1997), the intensity of other policies, the quality of the soil forcrop production, and the quality of soil for raising cattle. Also, there are some factorsthat a�ect deforestation in all municipalities at the same way, and we could confound thee�ect of these factors with the e�ect of rural settlements on deforestation. We deal withthese problems in three ways.
First, we control for municipality and year �xed e�ects. Controlling for year �xede�ect, we ensure that we are getting the e�ect isolated from macroeconomic and socialchanges. Controlling for municipality �xed e�ects, we solve the problem of the �xedunobservable variables that are a�ecting Rural Settlements and deforestation, i.e. we
10

ensure that at least the unobservable variables that are not changing with time are notalso driving our results.
Therefore, our strategy is based in the following equation:
Deforestit = αi + φt + β1Settlementsit + β2Pricesit + β3Climateit + εit (1)
where Deforestit is the share of municipality territory deforested in municipality i andyear t. Our variable of interest, Settlementsit, is the share of municipality territory icovered by Rural Settlements in year t.
The term αi represents municipality �xed e�ects, which absorb initial conditions andpersistent municipality characteristics, such as geography and transport infrastructure.The term φt represents year �xed e�ects to control for common time trends, such asseasonal �uctuations in agricultural activity, macroeconomic conditions, common ruralpolicies, and the political cycle. The term Pricesit proxies for municipality-speci�cdemand for credit, as it includes annual cattle and crop price indices (current and lagged)varying over time at the municipality level. Finally, the term Climateit controls forclimate variables, such as rain and temperature. In all speci�cations, standard errors arerobust to arbitrary forms of heteroscedasticity and are clustered at the municipality levelto allow for correlation at a given time, as well as across time within municipalities.
3.2. Econometric Issues
In the last subsection we explain how we deal with the unobservable problems relatedto omitted variables that are �xed in time. In this section we explain how we mitigatethe problems related to omitted variables that vary with time. This problem is moredi�cult to address.
In Section 2.2 we show that the area covered by Rural Settlements has increasedmore in areas where the territory is highly covered by native forests. Therefore, thereis an endogeneity source in our estimation. For example, municipalities highly coveredby native forests could have di�erent deforestation trends compared with municipalitieswith little forest coverage. Then, our Rural Settlement coe�cient could be biased bythe fact that the areas where Rural Settlements have been placed are also areas inwhich deforestation is expected to increase more, even without the Rural Settlementsestablishment.
Also, the impact of Rural Settlements on deforestation may be heterogeneous. It ispossible that Rural Settlements in the agricultural frontier region impact deforestationdi�erently from Rural Settlements in the middle of the Amazon, which are far from urbanmarkets, for example.
We deal with these issues by completing several robustness exercises and also byallowing impact heterogeneity. First, we run the same regression as in equation 1, butnow we control for an interaction between the share of municipality covered by rainforestin 2002 and a time trend. This means that we are controlling for a time trend whichdepends on the initial levels of native forests in municipalities in our sample. Second wedo the same exercise controlling for a time trend that depends on the initial levels of themunicipality annual deforestation in 2002. The �rst measure is a stock measure: it ispossible that the deforestation trend in municipalities with highest percentage of territory
11
already deforested is di�erent from the trend in municipalities that was not deforestedtoo much. The second measure is a �ow measure: deforestation trends in municipalitieswhere economic activities have been intense with high deforestation rates in 2002 couldbe di�erent from deforestation trends in municipalities where deforestation rates werelow in 2002. Controlling for these interactions of deforestation measures with time trendsensures that our results have not been driven by these di�erent trends.
Also, to ensure that we are not getting the e�ect of any other omitted variable we runplacebo tests including leads and lags of the share of municipality covered by settlements.The leads and lags have di�erent interpretation. If the lags of this share is statisticallysigni�cant, this means that the impact of an increase in the settlements area in somemunicipality is lasting more than one year, i.e. the increase in settlements area a�ectsdeforestation in the year of the increase, and also in the following years. In the case ofthe leads, the exercise works as a placebo test. The leads of the share of municipalitycovered by settlements should not impact deforestation. Unless the case in which farmersare clearing the area before invade the land, increasing they chance to get the land titleaccording to Brazilian rules. However, preliminary analysis in descriptive statistics showsthat settlements have been created in areas with a lot of forest and few deforestation, notthe opposite. In any case, if the leads are statistically signi�cant, this means that eitherwe have an endogeneity problem in our estimation or farmers have deforested the areabefore settlements creation.
To calculate the heterogeneity of the impact, we also run the main regressionconsidering alternative samples. First we keep only municipalities within a distance of200, 300, and 400 kilometres from the Amazon Biome border, which is the area knownas deforestation arc, or the agricultural expansion frontier. That means, we keep onlymunicipalities near to agricultural expansion frontier. Second, we also do the opposite,and keep only municipalities far from the agricultural expansion frontier. In this case,we keep only municipalities with a minimum distance of 200 kilometres from the Biomeborder.
These tests with alternative samples serve also as robustness checks. Our results mayhave been driven by the fact that Rural Settlements increased more in municipalitieswhere deforestation was always very small in our sample. When comparing thismunicipalities with other municipalities where deforestation was always very high wecould be comparing apples with oranges. Then, restrict our samples could help us tocompare similar municipalities, some of them with high increase of Rural Settlementscoverage and some of them with low increase in Rural Settlements coverage.
Finally, the impact is also probably di�erent depending on the type of RuralSettlements. "Conventional Rural Settlements"are di�erent from "Special RuralSettlements,"which are also di�erent from "State and Municipal Rural Settlements."Wepresent estimation separating the e�ect of each type of Rural Settlement on deforestation.
4. Results
This section describes the estimation of the impact of Rural Settlements ondeforestation. The �rst part of the section discusses the main estimation, the second partthe robustness exercises, and the third part separates the analysis by type of settlementsand discusses heterogeneous e�ects.
12

Tabela 1: Deforestation and Rural Settlements, by type, 2002-2014, in km2
State and AmazonColonization Conventional Special Municipal Biome
Deforestation Settlements Settlements Settlements Settlements Settlements Area2002 25136 220503 37774 156737 23504 2488 45156962003 29626 223286 37774 159326 23697 2490 45156962004 26682 242342 37774 163615 38461 2492 45156962005 23095 288304 37774 175911 72030 2589 45156962006 10716 327644 37774 186963 99752 3154 45156962007 11263 341795 37774 189166 111701 3154 45156962008 12888 351746 37774 190128 120689 3154 45156962009 5662 360572 37774 190902 127871 4025 45156962010 6103 366108 37774 191330 131581 5423 45156962011 5608 373070 37774 191580 138248 5467 45156962012 4247 374933 37774 192340 139352 5467 45156962013 5222 375873 37774 192679 139952 5467 45156962014 4970 376045 37774 192813 139991 5467 4515696
Notes: The table describes the evolution of deforestation and the evolution of Rural Settlements (total and by
type), from 2002 to 2014 in square kilometres. Data from INPE and INCRA.
4.1. The Impact of Rural Settlements on Deforestation
Rural Settlements are expected to have a positive relationship with deforestation. InSection 2 we show that Rural Settlements were created in municipalities with a highershare of territory covered by native forests. Then, when the settlement is created, wesuppose farmers deforesting part of their land for agricultural production (crop plantation,cattle activities, or both) and forestry activities.
We start our analysis by presenting the numbers of the evolution of Rural Settlementsby type and by repeating the numbers of settlements and deforestation in Table 1. It ispossible to see that the area of special settlements increased more relative to the othersettlement types. We also use these numbers to interpret quantitatively the coe�cient ofour regressions in the following tables.
Table 2 presents the results of the estimation of Equation 1. Column 1 shows theresults of the regression of deforestation on Rural Settlements by OLS, controlling onlyfor time �xed e�ect. In Column 2, we control for municipality �xed e�ects. In Column 3,we also control for prices and policies. In Column 4, we add an interaction of time trendswith initial forest coverage and with initial annual deforestation. In Column 5, we testthe e�ects of the lead and the lag of Rural Settlement variable
Initial analysis of Columns 1, 2, and 3 point to a positive relationship betweenRural Settlements and deforestation. In Column 1 we run an OLS regression. Thepositive coe�cient means that municipalities where the presence of Rural Settlementsis higher are also municipalities with higher deforestation rates. However, when wecontrol for municipality �xed e�ects, the coe�cient is even higher. This means thatmunicipalities where the area of Rural Settlements increased more were also the areaswhere deforestation increased more during our sample period. In Column 3 we controlfor prices and policies and the coe�cient decreases but remains positive and statisticallysigni�cant.
However, we did not account for the possible endogeneity problem yet. Could
13

Tabela 2: Impact of Rural Settlements on Deforestation
(1) (2) (3) (4) (5)Fixed Prices and Lead
VARIABLES OLS E�ect Policies Trends and Lag
Settlements 0.0056 0.0107 0.0080 0.0040 0.0020(0.0012)*** (0.0031)*** (0.0030)*** (0.0022)* (0.0046)
Settlements in t-1 0.0059(0.0020)***
Settlements in t+1 -0.0047(0.0065)
Observations 7,059 7,059 7,059 7,059 7,059Year FE Yes Yes Yes Yes YesMunicipality FE No No No No NoPrices and Policies No No No No NoTrends No No No Yes YesNumber of municipalities 543 543 543 543
Notes: Dependent variable is the share of municipality deforested, by municipality-year. In Column 1,
we run OLS regression, controlling only for time �xed e�ect. In Column 2, we control for municipality
�xed e�ect. In Column 3, we control for prices and policies. In Column 4, we add an interaction of
time trends with initial forest coverage and with initial annual deforestation. In Column 5, we test the
e�ects of the lead and the lag of Rural Settlement variable. Signi�cance: *** p<0.01, ** p<0.05, *
p<0.1.
deforestation in these municipalities be higher even if Rural Settlements were not there?We attempt to answer this question by analyzing columns 4 and 5. We showed inSection 2 data that most of the new Rural Settlements created between 2002 and 2011were located in municipalities where forest coverage was very high and deforestationwas very low in 2002. Therefore, these municipalities could have trends very di�erentfrom municipalities with low forest coverage and high deforestation rates. For example,conservation policies against deforestation targeted places with high deforestation rates.Therefore, municipalities with lower deforestation rates in 2002 could being reducing lessdeforestation because they were not targeted by policy as much as municipalities withhigher deforestation rates that year.
To deal with these problems we run the same regressions, but now we control fortwo kind of trends. First, we include a time trend interacted with the initial level offorest coverage. The idea here is that municipalities with higher initial levels of forestcoverage would reduce deforestation by less than municipalities with lower levels of forestcoverage. Second, we control for a time trend interacted with initial levels of annualdeforestation. The idea here is that municipalities with high deforestation rates mayreduce more deforestation than municipalities with low deforestation rates, especially ina period where policies become tougher and commodity prices become less attractive.Because the increase in Rural Settlements was concentrated in these areas (with highinitial forest coverage and high initial annual deforestation), we may be confounding thee�ect of these trends with the e�ect of Rural Settlements.
Our preferred speci�cation then is, in Column 4, where we control for municipality�xed e�ects, for prices, policies, and the trends. The coe�cient remains positive andstatistically signi�cant. Quantitatively, an increase of 1 p.p. in the municipality territorycovered by Rural Settlements increases 0.004 p.p. in the share of municipality territory
14

annual deforested. In other words, considering that Rural Settlements occupied 8.32% ofAmazon Biome in 2014, our results mean that Rural Settlements are responsible for 30%of deforestation in the Amazon Biome in 2014.
We interpret these results as a sign that Rural Settlements are causing deforestation.In the next section we separate the e�ect of each kind of Rural Settlement on deforestationand shed light on what is happening in previous table.
4.2. Di�erent Rural Settlement Types
In this section we measure the e�ect of each kind of Rural Settlement on deforestation.In the last section we showed that Rural Settlements have a positive e�ect ondeforestation. In this subsection we investigate which type of Rural Settlement is causingmore deforestation. It is possible that some types of Rural Settlements have an e�ect ondeforestation and other types do not. In this section we investigate this possibility.
Table 3 presents regressions analyzing this question. In Column 1 we run deforestationon types of Rural Settlements by OLS, controlling for time �xed e�ect as in previoustable, but not controlling for municipality �xed e�ect. The results are as expected. The"old"Rural Settlements, that means, the types of Rural Settlements more frequently inthe past (Colonization and Conventional Rural Settlements), have positive correlationwith deforestation. Municipalities in the frontier of agricultural expansion with highdeforestation rates are the municipalities where these two types of Rural Settlementsoccupy a higher area. The "new"Rural Settlements, which means the Rural Settlementsthat become more frequently established more recently, such as special settlements, havea negative correlation with deforestation. This means they were created in municipalitieswith lower deforestation rates, although the coe�cient is not signi�cant.
In Column 2, we control for municipality �xed e�ect. The results change completely.In this case, we cannot have the coe�cient of Colonization Settlements because therewas no variation of this type of settlement during our sample period. The coe�cientof Conventional Rural Settlements is not signi�cant anymore. We interpret this resultin the following way. Usually, the literature has pointed to a correlation between RuralSettlements and deforestation; our results show that, considering the old types of RuralSettlements (Colonization and Conventional), this relationship is really only a correlation.There is more deforestation in areas where these Rural Settlements are placed onlybecause they were placed in areas that today are on the agricultural expansion frontier.When controlling for �xed e�ects, we show that the increase in conventional RuralSettlements has no signi�cant e�ect on deforestation.
However, the coe�cients on special Rural Settlements are positive and signi�cant.That means municipalities where the area covered by these Rural Settlements increasedwere also the municipalities where deforestation increased more (or decreased less). Toensure that we are not attributing the e�ect of other factors to settlements, we againcontrol for prices and policies (column 3), and for trends depending on initial forestcoverage and on initial annual deforestation (Column 4). The results in Column 4 aresimilar to the results in Column 2.
Quantitatively interpreting this coe�cient, we can say that only the SpecialSettlements are responsible for 15% of deforestation in the Amazon Biome in 2014.
As a robustness check, we also test if our result is coming from some SpecialSettlements deforestation pre-trend. It is possible that deforestation was already
15

Tabela 3: The Impact of Rural Settlments, by type
(1) (2) (3) (4) (5)Fixed Prices and Lead
VARIABLES OLS E�ect Policies Trends and Lag
Special Settlements -0.0012 0.0147 0.0110 0.0056 0.0014(0.0011) (0.0027)*** (0.0025)*** (0.0021)*** (0.0023)
Special Settlements in t-1 0.0026(0.0015)*
Special Settlements in t+1 0.0022(0.0030)
Conventional Settlements 0.0101 0.0006 0.0003 0.0004 0.0004(0.0020)*** (0.0061) (0.0062) (0.0038) (0.0038)
State and Municipal Settlements -0.0057 0.0108 0.0094 -0.0002 -0.0003(0.0059) (0.0204) (0.0204) (0.0217) (0.0217)
Colonization Settlements 0.0031(0.0015)**
Observations 7,059 7,059 7,059 7,059 7,059Year FE Yes Yes Yes Yes YesMunicipality FE No Yes Yes Yes NoPrices and Policies No No Yes Yes NoTrends No No No Yes YesTrends No No No Yes YesNumber of municipalities 543 543 543 543
Notes: Dependent variable is the share of municipality deforested, by municipality-year. In this case, the
regressors are the share of municipality occupied by Rural Settlements, by type. In Column 1, we run OLS
regression, controlling only for time �xed e�ect. In Column 2, we control for municipality �xed e�ect. In
Column 3, we control for prices and policies. In Column 4, we add an interaction of time trends with initial
forest coverage and with initial annual deforestation. In Column 5, we test the e�ects of the lead and the lag
of a special Rural Settlement variable. Signi�cance: *** p<0.01, ** p<0.05, * p<0.1.
increasing (or decreasing less) in municipalities where special settlements have beencreated. Then, we run the same regression as in Column 4, adding a lead and a lagof the share of municipality territory covered by special settlements. The results arepresented in Column 5. It's possible to see that the variable representing the lead ofspecial settlements coverage is not signi�cant to explain deforestation. That means,there is no pre-trends explaining the coe�cient of special settlements. At the same time,when including a lead and a lag of Special Settlements, is possible to see that they onlyhave some e�ect on deforestation one year after their creation.
Summarizing, the only type of Rural Settlements in which the e�ect on deforestationsurvives the robustness checks is the Special Settlements, which are settlements with afocus on some environmental condition. The result is a puzzle. What is the mechanismbehind these results? How could Rural Settlements with environmental conditions be theonly type to have an e�ect on deforestation?
Table 4 helps to shed light on this question. To test the heterogeneity of the e�ectwe restrict our sample in four ways to try to understand what is really happening withdeforestation rates in places where Rural Settlements have increased. In Columns 1 and2 we restrict our sample to the region closest to the Amazon Biome border. This regionis the one known as the deforestation arc, the agricultural expansion frontier. In Column1 we keep only municipalities within 200 kilometres of distance to the Biome border andin Column 2 we keep municipalities within 300 kilometres of distance to the AmazonBiome border. In Columns 3 and 4 we do the opposite. In Column 3 we keep onlymunicipalities with a distance higher than 200 kilometres to the Biome Border, and in
16
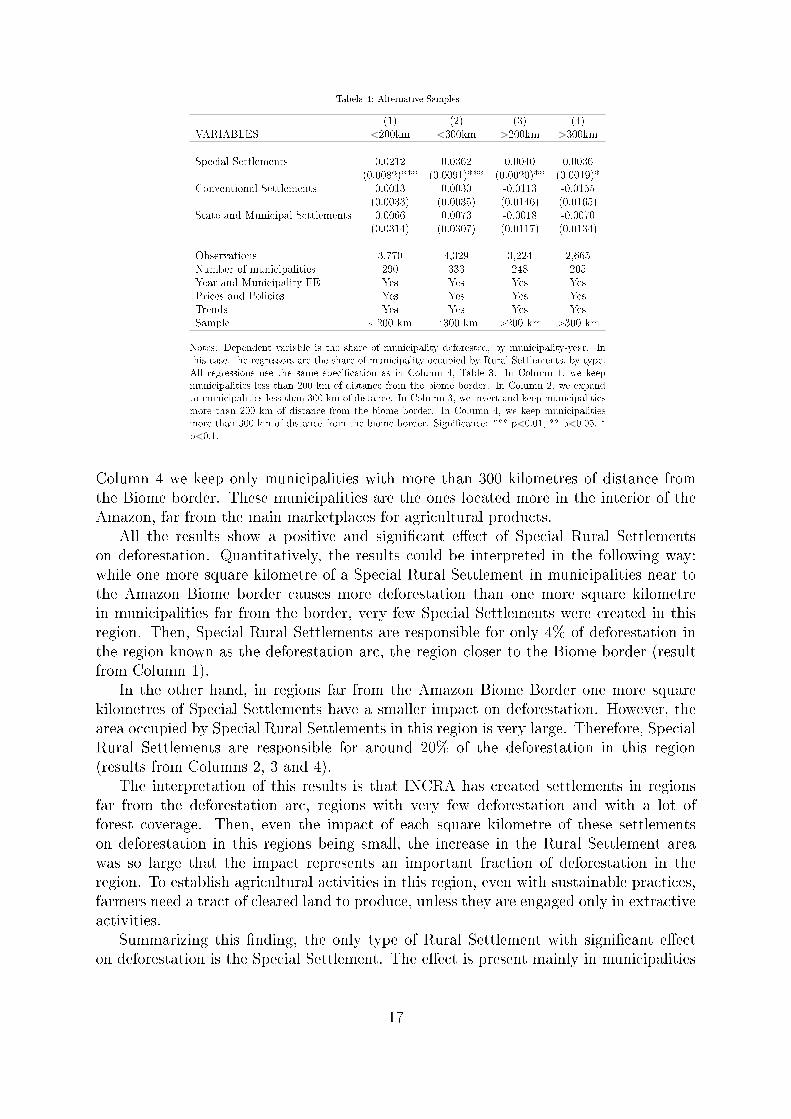
Tabela 4: Alternative Samples
(1) (2) (3) (4)VARIABLES <200km <300km >200km >300km
Special Settlements 0.0212 0.0362 0.0040 0.0036(0.0082)*** (0.0091)*** (0.0020)** (0.0019)*
Conventional Settlements 0.0013 0.0030 -0.0113 -0.0155(0.0033) (0.0035) (0.0146) (0.0165)
State and Municipal Settlements 0.0066 0.0073 -0.0018 -0.0070(0.0314) (0.0307) (0.0117) (0.0134)
Observations 3,770 4,329 3,224 2,665Number of municipalities 290 333 248 205Year and Municipality FE Yes Yes Yes YesPrices and Policies Yes Yes Yes YesTrends Yes Yes Yes YesSample <200 km <300 km >200 km >300 km
Notes: Dependent variable is the share of municipality deforested, by municipality-year. In
this case, the regressors are the share of municipality occupied by Rural Settlements, by type.
All regressions use the same speci�cation as in Column 4, Table 3. In Column 1, we keep
municipalities less than 200 km of distance from the biome border. In Column 2, we expand
to municipalities less than 300 km of distance. In Column 3, we invert and keep municipalities
more than 200 km of distance from the biome border. In Column 4, we keep municipalities
more than 300 km of distance from the biome border. Signi�cance: *** p<0.01, ** p<0.05, *
p<0.1.
Column 4 we keep only municipalities with more than 300 kilometres of distance fromthe Biome border. These municipalities are the ones located more in the interior of theAmazon, far from the main marketplaces for agricultural products.
All the results show a positive and signi�cant e�ect of Special Rural Settlementson deforestation. Quantitatively, the results could be interpreted in the following way:while one more square kilometre of a Special Rural Settlement in municipalities near tothe Amazon Biome border causes more deforestation than one more square kilometrein municipalities far from the border, very few Special Settlements were created in thisregion. Then, Special Rural Settlements are responsible for only 4% of deforestation inthe region known as the deforestation arc, the region closer to the Biome border (resultfrom Column 1).
In the other hand, in regions far from the Amazon Biome Border one more squarekilometres of Special Settlements have a smaller impact on deforestation. However, thearea occupied by Special Rural Settlements in this region is very large. Therefore, SpecialRural Settlements are responsible for around 20% of the deforestation in this region(results from Columns 2, 3 and 4).
The interpretation of this results is that INCRA has created settlements in regionsfar from the deforestation arc, regions with very few deforestation and with a lot offorest coverage. Then, even the impact of each square kilometre of these settlementson deforestation in this regions being small, the increase in the Rural Settlement areawas so large that the impact represents an important fraction of deforestation in theregion. To establish agricultural activities in this region, even with sustainable practices,farmers need a tract of cleared land to produce, unless they are engaged only in extractiveactivities.
Summarizing this �nding, the only type of Rural Settlement with signi�cant e�ecton deforestation is the Special Settlement. The e�ect is present mainly in municipalities
17

far from the marketplaces and the agricultural expansion frontier. Traditional RuralSettlements (Conventional Settlements and state and municipal Rural Settlements) seemto have no e�ect on deforestation. The correlation that the literature has identi�edbetween conventional settlements and deforestation seems to be related to omittedvariables that a�ect deforestation and also the creation of these Rural Settlements.However, we �nd an important e�ect of Special Rural settlements on deforestation.Quantitatively, we �nd that the whole set of Rural Settlements are responsible for 30%of deforestation on the Amazon Biome, a number very closed to the number found bythe literature.
5. Conclusion
The new composition of deforestation in the Amazon, with a higher relativeparticipation of small-scale deforested polygons, has concerned environmental specialistsand policy makers. Policies that a�ect these small-scale farmers and related institutionshave, therefore, been an important issue under consideration by policy makers andresearchers.
Since the 1970s, Rural Settlements with state assistance have been one of the severalstrategies of the Federal Government in Brazil to colonize remote regions with lowpopulation. However, it was between 2002 and 2014 that the greatest increase inRural Settlements area occurs in the Amazon region, jumping from 220 thousand squarekilometres in 2002 to 376 thousand square kilometres in 2014, an increase of 70
This paper shows that most part of this increase in Rural Settlements area in theAmazon Region was located in remote areas with low population, such as the state ofAmazonas, and in municipalities with high forest coverage. Yet, usually, the settlementswere created in municipalities where conservation e�orts have not arrived, possiblybecause they are municipalities with few deforestation activities.
The paper also shows that the newly created Rural Settlements had a positive andstatistically signi�cant e�ect on deforestation. Quantitatively, we present evidence thatRural Settlements are responsible for 30% of current deforestation in the Amazon Biome.However, separating the e�ect by settlement type, the Special Settlement, which is a typeof settlement with some environmental condition was the only type with a positive andsigni�cant e�ect on deforestation.
In light of this, our analysis has important implications for the design of public policyin Brazil. It has shown that the new set of Rural Settlements created between 2002 and2014 has an important impact on deforestation, and our analysis isolated this impactfrom other variables to show that the Special Settlements possibly a�ect deforestationthe most.
References
Aldrich, S. P., Walker, R. T., Arima, E. Y., Caldas, M. M., Browder, J. O., and Perz, S. (2006).Land-Cover and Land-Use Change in the Brazilian Amazon: Smallholders, Ranchers, and FrontierStrati�cation. Economic Geography, 82(3):265�288.
18
Alencar, A., Pereira, C., Castro, I., Cardoso, A., Souza, L., Costa, R., Bentes, A. J., Stella, O., Azevedo,A., Gomes, J., and Novaes, R. (2016). Desmatamento nos Assentamentos da Amazônia: Historico,Tendências e Oportunidades. IPAM.
Andersen, L. E. (1996). The Causes of Deforestation in the Brazilian Amazon. The Journal ofEnvironment & Development, 5(3):309�328.
Angelsen, A. and Kaimowitz, D. (1999). Rethinking the Causes of Deforestation: Lessons from EconomicModels. The World Bank Research Observer, 14(1):73�98.
Araujo, C., Bonjean, C. A., Combes, J.-L., Motel, P. C., and Reis, E. J. (2009). Property Rights andDeforestation In The Brazilian Amazon. Ecological Economics, 68(8-9):2461�2468.
Assunção, J., Gandour, C., and Rocha, R. (2013a). DETERring Deforestation in the Brazilian Amazon:Environmental Monitoring and Law Enforcement. CPI/NAPC Working Paper.
Assunção, J., Gandour, C., and Rocha, R. (2015a). Deforestation Slowdown in the Brazilian Amazon:Prices or Policies? Environment and Development Economics, forthcoming.
Assunção, J., Gandour, C., Rocha, R., and Rocha, R. (2013b). Does Credit A�ect Deforestation?Evidence from a Rural Credit Policy in the Brazilian Amazon. CPI/NAPC Working Paper.
Assunção, J. and Rocha, R. (2014). Getting Greener by Going Black: The Priority Municipalities inBrazil. CPI/NAPC Working Paper.
Assunção, J., Rocha, R., Gandour, C., and Pessoa, P. (2015b). Deforestation Scale and Farm Size: theNeed for Tailoring Policy in Brazil. Mimeo.
Barbier, E. B. and Burgess, J. C. (1996). Economic Analysis of Deforestation in Mexico. Environmentand Development Economics, 1(02).
Barbier, E. B. and Burgess, J. C. (2001). The Economics of Tropical Deforestation. Journal of EconomicSurveys, 15(3):413�433.
Binswanger, P. H. (1991). Brazilian Policies that Encourage Deforestation in the Amazon. WorldDevelopment, 19(7):821�829.
Caviglia-Harris, J. and Harris, D. (2011). The Impact of Settlement Design on Tropical DeforestationRates and Resulting Land Cover Patterns. Agricultural and Resource Economics Review.
Chomitz, K. and Thomas, T. (2003). Determinants of Land Use in Amazônia: A Fine-Scale SpatialAnalysis. American Journal of Agricultural Economics, 85(4):1016�1028.
Chomitz, K. M. and Gray, D. A. (1996). Roads, Land Use, and Deforestation: A Spatial Model Appliedto Belize. The World Bank Economic Review, 10(3):487�512.
Cropper, M. and Gri�ths, C. (1994). The Interaction of Population Growth and Environmental Quality.The American Economic Review, 84(2):250�254. Papers and Proceedings of the Hundred and SixthAnnual Meeting of the American Economic Association.
Cropper, M. L., Gri�ths, C. W., and Mani, M. (1997). Roads, Population Pressures, and Deforestationin Thailand, 1976-89. World Bank Policy Research Working Paper No. 1726.
D`Antona, A. O., VanWey, L. K., and Hayashi, C. M. (2006). Property Size and Land Cover Change inthe Brazilian Amazon. Population and Environment, 27:373�396.
de Janvry, A., Emerick, K., Gonzalez-Navarro, M., and Sadoulet, E. (2015). Delinking Land Rights fromLand Use: Certi�cation and Migration in Mexico. American Economic Review, Volume. 105, Issue10.
19
Fearnside, P. (2005). Deforestation in Brazilian Amazonia: History, Rates, and Consequences.Conservation Biology, 19(3):680�688.
Ferraz, C. (2001). Explaining Agriculture Expansion and Deforestation: Evidence from the BrazilianAmazon 1980/98. Ipea text for discussion.
Godar, J., Gardner, T. A., Tizado, E. J., and Pacheco, P. (2014). Actor-Speci�c Contributions to theDeforestation Slowdown in the Brazilian Amazon. Proceedings of the National Academy of Sciences,111(43):15591�15596.
Godar, J., Tizado, E. J., and Pokorny, B. (2012). Who is Responsible for Deforestation in theAmazon? A Spatially Explicit Analysis Along the Transamazon Highway in Brazil. Forest Ecologyand Management, 267:58�73.
Hargrave, J. and Kis-Katos, K. (2013). Economic Causes of Deforestation in the Brazilian Amazon: APanel Data Analysis for the 2000s. Environmental and Resource Economics, 54(4):471�494.
Imbernon, J. (1997). Population growth and deforestation� the case of Rondonia in the BrazilianAmazon. Technical report, Alternatives to Slash-and-Burn.
INPE (2015). Projeto PRODES - Monitoramento da Floresta Amazônica Brasileira por Satélite.Database, Instituto Nacional de Pesquisas Espaciais.
Michalski, F., Metzger, J. P., and Peres, C. A. (2010). Rural Property Size Drives Patterns of Uplandand Riparian Forest Retention in a Tropical Deforestation Frontier. Global Environmental Change,20(4):705�712.
Pacheco, P. (2012). Actor and Frontier Types in the Brazilian Amazon: Assessing Interactions andOutcomes Associated With Frontier Expansion. Geoforum, 43(4):864�874.
Panayotou, T. and Sungsuwan, S. (1994). An Econometric Analysis of the Causes of TropicalDeforestation: The Case of Northeast Thailand, chapter in: The Causes of Tropical Deforestation:The Economic and Statistical Analysis of Factors Giving Rise to the Loss of the Tropical Forests,pages 192�210. University College of London Press.
Pfa�, A. (1999). What Drives Deforestation in the Brazilian Amazon? Evidence from Satellite andSocioeconomic Data. Journal of Environmental Economics and Management, 37(1):26�43.
Pfa�, A., Robalino, J., Walker, R., Aldrich, S., Caldas, M., Reis, E., Perz, S., Bohrer, C., Arima,E., Laurance, W., and et al. (2007). Road Investments, Spatial Spillovers, and Deforestation in theBrazilian Amazon. Journal of Regional Science, 47(1):109�123.
Rudel, T., DEFRIES, R., ASNER, G. P., and LAURANCEE, W. F. (2009). Changing Drivers ofDeforestation and New Opportunities for Conservation. Conservation Biology,, 23(6):1396�1405.
Turner, M. A. (2007). A Simple Theory of Smart Growth and Sprawl. Journal of Urban Economics,61(1): 21�44.
Walker, R., Moran, E., and Anselin, L. (2000). Deforestation and Cattle Ranching in the BrazilianAmazon: External Capital and Household Processes. World Development, 28(4):683�699.
20