rural focus 3 final - gov.wales · 10 figure 1.1 the geography of wales has a great influence on...
TRANSCRIPT

A Statistical Focus on
Rural Wales
2008 Edition

1
Contents Page
Introduction 3
Chapter 1 Defining “Rural Wales” 7
Chapter 2 National Statistics classification of settlement type and context 19
Chapter 3 Rural deprivation and the Welsh Index of Multiple Deprivation 25
Chapter 4 Comparisons from the 2001 Census of Population 33
Chapter 5 Distribution of the population by age group, 2001 49
Chapter 6 Population change in Wales, 1991 to 2006 59
Annex 1 “Rural Wales” definitions and how to choose between them 71
Annex 2 Lower Super Output Areas (LSOA) 76
Annex 3 Key links and data sources 77

2

3
Introduction This is a general report that considers how we define “Rural Wales”. There is a range of feasible options that, in particular circumstances, will be more or less relevant. This report considers what the options are and how we can select between them to arrive at an appropriate definition. In particular we suggest two classifications that can be used as default starting points for general analyses.
To show these classifications in use this report also considers some general analyses of existing data sources to try and paint a picture of the differences – and similarities – between Rural Wales and the rest of Wales.
What is “rural”? Rurality is an issue with many facets. We may have rural land, rural people, rural businesses and so on. A definition that fits one of these types may not be appropriate for another. However, clearly it is useful to have some default definitions to provide a reasonable starting point. Annex 1 gives an introduction to the various ways of defining rural areas and how to choose between them.
For the purposes of this report we will look mainly at rural people. In trying to describe what rural people are like we will use two tools. Note that neither of our two default definitions uses a simplistic “urban/rural” division. The need to consider the richness of the subject is an important consideration for any definition of rurality.
The National Statistics classification of settlement type and context This classification is described in Chapter 2. For practical purposes, the best description of the categories is the map of Wales in Chapter 2. This classification is used in Chapters 3, 4 and 5. Summarising the categories in this classification for this report we use the following four groups:
• Large towns in the less sparse context. Settlements in the more densely populated areas with a population of at least 10,000 people. Includes the main settlements in the South East Wales and along the North Wales coast, Deeside and Wrexham. Haverfordwest and Milford are also large towns in the sparsest context.
• Small towns in the less sparse context. These are towns in the more densely populated areas that have less than 10,000 people. There is no simple cut off at the lower limit. This category includes traditional small towns – for example Usk, Denbigh, Beaumaris and Monmouth – and also areas of urban fringe around the major settlements.
• Others in the less sparse context. Includes villages, hamlets and dispersed dwellings in the less sparse areas of Wales and England.
• All settlements in the sparsest context. The sparsest context covers Wales from approximately the Heads of the Valleys road to some distance south of the A55 plus most of Anglesey. An area around Haverfordwest, Milford and Pembroke is outside the sparsest context. Most of the population of the sparsest context live in villages and smaller settlements. There are also a number of small towns and four large towns – Holyhead, Newtown, Aberystwyth and Carmarthen.
Groups of local authorities In some cases we only have data at a local authority level and so cannot use the National Statistics classification. This is the case in chapter 6. For this chapter we use the following groupings of local authorities:
• Rural Authorities. The nine authorities in Wales with population density below the Wales average of 140 persons per square kilometre. That is Isle of Anglesey, Gwynedd, Conwy, Denbighshire, Powys, Ceredigion, Pembrokeshire, Carmarthenshire, and Monmouthshire.

4
• Valleys authorities. The five authorities that have parts of the Heads of the Valleys action area. That is Rhondda Cynon Taff, Merthyr Tydfil, Caerphilly, Blaenau Gwent, and Torfaen.
• Urban authorities. Local authorities containing the three largest settlements in Wales. Swansea, Cardiff and Newport.
• Other authorities. Other authorities not included above. Flintshire, Wrexham, Neath Port Talbot, Bridgend, and Vale of Glamorgan.
The disadvantage of using a local authority classification is that all local authorities in Wales contain a mix of “urban” and “rural” areas (under any reasonable definition of the terms). Thus there will be “rural people” in non-Rural Authorities and “urban people” in Rural Authorities. The justification for using them is that a much wider range of data sets are available for analysis.
Terminology In this report we will use the following terms consistently based on the two definitions.
• Rural Wales. Based on the National Statistics classification of lower super output areas. Villages and smaller settlements in the less sparse context plus all settlements in the sparsest context. That is excluding the large and small towns in the less sparse context.
• Rural Authorities. Based on the local authority classification with the nine rural local authorities.
• Large towns. National Statistics classification. Large towns in the less sparse context.
• Small towns. National Statistics classification. Small towns in the less sparse context.
• Small settlements. National Statistics classification. Villages and smaller settlements in the less sparse context.
• Sparsest context. National Statistics classification. Large towns, small towns, villages and smaller settlements in the sparsest context.
• Lower Super Output Area (LSOA). These are local areas defined by the Office for National Statistics that we use in this report wherever possible as a building block. These areas have approximately equal populations at around 1,500 people. For more information see Annex 2.
If we want to use the ideas as a broad concept then the term will be shown in quotation marks.

5
Key messages • Around 85% of Welsh land is used for agriculture or forestry or is common land.
• Nearly 65% of the Welsh population live in settlements of at least 10,000 people.
• Using the 2001 Census of Population, Rural Wales generally compares favourably with the rest of Wales. For example, higher economic activity, lower unemployment, higher levels of qualifications. However, Rural Wales also has a higher share of its population aged over 64 and a higher share of its households without central heating than the rest of Wales.
• Using data from the Welsh Index of Multiple Deprivation we see that Rural Wales has significant numbers of deprived people although generally lower deprivation rates than the Wales average. Rural Wales has very few of the areas with the highest concentration of deprivation.
• In the period 1991 to 2006 the population of Rural Authorities grew by 6% compared to the Wales average of 3%.
• Over this period the fastest growing age group in Rural Authorities – and Wales as a whole – was people aged 45 to 64. This age group grew by just over 25% compared to a Wales average of 20%.
• The number of young people aged 16 to 24 has been growing in Rural Authorities since around 2000, having fallen from 1991 to 2000. By 2006 the number of young people in Rural Authorities had returned to its 1991 value. This matches the overall Welsh trend.
• For children aged under 16 the population of Rural Authorities first rose slightly but has been slowly falling since around 2001. Other areas of Wales saw smaller increases in the number of children and started to fall rather sooner.
• The number of people aged over 64 in Rural Authorities has risen by just under 11% in the period 1991 to 2006 compared to a Wales average of 6%.

6

7

8

9
Chapter 1 Defining “Rural Wales” Introduction In this chapter we present a range of geographical information that relates to defining the “rural” areas. Included are maps showing the relief of Wales; the main land uses and the distribution of dwellings and settlements, as examples of how these geographical features can affect access to services. We also consider how far people need to travel to reach their nearest “large” settlement and their nearest primary school. Finally we compare the population density (persons per square kilometre) in Wales with other countries in Europe.
Highlights • Around 85% of Welsh land is used for agriculture or forestry or is common land.
• Around 20% of the population of Wales is classified as broadly rural using the National Statistics classification of settlement type and context. That is, outside the large or small towns in the less sparse context.
• About 65% of the Welsh population live in settlements of at least 10,000 people (in either the less sparse or sparsest context). This compares to 80% in England and just under 70% in Scotland.
• All Welsh local authorities contain a mix of large and small settlements.

10
Figure 1.1
The geography of Wales has a great influence on the settlement pattern and communication routes. Even if we had no knowledge of Wales, this map (Figure 1.1) would allow us to make a reasonable guess at where the major population centres are.
Nearly 30% of the land in Wales is over 300 metres above sea level. This area accounts for some 3% of all households in Wales. Over half of these households above 300 metres are in Blaenau Gwent.

11
Figure 1.2
Figure 1.2 breaks down the land in Wales into 5 use categories. Data is for 2007.
• Registered fields. Land where there is a claim for agricultural subsidy or other agricultural scheme.
• Forestry Commission. Includes both commercial and amenity woodland owned or managed by the Forestry Commission. Excludes private woodland.
• Common land. Includes all land with this legal status.

12
• Urban land. Built up areas derived from Ordnance Survey mapping information.
• Others. Land not covered in the above groups. Agricultural or park land not making a subsidy claim, MOD establishments and training areas, inland bodies of water and so on.
Around 83% of the land in Wales is used for agriculture (67%), common land (10%), forestry or amenity woodland (6%). This will in fact be something of an under estimate of the “rural land”. The “others” category will include some agricultural land for which no subsidy payment is made. It will include parks and estates that do not claim subsidy and private woodland not managed by the Forestry Commission.
The categories selected for the map are those where the Assembly has definitive data (except the “urban land”). Notice however, that while the data are definitive they are not complete. The agricultural land, for example, is only that which claims subsidy. There will be other land that does not claim and so is unknown. This would be even more of a problem if we wanted to extend the classification to sub-divide the “urban” and “others” categories.

13
Figure 1.3
Figure 1.3 breaks Wales into grid squares each with an area of 1 hectare. Those grid squares that have at least 1 domestic address point in them have been shaded in red. The white areas are those that have no domestic address points in them. The map is based on data from 2004.
We may think of domestic address points as being almost the same as a “household”. It could be a house with a family living in it. It could be an individual flat in an apartment block. It could be a student house with several individuals living together. Each separate address can be given a map reference and so related to our grid of hectare sized squares.

14
Figure 1.4
Figure 1.4 considers not just the presence or absence of domestic dwellings but also the population in individual settlements. The Office for National Statistics identified individual settlements in Wales and England as part of their calculations using data from the 2001 Census of Population.
There are many possible ways to define settlements so this is a statistical and not a definitive classification. This map shows the calculated central point of each identified settlement. The settlement size groups are arbitrary.
The National Statistics classification of settlement type and context (Annex 1) uses the same set of “large towns” with a population of at least 10,000 people. Most of these are in the less sparse context but there are also four in the sparsest context – Holyhead, Newtown, Aberystwyth and Carmarthen.
At the 2001 Census of Population, around 65% of the population of Wales lived in settlements of at least 10,000 persons.

15
Figure 1.5
Figure 1.5 uses the same set of settlements from the Office for National Statistics as Figure 1.4. From the centre of each settlement of at least 10,000 persons we calculate how far you can drive in 20 or 40 minutes. The calculations use the actual road network with permanent speed limits and general average speeds for different classes of roads. To give full coverage within Wales it is necessary to include some settlements that are in England (notably Chester and Oswestry).
This is intended to give a general impression of how far people might have to travel to reach the nearest large town. It is a considerable improvement on using straight-line distance.
However, there are two obvious limitations. Firstly, we are in effect assuming that everyone has access to a car. Secondly, access to a town centre does not necessarily mean access to any particular service.
Thus this technique is most useful in giving an overview at a Wales level. At a local level something more sophisticated would be required. This would need to consider individual services, access through public transport and so on.

16
Figure 1.6
Figure 1.6 uses drive time calculations to show access to a particular service. The example shows the areas that are within a 5-minute drive of a primary school. In this case we have a slight sophistication in that we show those areas that are within 5 minutes drive of a single primary school separately from those that are within that distance of more than 1 school.
The map shows that most of the land in Wales is more than a 5 minute drive from a primary school. However, this impression is incomplete. It is necessary to look not just at the areas that are more than 5 minutes drive from a primary school but also the number of households in these areas.

17
Table 1.1 Households within 5 minutes drive of a primary school, January 2007 Schools within 5 mins drive Households Share None 60,000 4%One 150,000 12%Two or more 1,100,000 84% Total 1,310,000 100%
The table highlights the fact that the great majority of Welsh households are within a 5 minute drive of at least 2 primary schools. However, it shows that there are 60,000 households that are beyond a 5 minute drive from the nearest school. The map picks out those primary schools that do not have another school close at hand.
This illustrates how, to get a full picture, we need to consider different ways of looking at the issue.
This example was selected because the locations of the schools are simple to find and known accurately. For many services this is not the case.

18
Population density of European countries On a wider scale we can compare the population density of Wales with other countries in Europe. While this is a crude measure, it is useful as a starting point.
Figure 1.7 shows that Wales, at just over 140 persons per square kilometre, is well above the European average of just over 100. Wales is more densely populated than all European countries except the Netherlands, Belgium, UK, Italy and Luxembourg.
Figure 1.7: Population density for European countries, 2004
IrelandBulgaria
CroatiaSpain (*)
GreeceTurkey
RomaniaFrance (*)
AustriaSlovenia
HungarySlovakiaPortugal
Average EU25 (*)Poland
DenmarkCyprus
Czech RepublicWalesLuxembourg
SwitzerlandItalyGermany
United KingdomBelgium
Netherlands
NorwayFinlandSweden
EstoniaLatvia
Lithuania
0 50 100 150 200 250 300 350 400 450 500Persons per square kilometre
Source: Eurostat, statistics for 2004 except for those marked (*) that are for 2003

19

20

21
Chapter 2 National Statistics classification of settlement type and context This classification was developed by a group of Government Departments including the Welsh Assembly Government and covers Wales and England. The work was led by Professor John Shepherd of Birkbeck College. The classification was first published in July 2004. Full details can be found on the Office for National Statistics Internet site:
www.statistics.gov.uk/geography/nrudp.asp
The classification provides a tool for statistical analysis. It is designed to link with the standard Output Area and Lower Super Output Areas geographies, for more information see Annex 2. With these geographies the classification can be used with a range of National Statistics sources. For any particular area the classification is based on the majority of people in the area. There may be minorities in other categories.
Instead of having a simplistic split between urban and rural, the classification attempts to demonstrate some of the richness of the settlement pattern. To do this it divides Wales and England by settlement type and context. This is based on where people live. It does not look at the socio-economic characteristics of the people or land use.
To build up the classification we divide Wales and England into a grid with cells with an area of 1 hectare. A hectare is equivalent to a square with each side 100 metres long. Wales has an area of approximately 2 million hectares. Each of these cells is classified according to the settlement type and context. Output Areas and Lower Super Output Areas are classified according to the majority of cells in the area.
The four settlement types are:
• Large towns – settlements with over 10,000 persons.
• Small towns – below 10,000 persons, includes the fringes of large settlements.
• Villages – smaller settlements with a lower housing density than small towns.
• Others – the very smallest settlements and isolated dwellings.
The cut off for large towns at 10,000 persons is essentially arbitrary. It has been maintained to allow continuity with previous classifications. In England the large town category is usually referred to as “urban”. There is no such simple population threshold for the other categories. A small town has a higher density of settlement over a wider area than a village and a village has a higher and more extended density than an “other” area.
Two contexts are defined.
• The sparsest context. These are areas with very low settlement density within a radius of 10km, 20km and 30km. An area needs to be in the sparsest 20% of Wales and England at all three scales to be classified as in the sparsest context.
• All other areas are considered to be in the less sparse context.
• This defines 8 categories. Note that for Lower Super Output Areas the “villages” and “other” are merged to give a general “other” or “not towns” category.

22
Figure 2.1 Illustrating the classification for Lower Super Output Areas, Wales

23
Figure 2.2 Illustrating the classification for Lower Super Output Areas, England and Wales

24
Figure 2.3 Share of Welsh authority population by category
Cer
edig
ion
Isle
of A
ngle
sey
Pow
ys
Gw
yned
d
Pem
brok
eshi
re
Car
mar
then
shire
Mon
mou
thsh
ire
Den
bigh
shire
Con
wy
Brid
gend
Flin
tshi
re
Wre
xham
Rho
ndda
Cyn
on T
a f
Nea
th P
ort T
albo
t
Cae
rphi
lly
Mer
thyr
Tyd
fil
Vale
of G
lam
orga
n
New
port
Swan
sea
Bla
enau
Gw
ent
Torf
aen
Car
diff
0%
10%
20%
30%
40%
50%
60%
70%
80%
90%
100%
Large towns less sparse Small towns less sparseOthers less sparse Sparsest context
Share of regional population by settlement category, England and Wales
Source: Census of population 2001 and National Statistics classification of settlement type and context “Sparsest context” includes all settlement types in this context Areas are ranked by the share of their population in large towns in the less sparse context
Wal
es
Sout
h W
est
East
ern
East
Mid
land
s
Sout
h Ea
st
York
shire
Nor
th E
ast
Wes
t Mid
land
s
Nor
th W
est
Gre
ater
Lon
don
0%
10%
20%
30%
40%
50%
60%
70%
80%
90%
100%
Large towns less sparse Small towns less sparseOthers less sparse Sparsest context

25

26

27
Chapter 3 Rural deprivation and the Welsh Index of Multiple Deprivation The Welsh Index of Deprivation tells us about which areas have particularly high concentrations of deprivation. Using the Index with the National Statistics classification of settlement type and context (Annex 1) to give us a definition of Rural Wales can give an insight into rural deprivation.
Key messages • The Index identifies areas with the highest concentrations of deprivation. From this we can pick out
“deprivation hotspots” such as the 10% of areas having the highest concentration of deprivation.
• These deprivation hotspots are mainly in the large towns in the less sparse context.
• However, the hotspots are not the whole story for deprivation. Where there are measures that define a “deprived person” we can see that most deprived people are outside the deprivation hotspots.
• There are very few deprivation hotspots in our definition of Rural Wales. However, there are still significant numbers of deprived people dispersed through the region.
Welsh Index of Multiple Deprivation Full documentation for the Index is available through the Welsh Index of Multiple Deprivation theme page at:
www.wales.gov.uk/wimd2005
The Index combines a number of deprivation domains into an overall index. For the purposes of this report we will look at the overall combined index and also the income deprivation domain. We look at the income domain separately because it allows us to consider the number of deprived people as well as the overall rankings of concentration.
The Index is calculated at the Lower Super Output Area (LSOA) level (Annex 2). Wales has 1,896 of these areas each with a population of around 1,500 people.
The Index ranks the 1,896 LSOA in terms of the concentration of deprivation. The Index tells us that one area has a higher or lower concentration of deprivation than another. It does not tell us how big the difference is – only the underlying indicators can do that.
Deprivation is measured using the best data that are available at the LSOA level. These measures were subject to extensive development, peer review and consultation. Work continues to improve the range and quality of these data sets.
The areas ranked as “least deprived” have lowest concentration of deprivation. This is not to say that they have no deprivation. Also we should note that absence of deprivation is not necessarily the same thing as affluence.
Analysis Firstly we consider the general pattern of concentrations of deprivation (Figure 3.1).
The Lower Super Output Areas are divided into the four settlements and context categories described in the introduction and Annex 1. They are also divided into five broad groups of concentration of deprivation from the hotspots in the most deprived 10% of areas to the least deprived 50% of areas.

28
Figure 3.1: Share of LSOA by rank and settlement category
Table 3.1 Combined Domain of the Welsh Index of Multiple Deprivation, 2005
Most deprived
10% Next 10% Next 10% Next 20%
Least deprived
50% TotalCount of LSOALarge town - less sparse 159 151 148 223 520 1,201Small town - less sparse 28 28 26 58 125 265Others - less sparse 2 4 7 27 114 154Sparsest context 1 6 9 71 189 276Total 190 189 190 379 948 1,896
Share of LSOA in categoryLarge town - less sparse 13% 13% 12% 19% 43% 100%Small town - less sparse 11% 11% 10% 22% 47% 100%Others - less sparse 1% 3% 5% 18% 74% 100%Sparsest context - 2% 3% 26% 68% 100%Total 10% 10% 10% 20% 50% 100%Using the National Statistics classification of settlement type and context"-" shows figures less than 0.5%
The difference between the towns in the less sparse context and the other parts of Wales is clear.
• Almost all of the LSOA in the most deprived 10% are in the large and small towns in the less sparse context.
• These towns also dominate the count of LSOA in the most deprived 30%.
• A large majority of the LSOA in areas outside these towns are in the least deprived 50%.
0%
20%
40%
60%
80%
100%
Large town -less sparse
Small town -less sparse
Others - lesssparse
Sparsestcontext
Total
Most deprived 10% Next 10% Next 10%Next 20% Least deprived 50%

29
Income Deprivation Figure 3.1 gives a robust illustration of where the highest concentrations of deprivation in Wales are. However, while important, this is not the full story.
In this section we consider the Income Deprivation Domain of the Index to consider some of the wider issues. This domain is useful for this purpose because it uses a simple deprivation rate calculation. For each local authority we divide the number of people claiming a range of income related benefits – plus their dependent children – by the total population of the area. This allows us to look at the number of “income deprived people”. We can then see how many of these deprived people are in the areas with high or low deprivation rates.
Table 3.2 Income domain of the Welsh Index of Multiple Deprivation By rank and settlement category
• The ranking of the LSOA by the concentration of income deprivation follows a similar pattern to that we saw in figure 3.1 for the overall index.
• Just over 20% of the income deprived people in Wales live in the most deprived 10% of LSOAs in Wales.
• Just over half the income deprived people in Wales live in the most deprived 30% of LSOAs in Wales.
• There are more income deprived people living in areas in the least deprived 50% of LSOA than there are in the hotspots of the 10% most deprived LSOA.
Most deprived
10% Next 10% Next 10% Next 20%
Least deprived
50% TotalCount of LSOALarge town - less sparse 167 152 141 231 510 1,201Small town - less sparse 20 26 30 63 126 265Others - less sparse 0 3 4 27 120 154Sparsest context 3 8 15 58 192 276Total 190 189 190 379 948 1,896
Income deprived personsLarge town - less sparse 101,000 66,000 53,000 64,000 69,000 354,000Small town - less sparse 13,000 11,000 11,000 18,000 18,000 71,000Others - less sparse 0 1,000 1,000 8,000 16,000 25,000Sparsest context 1,000 3,000 5,000 16,000 31,000 58,000Total 115,000 82,000 70,000 106,000 134,000 508,000Using the National Statistics classification of settlement type and contextIncome deprivation ranks are calculated using the number of income deprived people divided by thetotal number of people in the LSOA.Income deprived people are those receiving income related benefits and their dependent children.

30
Figure 3.2: Income deprivation rate for LSOA in Wales
Source: income domain of the Welsh Index of Multiple Deprivation, 2005. The income deprivation rate is the number of people claiming a range of income related benefits (and their dependent children) divided by the total population of the area.
• For Wales as a whole 17% of the population is income deprived.
• There are 18 LSOA where the majority of the population are income deprived. None of these is in what this report calls Rural Wales.
• The maximum income deprivation rate in an LSOA is 62%.
• All LSOA in Wales have at least 1% of their population income deprived.
The purpose of this chart is to show that there are a small number of Lower Super Output Areas that have deprivation rates significantly above the Wales average. These are the genuine “hotspots”. However, most areas lie within a relatively narrow range of the average value.
0%
10%
20%
30%
40%
50%
60%
70%
0% 10% 20% 30% 40% 50% 60% 70% 80% 90%
Share of LSOA
Inco
me
depr
ivat
ion
rate
Individual LSOA
Wales average

31
Figure 3.3: Income deprivation rate for Cardiff and Anglesey
• For Cardiff 17.9% of the population is income deprived while for Anglesey it is 17.6% (the Wales average is 17.4%). Thus we have two authorities that are broadly average.
• LSOA in Cardiff tend to have either particularly low or particularly high income deprivation rates. Cardiff has few LSOA with values close to the Wales average.
• By contrast Anglesey has most of its LSOA clustered around the Wales average. It has few LSOA at either extreme.
• Further analysis suggests that this pattern is reasonably common. The “more rural” areas tend to cluster at or just below the average while the “more urban” areas tend to have the high and low extremes.
0%
10%
20%
30%
40%
50%
60%
70%
0% 10% 20% 30% 40% 50% 60% 70% 80% 90%
Share of LSOA in Wales
Inco
me
depr
ivat
ion
rate
Anglesey
Cardiff

32

33

34

35
Chapter 4 Comparisons from the 2001 Census of Population Introduction This chapter shows some general analyses of information from the 2001 Census of Population by categories in the National Statistics classification of settlement type and context (Annex 1). The analyses show results for Wales and for England. Within the two countries areas are divided into large towns, small towns and others in the less sparse context and all settlements in the sparsest context.
The intention is to consider, over a range of Census variables:
• Differences between settlement categories within Wales
• Overall differences between Wales and England
• Differences between Wales and England within a given settlement category
Highlights • Within Wales the settlement types split broadly into two groups. The large and small towns in the
less sparse context tend to be quite similar. The villages and smaller settlements in the less sparse context and settlements in the sparsest context also tend to follow similar patterns.
• In England the split is often between the large towns in the less sparse context and the rest – including the small towns in the less sparse context.
• Generally settlement types in Wales and England follow similar patterns. The small towns in the less sparse context are the most frequent exception to this.
• The differences between Wales and England in the share of the settlement types help to explain the differences between the Wales and England average values.
General description and notes for the tables Data source The results for these analyses are taken from the 2001 Census of Population. Results are considered for Wales and England. Information about the Census is been published by the Office for National Statistics. Data from the Census can be found, at a range of geographical scales, on the Neighbourhood Statistics pages of the ONS site.
http://neighbourhood.statistics.gov.uk/dissemination/datasetList.do?Contract2=1&$ph=60&updateRequired=true&step=1&CurrentTreeIndex=-1#2
Geographical building blocks The analyses in this report use the Census data at the level of Lower Super Output Areas (LSOA). This is a statistical geography created by ONS. The areas are generated so that they have approximately equal populations. Each area contained around 1,500 persons at the time of the 2001 Census. Lower Super Output Areas are described in Annex 2.

36
Reporting categories For reporting purposes the analyses also use the National Statistics classification of settlement type and context. For the details about the classification see Annex 1. For this report we have used the classification at the Lower Super Output Area level to define 4 categories.
• Large towns in the less sparse context
• Small towns in the less sparse context
• Other smaller settlements in the less sparse context
• All settlements in the sparsest context
Description of the tables The tables show results for Wales and England separately. Each country is sub-divided by the 4 settlement categories.
The total number of persons or households in each settlement category for each country is shown in bold.
The next section shows the share of this total that is in a particular sub-group. For all, except Table 4.11 these sub-groups are exclusive. That is no individual person or household is counted in more than one sub-group. Therefore, each column adds up to 100%. Note that there may appear to be small inconsistencies in the sum due to rounding. In Table 4.11 an individual household can be in more than one sub-group.
For a single variable reading across the row shows where there are differences between the settlement categories. Within each row we compare the different category values with the all settlement average. Values less than the all settlement average share are coloured red. Those values greater than the average are coloured blue. The comparison is done on unrounded figures. The comparison is thus correct even if the rounded figures appear to be equal.

37
Table 4.1
Persons by age group
Highlights • Overall Wales and England have similar shares of people aged under 25. For people aged 25 to 44
England has the higher share. For older people Wales has the higher share.
• Within Wales the areas outside large and small towns in the less sparse context have lower than average share of people aged under 25 and higher than average shares of people aged over 44.
• Within England this pattern is also seen in the small towns in the less sparse context.
• The comparison of the shares of people aged 16 to 24 in the sparsest context in Wales and England is distorted because of Aberystwyth University. Taking the town of Aberystwyth out of the calculations suggests that the share in this age group is still higher in the Welsh sparsest context but not as much as the raw figure suggests.
SparsestLarge town Small town Others Context Total
Wales total (=100%) 1,830,000 410,000 240,000 420,000 2,900,000
Share by age groupUnder 16 20.6% 20.7% 19.2% 18.9% 20.2%16 to 24 11.6% 9.9% 8.6% 10.1% 10.9%25 to 44 27.3% 27.1% 25.4% 23.8% 26.6%45 to 64 23.6% 25.3% 29.3% 27.4% 24.9%Over 64 16.9% 17.0% 17.5% 19.8% 17.4%
England total (=100%) 39,700,000 4,500,000 4,200,000 700,000 49,100,000
Share by age groupUnder 16 20.4% 19.5% 18.8% 17.6% 20.2%16 to 24 11.5% 8.8% 8.5% 8.2% 10.9%25 to 44 30.1% 27.1% 25.4% 23.8% 29.3%45 to 64 22.7% 26.7% 29.8% 28.5% 23.8%Over 64 15.4% 17.9% 17.4% 21.9% 15.9%
Census of Population, 2001
Less sparse context

38
Table 4.2
Persons by place of birth
Place of birth is only a proxy for “national identity”. It has the advantage of being unambiguous and objective.
Highlights • The highest concentrations of people born in Wales are seen in the large towns of the less sparse
context. Further analysis shows that the highest values are concentrated around the Heads of the Valleys area.
• In Wales the sparsest context has the highest share of people born in England.
• Wales generally has a relatively low share of persons born outside the UK. All Welsh settlement types have values lower than the English average.
• In both Wales and England the large towns in the less sparse context have the highest share of peole born outside the UK.
Sparsest
Large town Small town Others Context TotalWales total (=100%) 1,830,000 410,000 240,000 420,000 2,900,000
Share by place of birthWales 78.8% 77.9% 68.5% 62.1% 75.4%England 16.5% 18.8% 27.8% 33.9% 20.3%Rest of UK 1.1% 1.1% 1.2% 1.2% 1.1%Rest of world 3.6% 2.2% 2.5% 2.9% 3.2%
England total (=100%) 39,700,000 4,500,000 4,200,000 700,000 49,100,000
Share by place of birthWales 1.2% 1.4% 1.7% 1.6% 1.2%England 86.3% 92.5% 91.6% 92.7% 87.4%Rest of UK 2.0% 2.1% 2.1% 2.7% 2.1%Rest of world 10.5% 4.0% 4.6% 3.0% 9.3%
Census of Population, 2001
Less sparse context

39
Table 4.3 Persons aged 16 to 74 by highest qualification held
The intermediate qualifications will include all the major qualifications below degree level such as GCSE, A levels, O levels, and vocational quaifications at levels 1, 2 or 3. It will also cover other qualifications where we are unsure about what they are and at what level, since these qualifications are highly unlikely to be at a level as high as a degree.
Highlights • Within Wales, Rural Wales has a higher share of people qualified to degree level or higher than the
rest of Wales. Rural Wales also has a lower share of people with no qualifications.
• In Rural Wales the areas in the less sparse context have a higher share of highly qualified people than the areas in the sparsest context.
• In the rest of Wales the large towns and small towns have similar shares of highly and lowly qualified people.
• In England the smaller settlements in the less sparse context again have a higher share of highly qualified people and a lower share of people with no qualifications. However, for the sparsest context the reverse is true.
• Overall Wales has a higher share of people with no qualifications than England and a lower share of people with a degree or higher.
SparsestLarge town Small town Others Context Total
Wales total (=100%) 1,300,000 290,000 170,000 300,000 2,080,000
Share by highest qualification heldNone 34.0% 34.8% 27.5% 30.4% 33.0%Intermediate 49.6% 48.8% 48.7% 50.8% 49.6%Degree or higher 16.5% 16.4% 23.7% 18.7% 17.4%
England total (=100%) 28,700,000 3,200,000 3,100,000 500,000 35,500,000
Share by highest qualification heldNone 29.4% 27.8% 24.5% 31.1% 28.9%Intermediate 50.9% 53.1% 52.2% 51.6% 51.2%Degree or higher 19.7% 19.1% 23.3% 17.3% 19.9%
Census of Population, 2001
Less sparse context

40
Table 4.4 Persons aged 16 to 74 by economic status
“Unemployed” - people not in work who are actively seeking work. Thus it is not all people who are not working (see below) and it is not based on benefit claimants.
“Students” - includes full time students and part time students who are not in full or part time employment or self employed.
“Retired” - includes persons under the statutory pension age who are retired and excludes those above this age who are still in employment or self employed.
“Other inactive” - people who are not in work who are not actively seeking work (excluding students and the retired). Includes long term sick or disabled, persons looking after family or home, and others who not seeking employment.
Highlights • Within Wales we can generally compare the large and small towns in the less sparse context with
Rural Wales.
• Rural Wales has a lower share of people in full time employment than the rest of Wales. However, Rural Wales has a much higher share of people in self employment. Overall the share of people in employment or self employment is similar.
• Rural Wales has a higher share of retired people than the rest of Wales. However, the share of people who are economically inactive (excluding retired people and students) is lower than the rest of Wales.
SparsestLarge town Small town Others Context Total
Wales total (=100%) 1,300,000 290,000 170,000 300,000 2,080,000
Share by economic activityFull time employees 37.4% 37.5% 35.8% 30.0% 36.2%Part time employees 11.3% 11.6% 11.0% 11.1% 11.3%Self employed 5.5% 6.7% 12.8% 15.2% 7.7%Unemployed 3.6% 3.6% 2.6% 3.3% 3.5%Retired 14.3% 14.8% 15.6% 16.6% 14.8%Students 8.0% 5.8% 5.7% 7.6% 7.4%Economically inactive 19.9% 20.1% 16.4% 16.2% 19.1%
England total (=100%) 28,700,000 3,200,000 3,100,000 500,000 35,500,000
Share by economic activityFull time employees 41.3% 41.2% 37.3% 31.9% 40.8%Part time employees 11.6% 13.0% 12.2% 12.8% 11.8%Self employed 7.3% 9.7% 14.8% 15.6% 8.3%Unemployed 3.6% 2.4% 2.0% 2.7% 3.3%Retired 13.0% 15.7% 15.7% 18.9% 13.5%Students 7.8% 5.0% 5.4% 4.5% 7.3%Economically inactive 15.4% 12.9% 12.6% 13.6% 14.9%
Census of Population, 2001
Less sparse context

41
• In England we see a similar pattern except that the small towns in the largest context behave more like the “rural” areas than the large towns.
• Overall Wales has a lower share of its population in employment or self employed than England. Wales has a higher share of its population not working or looking for work (economically inactive) than England.
Table 4.5 Females aged 16 to 74 by economic status
This table uses the same economic status definitions as Table 4.4.
Highlights • The division between Rural Wales and the rest of Wales is less clear for women than it was for all
people. The villages and smaller settlements in the less sparse context, while still having relatively high shares of retired and economically inactive, now have a relatively high share of women in full time employment.
• In all settlement types there is a marked difference in the distribution between women and all persons. Generally a higher share of women are economically inactive or retired and a lower share are employed, self employed or unemployed.
SparsestLarge town Small town Others Context Total
Wales total (=100%) 670,000 150,000 90,000 150,000 1,060,000
Share by economic activityFull time employees 26.9% 26.9% 27.1% 22.6% 26.3%Part time employees 19.1% 19.8% 19.2% 18.7% 19.1%Self employed 2.8% 3.5% 7.3% 8.8% 4.1%Unemployed 2.4% 2.4% 1.9% 2.4% 2.4%Retired 16.0% 16.5% 17.4% 18.7% 16.6%Students 8.2% 6.0% 6.0% 8.1% 7.7%Economically inactive 24.5% 24.8% 21.1% 20.7% 23.7%
England total (=100%) 14,600,000 1,600,000 1,500,000 300,000 18,000,000
Share by economic activityFull time employees 30.8% 29.0% 26.6% 22.3% 30.2%Part time employees 19.5% 22.7% 21.3% 21.8% 20.0%Self employed 3.7% 5.4% 8.8% 9.4% 4.4%Unemployed 2.6% 1.9% 1.6% 2.1% 2.4%Retired 14.8% 17.9% 17.6% 21.2% 15.4%Students 7.9% 5.1% 5.6% 4.6% 7.4%Economically inactive 20.6% 18.1% 18.5% 18.6% 20.2%
Census of Population, 2001
Less sparse context

42
Table 4.6 Persons 16 to 74 in employment by industrial group
Includes full and part time employees and the self employed. Categories based on Standard Industrial Classification – as closely as the results from the Census of Population allows.
Uses the industry an individual works in rather than what they do. For example, an accountant working in the NHS would be in the health industry and not finance.
Allocation to settlement type is based on where the worker lives rather than where the job is.
“Public administration” includes central and local government; police and fire services; other public bodies and the armed forces. School and NHS workers shown separately.
“Education” and “health” include both public and private sectors. Highlights • Unsurprisingly the share of the workforce in the agricultural sector is highest in Rural Wales.
However, even in Rural Wales the manufacturing sector accounts for twice as many jobs as agriculture. In villages and smaller settlements in the less sparse context the financial sector also has a larger share of the workforce than agriculture.
SparsestLarge town Small town Others Context Total
Wales total (=100%) 730,000 170,000 110,000 180,000 1,190,000
Share by industrial groupAgriculture and fisheries 0.7% 1.4% 5.7% 9.2% 2.5%Manufacturing & construction 26.6% 29.0% 23.5% 20.9% 25.8%Wholesale & retail 16.7% 15.8% 14.2% 16.2% 16.3%Hotels and catering 5.0% 5.0% 5.0% 7.5% 5.4%Transport & communication 5.8% 5.1% 4.9% 4.9% 5.5%Financial services 12.6% 10.9% 12.5% 8.9% 11.8%Public administration 7.1% 6.5% 6.4% 6.3% 6.8%Education 7.7% 8.1% 9.9% 8.7% 8.1%Health 13.0% 13.7% 13.4% 12.2% 13.0%Others 4.8% 4.6% 4.6% 5.3% 4.8%
England total (=100%) 18,000,000 2,100,000 2,100,000 300,000 22,400,000
Share by industrial groupAgriculture and fisheries 0.7% 2.4% 6.0% 9.1% 1.5%Manufacturing & construction 22.4% 24.7% 21.9% 22.2% 22.5%Wholesale & retail 17.1% 16.6% 14.9% 16.5% 16.9%Hotels and catering 4.7% 4.7% 4.7% 9.1% 4.7%Transport & communication 7.4% 6.3% 5.5% 4.9% 7.1%Financial services 18.5% 15.7% 17.1% 10.2% 18.0%Public administration 5.5% 6.2% 6.4% 4.9% 5.7%Education 7.6% 8.2% 8.4% 7.3% 7.7%Health 10.8% 10.5% 10.0% 10.4% 10.7%Others 5.3% 4.7% 5.0% 5.3% 5.2%
Census of Population, 2001
Less sparse context
43
• Rural Wales has a lower share of jobs in the manufacturing sector than the rest of Wales. However, more than 1 in every 5 jobs in Rural Wales is in the manufacturing sector.
• Wales has a broadly similar distribution of jobs to England. A rather higher share in agriculture and manufacturing and a lower share in finance and health. The patterns within the settlement type are also broadly similar.
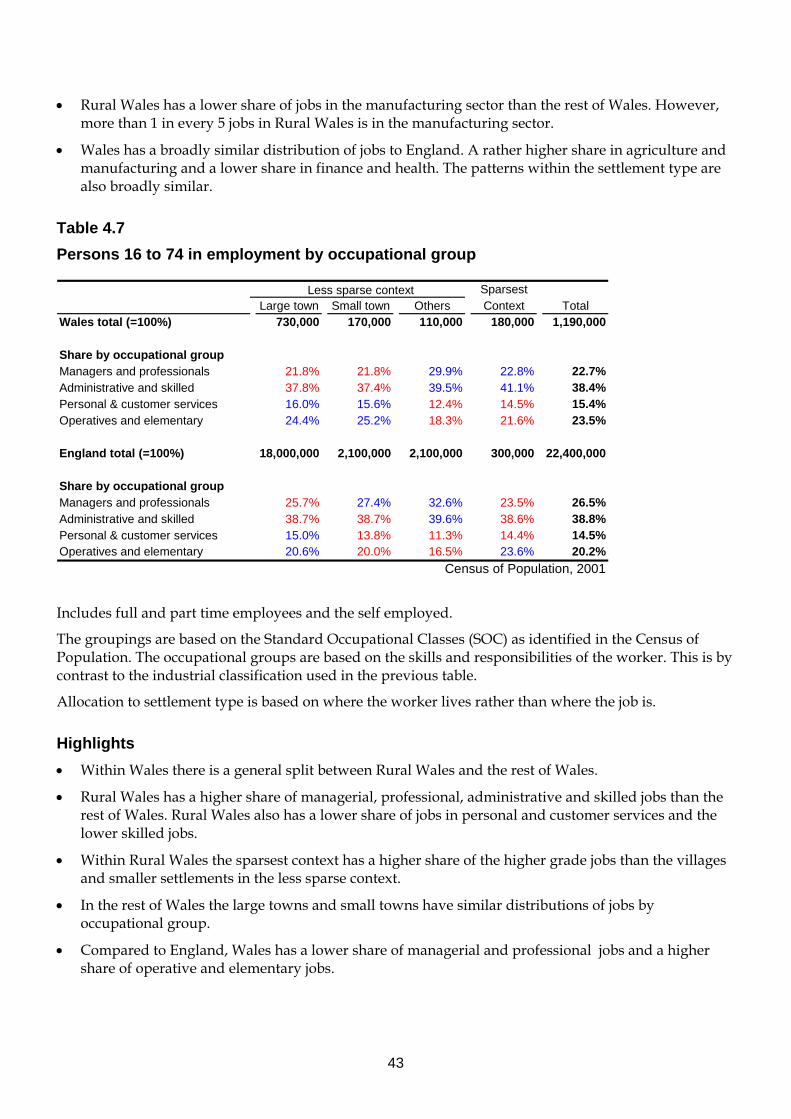
Table 4.7 Persons 16 to 74 in employment by occupational group
Includes full and part time employees and the self employed.
The groupings are based on the Standard Occupational Classes (SOC) as identified in the Census of Population. The occupational groups are based on the skills and responsibilities of the worker. This is by contrast to the industrial classification used in the previous table.
Allocation to settlement type is based on where the worker lives rather than where the job is. Highlights • Within Wales there is a general split between Rural Wales and the rest of Wales.
• Rural Wales has a higher share of managerial, professional, administrative and skilled jobs than the rest of Wales. Rural Wales also has a lower share of jobs in personal and customer services and the lower skilled jobs.
• Within Rural Wales the sparsest context has a higher share of the higher grade jobs than the villages and smaller settlements in the less sparse context.
• In the rest of Wales the large towns and small towns have similar distributions of jobs by occupational group.
• Compared to England, Wales has a lower share of managerial and professional jobs and a higher share of operative and elementary jobs.
SparsestLarge town Small town Others Context Total
Wales total (=100%) 730,000 170,000 110,000 180,000 1,190,000
Share by occupational groupManagers and professionals 21.8% 21.8% 29.9% 22.8% 22.7%Administrative and skilled 37.8% 37.4% 39.5% 41.1% 38.4%Personal & customer services 16.0% 15.6% 12.4% 14.5% 15.4%Operatives and elementary 24.4% 25.2% 18.3% 21.6% 23.5%
England total (=100%) 18,000,000 2,100,000 2,100,000 300,000 22,400,000
Share by occupational groupManagers and professionals 25.7% 27.4% 32.6% 23.5% 26.5%Administrative and skilled 38.7% 38.7% 39.6% 38.6% 38.8%Personal & customer services 15.0% 13.8% 11.3% 14.4% 14.5%Operatives and elementary 20.6% 20.0% 16.5% 23.6% 20.2%
Census of Population, 2001
Less sparse context

44
Table 4.8 Persons 16 to 74 in employment by method of travel to work
Includes full and part time employees and the self employed.
“Others” includes those who travel by private car, van or motorcycle. Also includes those who have no regular place of work, those who live at their place of work and those who work outside the UK.
Highlights • In Wales the sparsest context has the highest share of workers going to work by foot or bicycle and
the lowest using public transport.
• The Welsh large towns in the less sparse context have a relatively high share of workers using foot or bicycle and the highest share using public transport.
• The rest of the less sparse context in Wales has relatively low shares of workers getting to work by foot, bicycle or public transport.
• A similar pattern across the settlement types applies in England.
• England has a much higher share of workers going to work on public transport than Wales. This is particularly so in the large towns in the less sparse context.
SparsestLarge town Small town Others Context Total
Wales total (=100%) 730,000 170,000 110,000 180,000 1,190,000
Share by travel to workPublic transport 8.8% 6.2% 3.3% 2.9% 7.0%Foot or bicycle 12.6% 10.0% 5.4% 13.6% 11.7%Others 78.6% 83.8% 91.3% 83.5% 81.2%
England total (=100%) 18,000,000 2,100,000 2,100,000 300,000 22,400,000
Share by travel to workPublic transport 17.8% 6.8% 5.0% 2.9% 15.4%Foot or bicycle 13.6% 10.8% 7.9% 16.6% 12.8%Others 68.6% 82.4% 87.1% 80.5% 71.8%
Census of Population, 2001
Less sparse context

45
Table 4.9 Occupied households by tenure
Occupied domestic dwellings only. Excludes vacant properties and second homes.
“Public sector rented” includes local authorities and Registered Social Landlords.
“Others” is mainly private sector rented (although it should exclude holiday lets). Highlights • The areas in the less sparse context outside large and small towns have the highest share of
households that are owner occupied and the lowest share in public sector rented in Wales and England.
• The sparsest context has the highest share of households that are owned outright and the highest share not owner occupied or public sector rented in Wales and England.
• The large towns in the less sparse context have the lowest share in owner occupation or owned outright and the highest share in public sector rented in Wales and England.
• In Wales the small towns in the less sparse context follow the Welsh average distribution closely. In England these areas have higher shares in owner occupation.
• Overall Wales has a higher share of households in owned outright than England and lower shares in the other types.
SparsestLarge town Small town Others Context Total
Wales total (=100%) 760,000 170,000 100,000 180,000 1,210,000
Share by tenureOwned outright 31.5% 34.1% 40.5% 41.1% 34.0%Other owner occupier 38.9% 38.4% 38.5% 28.9% 37.3%Public sector rented 19.6% 18.2% 10.8% 14.4% 17.9%Others 10.0% 9.4% 10.3% 15.6% 10.8%
England total (=100%) 16,600,000 1,900,000 1,700,000 300,000 20,500,000
Share by tenureOwned outright 27.4% 34.4% 38.8% 40.4% 29.2%Other owner occupier 39.5% 42.1% 38.9% 30.0% 39.5%Public sector rented 21.0% 14.0% 9.1% 12.6% 19.3%Others 12.1% 9.5% 13.2% 16.9% 12.0%
Census of Population, 2001
Less sparse context

46
Table 4.10 Occupied households by access to a private car or van
Highlights • In Wales the areas in the less sparse context outside large and small towns have the lowest share of
households with no car and the highest share with at least two cars.
• In the sparsest context in Wales, the share of households without a car is below the national average. However, nearly one household in every five has no car. Just over a third of households in the sparsest context have at least two cars.
• The small towns in the less sparse context closely follow the Wales average shares.
• In Welsh large towns in the less sparse context just under 30% of households have no car while around 25% have at least two cars.
• The distribution in Welsh large towns is similar to that in the English large towns. For the other settlement types Wales has a lower share of multiple car households and a higher share of households with no car.
• Overall Wales has a slightly lower share than England of households either without a car or with 2 or more cars.
SparsestLarge town Small town Others Context Total
Wales total (=100%) 760,000 170,000 100,000 180,000 1,210,000
Share by access to car/vanNone 29.3% 25.3% 13.6% 19.2% 26.0%One 45.8% 45.6% 41.1% 46.8% 45.5%Two or more 25.0% 29.1% 45.3% 34.0% 28.5%
England total (=100%) 16,600,000 1,900,000 1,700,000 300,000 20,500,000
Share by access to car/vanNone 29.8% 17.7% 9.9% 17.8% 26.8%One 44.2% 43.6% 38.4% 47.9% 43.7%Two or more 26.1% 38.7% 51.7% 34.3% 29.5%
Census of Population, 2001
Less sparse context

47
Table 4.11 Occupied households by house conditions
The house conditions variables are not exclusive (a household can be overcrowded and not have sole access to a bathroom, for example). The table is therefore not intended to add up to 100%.
“Overcrowded” is calculated by comparing the number of bedrooms and living rooms with the number of people in the house. Highlights • The share of households in the sparsest context of Wales that do not have central heating is nearly
double the overall Wales share.
• The share of households without sole use of a bathroom is also nearly double the Wales average in the sparsest context although the figure is still below 1% of the households in the area.
• In England the large towns in the less sparse context have a higher than average share of all three house condition issues. However, the highest share of households without central heating is, as in Wales, in the sparsest context.
SparsestLarge town Small town Others Context Total
Wales total (=100%) 760,000 170,000 100,000 180,000 1,210,000
Share by house conditionsOvercrowded 4.8% 3.9% 2.4% 4.0% 4.4%Without central heating 6.0% 7.0% 7.7% 14.1% 7.5%Without sole use of bathroom 0.3% 0.3% 0.3% 0.7% 0.4%
England total (=100%) 16,600,000 1,900,000 1,700,000 300,000 20,500,000
Share by house conditionsOvercrowded 8.1% 3.4% 2.4% 3.5% 7.1%Without central heating 9.0% 5.5% 6.7% 10.9% 8.5%Without sole use of bathroom 0.5% 0.2% 0.2% 0.3% 0.5%
Census of Population, 2001
Less sparse context

48
Table 4.12 Occupied households by household composition
All occupied households fit into a single category.
“Pensioners” means persons of pensionable age. 65 and over for men and 60 and over for women. These people may not necessarily be retired.
“Dependent children” is any child aged under 16 plus children aged 16 to 18 who are in full time education and living in a family with one or both of their parents or legal guardians.
“Others” are households that contain no dependent children, do not consist entirely of persons of pensionable age, and do not consist of a single person. Highlights • In Wales around 25% of households have only people of pensionable age in them. This share is
rather higher in the sparsest context (28%).
• In Wales around 30% of households have dependent children. This share is rather lower in the sparsest context (27%).
• Overall the shares of households by composition are quite similar between Wales and England and between the settlement types. Differences of more than one or two percentage points are rare.
SparsestLarge town Small town Others Context Total
Wales total (=100%) 760,000 170,000 100,000 180,000 1,210,000
Share by household compositionSingle pensioner 15.3% 15.6% 13.7% 16.8% 15.5%Other all pensioner 9.7% 9.8% 11.3% 11.6% 10.1%Other single person 14.3% 13.0% 10.5% 13.5% 13.7%With dependent children 30.8% 31.3% 30.0% 27.0% 30.2%Others 29.9% 30.2% 34.4% 31.1% 30.5%
England total (=100%) 16,600,000 1,900,000 1,700,000 300,000 20,500,000
Share by household compositionSingle pensioner 14.4% 15.3% 12.7% 17.0% 14.4%Other all pensioner 8.7% 11.6% 12.5% 13.8% 9.3%Other single person 16.8% 11.7% 10.2% 12.1% 15.7%With dependent children 29.7% 29.0% 28.5% 24.8% 29.4%Others 30.5% 32.5% 36.1% 32.2% 31.1%
Census of Population, 2001
Less sparse context

49

50

51
Chapter 5 Distribution of the population by age group, 2001 This chapter examines data from the 2001 Census of Population. It shows how the share of the population by age group varies within Wales and England by region and by type of settlement. The settlement categories are taken from the National Statistics classification of settlement type and context (see Annex 1).
Highlights • If we consider the settlement types across the whole of Wales and England there is generally run in
the sequence large towns, small towns, others, sparsest context. The large towns in the less sparse context having a higher share of people in the younger age groups.
• Thus, for example, the large towns in the sparsest context have the highest share of their population aged 25 to 44 followed by the small towns, then others in the sparsest context and then by the settlements in the sparsest context.
• The greatest variation is seen in the 25 to 44 and 45 to 64 age groups.
• Within a single settlement type there is relatively little variation in the shares in each age group across the regions of Wales and England.
Description The analyses use the National Statistics classification of settlement type and context. For details see Chapter 2. The calculations are done for all Lower Super Output Areas (LSOA) in Wales and England. For more information about LSOA see Annex 2.
For presentational purposes England is divided into the nine Government Office Regions. For this paper the following age groups are used
• Under 16
• 16 to 24
• 25 to 44
• 45 to 64
• Over 64

52
Figure 5.1: Share of all ages population by settlement type
0%
10%
20%
30%
40%
50%
60%
70%
80%
90%
100%
Large townsless sparse
Small townsless sparse
Others lesssparse
Sparsestcontext
Wales &England
Over 6445 to 6425 to 4416 to 24Under 16
Table 5.1 Wales and England summary by settlement type
Source: Census of Population 2001 and National Statistics classification of settlement type and context
This chart shows the share of the population by age group for the four settlement categories for the whole of Wales and England. In the table each value is compared to the all categories average for that age group. Values larger than the all categories average are in blue, those lower are in red.
Figures 5.2 to 5.6 look at each separate settlement category and show Wales and the Government Office Regions of England. All the charts show Wales and then the English regions in the same order. English regions starting in the south west, going up the West Coast and down the east coast ending with London.
Sparsest AllLarge towns Small towns Others context categories
Persons ofall ages (=100%) 41,600,000 4,900,000 4,500,000 1,100,000 52,000,000
Under 16 20.4% 19.6% 18.8% 18.1% 20.2%16 to 24 11.5% 8.9% 8.5% 8.9% 10.9%25 to 44 29.9% 27.1% 25.4% 23.8% 29.1%45 to 64 22.7% 26.5% 29.8% 28.1% 23.8%Over 64 15.5% 17.8% 17.5% 21.1% 16.0%
Less sparse context

53
Figure 5.2: All types of settlements in Wales and England Number of people by age group and region (millions)
0
1
2
3
4
5
6
7
8
9
Wal
es
Sou
th W
est
Wes
t Mid
land
s
Nor
th W
est
Nor
th E
ast
Yor
kshi
re/H
umbe
r
Eas
t Mid
land
s
Eas
t of E
ngla
nd
Sou
th E
ast
Gre
ater
Lon
don
Over 6445 to 6425 to 4416 to 24Under 16
Share of persons of all ages
0%10%20%30%40%50%60%70%80%90%
100%
Wal
es
Sou
th W
est
Wes
t Mid
land
s
Nor
th W
est
Nor
th E
ast
Yor
kshi
re/H
umbe
r
Eas
t Mid
land
s
Eas
t of E
ngla
nd
Sou
th E
ast
Gre
ater
Lon
don
Over 6445 to 6425 to 4416 to 24Under 16
Source: Census of Population 2001 and National Statistics classification of settlement type and context Highlights • Wales has a relatively small population compared to the Government Office Regions in England.
Only the North East has fewer people than Wales.
• London stands out as having a different distribution of age groups. Particularly it has a relatively high share of people aged 25 to 44.

54
Figure 5.3: Large towns in the less sparse context Number of people by age group and region (millions)
0
1
2
3
4
5
6
7
8
Wal
es
Sou
th W
est
Wes
t Mid
land
s
Nor
th W
est
Nor
th E
ast
Yor
kshi
re/H
umbe
r
Eas
t Mid
land
s
Eas
t of E
ngla
nd
Sou
th E
ast
Gre
ater
Lon
don
Over 6445 to 6425 to 4416 to 24Under 16
Share of persons of all ages
0%10%20%30%40%50%60%70%80%90%
100%
Wal
es
Sou
th W
est
Wes
t Mid
land
s
Nor
th W
est
Nor
th E
ast
Yor
kshi
re/H
umbe
r
Eas
t Mid
land
s
Eas
t of E
ngla
nd
Sou
th E
ast
Gre
ater
Lon
don
Over 6445 to 6425 to 4416 to 24Under 16
Source: Census of Population 2001 and National Statistics classification of settlement type and context
Highlights • Wales has fewer people of all ages in the large towns in the sparsest context than any of the English
regions. The Greater London area has the most, more than three times the Welsh figure.
• Distribution by age group is broadly similar across the regions within this settlement type.

55
Figure 5.4: Small towns in the less sparse context Number of people by age group and region (thousands)
0
100
200
300
400
500
600
700
800
900
Wal
es
Sou
th W
est
Wes
t Mid
land
s
Nor
th W
est
Nor
th E
ast
Yor
kshi
re/H
umbe
r
Eas
t Mid
land
s
Eas
t of E
ngla
nd
Sou
th E
ast
Gre
ater
Lon
don
Over 6445 to 6425 to 4416 to 24Under 16
Share of persons of all ages
0%10%20%30%40%50%60%70%80%90%
100%
Wal
es
Sou
th W
est
Wes
t Mid
land
s
Nor
th W
est
Nor
th E
ast
Yor
kshi
re/H
umbe
r
Eas
t Mid
land
s
Eas
t of E
ngla
nd
Sou
th E
ast
Gre
ater
Lon
don
Over 6445 to 6425 to 4416 to 24Under 16
Source: Census of Population 2001 and National Statistics classification of settlement type and context
Highlights • For this settlement type Wales has the fifth smallest (out of ten) all ages population. The South East
of England is the largest region and London has very few people living in this sort of settlement.
• There is more variation between the categories for small towns than for the large towns. However, the shares in each age group are still broadly consistent.

56
Figure 5.5: Villages and smaller settlements in the less sparse context Number of people by age group and region (thousands)
0100200300400500600700800900
1,000
Wal
es
Sou
th W
est
Wes
t Mid
land
s
Nor
th W
est
Nor
th E
ast
Yor
kshi
re/H
umbe
r
Eas
t Mid
land
s
Eas
t of E
ngla
nd
Sou
th E
ast
Gre
ater
Lon
don
Over 6445 to 6425 to 4416 to 24Under 16
Shares of all people
0%10%20%30%40%50%60%70%80%90%
100%
Wal
es
Sou
th W
est
Wes
t Mid
land
s
Nor
th W
est
Nor
th E
ast
Yor
kshi
re/H
umbe
r
Eas
t Mid
land
s
Eas
t of E
ngla
nd
Sou
th E
ast
Gre
ater
Lon
don
Over 6445 to 6425 to 4416 to 24Under 16
Source: Census of Population 2001 and National Statistics classification of settlement type and context
Highlights • For this settlement type Wales is the third smallest region after London and the North East of
England. The South East of England is again the largest region.
• The age group shares are broadly consistent over the regions.

57
Figure 5.6: All settlements in the sparsest context Number of people by age group and region (thousands)
0
50
100
150
200
250
300
350
400
450
Wal
es
Sou
th W
est
Wes
t Mid
land
s
Nor
th W
est
Nor
th E
ast
Yor
kshi
re/H
umbe
r
Eas
t Mid
land
s
Eas
t of E
ngla
nd
Sou
th E
ast
Gre
ater
Lon
don
Over 6445 to 6425 to 4416 to 24Under 16
Share of persons of all age
0%10%20%30%40%50%60%70%80%90%
100%
Wal
es
Sou
th W
est
Wes
t Mid
land
s
Nor
th W
est
Nor
th E
ast
Yor
kshi
re/H
umbe
r
Eas
t Mid
land
s
Eas
t of E
ngla
nd
Sou
th E
ast
Gre
ater
Lon
don
Over 6445 to 6425 to 4416 to 24Under 16
Source: Census of Population 2001 and National Statistics classification of settlement type and context
Highlights • In this category Wales is the largest region with more than twice the number of people in the next
largest region (the South West of England). Only Wales, the South West and North West have more than 100,000 people living in the sparsest context although only London has none at all. Wales has just under 40% of all people in the sparest context.
• The shares of each age group are again relatively consistent across the regions.

58

59

60

61
Chapter 6 Population change in Wales, 1991 to 2006 This chapter shows the trends in population by age group and local authority type for the mid year population estimates from 1991 to 2006. Note that in this section the analysis is based on local authorities rather than the Lower Super Output Areas (LSOA) used previously.
Key messages • The population of Wales grew by just over 3% between 1991 and 2006.
• The Rural Authorities have the highest population growth overall. They also have the highest growth for people aged 45 to 64 and over 64 and the lowest fall for children aged up to 16.
• The Valleys authorities have seen an overall fall in population from 1991 to 2006 of just over 1%. The population has been slowly increasing since around 2003.
• In Wales the number of people aged 16 to 25 fell from 1991 to 1998 when it was around 15% below the 1991 figure. Since 1998 the numbers of young people have been steadily increasing. By 2006 they had returned to around the same level as 1991.
• The Rural local authorities closely follow the Wales trend. In the Urban authorities numbers started to increase from about 1994 and are now some 15% above the 1991 level. The Valleys and Other authorities have seen an overall fall of around 7%.
• The largest percentage increases in population are seen for the 45 to 64 age group. Wales as a whole grew by around 20%. The authority type ranged between 15% for the Urban and Valleys authorities to over 25% in Rural Authorities.
Local authority types Annual population estimates are only available at the local authority level. Therefore we cannot use the National Statistics classification of settlement type and context (Chapter 2). Instead we have to use a general classification of local authorities.
For this report the following subjective categories are used.
• Rural – the 9 authorities with population density below the Wales average of 140 persons per square kilometre. Isle of Anlesey, Gwynedd, Conwy, Denbighshire, Powys, Ceredigion, Pembrokeshire, Carmarthenshire and Monmouthshire.
• Valleys – the 5 authorities that include parts of the Heads of the Valleys action area. Rhondda Cynon Taff, Merthyr Tydfil, Caerphilly, Blaenau Gwent and Torfaen.
• Urban – Swansea; Cardiff and Newport.
• Others – Flintshire, Wrexham, Neath Port Talbot, Bridgend and Vale of Glamorgan.
Because we classify a whole local authority there will be mismatches. Some areas in “rural” local authorities will not have a rural character. For example, the large towns along the north Wales coast. Similarly some areas in non-Rural Authorities will have a rural character. For example, the Gower in Swansea or areas outside the major settlements in Wrexham or the Vale of Glamorgan.
Note that the aggregate population of the areas that are wrongly included is significantly larger than the aggregate population of the wrongly excluded areas. For example some densely populated coastal fringe areas of Wales contain more people in the rural areas than the non-rural areas.
General notes Each chart is in two parts. Firstly the number of people each year for each local authority type. Secondly the change relative to the starting point in 1991.
To help comparison between the age groups figures 6.2 to 6.6 all have the same vertical scale.

62
Figure 6.1 Persons of all ages (thousands)
Change from a 1991 base
-3%
-2%
-1%
0%
1%
2%
3%
4%
5%
6%
7%
1991
1992
1993
1994
1995
1996
1997
1998
1999
2000
2001
2002
2003
2004
2005
2006
Rural LA Valleys LA Urban LA Other LA Wales
Source: Mid year population estimates, Office for National Statistics Highlights • The population of Wales as a whole has grown by just over 3% since 1991. • All authority types except Valleys have seen an increase over the period. • Rural local authorities have consistently had the largest population growth. Since 1991. Rural
Authorities grown at nearly twice the Wales average rate. • The population of Valleys local authorities fell steadily in the period 1991 to 2002. Since then there has
been a steady slow increase. Over the whole period Valleys authorities have seen their population fall by just over 1%.
0
100
200
300
400
500
600
700
800
900
1,000
1991
1992
1993
1994
1995
1996
1997
1998
1999
2000
2001
2002
2003
2004
2005
2006
Rural LA Valleys LA Urban LA Other LA

63
Figure 6.2 Persons aged under 16 (thousands)
0
50
100
150
200
250
300
1991
1992
1993
1994
1995
1996
1997
1998
1999
2000
2001
2002
2003
2004
2005
2006
Rural LA Valleys LA Urban LA Other LA
Change from the 1991 base
-25%
-20%
-15%
-10%
-5%
0%
5%
10%
15%
20%
25%
1991
1992
1993
1994
1995
1996
1997
1998
1999
2000
2001
2002
2003
2004
2005
2006
Rural LA Valleys LA Urban LA Other LA Wales
Source: Mid year population estimates, Office for National Statistics
Highlights • Wales as a whole has seen a fall of nearly 5% in the number of children aged under 16 since 1991.
There was a slight rise in numbers in the early 1990s.
• For Rural Authorities the rise in the earlier part of the period is cancelled out by the later fall. This fall started later than in other authority types.
• The Valleys authorities have seen the largest fall in numbers of children (around 10%).

64
Figure 6.3 Persons aged 16 to 24 (thousands)
0
50
100
150
200
250
300
1991
1992
1993
1994
1995
1996
1997
1998
1999
2000
2001
2002
2003
2004
2005
2006
Rural LA Valleys LA Urban LA Other LA
Change from the 1991 base
-25%
-20%
-15%
-10%
-5%
0%
5%
10%
15%
20%
25%
1991
1992
1993
1994
1995
1996
1997
1998
1999
2000
2001
2002
2003
2004
2005
2006
Rural LA Valleys LA Urban LA Other LA Wales
Source: Mid year population estimates, Office for National Statistics
Highlights
• For Wales as a whole the number of people aged 16 to 24 fell steadily between 1991 and 1998. Since then the numbers have been steadily increasing. Overall the earlier falls have been cancelled out by the later rise.
• The Rural Authorities follow the Wales average trend closely.
• In the Urban local authorities the number of people in the age group has grown by around 15% over the period. The Urban Authorities still had a period of decrease in the early 1990s but was shorter and less severe than other authority types.

65
Figure 6.4 Persons aged 25 to 44 (thousands)
0
50
100
150
200
250
300
1991
1992
1993
1994
1995
1996
1997
1998
1999
2000
2001
2002
2003
2004
2005
2006
Rural LA Valleys LA Urban LA Other LA
Change from the 1991 base
-25%
-20%
-15%
-10%
-5%
0%
5%
10%
15%
20%
25%
1991
1992
1993
1994
1995
1996
1997
1998
1999
2000
2001
2002
2003
2004
2005
2006
Rural LA Valleys LA Urban LA Other LA Wales
Source: Mid year population estimates, Office for National Statistics
Highlights • For Wales as a whole the number of people aged 25 to 44 has fallen by around 5%. The number was
relatively stable between 1991 and 1998.
• The four local authority types all conform to this pattern.
• Rural and Valleys authorities fall slightly more than the Wales average. Urban and “Other” authorities rather less.

66
Figure 6.5 Persons aged 45 to 64 (thousands)
0
50
100
150
200
250
300
1991
1992
1993
1994
1995
1996
1997
1998
1999
2000
2001
2002
2003
2004
2005
2006
Rural LA Valleys LA Urban LA Other LA
Change from a 1991 base
-25%
-20%
-15%
-10%
-5%
0%
5%
10%
15%
20%
25%
1991
1992
1993
1994
1995
1996
1997
1998
1999
2000
2001
2002
2003
2004
2005
2006
Rural LA Valleys LA Urban LA Other LA Wales
Source: Mid year population estimates, Office for National Statistics
Highlights • This age group has seen the largest increases of all the age groups. With Wales as a whole growing
by around 20%.
• The Rural local authorities have the largest overall rise of just over 25%.
• Urban and Valleys authorities have the smallest rise at around 15%.

67
Figure 6.6 Persons aged over 64 (thousands)
0
50
100
150
200
250
300
1991
1992
1993
1994
1995
1996
1997
1998
1999
2000
2001
2002
2003
2004
2005
2006
Rural LA Valleys LA Urban LA Other LA
Change from a 1991 base
-25%
-20%
-15%
-10%
-5%
0%
5%
10%
15%
20%
25%
1991
1992
1993
1994
1995
1996
1997
1998
1999
2000
2001
2002
2003
2004
2005
2006
Rural LA Valleys LA Urban LA Other LA Wales
Source: Mid year population estimates, Office for National Statistics
Highlights • Overall the number of people aged over 64 has grown by just over 5%. The rate of growth seems to
increase from around 2000.
• Rural Authorities have had the highest rate of growth at just over 10% since 1991.
• Urban authorities have seen little growth in the numbers of elderly people since 1991. This authority type does not seem to have the increase in growth after 2000 seen in the rest of Wales.

68

69

70

71
Annex 1 “Rural Wales” – definitions and how to choose between them A common question for the Statistical Directorate is “what is rural Wales?” While the question is simple the answer has many facets. There are many sensible ways to consider rurality. The aim of this annex is to give an introduction to the range of options available and to help you make informed decisions about what sort of definition is appropriate for a particular task.
Highlights • There is no single definition that applies for all purposes. There are many options, which may be
more or less appropriate in different circumstances.
• Specifically, different definitions of rurality will be required when considering “rural people”, “rural land” and “rural activities”.
• Also there may be different definitions depending on whether, for example, we want descriptive statistics where we can accept a degree of fuzziness and funding mechanisms where we cannot.
Contents • An overview of the type of measures of rurality that are available
• Advice about how to choose between the various options
• Introduction to the National Statistics classification of settlement type and context
Types of rurality measures This section contains a brief introduction to the main types of rurality measures that we might use. The measures are presented in broadly the order of their complexity, starting with the simplest.
Sparsity measures In general we calculate the number of people living in a given unit of land (persons per square kilometre, for example). We then set a threshold below which areas are considered to be “sparse” or “rural”.
The key requirements are that we can define and measure the areas and that we can estimate their population. The simplicity of the approach and the likelihood that data are available to make the calculations are the great strengths of using a simple sparsity measure.
For example,
We might want to use the OECD density threshold of 150 persons per square kilometre. Applying this threshold at different scales will show the following shares of the Welsh population as living in sparsely populated areas.
• National – 100% (Wales average is 140 persons per square kilometre)
• Local authority – 33%
• Electoral division – 19%
• Census Output areas – 15%
However, the simplicity also means that these measures cannot reflect the subtleties of the distribution of population. The fact that two areas have similar numbers of people per square kilometre can conceal significant differences between areas. The following diagram shows this effect in a schematic way. We have two areas of the same size each with the same number of people. In one area the people are scattered evenly and in the other they cluster into a settlement (with the surrounding area empty).

72
Comparing the two local authorities of Anglesey and Denbighshire gives a practical example of this. In Anglesey most people live in small settlements that are quite evenly spaced across the island. In Denbighshire there is a densely populated coastal strip with a very sparsely populated hinterland. However, both authorities have around 100 persons per square kilometre.
Land use measures Classifications of land use – residential, industrial, commercial, agricultural, forestry, common land and so forth. It might also include land under statutory designations (such as National Parks or SSSI) or involved in environmental schemes. These measures will tell us about use of land (and perhaps some indication of environmental impact). They will not tell us about the people who live on or use the land. The planning and transport systems have their own land use classifications to meet their specific needs.
For example,
We can classify land as being in one of 4 categories that can be identified from definitive data that the Assembly holds.
• Registered for agricultural subsidy
• Forestry Commission estate (commercial and amenity)
• Legal status as common land
• Other (land not in one of the above categories including non-claiming agricultural land, private woodland, MOD firing ranges and domestic, industrial and commercial built up areas)
This allows a general summary of broad land use at, say, local authority level.
The main problem with these land use measure is to find definitive data sources. In the above example, the Assembly holds definitive information about all agricultural land for which the owner claims subsidy. This will exclude agricultural land for with no claim (although we know that in Wales this figure is small).
Settlement size measures Based around identifying individual settlements. These settlements may then be classified. Generally we would define as “rural” settlements with less than a given population. In the UK the figure of 10,000 persons is often used as the threshold, settlements of less than 10,000 people being “rural” and those with more than 10,000 people “urban”.
Two areas with the same number of persons per square kilometer

73
This type of measure allows us to take into account the difference between two areas when one has many small settlements and one has a few larger settlements but more empty land. The drawback of this type of measure is the lack of agreement of how to define “a settlement”. While there is broad agreement about general principals, these can be put into practice in many different ways. While a simple limit on settlement size is easy to understand and apply the main problem is that the threshold is essentially arbitrary.
For example,
The share of the population that lives in settlements of less than 10,000 people using statistical settlements defined by the Office for National Statistics
• Powys – 87%
• Ceredigion – 69%
• Caerphilly – 22%
• Swansea – 12%
• Cardiff – 3%
• Wales – 36%
• England – 19%
Dispersion measures Based on estimating the average distance between residents in an area and the centre of the area. This type of measure can show not only when people live outside the larger settlements but also how far these people need to travel. This allows the classification to take account of the fact that some Welsh authorities are not only relatively sparsely populated but that this sparseness is sustained over relatively large distances. Thus a dispersion measure would give very different values to the two areas in the diagram above.
The complexity of the measure means that there are a large number of ways to calculate it.
For example,
The Local Government distribution formula now includes a dispersion element from specially commissioned research.
Access measures This is a specific form of dispersion measure, adding further levels of complexity – and, hopefully, sophistication. The concept is to calculate travel time from individual households to a particular service delivery point. We can then use the calculated travel times to set up categories based on the share of the population in an area that is within a given time of the service.
The simplest method for doing this is to calculate the time it would take to drive in a car. This has the obvious disadvantage that not everyone has access to a car, however, it may still be useful as an upper limit. The travel time for people without a car cannot be less than the car drivers. However, building in the use of public transport leads to a great increase in the complexity of the calculations.
These measures are most appropriate when we want to assess access to a specific service – say a primary school or a general practitioner. It is more difficult to combine services to give a general feel of, for example, access to a range of key services. There are a number of ways to combine individual services to get an overall picture rather than a definitive method.

74
These access methods have the advantage of being an intuitively reasonable measure that people can understand. The two big disadvantages of this method are the resources needed to make the calculations and the need for highly accurate point data for the households and the services.
For example,
Considering the drive time to the nearest primary school for Welsh households (as at January 2007).
• 4% of Welsh households are more than 5 minutes drive from a primary school.
• 12% of Welsh households are within 5 minutes drive of a single primary school.
• 84% of Welsh households are within 5 minutes of at least 2 primary schools.
Specific modelling exercises Having a specific model can be an advantage because it ensures relevance but a disadvantage because of the extra resources needed to model each system.
For example,
The formula for the allocation of funds to Local Health Boards has a rural costs adjustment that is applied to 7.5% of expenditure. This corresponds to the travel intensive elements of community health services. This adjustment is based on a modification for Wales of a model estimating extra costs developed for the Scottish review of resource allocation (Fair Shares for All, Final Report, Scottish Executive Health Department, 2000).
Combinations To provide a general classification we might want to combine these measures into a single classification.
For example,
The National Statistics classification of settlement type and context in Wales and England. The context measure is based on the density of settlement at a range of scales. This classification is later in this bulletin.
Using rural measures That a range of different solutions can be adopted in a range of situations is not necessarily a problem. Flexibility can be important if it allows us to analyse statistics or target resources in an appropriate way. The most important thing is that a decision is made to assess a range of alternatives and to select the most appropriate.
A key question therefore is when the different types of measure are appropriate. To answer this we need to consider three factors.
• What is the measure trying to achieve?
• The availability, timeliness and quality of data.
• The appropriate level of complexity for the calculations.

75
Purpose Which particular “rural issues” are we trying to capture and what do we intend to use the classification for? If we are particularly interested in access to services issues, for example, we would use a different measure to one that is used to determine planning applications.
There are no magic “right” answers for this. There are many feasible options. The objective is to have a robust justification for our choice. Understanding what it is that we are trying to do and why we need to do it are the keys to this justification.
Data For the data to be used in the calculations there are four key issues to consider.
• Are the data available at a suitable scale and level of detail?
• Are the data sufficiently robust to be “fit for purpose”? No data set is perfect since they all have limitations. Are the limitations of a particular data set sufficient to undermine the credibility of the classification? A realistic consideration of data quality is essential if we are to avoid having “garbage in: garbage out”.
• Are the data timely or are they considerably out of date?
• Are the data updated sufficiently regularly to reflect important changes over time?
Complexity We need to strike a balance between the extremes of over simplification and over complication.
Simple systems are easy to use and can be transparent, stable and predictable. Their problem is that they cannot reflect the subtleties of the real world.
Conversely, a more complicated system can reflect more of the real world issues but this may be at the expense of clarity.

76
Annex 2 Lower Super Output Areas (LSOA) The Lower Super Output Areas form a part of a set of standard statistical geographies developed by the Office for National Statistics. The idea was to provide a stable building block for flexible analysis of data from the 2001 Census of Population and other National Statistics information.
The key characteristics of the Lower Super Output Areas are:
• They have approximately equal populations of around 1,500 persons.
• They will remain fixed at least until the 2011 Census of Population thus avoiding the problems of boundary changes.
• They are a common set of areas that can be used with many data sources.
• At the time that they were created the areas fitted within standard administrative areas such as local authorities and electoral divisions. As the administrative boundaries change the fit will no longer be exact, but a “best fit” can be developed.
• The areas were defined using a computer algorithm.
The main documentation for Lower Super Output Areas can be found on the Office for National Statistics web site.
www.statistics.gov.uk/geography/soa.asp
The Local Government Data Unit ~ Wales also has a useful introductory note.
www.dataunitwales.gov.uk/eng/Project.asp?id=SXCD19-A77FAE63

77
Annex 3 Key links and data sources General sites Welsh Assembly Government statistical information www.wales.gov.uk/statistics
From this general statistics home page you can find the various statistical outputs.
Publications. Reference publications such as “Welsh Agricultural Statistics”.
Headlines, bulletins and shorter documents on specific themes. Also “first releases” that announce new data.
www.statswales.wales.gov.uk
StatsWales is a web based statistical dissemination tool that allows users to access a range of statistical information in a flexible way.
The site also has pages that tell you what outputs are due to be published soon and lists recent additions.
Office for National Statistics www.ons.gov.uk
General information about National Statistics. Includes information about the Census of Population. Results from 2001 and planning for 2011. The “Neighbourhood Statistics” pages provide a source of local area information.
Local Government Data Unit ~ Wales www.dataunitwales.gov.uk
A body funded by the Welsh Assembly Government and the Welsh Local Government Association. It is designed to collect, analyse and disseminate information about local authorities. The Unit also helps to co-ordinate their information and to share good practice.
Wales Rural Observatory www.walesruralobservatory.org.uk
A research organisation funded by the Welsh Assembly Government. The web site shows the research projects and analyses that have been done. Specific sites Rural Wales – Definitions and How to Choose Between Them www.wales.gov.uk/statistics
Welsh Assembly Government Rural Development Plan www.wales.gov.uk/publications
National Statistics classification of settlement type and context www.statistics.gov.uk/geography/nrudp.asp
Welsh Index of Multiple Deprivation www.wales.gov.uk/wimd2005

78
Lower Super Output Areas Full documentation from the Office for National Statistics
www.statistics.gov.uk/geography/soa.asp
Introduction from the Local Government Data Unit ~ Wales
www.dataunitwales.gov.uk/ProductsServices.asp?cat=254
Census of Population 2001 A general introduction to Census data www.statistics.gov.uk/census/GetData/guidetodata.asp