rural development for cambodia: key issues and constraints
TRANSCRIPT

Rural Development for CambodiaKey Issues and Constraints
Cambodia’s economic performance over the past decade has been impressive, and poverty reduction has made significant progress. In the 2000s, the contribution of agriculture and agro-industry to overall economic growth has come largely through the accumulation of factors of production—land and labor—as part of an extensive growth of activity, with productivity modestly improving from very low levels. Despite these generally positive signs, there is justifiable concern about Cambodia’s ability to seize the opportunities presented. The concern is that the existing set of structural and institutional constraints, unless addressed by appropriate interventions and policies, will slow down economic growth and poverty reduction. These constraints include (i) an insecurity in land tenure, which inhibits investment in productive activities; (ii) low productivity in land and human capital; (iii) a business-enabling environment that is not conducive to formalized investment; (iv) underdeveloped rural roads and irrigation infrastructure; (v) a finance sector that is unable to mobilize significant funds for agricultural and rural development; and (vi) the critical need to strengthen public expenditure management to optimize scarce resources for effective delivery of rural services.
About the Asian Development Bank
ADB’s vision is an Asia and Pacific region free of poverty. Its mission is to help its developing member countries reduce poverty and improve the quality of life of their people. Despite the region’s many successes, it remains home to two-thirds of the world’s poor: 1.8 billion people who live on less than $2 a day, with 903 million struggling on less than $1.25 a day. ADB is committed to reducing poverty through inclusive economic growth, environmentally sustainable growth, and regional integration.
Based in Manila, ADB is owned by 67 members, including 48 from the region. Its main instruments for helping its developing member countries are policy dialogue, loans, equity investments, guarantees, grants, and technical assistance.
Rural Developmentfor Cambodia
Rural Developmentfor CambodiaKey Issues and ConstraintsKey Issues and Constraints
Printed on recycled paper Printed in the Philippines
Asian Development Bank6 ADB Avenue, Mandaluyong City1550 Metro Manila, Philippineswww.adb.org

Rural Development for CambodiaKey Issues and Constraints
Printed on recycled paper.
© 2012 Asian Development Bank
All rights reserved. Published 2012.Printed in the Philippines.
ISBN 978-92-9092-570-5 (Print), 978-92-9092-571-2 (PDF)Publication Stock No. RPT114168
Cataloging-In-Publication Data
Asian Development Bank. Rural development for Cambodia: Key issues and constraints.Mandaluyong City, Philippines: Asian Development Bank, 2012.
1. Rural development. 2. Cambodia. I. Asian Development Bank.
The views expressed in this publication are those of the authors and do not necessarily reflect the views and policies of the Asian Development Bank (ADB) or its Board of Governors or the governments they represent.
ADB does not guarantee the accuracy of the data included in this publication and accepts no responsibility for any consequence of their use.
By making any designation of or reference to a particular territory or geographic area, or by using the term “country” in this document, ADB does not intend to make any judgments as to the legal or other status of any territory or area.
ADB encourages printing or copying information exclusively for personal and noncommercial use with proper acknowledgment of ADB. Users are restricted from reselling, redistributing, or creating derivative works for commercial purposes without the express, written consent of ADB.
Note:In this publication, “$” refers to US dollars.
Asian Development Bank6 ADB Avenue, Mandaluyong City1550 Metro Manila, PhilippinesTel +63 2 632 4444Fax +63 2 636 2444www.adb.org
For orders, please contact: Department of External RelationsFax +63 2 636 [email protected]
iii
Contents
List of Tables, Figures, and Box� v
Currency Equivalents viii
Abbreviations viii
Glossary ix
Ex�ecutive Summary x
I. Introduction 1
II. Performance of the Agriculture and Rural Sectors 3
A. Trends in Poverty and Inequality 3
B. Growth Trends in the Rural Sector 6
C. Sources of Rural Economic Growth 16
1. Growth in Land under Production 16
2. Growth in the Rural Labor Force 18
3. Increases in Productivity 19
4. Private and Public Investment in Development 21
D. The Finance Sector 32
III. Evolution of Rural Development Policies for Economic Growth and Poverty Reduction 41
A. Rural Development Policies 41
1. Strategy for Agriculture and Water 44
2. Strategic Framework for Decentralization and Deconcentration 46
3. Social Services Policies 48
B. Impact of Rural Development Policies 51
IV. Public Ex�penditure Review of the Rural Development Ministries 52
A. Overall Macroeconomic Environment 52
B. Public Expenditure on Rural Development 57
C. Public Expenditure Efficiency and Impact Analysis 67
1. Incidence of Tax Expenditure 72
2. Consistency of Public Expenditure with National Strategies 73
3. Public Expenditure Policy Options 75

Contentsiv
V. Governance, Competitiveness, and Institutional Issues in Rural Development 78
A. Governance Issues 78
B. The Business-Enabling Environment and Competitiveness 81
C. Policy and Institutional Issues 86
1. Agriculture Sector 90
2. Analysis of the Organizational and Institutional Structure of the Ministry of Agriculture, Forestry and Fisheries 91
3. Water Sector 94
4. Analysis of the Organizational and Institutional Structure of the Ministry of Water Resources and Meteorology 95
5. Rural Infrastructure Sector 97
6. Institutional Issues with Farmer Organizations 98
7. Planning, Budgeting, and Financial Management Activities and Systems 99
8. Salary Supplementation and Allowances 101
VI. Binding Constraints to Rural Development 102
VII. Cause-and-Effect Analysis for Rural Development and Public Financial Management in the Sector 108
A. Key Issues and the Identification of the Core Problem 108
1. The Core Problem 108
2. Impacts of the Core Problem 111
3. Turning Problems into Solutions: The Objective Tree and Improved Sector Outputs 111
B. Strengthening the Agriculture and Water Sectors: Program Components and Logical Framework 113
C. Strengthening Public Financial Management for Rural Development: Program Components and Logical Framework 120
References 127

v
Tables, Figures, and Box
Tables
1 Main Poverty Trends in Cambodia, 1993/94–2004 3
2 Changes in Poverty Incidence in Cambodia, 2004–2007 3
3 Breakdown of Real Gross Domestic Product by Sector, 2003–2008 8
4 Official Gross Domestic Product of Cambodia, 2000–2009 9
5 Composition of Agricultural Gross Domestic Product in Cambodia 12
6 Top Five Employers by Sector, 2007 13
7 Small Industrial Establishments in Cambodia, 2006 14
8 Provincial Distribution of Small Industrial Establishments in Cambodia, 2006 15
9 Inventory of Irrigation Systems in Cambodia, 2007 18
10 Yields and Area of Selected Crops in Cambodia, 1985–2007 21
11 Indicators of Factor Productivity in Selected Countries in Asia 22
12 Foreign Direct Investment in Cambodia, 1997–2008 25
13 Number of Official Development Assistance Projects in Cambodia, 2007 and 2010 27
14 Nongovernment Organization Disbursement by Sector, 2007 28
15 Nongovernment Organization Disbursement by Sector, 2008–2009 29
16 Development Partner Activities, 2007 31
17 Infrastructure Services Coverage in Cambodia and Neighboring Countries, 2001–2007 32
18 Deposits and Loans in Cambodia’s Financial Institutions, 2008 and 2009 33
19 Finance and Credit by Sector, 2003–2009 36
20 Status of Financial Institutions in Cambodia, March 2008 37
21 Sources of Financing in Cambodia, 2004 38
22 Purpose for Borrowing Money in Cambodia, 2004 38
23 Interest Rates on Loans in Cambodia, 2004 39
24 Agriculture and Water Management: Summary of Strengths, Weaknesses, Opportunities, and Threats Analysis 45
25 Distribution of Expenditure for the Executed State Budget by Function and Economic Sector, 1996–2010 58
26 Ministry of Agriculture, Forestry and Fisheries: Breakdown of Government-Funded Capital Expenditure 62
27 Broad Distribution of the Central Ministry of Agriculture, Forestry, and Fisheries Budget 63
28 Donor Total Shares of Resource Provision in the Ministry of Agriculture, Forestry and Fisheries 64

Tables, Figures, and Boxvi
29 Ministry of Water Resources and Meteorology: Breakdown of Government-Funded Capital Expenditure 64
30 Consolidated Resource Allocation to Irrigation by Government and Donors 65
31 Recurrent Expenditure of the Rural Roads Department 65
32 Ministry of Rural Development: Breakdown of Government-Funded Capital Expenditure 65
33 Commune/Sangkhat Funds Total Resources Managed by Councils, 2002–2010 66
34 Consolidated Resource Allocation to Rural Roads by Government and Donors 66
35 Key Outputs Achieved in the Ministry of Agriculture, Forestry and Fisheries; Ministry of Water Resources and Meteorology; and Ministry of Rural Development, 2002–2009 68
36 Comparison of Actual Spending with the Agriculture Sector Strategic Development Plan, Strategy for Agriculture and Water, and National Strategic Development Plan 74
37 Actual and Optimal Balance between Recurrent and Investment Expenditures 75
38 Indicative Cost–Benefit Ratios 77
39 Business Environment in Cambodia Compared with Regional Competitors 83
40 Provincial Business Environment Scorecard, 2007 83
41 Government Organizations with Agriculture and Water Management Roles 87
42 Final Goal and Output: Harmonized Logical Framework for Rural Development 116
43 Logical Framework for Public Financial Management in Rural Development 121
Figures
1 Changes in per Capita Consumption in Cambodia, 1994–2004 4
2 Gini Coefficients of Real per Capita Consumption by Quartile Groups, 1993–2004 5
3 Gini Coefficients of Real per Capita Consumption, 1994–2007 6
4 Poverty Rates By Province in Cambodia, 2004–2007 7
5 Cambodia’s Gross Domestic Product Growth Rates, 2005–2011 9
6 Share of Sector Gross Domestic Product in Cambodia, 1990–2008 10
7 Labor Force Participation in Cambodia by Sector, 1993–2008 11
8 10-Year Land Area, Total Production, and Yield for Paddy and Vegetables in Cambodia, 1998–2007 17
9 10-Year Land Area, Total Production, and Yield for Maize and Cassava in Cambodia, 1998–2007 20
10 Gross Domestic Capital Formation in Cambodia, 1990–2008 22
11 Foreign Direct Investment and External Assistance in Cambodia, 1993–2007 24
12 Foreign Direct Investment in Cambodia by Source, 2007–2008 25
13 Rectangular Strategy for Growth, Employment, Equity, and Efficiency, Phase II 26
14 Agricultural Growth and Government Investment Share in Cambodia, 1990–2007 30
15 Growth of Private Sector Credit in Cambodia, 2007–2009 34
16 Strategy for Agriculture and Water Resources, 2009–2013 Implementation Pillars 47
17 Inflation and Current Account Balance for Cambodia, 1990–2007 52

Tables, Figures, and Box vii
18 Cambodian National Government Deficits, 1990–2007 53
19 Government Expenditure by Type of Service, 1994–2007 53
20 Government Expenditure by Economic Activity, 1994–2007 54
21 Fiscal Indicators, 2005–2009 54
22 Government Recurrent Expenditure in Nominal and Real Terms, 2000–2009 55
23 Government-Financed Capital Expenditure in Nominal and Real Terms and Capital Expenditure–Recurrent Expenditure Ratio, 2000–2008 56
24 Recurrent Expenditure in Nominal and Real Terms of the Rural Development Ministries, 2000–2009 59
25 Combined Recurrent Expenditure as a Share of Total Government Expenditure in the Rural Development Ministries, 2000–2009 60
26 Recurrent Expenditure–Agricultural Gross Domestic Product Ratios of the Rural Development Ministries, 2000–2008 60
27 Capital Expenditure in Nominal and Real Terms of the Rural Development Ministries, 2004–2009 61
28 Budget Execution Rates by Ministry, 2000–2009 63
29 Unit Costs for Extension, Irrigation, and Rural Roads, 2004–2009 69
30 Trends in Cost–Benefit Ratios for Extension, Irrigation, and Rural Roads, 2000–2009 70
31 Imports of Fertilizer and Tractors, Quantities, and Volumes, 2002–2009 72
32 Incidence of Tax Expenditure 73
33 Relative Performance of Cambodia in Governance Indicators, 1996–2007 and against Selected East Asian Countries, 2007 79
34 Relative Performance of Cambodia in Global Competitiveness Indicators against Selected East Asian Countries, 2007–2008 82
35 Provincial Business Environment Scorecard, 2009 84
36 Relative Performance of Cambodia in Tax Administration and Tax Rate Indicators against Selected East Asian Countries 85
37 Organogram for the Ministry of Agriculture, Forestry and Fisheries, 2009 88
38 Organogram for the Ministry of Water Resources and Meteorology, 2008 89
39 Organogram for the Ministry of Rural Development 90
40 Growth Diagnostics for Cambodia, Binding Constraints, and Interlinks 103
41 Rural Development Problem Tree 109
42 Problem Tree for Public Financial Management Reform in Rural Development 110
43 Rural Development Objective Tree 112
44 Strategy for Agriculture and Water Resources, 2009–2013 Implementation Pillars 114
Box�
1 Key Commitments of the National Strategic Development Plan, 2006–2010 42

viii
Currency Equivalents(as of December 2011)
Currency unit – riel (KR)
KR1.00 = $0.000245821
$1.00 = KR4,068.70
AbbreviationsADB – Asian Development Bank
AQIP – Agricultural Quality Improvement Project
BSP – budget strategic plan
CAAEP – Cambodia–Australia Agricultural Extension Project
CDC – Council for the Development of Cambodia
COM – Council of Ministers
CSES – Cambodia Socio-Economic Survey
CSF – commune/sangkhat fund
EIC – Economic Institute of Cambodia
FDI – foreign direct investment
FMIS – Financial Management Information System
FMM – Financial Management Manual
FWUC – farmer water user community
GDP – gross domestic product
ICT – information and communication technology
IFC – International Finance Corporation
IMF – International Monetary Fund
LMAP – Land Management and Administration Project
MAFF – Ministry of Agriculture, Forestry and Fisheries
MDG – Millennium Development Goal
MEF – Ministry of Economy and Finance
MOWRAM – Ministry of Water Resources and Meteorology
MRD – Ministry of Rural Development
MTR – Medium Term Review
NAA – National Audit Authority
NGO – nongovernment organization
NIS – National Institute of Statistics
NRDP – Northwest Rural Development Program

Abbreviations ix
PFM – public financial management
PFMRP – Public Financial Management Reform Program
PRC – People’s Republic of China
RGC – Royal Government of Cambodia
SEDP – socioeconomic development plan
SMEs – small and medium-sized enterprises
SOP – standard operating procedure
ToT – training of trainers
TWGAW – Technical Working Group on Agriculture and Water
Glossaryprahok – fish paste
prakas – declaration
sangkhat – commune
x
Executive Summary
Cambodia’s economic performance over the past decade has been impressive, and poverty has been reduced. Over the past 10 years, economic growth has averaged 9.7% per annum, while from 2004 to 2007, it averaged nearly 11.0%. The fallout of the global financial crisis pushed gross domestic
product (GDP) growth to almost zero in 2009 for the first time, but forecasts are for a return to higher positive growth in 2010–2011. At the same time, poverty has fallen (around 10 percentage points in a decade), going from 35.0% in 2004 to 30.1% in 2007. As a result of such economic development, income per capita increased from $250 in 1998 to $795 in 2008.
Agriculture continues to be the mainstay of the economy, but garments, tourism, and construction have contributed more to GDP growth. Structural changes in the economy have shifted it from agriculture into industry and services, while exports have increased from almost 0 to 65.0% of GDP in 2007. Further, inflows of foreign direct investment in all sectors in recent years have made the country somewhat less aid-dependent, and increasing levels of domestic savings have deepened the country’s ability to sustain its own growth.
In the last decade, the contribution of agriculture and agro-industry to overall economic growth has come largely through the accumulation of factors of production—land and labor—as part of extensive growth of activity, with only modest improvement in productivity from very low levels. Rice is still the overwhelmingly predominant crop, but there is some diversification and regional specialization as farmers take advantage of agro-ecological systems and market opportunities.
Despite these generally positive signs, there is justifiable concern about Cambodia’s ability to seize the opportunities presented. Structural and institutional constraints to agricultural and rural development exist that, unless addressed by appropriate interventions and policies, will result in a slowing of economic growth and poverty reduction. These constraints include (i) insecurity in land tenure, which constrains investment in productive activities; (ii) low productivity in land and human capital; (iii) market failures and coordination issues, and a business-enabling environment that is not conducive to formalized investment; (iv) weak and underdeveloped rural roads and irrigation infrastructure; and (v) a finance sector that is unable to mobilize funds for agricultural and rural development.
The purpose of this report is to produce a concise, analytically based analysis that will (i) diagnose the underlying structure of the rural economy and its evolving links to urban and peri-urban centers; (ii) identify the binding structural and institutional constraints to faster rural development and reductions in poverty and income inequality; and (iii) propose some remedial policy priorities for Asian Development Bank (ADB) support to strengthen governance arrangements and institutional processes in public financial management (PFM) to contribute to poverty reduction.
The main sources of rural economic growth in Cambodia come from (i) growth in land under production; (ii) growth in the rural labor force; (iii) modest gains in agricultural productivity mainly in non-rice crops; (iv) public and private investment in agriculture and rural infrastructure (i.e., transport, irrigation, and processing); as well as (v) substantial investment in social infrastructure such as health, education, and sanitation.
Achieving the Millennium Development Goal target for poverty reduction (20% of the population by 2015) will require average economic growth of 7.5% per annum from 2008 to 2015, inflation in the range of 3%, and no change in the distribution of income between urban and rural families. If inequality between rural and urban areas increases, higher growth may be necessary to achieve this target. This will not be easy, with one-half of the population under 20 years of age, more than 85% of employment in the informal sector, and the relatively

Executive Summary xi
high rural poverty rate. Thus, increasing the efficiency of public resources targeted for rural development and increasing private sector-led economic opportunities in rural areas will be crucial.
The Government of Cambodia has adopted a multipronged approach to foster rural development and to empower local communities to plan and manage their development. The decentralization and deconcentration of public services delivery; support for participatory decentralized, area-based programs; and provision of credit to households and small businesses are some of the highlights of these efforts.
The government’s strategy for agricultural and rural development has been articulated in a number of strategies and programs starting in 1994, which have also been continually updated. In 2004, it adopted the Rectangular Strategy for Growth, Employment, Equity and Efficiency as the framework for the country’s socioeconomic development. Founded on the platforms of good governance, peace, political stability, social order, macroeconomic stability, partnership, and economic integration, the Rectangular Strategy focuses on critical development issues such as the enhancement of the agriculture sector, rehabilitation and construction of physical infrastructure, private sector development and employment generation, and capacity development and human resources development.
Similar to the Rectangular Strategy, the National Strategic Development Plan, 2006–2010 (updated for 2009–2013) has the overall aim of poverty reduction, and serves as the guiding document for implementation of the Rectangular Strategy. In it, the government indicated that the overall goal is poverty reduction and economic growth through enhancement of agriculture sector development. The sector goal is to ensure food security; increase incomes; create employment; and improve nutrition for all by improving productivity, diversification, and commercialization of agriculture with environmentally sound protection and food security. In addition, the plan recognizes the need to address rural development and makes improving the lives and livelihoods of the rural poor a top priority. Agricultural productivity improvement is the core strategy to meet this need.
Two sector-specific development plans are also relevant in the context of rural development and the agriculture sector: the Agriculture Sector Strategic Development Plan, 2006–2010 and the Strategy for Agriculture and Water, 2006–2010 (updated for 2010–2013).
Under these policies, the government has recognized the importance of growth and diversification within the agriculture and rural sectors to drive the economy and shift the focus from food security to diversification and commercialization. However, while the policies have been well articulated and are a sound basis for development, there has been a disconnect between the development of policies at the national level and their implementation at the local level.
Rural development ministries such as the Ministry of Agriculture, Forestry and Fisheries (MAFF); Ministry of Water Resources and Meteorology (MOWRAM); and the Ministry of Rural Development (MRD) play key roles in subnational activities. In 2005, the Strategic Framework for Decentralization and Deconcentration was developed to guide the process of governance reform at provincial, district, and commune levels. This framework established the basic principles and scope for a comprehensive decentralization program. This program now forms part of the good governance strategy of the national strategic development plan. In May 2008, the Organic Law was also passed, requiring the establishment of new subnational structures and systems and reassigning functions and resources between national and subnational levels.
During 2000–2008, total government expenditure grew faster than the economy, and capital expenditure faster than recurrent expenditure. There has been steady growth in the government recurrent budget, with real increases exceeding 14% annually during 2006–2008. On average, government recurrent expenditure, in real terms, increased by 10.1% during 2000–2008, which was above the trend rate of growth in GDP. The government recurrent expenditure–GDP ratio remained broadly unchanged over same period, at 8.0%–9.0%.

Executive Summaryxii
The government capital budget has taken on increased importance. Appropriations to the government capital budget have increased each year, increasing at an annual average rate of 17.0% in real terms from 2004 to 2008. The government capital expenditure–government recurrent expenditure ratio has also increased. Taken together, government recurrent and capital expenditure, as a proportion of GDP, increased from 8.9% in 2005 to 9.8% in 2008.
Of particular concern for rural development is that the line ministries that support rural development in Cambodia are currently some of the most underfunded ministries. MAFF, MOWRAM, and MRD have significant shortages of qualified staff members that affect effective service delivery in rural areas, reducing economic opportunities for the rural poor. Inadequate budget resources are also deterring progress in rural development. Public investment in agriculture averaged 2.6% of total government expenditure since 2000, and donor funds have grown in recent years but still remain low. While there are major difficulties in accurately estimating what portion of public resources go to rural development or the rural population, based on available data, it ranged from 1.4% to 1.9% over 2006–2010. This has increased from 0.5% in the mid-1990s.
Although MAFF, MOWRAM, and MRD have experienced large increases in recurrent government spending on agriculture, irrigation, and rural roads, this does not reflect any increased priority in recurrent spending for the sectors. MAFF, which, as a service provider, is most dependent on its recurrent budget, has the largest recurrent budget (KR65.8 billion in 2008), followed by MRD (KR45.2 billion) and MOWRAM (KR25.8 billion). Annual recurrent expenditure growth rates during 2000–2008 for MRD (21.4%) and MOWRAM (15.1%) exceeded the total recurrent budget growth rates in real terms, while MAFF recurrent grew at 9.2%. MAFF’s share of total government recurrent expenditure declined from 2.4% in 2004 to 1.7% in 2008. MAFF and MOWRAM’s combined share of total recurrent expenditure peaked at 3.1% in 2006, and declined to 2.4% in 2008. MRD’s share of total recurrent was 1.2%–1.3% in recent years.
Irrigation and rural roads have been given priority in the small but expanding government capital budget. MOWRAM’s capital expenditure increased from KR17.9 billion in 2004 to KR148.7 billion in 2009. MRD’s capital expenditure grew from KR64.7 billion to KR87.5 billion over the same period. Since they have been tasked with provisioning key infrastructure, the government capital budget is more important than recurrent expenditure for MOWRAM and MRD. MAFF effectively has no capital budget. It has received no funds for construction and equipment since 2004.
Improvements in PFM, public administration reforms, and decentralization and deconcentration have been identified as key governance initiatives in Cambodia. The Rectangular Strategy and national strategic development plans have underlined the need to improve governance environment through effective implementation of the Governance Action Plan I and II. These plans stress five crosscutting reform areas: (i) administrative reform and anticorruption; (ii) legal and judicial reform; (iii) decentralization, deconcentration, and police affairs reform; (iv) economic and finance reform; and (v) social development (including poverty reduction, food security, education, health, and rural development). Regarding rural development, they stress armed forces reform, land policy reform, and natural resources management. The government is aware that its implementation will be a challenge, as will the time required to develop new institutional capacities and competencies, and accountability institutions.
Unfortunately, MAFF, MOWRAM, and MRD currently use an incremental approach to planning and budgeting that relies on donor financing for most new investment projects. Government recurrent expenditure arising out of existing and proposed activities on donor-financed projects is usually underfunded, adversely impacting on service delivery to the poor. The focus of these ministries is on projects, which creates a vacuum for policy and budget strategizing. In addition, there are overlaps of responsibilities in the three ministries. They suffer from weak interministerial and intraministerial coordination mechanisms, and tend to operate within “policy silos.” In the future, it will be important for the three ministries to harmonize their rural development efforts and avoid policy overlap.

Executive Summary xiii
Another issue in these ministries is the low level of salaries available to government staff, including at the director level and even above, forcing many to take on additional jobs. Work alternatives are provided by private sector hiring or by externally funded projects where the remuneration is higher. Thus, (i) staff members are not available to work within departments of the ministry unless special funding is available; (ii) they do not obtain experience in their field through the ministry, only through working outside; and (iii) while the capacity of individuals may be improved, institutional capacity is not advanced.
The key areas of weakness related to PFM in the three line ministries are (i) weak links among their policies, programs, and budget process; (ii) program duplication (i.e., unrealistic budget estimation without identified sources of funding); and (iii) inadequate budget execution process, including lack of effective internal control in procurement processes. An ADB assessment of MRD conducted in May–June 2007 found that MRD’s financial and accountability systems needed urgent strengthening. Further, the capacity for effective internal audits in the line ministries remains low.
However, the government has made major progress toward establishing accountability and oversight mechanisms. The Law on Audit was adopted in 2000 and the National Audit Authority was set up in 2002 as the supreme audit institution in Cambodia. Internal audit departments have been established in 36 line ministries and agencies, and more timely audits have begun to enhance budgetary accountability. The Law on Access to Public Information is under preparation, and considerable efforts have been made to get the population involved in local service delivery and to participate in policy deliberations. A law guaranteeing press freedom has been adopted, and the media regularly report incidents of corruption and other public policy issues. Institutions working as corruption watchdogs have been restructured and strengthened. In addition, the adoption of the Anti-Corruption Law in March 2010 is a significant milestone.
Public administration reforms, including attractive pay and other incentives for the civil service, have a strong link to PFM that entail probity and higher-level commitments. The Council of Administrative Reforms has undertaken several initiatives in this regard. The government has also embarked on a series of reform measures fostering decentralization to help improve service delivery, bolster accountability, and encourage popular participation in the development process.
Many factors constrain the development of a highly profitable rural sector in Cambodia. Basically, the critical constraints fall into five main areas: (i) low levels of technology adoption and the human capital required to utilize such technology; (ii) poor infrastructure (i.e., rural roads; irrigation; and postharvest storage and handling, processing, transport, and logistics); (iii) microeconomic risks to appropriation of returns (i.e., property rights, corruption, and the business-enabling environment related to taxation and fees); (iv) difficulties in coordinating markets and marketing through formalized mechanisms of exchange; and (v) difficulties in accessing finance for agricultural investments, including the high cost of finance relative to the economic returns to investment in agriculture and agro-industry.
Fundamentally, the underdeveloped nature of infrastructure and its unequal access are primary binding constraints to rural development and poverty reduction. However, only when the fiscal situation sufficiently improves will the government be able to allocate more resources to infrastructure investment. Improved infrastructure alone is not enough to lower the cost of doing business and to stimulate private investment—it must to be accompanied by improvements in investor confidence, which can be done through the government adequately addressing governance concerns by implementing initiatives aimed at reducing corruption and by strengthening the rule of law. Yet to ensure that growth can be sustained at a high level similar to that achieved by many Southeast and East Asian economies in recent decades, the government will also need to address the market failures (e.g., information and coordination externalities) to encourage investments in diversifying and expanding the manufacturing sector and agro-based exports, and in upgrading the level of technology.
Security of land tenure is a precondition for investment in productive activities. Well-defined property right improves private appropriability of returns, and owners with secure land titles are more willing to invest

Executive Summaryxiv
in higher-risk and potentially higher-payoff activities (e.g., irrigation and drainage systems, perennial trees, and vegetable and cash crops). Land titles enable titleholders to use these as collateral for production and working capital loans. The evidence demonstrates that secure land tenure on private plots raises revenue, yields, productivity, rental value and sales value, as well as household consumption.
The poor can benefit most from improvements in agricultural productivity and technology. The huge potentials in agriculture can only be tapped through better-informed farming practices to increase yield (thus production) with minimal effort, even without a quick expansion in cultivated land. Agricultural productivity of the major staple crop, rice, is far from its full potential and can be increased substantially. A clear, coherent strategy for rice needs to be formulated around the dual objective of achieving food security and exporting. Productivity can be improved by introducing new seeds, using fertilizers and pesticides, and improving irrigation and drainage systems.
To leverage the benefits from improved productivity and technology, the poor can benefit from increased access to education and vocational opportunities. Schooling has high returns to individuals in terms of increased earnings, and there is a direct correlation between higher levels of education and higher average incomes and standards of living. In addition to formal education systems, opportunities for adult education in terms of agricultural extension and business training will provide substantial benefits to the rural population.
The inadequate road system is a major bottleneck to economic development. Investment in rural roads yields high returns to poverty reduction in developing countries. Improving rural roads will help rural populations gain access to key services, including education and health, and improve opportunities for nonfarm income-generating activities. Further, investments in irrigation and drainage infrastructure will reduce climatic risk, reduce yield volatility, and provide food and income security to agriculture-based households. The government and donors have already invested heavily in irrigation-based infrastructure. This development assistance focus should continue, and ADB (among many other donors) has already indicated a long-term commitment to irrigation infrastructure development.
Executive Summary xv
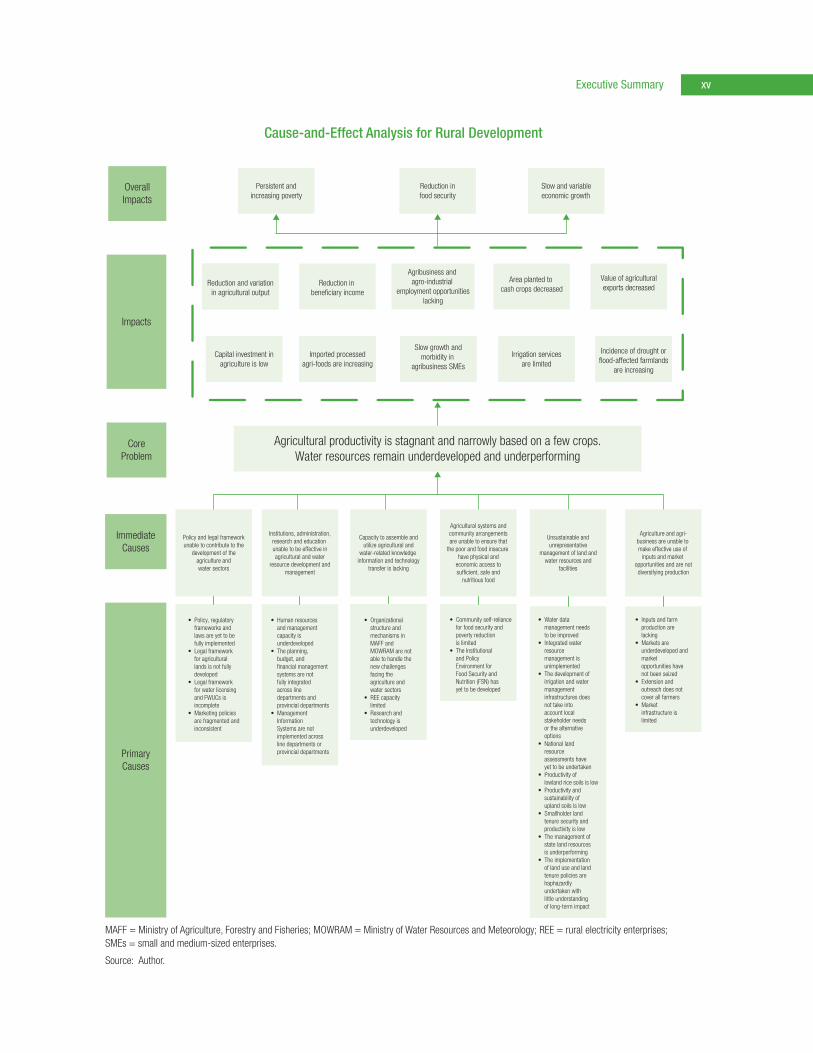
Cause-and-Effect Analysis for Rural Development
ImmediateCauses
PrimaryCauses
CoreProblem
Impacts
OverallImpacts
Policy and legal frameworkunable to contribute to the
development of theagriculture andwater sectors
Capacity to assemble andutilize agricultural and
water-related knowledge information and technology
transfer is lacking
Agricultural productivity is stagnant and narrowly based on a few crops.Water resources remain underdeveloped and underperforming
Persistent andincreasing poverty
Reduction infood security
Slow and variableeconomic growth
Reduction and variationin agricultural output
Reduction in beneficiary income
Agribusiness and agro-industrial
employment opportunitieslacking
Area planted to cash crops decreased
Value of agriculturalexports decreased
Capital investment inagriculture is low
Imported processedagri-foods are increasing
Slow growth andmorbidity in
agribusiness SMEs
Irrigation servicesare limited
Incidence of drought orflood-affected farmlands
are increasing
Institutions, administration,research and education unable to be effective inagricultural and water
resource development andmanagement
Agricultural systems andcommunity arrangementsare unable to ensure that
the poor and food insecure have physical and
economic access tosufficient, safe and
nutritious food
Unsustainable andunrepresentative
management of land andwater resources and
facilities
Agriculture and agri-business are unable to make effective use of
inputs and market opportunities and are notdiversifying production
• Policy, regulatory frameworks and laws are yet to be fully implemented• Legal framework for agricultural lands is not fully developed• Legal framework for water licensing and FWUCs is incomplete • Marketing policies are fragmented and inconsistent
• Human resources and management capacity is underdeveloped• The planning, budget, and financial management systems are not fully integrated across line departments and provincial departments• Management Information Systems are not implemented across line departments or provincial departments
• Organizational structure and mechanisms in MAFF and MOWRAM are not able to handle the new challenges facing the agriculture and water sectors• REE capacity limited• Research and technology is underdeveloped
• Community self-reliance for food security and poverty reduction is limited• The Institutional and Policy Environment for Food Security and Nutrition (FSN) has yet to be developed
• Inputs and farm production are lacking• Markets are underdeveloped and market opportunities have not been seized• Extension and outreach does not cover all farmers• Market infrastructure is limited
• Water data management needs to be improved• Integrated water resource management is unimplemented • The development of irrigation and water management infrastructures does not take into account local stakeholder needs or the alternative options• National land resource assessments have yet to be undertaken• Productivity of lowland rice soils is low• Productivity and sustainability of upland soils is low• Smallholder land tenure security and productivity is low• The management of state land resources is underperforming• The implementation of land use and land tenure policies are haphazardly undertaken with little understanding of long-term impact
MAFF = Ministry of Agriculture, Forestry and Fisheries; MOWRAM = Ministry of Water Resources and Meteorology; REE = rural electricity enterprises; SMEs = small and medium-sized enterprises.
Source: Author.

Executive Summaryxvi
Cause-and-Effect Analysis for Public Financial Management
Limited qualified staff to establish and implement explicit policies, procedures, and
reporting requirements
Overlapping mandates between a number of agencies
PFM and public administration reforms in infancy
Insufficient fiscal checks and balances andlimited accessibility to public finances
PBB is bargained rather than formula-based
MEF annual budget bears little relation tooriginal PBB planning and budgeting
Continuing inefficiencies in administeringrevenue collection and enforcing compliance
Inefficient payroll and salary establishment control
Unrealistic projections for budget allocation andlimited resources to finance budget
Limitations in the quality of external auditfunction and culture of nonresponse by
management of audited entities
Budget leakages—recording of transactions andpreparation of accounts subject to inaccuracies
and are noncompliant
Limited capacity of parliamentary oversight and accountability systems
PFM policy, legal framework, andbudget control has limited
procedural and resourcing support
Losses and poor value for money
from procurement inefficiencies
Abuse of shopping procedures
Narrow tax base
No international standard acceptable procurement
framework—tax administration system
needs further strengthening
Limited compliance with procurement rules and
regulations
Mis-procurement (use of force account)
Poor procurement underlocal competitive bidding
Anticorruption policy is notfully operationalized anddecentralized throughspecific procedures
and controls
Current procedures have limited control over
endogenous abuse of exogenous pressure
Capacity development inStage 1 of PFMRP was
limited—reform impetus yet to be fully achieved in
line ministries and subnationalministries
ADB’s A-C Policy not fullyreflective of the reality ofthe country, the EA, and
the project
Inadequate sanctions forfraudulent and corrupt
activity
ADB projects are perceived as low quality
and fuels abuse
Anticorruption policy is sound but has no measurable impact
Reduced investment and funding pledges by international private sector and donor community in support of Cambodia’s economic and
development opportunities
Slow and variableeconomic growth
Persistence and highrural poverty levels
Low capital investmentin private sector
Low service delivery levelsand industry output
Employment opportunities limited
Low probability to meetsocial progress in MDGs
Unpredictable funds releasecreates system of arrears
ImmediateCause
PrimaryCause
CoreProblem
Impacts
OverallImpacts
Pro-poor development initiativesunsustainable/low value for money
ADB = Asian Development Bank, EA = executing agency, MEF = Ministry of Economy and Finance, PBB = program-based budgeting, PFM = public financial management, PFMRP = Public Financial Management Reform Program.
Source: Author.

1
I. Introduction
Cambodia’s economic performance over the past decade has been impressive, and poverty reduction in the country has made significant progress. Over the past 10 years, economic growth has averaged 9.7% per annum, while from 2004 to 2007, it averaged nearly 11.0%. At the same time, poverty has
been reduced significantly (around 10 percentage points in a decade) and continues to fall, from 35.0% in 2004 to 30.1% in 2007 (Knowles 2006, 2008). As a result of economic development, income per capita increased from $250 in 1998 to an estimated $795 in 2008 (ADB 2009b).
Despite the main sources of growth being in nonagriculture sectors, agriculture still remains a large sector of the economy, comprising 32.5% of gross domestic product (GDP) and absorbing 59.0% of the total labor force (ADB 2009b). Growth in agriculture has been volatile but continued to be low at 5.0%–5.5% of GDP for 2006–2008. In contrast, growth in industry and services has been double that, although concentrated in the garments, tourism, and construction sectors. Exports have increased from almost zero to 65.0% of GDP in 2007, slightly falling to 52.7% in 2008 due to the impact of the global financial crisis (ADB 2009b).
However, there is concern that this growth has not benefited a large proportion of the population and that sustaining this rapid growth and reducing poverty will prove difficult. Rodrik (2007) noted that the policies required to sustain growth are different from those to initiate it, and experience from other countries shows that very few1 have managed to achieve sustained growth over the longer term. Cambodia still has weak infrastructure, a thin finance sector, and a business environment struggling with governance issues. Growth has been narrowly focused on garments and tourism; the export of raw agricultural products; and construction related to the real estate boom, which is widely seen as a speculative bubble.2 Most of the GDP in Cambodia comes from export-orientated sectors (i.e., garments, tourism, and agriculture), and Cambodia’s top five exports account for 60% of total exports. This illustrates the thinness of the economy and heavy reliance on garments and tourism as engines of growth. For a small country such as Cambodia, the narrow base of exports creates vulnerabilities to external shocks.3
While global economic history shows that the process of development usually entails a shift from agriculture to manufacturing and services, the consensus for Cambodia is that in the short to medium term, poverty reduction will require growth in rural areas, most likely through sustained agricultural growth and the ability to capture value added from agroprocessing.
Historically, agricultural diversification has been weak in Cambodia, but agro-industrialization and foreign investment appears to be increasing. Within agriculture, much attention has been given to the prospect of
1 Only 13 countries since 1950 have grown at an average rate of 7% a year or more for 25 years or longer (Commission on Growth and Development 2008).
2 In 2006, garments accounted for 73.8% of Cambodia’s total merchandise exports (Yu et al. 2008), making Cambodia one of the most heavily dependent in the world on a single export, with all of the potential vulnerability that this entails. In these circumstances, sustaining growth and making it more pro-poor, especially in rural areas where the poor predominantly live, poses a monumental institutional and policy challenge for the government (World Bank 2006).
3 The recent financial crisis in the United States, and the resulting contagion across the world, has put pressure on Cambodia’s garments industry. Cambodia’s garment exports to the United States, the country’s largest foreign textile market, totaled $2.23 billion in 2008, slightly down from 2007. In 2007, the sector exported $2.90 billion worth of garments, produced in 319 factories that employed more than 380,000 workers. Some 43 garment factories closed in 2008, leaving nearly 20,000 workers unemployed. The effects of these widespread layoffs could be devastating for many impoverished families in rural areas, as the monthly salaries of relatives working in such factories are one of the few sources of income available to them (Rith 2008, Kurczy and Vannarin 2009).

Rural Development for Cambodia2
Cambodia’s development integrating with the emergence of global value chains and the move from staple crops to high value-added products. The performance so far has not been promising, with official agriculture exports (mainly rubber) accounting for less than 2% of total exports. Exports of raw agricultural products, such as cassava, maize, paddy, and soybeans to Thailand and Viet Nam, are significant, although remain unrecorded.
However, there are nascent signs of emerging rural enterprises in Cambodia concentrating on agro-industry, with the establishment of private rubber and cashew plantations, cassava starch factories for biofuel, and a rudimentary animal feed industry sponsored by CP Thailand. Further, over 2010–2011, reports of significant agribusiness investment pledges surfaced from Indonesia and Kuwait to develop Cambodia’s rice industry (i.e., close to $1 billion in planned investments in irrigation, contract farming, and modern rice mills), and there are also indications that private equity firms are standing by to invest over $600 million in agribusiness.
Significant inflows of foreign direct investment (FDI) in all sectors in recent years have made the country somewhat less aid dependent, and increasing levels of domestic savings have further deepened the country’s ability to sustain its own growth. For instance, savings have gone from 2.3% of GDP in 1998 to 30.3% in 2008 (ADB 2009b). Despite these generally positive signs, however, there is justifiable concern about Cambodia’s ability to seize the opportunities presented. A set of structural and institutional constraints to agricultural and rural development exist, which, unless addressed by appropriate interventions and policies, will result in a slowing of economic growth and poverty reduction. These constraints include (i) an insecurity in land tenure, which constrains investment in productive activities; (ii) low productivity in land and human capital; (iii) market failures, coordination issues, and a business-enabling environment that is not conducive to formalized investment; (iv) weak, underdeveloped rural roads and irrigation infrastructure; and (v) a finance sector that is unable to mobilize significant funds for agricultural and rural development.
The purposes of this report are to (i) identify the underlying structure of Cambodia’s rural economy and its evolving links to urban and peri-urban centers, (ii) identify the binding structural and institutional constraints to faster rural development and reductions in poverty and income inequality, and (iii) propose some remedial policy priorities for Asian Development Bank (ADB) support to strengthen governance arrangements and institutional processes in public financial management (PFM) to contribute to poverty reduction.

3
II. Performance of the Agriculture and Rural Sectors
A. Trends in Poverty and Inequality
Although Cambodia has enjoyed substantial growth along with significant poverty reduction over the past decade, the incidence of poverty remains high, particularly in rural areas. From 1997 to 2007,4 gross domestic product (GDP) grew by an average of 8.4% (ADB 2009b), while over the same period, poverty rates (using comparable samples) fell from 47% to 35%5 (Table 1). Analysis of the 2007 Cambodia Socio-Economic Survey (CSES) by Knowles (2008) suggested that over the 3 years from 2004 to 2007, poverty fell further to 30.1%, a rate of 1.6% per annum consistent with the reductions found between the 1993 and 2004 CSESs (Table 2). However, apparent progress at the national level masks significant differences across Cambodia.
4 The only comprehensive surveys of poverty rates were carried out in 1997, 2004, and 2007 under the CSES (NIS 1999, 2004, 2007). Knowles (2008) contained a preliminary analysis of the main findings of the 2007 CSES.
5 Data from Knowles (2008), in which the sampling frame was revised to permit intertemporal comparisons between the 1993/94, 1997, and 2004 surveys. The poverty rate (i.e., the percentage of the population living under the poverty line) was estimated at 35% for 2004. It is harder to know precisely what the poverty rate was 10 years ago, because the 1993/94 household survey did not cover the whole country; only 65% of the rural population was covered. However, the rate of change in poverty between 1993/94 and 2004 can be compared in those parts of the country that were accessible and covered in 1993/94. There, the poverty rate fell from 39% in 1993/94 to 28% in 2004. If this rate of poverty reduction is applied to the whole country, it is estimated that poverty in Cambodia in 1993/94 was 47% (or somewhere between 45% and 50%). This means that the poverty rate has fallen by between 10% and 15% over the 10 years between the 1993/94 and 2004 surveys.
Table 1 Main Poverty Trends in Cambodia, 1993/94–2004
Poverty Headcount (%) Poverty Gap Index
1993/94 1997 2004 1993/94 1997 2004
Cambodia 39.00 43.32 27.97 9.21 11.94 9.02
Phnom Penh 11.39 11.77 4.60 3.06 2.31 1.23
Other urban 36.62 32.40 20.54 9.66 8.72 6.55
Rural 43.12 51.37 33.66 9.99 13.57 10.17
CSES = Cambodia Socio-Economic Survey.
Note: Estimates from the 1993/94 CSES, 1997 CSES, and 2004 CSES use a consistent sampling frame.
Source: Knowles (2006).
Table 2 Changes in Poverty Incidence in Cambodia, 2004–2007 (%)
2004 2007 Change Yearly Change
Cambodia 34.8 30.1 (4.7) (1.6)
Phnom Penh 4.6 0.8 (3.8) (1.3)
Other urban 25.8 21.9 (3.9) (1.3)
Rural 39.1 34.7 (4.4) (1.5)
( ) = negative.
Notes: The results are not comparable with those of Table 1 due to the differences in the sampling frame used. Table 1 is backward-compatible to the 1993 survey, whereas the results in this table are consistent with the 2004 sampling frame. See footnote 5.
Source: Knowles (2008).

Rural Development for Cambodia4
The conclusion that poverty has declined is supported by other, nonconsumption indicators of well-being. The food share of total household expenditure has fallen significantly across all consumption quintiles, while the quality of housing and ownership of key assets have risen. The poverty gap, that is, the average distance by which the consumption of poor households falls below the consumption poverty line, has also declined throughout the country, indicating that those who remain below that line experienced less severe poverty in 2007 than in 1993/94 or 2004 (Knowles 2008, World Bank 2008a).
While urban areas continue to see a significant decline in poverty levels, rural areas lag behind. In those parts of Cambodia in which trends can be compared directly (i.e., those areas that were covered by the first survey in 1993/94), average living standards, measured as the consumption of goods and services per capita per day, rose by 32% in real terms between 1994 and 2004 (NIS 2004; World Bank 2007). However, this rise was associated with widening differences between the rich and the poor. In 2004, the living standards of the poorest one-fifth of the population were only 8% higher than they were 1 decade earlier; over this same period, the living standards of the richest one-fifth rose five times as fast (i.e., 45%). Similarly, rural living standards rose more slowly than those in Phnom Penh and other urban centers (Figure 1).
Consequently, this has resulted in increasing inequality across Cambodia, with the Gini coefficient estimated at 0.42, up from 0.38 in 1993 and equal to the 1997 estimate (Jackson 2005). The results indicate that the benefits of economic growth have been spread unevenly, resulting in a rise in consumption inequality. The World Bank (2007) concluded that the rise in inequality occurred in the early part of the decade (i.e., 1994–1997) and only in rural areas; there was no significant change in the distribution of consumption between 1997 and 2004.
Analysis of the CSES results by the World Bank (2007) suggested that between 1993 and 1997, the extremely rich pulled ahead, while the poorest, the poor, and the middle stagnated. The result was a substantial, statistically significant rise in inequality between 1993 and 1997. Between 1997 and 2004, almost every percentile in the distribution experienced similar high rates of growth in per capita consumption (i.e.,
Figure 1 Changes in per Capita Consumption in Cambodia, 1994–2004
Source: World Bank (2007).
Income Group
1,000
0
2,000
3,000
4,000
951
1,02
6
1,33
61,
537
1,69
6
2,27
1 2,95
4
4,88
37,
067
1,85
72,
303
2,78
2 3,77
0 4,36
75,
501
2,93
22,
228
2,07
7
5,000
6,000
7,000
8,000
Rea
l Ave
rag
e P
er C
apita
Co
nsum
ptio
n(K
R, 1
993/
94 c
ons
tant
pri
ces)
Poore
st
Next p
oore
st
Middle
Next r
iches
t
Riches
t
Rural
Other
urb
an
Phnom
Pen
h
Cambod
ia
20041994
Performance of the Agriculture and Rural Sectors 5
20%–28%). Thus, this period can be characterized as equitable, with growth broadly shared (World Bank 2007, p. 22).
The combination of different trends in 1993–1997 (i.e., growth concentrated among the rich) and 1997–2004 (i.e., broadly shared growth) resulted in rising rural inequality. The trends during 1997–2004 and 2004–2007 are also promising and suggest that there is not necessarily a structural problem with Cambodia’s economic growth. Projecting simply on the basis of trends in these periods, growth dynamics do not suggest a structural tendency for growth to increase inequality (World Bank 2007, p. 22).
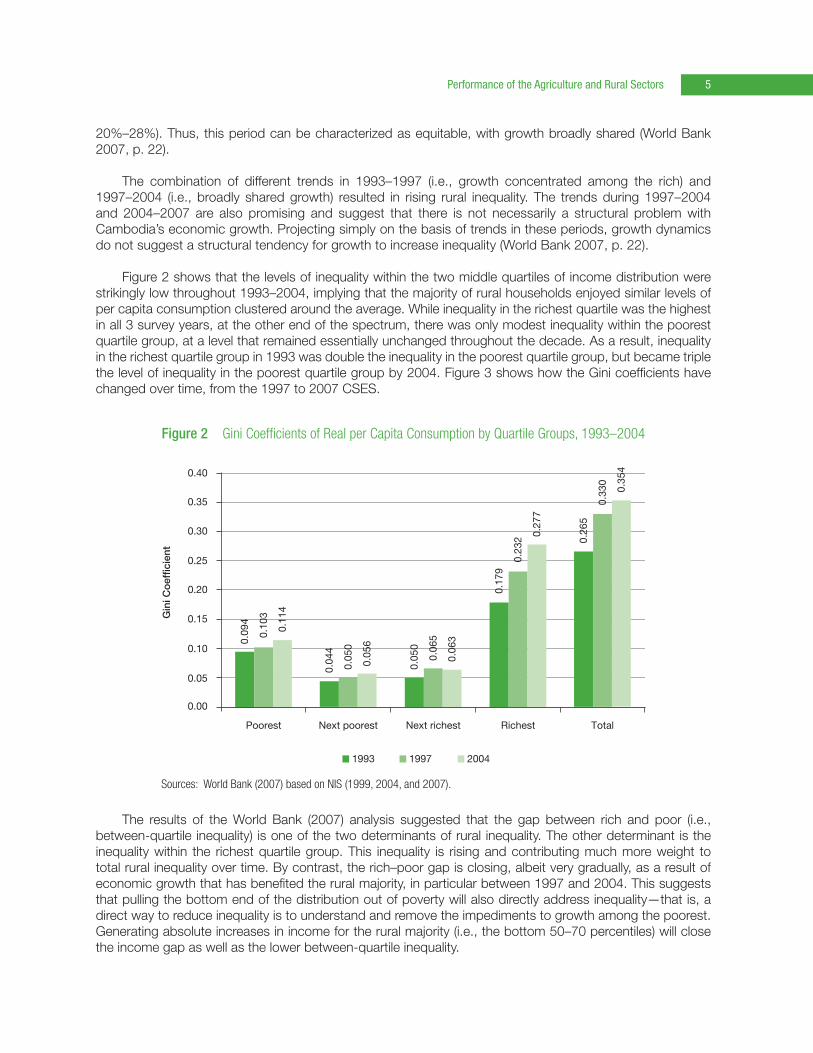
Figure 2 shows that the levels of inequality within the two middle quartiles of income distribution were strikingly low throughout 1993–2004, implying that the majority of rural households enjoyed similar levels of per capita consumption clustered around the average. While inequality in the richest quartile was the highest in all 3 survey years, at the other end of the spectrum, there was only modest inequality within the poorest quartile group, at a level that remained essentially unchanged throughout the decade. As a result, inequality in the richest quartile group in 1993 was double the inequality in the poorest quartile group, but became triple the level of inequality in the poorest quartile group by 2004. Figure 3 shows how the Gini coefficients have changed over time, from the 1997 to 2007 CSES.
The results of the World Bank (2007) analysis suggested that the gap between rich and poor (i.e., between-quartile inequality) is one of the two determinants of rural inequality. The other determinant is the inequality within the richest quartile group. This inequality is rising and contributing much more weight to total rural inequality over time. By contrast, the rich–poor gap is closing, albeit very gradually, as a result of economic growth that has benefited the rural majority, in particular between 1997 and 2004. This suggests that pulling the bottom end of the distribution out of poverty will also directly address inequality—that is, a direct way to reduce inequality is to understand and remove the impediments to growth among the poorest. Generating absolute increases in income for the rural majority (i.e., the bottom 50–70 percentiles) will close the income gap as well as the lower between-quartile inequality.
Figure 2 Gini Coefficients of Real per Capita Consumption by Quartile Groups, 1993–2004
Sources: World Bank (2007) based on NIS (1999, 2004, and 2007).
Gin
i Co
effic
ient
0.05
0.00
0.10
0.15
0.09
4
0.10
3
0.11
4
0.04
4
0.05
0
0.05
6
0.05
0
0.06
5
0.06
3
0.17
9
0.23
2 0.27
7
0.26
5
0.33
0
0.35
4
0.20
0.25
0.30
0.35
0.40
Poorest Next poorest Next richest Richest Total
200419971993

Rural Development for Cambodia6
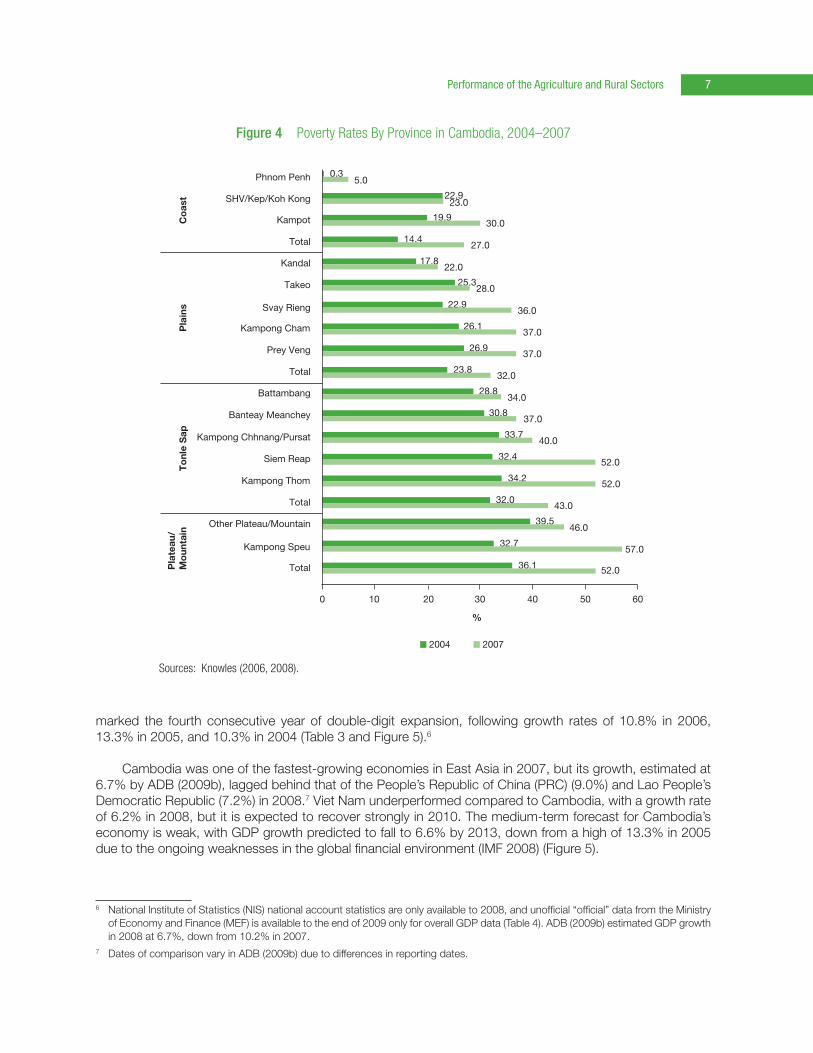
Knowles (2006, 2008) showed that there are clear geographical patterns of inequality within Cambodia’s countryside, with very large interprovincial variations in the incidence and severity of poverty (Figure 4). Kampong Thom Province has the largest incidence of poverty, with 34.0% of its total population living below the official poverty line. This is followed by Kampong Chhnang and Pursat provinces, each with 33.7% of the population living below the poverty line, then Siem Reap with 32.4%. The geographical distribution of poverty closely mirrors that of infrastructure development and access to markets, with poor transport networks in more remote and mountainous areas limiting economic opportunities for households.
The findings of the World Bank (2007) report can be summarized as (i) rising rural inequality was due to rising inequality within the richest quartile group, (ii) rising provincial inequality coincided with increasing shares of the richest provincial population, and (iii) rising rural inequality coincided with faster growth. It also noted that provinces with increasing proportions of wealthy residents are more likely to experience rising inequality, there is no evidence of concentrated wealth in any particular province, and fluctuations in provincial inequality appear to be random. Thus, the speed and magnitude with which the population in any province makes it into the rural richest quartile is very likely to be a result of economic growth (World Bank 2007, pp. 27–28).
B. Growth Trends in the Rural Sector
Cambodia has recorded sustained growth in recent years, but during the 2008 global financial crisis, it experienced slow growth. In spite of accelerating inflation, Cambodia’s economy grew by 10.1% in 2007, bolstered by strong garment exports, an increase in tourist visits, and a bumper rice crop. The year 2007
Figure 3 Gini Coefficients of Real per Capita Consumption, 1994–2007
Source: Knowles (2008).
Per
cent
age
of
Nat
iona
l Inc
om
e (%
)
Percentage of Total Population
60
50
40
30
20
10
00.2 0.4 0.6 0.8 1.0
1994 2004 2007
Performance of the Agriculture and Rural Sectors 7
marked the fourth consecutive year of double-digit expansion, following growth rates of 10.8% in 2006, 13.3% in 2005, and 10.3% in 2004 (Table 3 and Figure 5).6
Cambodia was one of the fastest-growing economies in East Asia in 2007, but its growth, estimated at 6.7% by ADB (2009b), lagged behind that of the People’s Republic of China (PRC) (9.0%) and Lao People’s Democratic Republic (7.2%) in 2008.7 Viet Nam underperformed compared to Cambodia, with a growth rate of 6.2% in 2008, but it is expected to recover strongly in 2010. The medium-term forecast for Cambodia’s economy is weak, with GDP growth predicted to fall to 6.6% by 2013, down from a high of 13.3% in 2005 due to the ongoing weaknesses in the global financial environment (IMF 2008) (Figure 5).
6 National Institute of Statistics (NIS) national account statistics are only available to 2008, and unofficial “official” data from the Ministry of Economy and Finance (MEF) is available to the end of 2009 only for overall GDP data (Table 4). ADB (2009b) estimated GDP growth in 2008 at 6.7%, down from 10.2% in 2007.
7 Dates of comparison vary in ADB (2009b) due to differences in reporting dates.
Figure 4 Poverty Rates By Province in Cambodia, 2004–2007
Sources: Knowles (2006, 2008).
Phnom Penh
100 20 30
%
40 50 60
SHV/Kep/Koh Kong
Kampot
Total
Total
Battambang
Banteay Meanchey
Kampong Chhnang/Pursat
Siem Reap
Kampong Thom
Total
Other Plateau/Mountain
Pla
teau
/M
oun
tain
To
nle
Sap
Pla
ins
Co
ast
Kampong Speu
Total
Kandal
Takeo
Svay Rieng
Kampong Cham
Prey Veng
22.923.0
5.00.3
19.930.0
27.014.4
22.017.8
25.328.0
22.936.0
37.026.1
37.026.9
32.023.8
34.028.8
30.837.0
33.740.0
32.452.0
34.252.0
32.043.0
46.039.5
32.757.0
36.1 52.0
20072004

Rural Development for Cambodia8
Table 3 Breakdown of Real Gross Domestic Product by Sector, 2003–2008 (%)
Growth Rates Sector Distribution
Economic Activity 2003 2004 2005 2006 2007 2008 2003 2004 2005 2006 2007 2008
Agriculture, Forestry, Fisheries 10.5 (0.9) 15.7 5.5 5.0 5.7 32.0 28.8 29.4 28.0 26.7 26.5Crops 21.9 (2.3) 27.6 5.3 8.2 6.6 15.0 13.3 15.0 14.2 14.0 14.0 Paddy 22.2 (12.2) 43.7 4.4 7.5 4.1 8.2 6.5 8.2 7.8 7.6 7.4 Other crops 21.5 9.5 12.2 6.5 9.0 9.5 6.8 6.8 6.7 6.5 6.4 6.6Livestock and poultry 5.7 3.9 5.6 8.2 3.7 3.8 5.2 4.9 4.5 4.4 4.2 4.1Fisheries 1.7 (1.7) 5.6 3.8 0.8 1.5 9.3 8.3 7.7 7.3 6.6 6.6Forestry and logging (3.0) 0.8 5.1 7.0 1.1 0.9 2.6 2.3 2.2 2.1 1.9 1.8Industry 12.0 16.6 12.7 18.3 8.4 4.0 25.5 26.9 26.8 28.6 28.1 27.5Mining 18.1 24.2 26.3 15.9 7.7 15.8 0.3 0.4 0.4 0.4 0.4 0.4Manufacturing 12.3 17.7 9.7 17.4 8.9 3.1 18.9 20.2 19.6 20.8 20.5 19.8
Food, beverages, and tobacco 4.7 (5.2) 9.0 3.3 3.1 5.9 2.7 2.3 2.2 2.1 1.9 1.9
Textiles, apparel, and footwear 16.8 24.9 9.2 20.4 10.0 2.2 13.4 15.2 14.6 15.9 15.9 15.2
Wood, paper, and publishing (14.3) 4.2 10.0 8.4 4.9 5.0 0.5 0.4 0.4 0.4 0.4 0.4
Rubber manufacturing (9.8) (8.6) (9.0) 3.3 9.6 9.2 0.4 0.3 0.2 0.2 0.2 0.2
Other manufacturing 7.7 8.1 17.3 15.0 6.7 6.5 2.1 2.0 2.1 2.2 2.1 2.1
Nonmetallic manufacturing 11.8 14.9 21.7 20.2 10.3 9.1 0.5 0.5 0.5 0.6 0.6 0.6
Basic metal and metal products 11.9 14.6 21.3 20.3 7.6 7.0 0.2 0.2 0.2 0.2 0.2 0.2
Other manufacturing 5.8 4.8 15.1 12.0 4.9 5.2 1.4 1.3 1.3 1.4 1.3 1.3
Electricity, gas, and water 9.1 11.2 12.5 31.7 11.5 8.5 0.5 0.5 0.5 0.6 0.6 0.6Construction 11.1 13.2 22.1 20.0 6.7 5.8 5.8 5.9 6.4 6.9 6.7 6.6Services 5.9 13.2 13.1 10.1 10.1 9.0 37.6 38.6 38.5 38.3 38.3 39.1Trade 3.7 5.8 8.5 7.1 9.5 9.4 9.5 9.1 8.7 8.4 8.4 8.6Hotel and restaurants (16.8) 23.4 22.3 13.7 10.2 9.8 3.6 4.0 4.3 4.4 4.4 4.6Transport and communications 3.2 9.6 14.5 2.1 7.2 7.1 6.8 6.7 6.8 6.2 6.1 6.1Finance 6.6 20.5 19.6 24.0 22.2 19.2 1.0 1.1 1.1 1.3 1.4 1.6Public administration (4.5) (6.7) 5.9 (1.2) 0.1 2.5 1.9 1.6 1.5 1.4 1.2 1.2Real estate and business 23.3 20.3 7.8 10.9 10.7 5.0 7.3 8.0 7.6 7.6 7.6 7.5Other services 13.7 18.0 18.3 17.2 12.1 12.0 7.6 8.1 8.5 9.0 9.1 9.6Taxes and SubsidiesTaxes on products
0.6 27.6 6.1 7.6 45.7 6.7 5.7 6.6 6.2 6.0 8.0Less subsidies 8.2Taxes on products 1.3 26.2 6.9 10.0 37.6 9.0 6.1 6.9 6.5 6.5 8.1 8.3Less subsidies 15.7 1.6 24.7 55.7 (68.3) 1.5 0.3 0.3 0.3 0.5 0.1 10.0Less FISIM 8.7 17.7 15.9 10.9 25.0 14.0 0.9 1.0 1.0 1.0 1.1 1.2Gross Domestic Product 8.5 10.3 13.3 10.8 10.2 10.2 100 100 100 100 100 100
( ) = negative, FISIM = Financial Intermediation Services Indirectly Measured.
Source: NIS (2008).

Performance of the Agriculture and Rural Sectors 9
Table 4 Official Gross Domestic Product of Cambodia, 2000–2009
2000 2001 2002 2003 2004 2005 2006 2007 2008 2009
GDP at current prices (KR billion) 14,083 15,633 16,781 18,535 21,754 25,754 29,849 35,042 1,968 43,080
GDP at current prices ($ million) 3,649 3,984 4,280 4,663 5,339 6,293 7,275 8,614 10,337 10,385
GDP per capita ($) 288 312 331 356 402 468 534 623 738 731
Real GDP (% increase) 8.8 8.1 6.6 8.5 10.3 13.3 10.8 10.2 6.7 0.1
GDP at constant 2000 prices (KR billion) 14,083 15,230 16,232 17,613 19,434 22,009 24,380 26,870 28,668 28,692
GDP = gross domestic product, KR = riel.
Source: Ministry of Economy and Finance.
The main determinants of Cambodia’s economic growth since the mid-1990s have been a relatively stable macroeconomic environment, including favorable external conditions and markets; generally prudent domestic financial policies; and the creation of critical market economy institutions. However, in terms of physical output, as previously mentioned, economic growth has been derived from a very narrow base comprising the garments, tourism, and construction sectors, and to a much more limited extent, the agriculture sector (World Bank 2006).
Compared with most Southeast Asian countries, Cambodia’s manufacturing sector is small. In 2007, the share of manufacturing in GDP was 20.5% in Cambodia (19.8% in 2008) but was 43.0% in the PRC, 27.0% in Indonesia, 30.6% in Malaysia,8 22.0% in the Philippines, 34.9% in Thailand, and 21.4% in Viet Nam (ADB 2008a). Likewise, the food, beverage, and tobacco sector in Cambodia is minuscule, at 1.9% of GDP. The level of manufacturing exports has also been moderately low by regional standards. During 2007, manufacturing exports (in constant 2000 dollars) grew at about 10.7% in Cambodia, compared with 25.7% in the PRC, 13.3% in Indonesia, 6.4% in the Philippines, 6.4% in Thailand, and 21.9% in Viet Nam (ADB 2008a). However, unlike other Southeast Asian countries, the bulk of exports from Cambodia was garment sales to the United States and European Union, with very little exports of agro-based products, the mainstay of the rural economy.
8 Data for Malaysia are for 2005 since the comparable figures for this country are not included in the ADB database.
Figure 5 Cambodia’s Gross Domestic Product Growth Rates, 2005–2011
GDP = gross domestic product.
Source: ADB (2009a).
ServicesIndustryGDP
20%
%
–20 2005 2006 2007 2008 2009
10
–10
0
Agriculture
8
12
16
4
–40
2005 2006 2007 2008 2009
5-year moving average
2010 2011
Forecast
Rural Development for Cambodia10
Growth in tourism and garments has weakened due to the global financial crisis, but is set to improve from 2011. Prior to the crisis, the solid performance of the two main engines of growth (i.e., tourism and garments) owed more to fortuitous circumstances and a narrow enclave-type of development than to effective economy-wide growth-generating economic policies and management (World Bank 2006, p. 57). The crisis has had a significant impact on the tourism, garments, and construction sectors, with the agriculture sector serving to prop up the country’s economy.
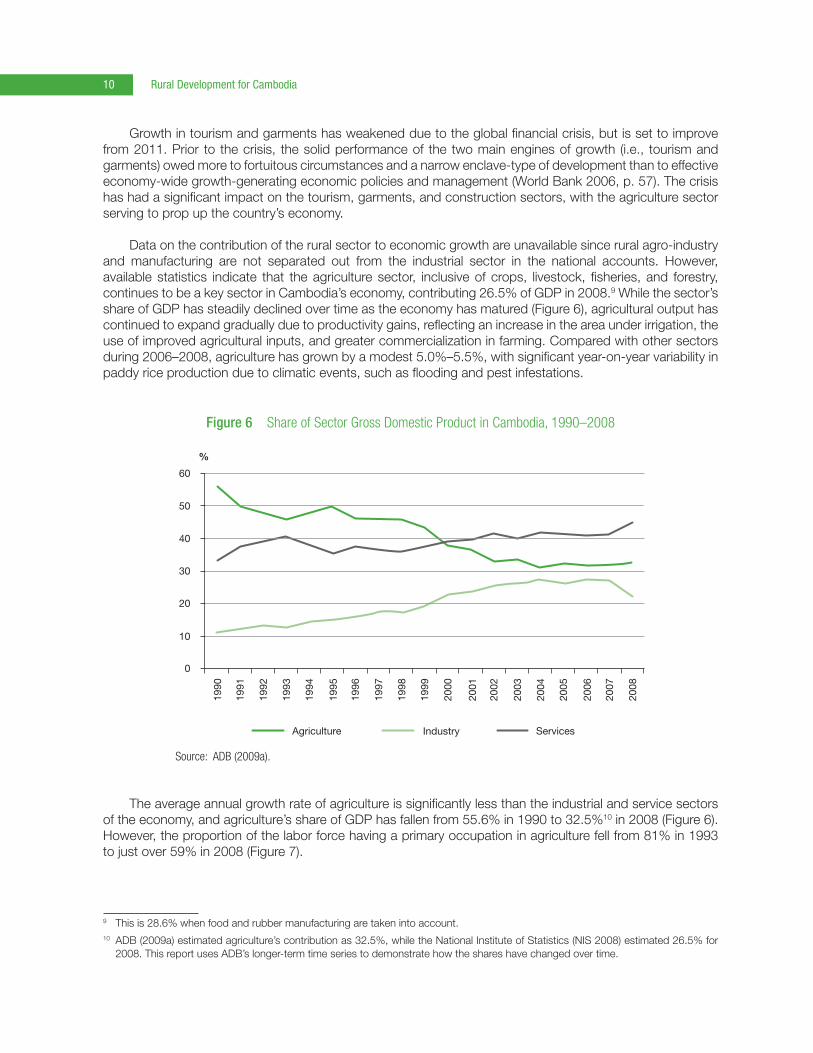
Data on the contribution of the rural sector to economic growth are unavailable since rural agro-industry and manufacturing are not separated out from the industrial sector in the national accounts. However, available statistics indicate that the agriculture sector, inclusive of crops, livestock, fisheries, and forestry, continues to be a key sector in Cambodia’s economy, contributing 26.5% of GDP in 2008.9 While the sector’s share of GDP has steadily declined over time as the economy has matured (Figure 6), agricultural output has continued to expand gradually due to productivity gains, reflecting an increase in the area under irrigation, the use of improved agricultural inputs, and greater commercialization in farming. Compared with other sectors during 2006–2008, agriculture has grown by a modest 5.0%–5.5%, with significant year-on-year variability in paddy rice production due to climatic events, such as flooding and pest infestations.
The average annual growth rate of agriculture is significantly less than the industrial and service sectors of the economy, and agriculture’s share of GDP has fallen from 55.6% in 1990 to 32.5%10 in 2008 (Figure 6). However, the proportion of the labor force having a primary occupation in agriculture fell from 81% in 1993 to just over 59% in 2008 (Figure 7).
9 This is 28.6% when food and rubber manufacturing are taken into account.10 ADB (2009a) estimated agriculture’s contribution as 32.5%, while the National Institute of Statistics (NIS 2008) estimated 26.5% for
2008. This report uses ADB’s longer-term time series to demonstrate how the shares have changed over time.
Figure 6 Share of Sector Gross Domestic Product in Cambodia, 1990–2008
Source: ADB (2009a).
1990
1991
1992
1993
1994
1995
1996
1997
1998
1999
2000
2001
2002
2003
2004
2005
2006
2007
2008
60
%
50
40
30
20
10
0
Agriculture Industry Services

Performance of the Agriculture and Rural Sectors 11
Although there has been no significant change in the overall structure of the agriculture sector relative to the other sectors of the economy, there have been substantial changes in individual subsector contributions to agricultural growth. The emergence of cassava, maize, and soybeans has been in response to increasing demand for livestock and the biofuel industry worldwide. In terms of contribution to agricultural GDP, the crop sector contributed the largest share at 49.0% in 2007, followed by the fisheries subsector (27.9%), and the livestock subsector (16.3%) (Table 5).11 Paddy rice production is the largest contributor to the cropping sector (26.4% of agricultural GDP in 2007), with cassava becoming increasingly important (2.5%, up from 0.8% in 2004) for starch processing, livestock feed, and ethanol production for biofuel use.
There are significant geographical differences in crop diversification. Each crop has particular geographical distribution, which is important in the context of poverty reduction trends. Farmlands in Pailin and Battambang provinces, particularly along the Thailand border, and also in Kampong Cham Province, particularly along the Viet Nam border, have seen much growth in cassava, maize, and soybean production under contract with cross-border traders and local processors. In addition, annual Ministry of Agriculture, Forestry and Fisheries (MAFF) statistics on areas under production by crop indicate that the expansion of cropping in upland areas of Cambodia and out of the main rice-growing provinces suggests that benefits are accruing in poorer areas such as Pailin, Battambang, and Kampong Cham.
Besides revenue earned from crop production, livestock is an important component of income in the rural economy. In 2008, livestock and poultry production contributed 4.1% to total GDP and saw an annual growth rate of 3.8% in 2007 data (Table 5). Estimates by the Economic Institute of Cambodia (EIC) (2008) suggested that value added from livestock production increased by 6.6% in 2008 due to rising food prices, slightly improving accessibility to credit in rural areas, and easing of the imposition of import restrictions on pigs. This outlook for the livestock subsector was cautious, pointing to initial capital and ongoing credit constraints in the subsector and the high dependency on imports.
Fishery production contributed around 6.6% to GDP (or 27.9% of agricultural GDP) in 2008. Year-on-year growth rates indicate a slowing of growth in this sector, from 6.5% growth in 2004–2005, 4.9% in 2005–2006, to 2.0% in 2006–2007 (Table 5). Production of prahok (fish paste) continues to be the mainstay of small commercial fishing operations, while normal fish production lags behind (EIC 2008).12
11 Updated statistics for 2008 are unavailable for a detailed breakdown.12 The expansion of illegal fishing operations (both in number and in scope of techniques) and the destruction of fish-rearing habitats
remain important concerns for the sustainable growth of the sector. The prospects that fish stocks will expand in the coming years are slim (EIC 2008).
Figure 7 Labor Force Participation in Cambodia by Sector, 1993–2008
Note: Mining contribution is negligible compared with other sectors.
Source: ADB (2009a).
0.0
10.0
20.0
30.0
40.0
50.0
60.0
70.0
80.0
90.0%
1993
1994
1995
1996
1997
1998
1999
2000
2001
2002
2003
2004
2005
2006
2007
2008
Agriculture Manufacturing Mining and Others Agriculture Manufacturing Mining and Others
0
1,000
2,000
3,000
4,000
5,000
6,000
Em
plo
ymen
t (’0
00)
1993
1994
1995
1996
1997
1998
1999
2000
2001
2002
2003
2004
2005
2006
2007
2008

Rural Development for Cambodia12
Fisheries are a cardinal part of Cambodia’s rural economy, with one of the most intensive fisheries and highest catches per inhabitant, at about 20 kilograms per annum, of any country in the world (MDLF 2010). According to government figures released by the International Monetary Fund (IMF), the fisheries subsector was the fourth-largest employer and also the fourth-biggest contributor to Cambodia’s GDP in 2007. The fisheries subsector contributes more than KR2.4 trillion ($600 million) to Cambodia’s GDP, almost 7% of the country’s total output of goods and services.
The subsector employed 385,000 people in 2007, 2% more than the previous year, and accounted for almost 5% of the country’s workforce. In 2002, it employed 291,000 people (4% of the workforce), an increase of 32% over 5 years (IMF 2009). Output by number of employees working in the subsector comes in third behind manufacturing (Table 6). Yet by employee headcount, fisheries have less than one-half the number of employed persons, matching the output levels of manufacturing, indicating the productivity of the fisheries subsector.
Table 5 Composition of Agricultural Gross Domestic Product in Cambodia (%, constant 2000 prices)
Outputs at Basic Prices
Growth Rates Distribution
2002–2003 2003–2004 2004–2005 2005–2006 2006–2007 2003 2004 2005 2006 2007
Crops 22.6 (2.0) 27.8 5.1 5.8 44.7 43.9 48.4 48.1 49.0
Paddy 23.2 (11.5) 43.5 4.6 3.0 24.5 21.8 27.0 26.7 26.4
Other crops 21.8 9.5 12.4 5.7 9.2 20.1 22.1 21.4 21.4 22.5
Maize 111.3 (18.4) (3.5) 52.1 42.9 2.6 2.1 1.8 2.5 3.5
Cassava 75.3 57.8 32.0 153.7 11.3 0.5 0.8 1.0 2.3 2.5
Sweet potato 10.7 0.7 11.4 15.7 1.7 0.5 0.5 0.5 0.6 0.6
Mung beans 33.0 42.2 (0.5) 33.0 (14.9) 0.7 1.0 0.8 1.1 0.9
Soybeans 62.9 74.6 62.4 (45.1) (3.2) 1.1 1.9 2.6 1.3 1.3
Groundnuts 87.2 36.6 9.6 16.6 13.9 0.9 1.2 1.1 1.3 1.4
Palm oil 1.6 8.5 9.8 11.2 10.0 0.0 0.1 0.1 0.1 0.1
Sesame 116.2 150.3 3.2 (56.3) 45.5 0.9 2.2 1.9 0.8 1.1
Vegetables (1.3) (1.0) 2.0 7.0 1.3 4.4 4.3 3.8 3.9 3.8
Sugarcane (17.1) (24.7) (9.4) 19.9 35.8 0.4 0.3 0.2 0.3 0.3
Pepper 0.5 2.5 30.0 15.0 10.0 0.1 0.2 0.2 0.2 0.2
Tobacco 203.9 (63.8) 414.5 0.6 15.9 0.8 0.3 1.3 1.2 1.0
Jute (11.8) 146.7 (40.3) (30.4) 16.1 0.0 0.0 0.0 0.0 0.0
Rubber (4.9) (2.1) (8.7) 5.2 11.4 3.0 2.9 2.3 2.3 2.5
Others 6.4 1.5 2.0 1.6 1.1 4.2 4.3 3.8 3.6 3.5
Livestock and poultry 0.2 4.7 7.3 8.4 3.7 16.4 17.2 15.9 16.3 16.3
Fisheries 2.7 (0.6) 6.5 4.9 2.0 31.4 31.2 28.7 28.5 27.9
Forestry (2.3) 1.8 5.1 7.1 0.0 7.6 7.7 7.0 7.1 6.8
Total agriculture 9.8 (0.2) 15.9 5.7 4.0 100 100 100 100 100
( ) = negative.
Source: NIS (2008).

Performance of the Agriculture and Rural Sectors 13
The forestry subsector did not grow in 2008, compared with the 2006 growth rate of 7.1%. Forestry and logging contribute around 1.8% of total GDP, or 6.8% of agricultural GDP (Table 5). Illegal logging remains a problem, particularly in old-growth areas in Mondul Kiri and Ratanak Kiri provinces, and production data are unlikely to be accurately captured in national accounts. The rubber subsector posted a –2.6% growth rate in 2008 as old trees were cut down and the lack of investment in replanting meant that immature trees were not ready for tapping. With recent declines in rubber prices, the subsector is expected to remain flat in the coming years (EIC 2008).
Although agriculture remains the primary economic activity for rural households, the small and medium-sized enterprise (SME) sector in Cambodia is both large and vibrant. However, nonfarm activities and employment will rely on the expansion of the rural business sector. SME firms account for 99% of the total number of registered firms in Cambodia and employ around 45% of the total labor force. The sector is made up mostly of unregistered farmers and agricultural enterprises.13 Women constitute 52% of the economically active population, of which about 45% are self-employed, primarily in the informal sector (SME Secretariat 2005). Only about 1.5% of the labor force is involved in agribusiness, with the average microenterprise consisting of 2–3 workers. In 2006, the Ministry of Industry, Mines and Energy estimated that there were 31,149 small industrial establishments with fewer than 50 employees (Table 7). This represents 15.7% growth in the number of operating establishments since 2002, and over 26.0% growth since 1999. Food, beverage, and tobacco manufactures (as an International Standard Industrial Classification of All Economic Activities group) represent the largest number of small industrial establishments.
Table 8 presents a provincial breakdown of small industrial enterprises based on the SEILA14 database, showing a definite concentration of business activities in the most populous and economically active provinces. Across all establishment types, Kampong Cham and Siem Reap provinces account for 11.7% each, while a further 9.0% are located in Prey Veng Province and 7.7% in Phnom Penh itself.
13 It is difficult to estimate the exact number of small enterprises, because there are so many unlicensed industrial establishments. Among SMEs, rice milling is by far the most common activity, while other milling operations and starch manufacturing are a distant second. According to the Ministry of Industry, Mining and Energy data, there are a total of 23,103 small rice-milling enterprises, of which only 47.0% have obtained operating licenses. These small rice-milling enterprises account for 74% of all small industrial establishments and employ nearly 47,900 people. Food processing (including rice milling) accounts for 81.7% (25,455 firms) of all small enterprises, and 51.5% of them do not have operating licenses. There are 1,689 small textile and garment enterprises, mostly weaving enterprises and producers of textiles for the handicrafts industry.
14 The Seila Program of the Royal Government of Cambodia is an aid mobilization and coordination framework to support the country’s decentralization and deconcentration reforms. It was launched in 1996 as a government experiment in poverty alleviation in rural areas. Seila means “foundation stone” in Khmer.
Table 6 Top Five Employers by Sector, 2007
Number of Employed % of Workforce Output ($ million)
Output by Number of Employees ($)
% of Gross Domestic Product
Agriculture 4,224,000 50.6 1,699 402.25 19.9
Trade 1,196,000 14.3 762 637.12 8.9
Manufacturing 944,000 11.3 1,481 1,568.85 17.3
Fisheries 385,000 4.6 601 1,561.04 6.9
Construction 299,000 3.6 570 1,906.35 6.7
Note: Data (i.e., number of employed) are based on Table 7 (Cambodia: Employment by Sector of Activity, 2002–2007). But the data on the agriculture sector excludes forestry and fisheries.
Source: Ministry of Planning, National Institute of Statistics, cited in IMF (2009).

Rural Development for Cambodia14
The provincial totals hide significant structural differences in SME activities. For example, despite Siem Reap being one of the poorest provinces, the number of enterprises is surprisingly high, given a general association between economic activity and poverty reduction. Table 8 shows that Siem Reap has the second-highest number of food and retail marketing establishments after Phnom Penh, which is indicative of the tourism market. In contrast, Siem Reap has only 7.7% of the total number of rice-milling establishments compared with Prey Veng at 15.7% and Kampong Cham at 14.1%. Thus, while provinces such as Kampong Cham and Prey Veng have a concentration of agro-industrial enterprises reflecting the agricultural base of their economies, Siem Reap and Phnom Penh have a concentration of food and retail enterprises reflecting the service base of their economies.
Despite the contribution of the SME sector to the rural economy, weak links between SMEs and agriculture continue to hinder economic growth in the rural sector. Contrary to the experience in many other developing countries, and for reasons associated with poor governance, the rural SME subsector in Cambodia has not yet played a key role in forging and expanding the links between farming and industry, and thereby accelerating the transition to a more modern and diversified economic structure. As indicated above, paddy rice production contributes 50%–60% of total crop production by value added but contributes little to GDP on a per ton basis, due to an almost complete lack of processing for export, despite a global market of about 12–15 times Cambodia’s surplus production (World Bank 2006).15
The agriculture sector and its associated agro-industry form the bulk of the rural economy and the largest number of rural SME enterprises in Cambodia. Hence, agriculture and agroprocessing are the main economic sectors driving the rural economy. Currently, agriculture accounts for 59.0% of all employment, yet agro-industry16 provides less than 1.0% of total employment and accounts for only 1.9% of GDP. Thus, there
15 Rice exports vary wildly with no clear pattern over time, as these data are not officially reported, and raw Cambodian paddy is often supplied to Thailand and Viet Nam for processing.
16 This is defined as the manufacturing of food, beverages, and tobacco products in the national accounts.
Table 7 Small Industrial Establishments in Cambodia, 2006
Number of Enterprises Labor MIME-Licensed
Sector TotalWomen
Entrepreneurs % of Total TotalWorkers per Enterprise
Total Licensed
% of Total
Manufacture of food, beverages, and tobacco 25,455 1,042 4.1 58,512 2.3 12,350 48.5
of which rice milling 23,103 700 3.0 47,887 2.1 10,922 47.3
Textile and wearing apparel and leather industries 1,689 573 33.9 6,347 3.8 167 9.9
Paper products, printing, and publishing 33 10 30.3 351 10.6 25 75.8
Chemicals 159 31 19.5 1,448 9.1 155 97.5
Nonmetallic mineral products except petroleum and coal 797 120 15.1 8,932 11.2 652 81.8
Fabricated metal products, machinery, and equipment 2,380 127 5.3 8,243 3.5 1,613 67.8
Other manufacturing industries 636 99 15.6 3,239 5.1 435 68.4
Total 31,149 2,002 6.4 87,072 2.8 15,397 49.4
MIME = Ministry of Industry, Mines and Energy.
Source: Ministry of Industry, Mines and Energy database cited in SME Secretariat (SME Secretariat 2007).
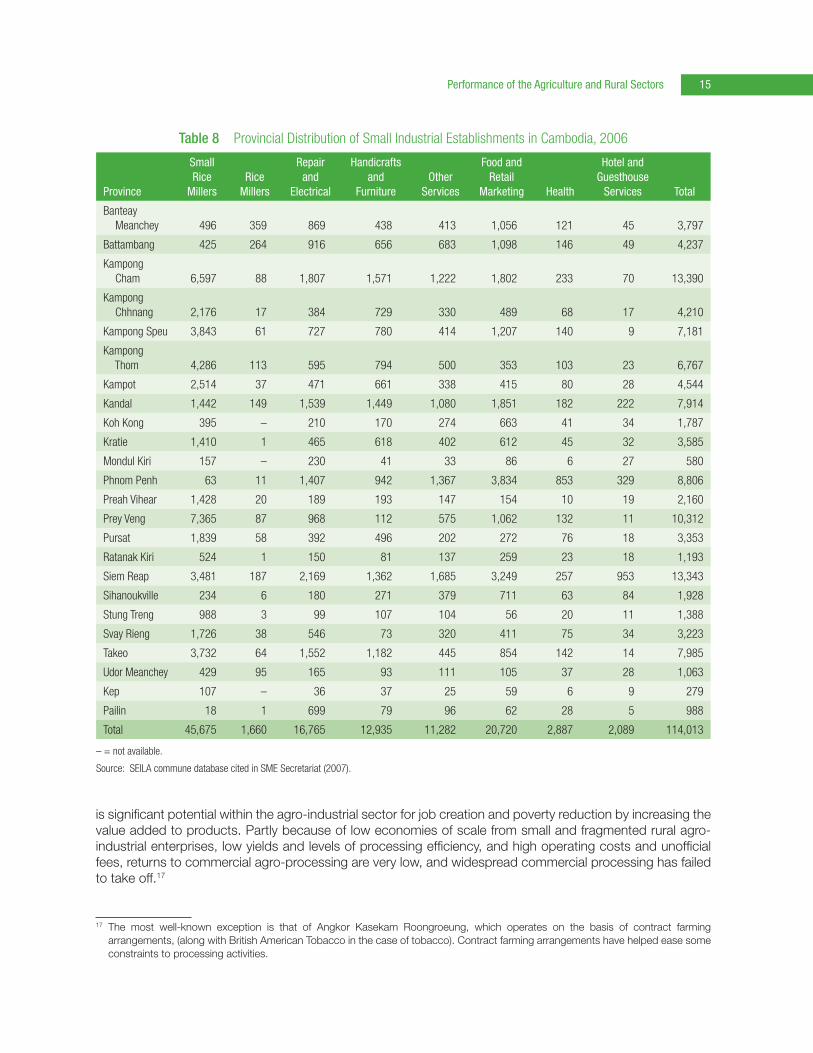
Performance of the Agriculture and Rural Sectors 15
Table 8 Provincial Distribution of Small Industrial Establishments in Cambodia, 2006
Province
Small Rice
MillersRice
Millers
Repair and
Electrical
Handicrafts and
FurnitureOther
Services
Food and Retail
Marketing Health
Hotel and Guesthouse
Services Total
Banteay Meanchey 496 359 869 438 413 1,056 121 45 3,797
Battambang 425 264 916 656 683 1,098 146 49 4,237
Kampong Cham 6,597 88 1,807 1,571 1,222 1,802 233 70 13,390
Kampong Chhnang 2,176 17 384 729 330 489 68 17 4,210
Kampong Speu 3,843 61 727 780 414 1,207 140 9 7,181
Kampong Thom 4,286 113 595 794 500 353 103 23 6,767
Kampot 2,514 37 471 661 338 415 80 28 4,544
Kandal 1,442 149 1,539 1,449 1,080 1,851 182 222 7,914
Koh Kong 395 – 210 170 274 663 41 34 1,787
Kratie 1,410 1 465 618 402 612 45 32 3,585
Mondul Kiri 157 – 230 41 33 86 6 27 580
Phnom Penh 63 11 1,407 942 1,367 3,834 853 329 8,806
Preah Vihear 1,428 20 189 193 147 154 10 19 2,160
Prey Veng 7,365 87 968 112 575 1,062 132 11 10,312
Pursat 1,839 58 392 496 202 272 76 18 3,353
Ratanak Kiri 524 1 150 81 137 259 23 18 1,193
Siem Reap 3,481 187 2,169 1,362 1,685 3,249 257 953 13,343
Sihanoukville 234 6 180 271 379 711 63 84 1,928
Stung Treng 988 3 99 107 104 56 20 11 1,388
Svay Rieng 1,726 38 546 73 320 411 75 34 3,223
Takeo 3,732 64 1,552 1,182 445 854 142 14 7,985
Udor Meanchey 429 95 165 93 111 105 37 28 1,063
Kep 107 – 36 37 25 59 6 9 279
Pailin 18 1 699 79 96 62 28 5 988
Total 45,675 1,660 16,765 12,935 11,282 20,720 2,887 2,089 114,013
– = not available.
Source: SEILA commune database cited in SME Secretariat (2007).
is significant potential within the agro-industrial sector for job creation and poverty reduction by increasing the value added to products. Partly because of low economies of scale from small and fragmented rural agro-industrial enterprises, low yields and levels of processing efficiency, and high operating costs and unofficial fees, returns to commercial agro-processing are very low, and widespread commercial processing has failed to take off.17
17 The most well-known exception is that of Angkor Kasekam Roongroeung, which operates on the basis of contract farming arrangements, (along with British American Tobacco in the case of tobacco). Contract farming arrangements have helped ease some constraints to processing activities.

Rural Development for Cambodia16
As noted by the World Bank (2006), weak formal institutions and excessive, unclear, and overlapping regulations impose very high informal and formal costs on households and businesses in Cambodia. In agriculture and the nonagricultural rural economy, the ongoing challenge is to create trade-supporting institutions to overcome market constraints, while avoiding the problems of inappropriate institutions that are associated with the investment climate for the urban formal sector.
C. Sources of Rural Economic Growth
In the last decade, the contribution of agriculture and agro-industry to overall economic growth has come largely through the accumulation of factors of production—land and labor—as a part of extensive growth of activity, with only modest improvement in productivity from very low levels. Rice is still the predominant crop, but there is some diversification and regional specialization (e.g., maize in the northwest and soybeans and cassava in the southeast) as farmers take advantage of agro-ecological systems and market opportunities. The Plain and Tonle Sap zones dominate in terms of total crop production value, and these two zones account for five to eight times the value generated in Coastal or Mountain/Plateau zones. All zones, except Phnom Penh, get three-fourths or more of their total crop value from rice production, indicating that crop specialization has yet to exert a significant influence on the structure of production (World Bank 2006).
The main sources of rural economic growth come from (i) a growth in land under production; (ii) a growth in the rural labor force; (iii) modest gains in agricultural productivity, mainly in non-rice crops; and (iv) public and private investment in agriculture and rural infrastructure (e.g., transport, irrigation, and processing), as well as substantial investment in social infrastructure such as health, education, and sanitation. The following subsections provide a brief analysis of these main factors.
1. Growth in Land under Production
Land is being brought into agricultural use mostly via conversion from forest and is averaging about 1% per annum (World Bank 2006, p. 60). The largest increase in absolute area has been in cereals, although this was also the lowest proportionate increase, while the fastest growth was for oilseeds, pulses, and roots and tubers (Figure 8). Vegetables had the lowest growth in both absolute and proportionate terms of all major crop groups. In Cambodia, only 7% of arable land is irrigated, well below the 20%–30% range in most neighboring countries (World Bank 2006, p. 60).
Despite demonstrated improvements in productivity with access to water, irrigation is limited. As of 2007, there are around 2,400 irrigation schemes in Cambodia, covering a total of 1.05 million season hectares (i.e., combined wet- and dry-season production). Most of these are small-scale schemes under 200 hectares, and only 33 large-scale (i.e., 5,000 hectares or above) schemes are in operation (Table 9).
According to the Strategic Development Plan of the Ministry of Water Resources and Meteorology (MOWRAM) (2009), MOWRAM increased the area under irrigation from 560,149 hectares in 2003 to 827,373 hectares in 2008 (representing 31.63% of the total cultivated area under paddy rice). This comprises 582,085 hectares of wet-season irrigation and 245,288 hectares of dry-season irrigation. According to its inventory statistics, the total wet season irrigated capacity is 773,188 hectares, and total dry season is 347,058 hectares, for a total capacity of 1,120,246 hectares. Thus, most agriculture is dependent on volatile rainfall patterns, with the attendant higher risks for the use of purchased inputs for small farmers, and reduced capacity to undertake crop activities during the dry season.
The impact of improved irrigation and drainage on agricultural production and the concomitant reduction in risk and volatility of yields are well documented (Yu et al. 2008). Samnang (2004) noted that if effective irrigation was extended to 1.2 million hectares (about 50% of the total rice area), production could increase to around 3.6 million tons in the dry season alone.

Performance of the Agriculture and Rural Sectors 17
Figure 8 10-Year Land Area, Total Production, and Yield for Paddy and Vegetables in Cambodia, 1998–2007
ha = hectare, mt = metric ton, t = ton.
Source: MAFF (2008).
0.0
0.5
1.0
1.5
2.0
2.5
3.0
3.5
4.0
4.5
5.0
0
50,000
100,000
150,000
200,000
250,000
300,000
1998 1999 2000 2001 2002 2003 2004 2005 2006 2007
VEGETABLES
8,000,000
7,000,000
6,000,000
5,000,000
4,000,000
3,000,000
Are
a (h
a) a
nd P
rod
uctio
n (T
)A
rea
(ha)
and
Pro
duc
tion
(MT
)
PADDY RICE
1998 1999 2000 2001 2002 2003
2,000,000
1,000,000
2004 2005 2006 20070.0
0.5
1.0
1.5
2.0
2.5
3.0
Yie
ld (T
/ha)
Yie
ld (M
T/h
a)
0
Area (ha)Production (MT) Yield (MT/ha)
Area (ha)
Year
Production (T) Yield (T/ha)
Year

Rural Development for Cambodia18
2. Growth in the Rural Labor Force
Labor force participation in Cambodia, as in most low-income countries, is high—87% in 2007. In Cambodia, the unemployed are officially defined as those in the labor force who do not work but are available for work and are seeking work during the past reference week. Using this definition, the percentage of the total labor force who are unemployed (i.e., the unemployment rate) was estimated at 3.5% in 2007 (World Bank 2008a).
Employment in Cambodia is characterized by a large proportion of the labor force that works in informal economic activities, either self-employed or for non-registered enterprises. Formal sector employment, despite strong growth, remains small, as only 25% of the workforce are paid employees, while the remainder are split roughly between self-employment and unpaid family labor. There has not yet been an official consensus on how many workers are engaged in informal economic activities, but the Cambodian Development Resource Institute estimated that 95% were employed by the informal sector in 2000–2001, while the Economic Institute of Cambodia estimated 85% (World Bank 2008a).
Labor force participation remains high in the agriculture sector, although it has fallen from 81% of total employed persons in 1993 to 59% in 2008 (Figure 7). The number of working-age adults for whom agriculture is the primary sector of activity has grown by over one-third over the last decade, or by about 3.4% per annum, to 4.81 million in 2008 (Figure 7). The high demographic growth rate in Cambodia, and limited absorption of labor into the secondary and tertiary sectors of the economy, leaves the agriculture sector to absorb a growing national labor force of about 290,000 new entrants per annum since 1993 (ADB 2008a). Some labor, however, also migrates abroad, mostly for seasonal or temporary employment (World Bank 2006).
As noted in Table 7, the manufacturing of food and beverages provides 48.5% of the total employment in the SME sector, of which the rice-milling subsector provides almost 47.3%. Despite providing significant levels of employment opportunities for the rural labor force, the SME sector remains significantly limited in scope relative to other sectors in the economy.
While available data cannot provide a complete picture of employment levels, ADB (2009b) noted that the manufacturing sector in 2008 absorbed 8.5% of the available labor force in Cambodia, or around 694,700 people (Figure 7). In 2006, this was 9.5% or 744,300 people. Comparing these data with the SEILA database from commune-level surveys across the country in 2006, Table 8 shows that 114,013 people were involved in SME activities, or 15.0% of total manufacturing employment.18
18 The Economic Institute of Cambodia (2008) noted that there were 368,000 people employed in the garment sector in 2006, which comprised 43.4% of the total manufacturing employment reported by ADB (2008a). Using data from the SEILA database showing 114,013 people involved in rural SME activities, corresponding to 13.4% of total manufacturing employment, the rural SME sector thus contributes significantly to rural labor force absorption.
Table 9 Inventory of Irrigation Systems in Cambodia, 2007
Irrigation Systems (No.)
Irrigation Area (hectares)
Wet Season Dry Season Total
Small-scale (less than 200 hectares) 1,415 91,154 69,078 160,232
Medium-scale (200–5,000 hectares) 955 372,121 246,583 618,704
Large-scale (more than 5,000 hectares) 33 165,753 101,574 267,327
Total 2,403 629,028 417,235 1,046,263
Source: Ministry of Water Resources and Meteorology (2009).

Performance of the Agriculture and Rural Sectors 19
3. Increases in Productivity
Productivity is the key to increased competitiveness and creating an attractive business environment for investors. EIC (2008) noted that the total productivity of workers in Cambodia increased by 6.1% per annum over the last decade, while real GDP growth rose by 9.3%. This GDP growth has allowed Cambodia to remain relatively competitive despite labor productivity not keeping pace. Labor force productivity in the industrial sector has slowed, going from 6.2% growth in 2006 to 2.4% in 2007, to only 1.0% in 2008. There are no current data for rural manufacturing, and the existing evidence is mixed.19
Growth in labor productivity has been limited to provinces linked with export market opportunities. Estimates of value added per worker in the agro-industrial sector vary hugely, between $300 and $3,000 per annum, with three provinces accounting for 95% of total output (i.e., Kampong Speu, 70%; Svay Rieng, 16%; and Battambang, 9%). All three are located along major international trade routes, a powerful indication of the impact of trade links to output. By all indications and by any measure, agribusiness has underperformed over the last decade, growing by an average of only 2.7% per annum, and its share in GDP has declined from 5.2% in 1994 to 3.3% in 2004 (World Bank 2006). In contrast to the manufacturing sector, growth in agricultural production in 2007 and 2008 has spurred agricultural productivity. Agricultural labor productivity grew by 3.3% in 2007, and was 4.0% in 2008 (EIC 2008).
The agriculture sector, overall, has grown very little through increases in land productivity. The simplest measure is physical yields of output per unit of land and/or labor input. While yields of some major crops such as cassava, maize, rice, and soybeans have grown during the past decade, the majority of crops have not (Figure 8, Figure 9, and Table 10).20 Cambodia’s relatively modest gains in yields and productivity indicators are telling in light of other neighboring countries’ performances (Table 11). Value added of agricultural output expressed in terms of labor and land productivity for Cambodia were the lowest among countries in Asia in 1978, and achieved very little progress over the subsequent 3 decades, leaving it even further behind (World Bank 2006).
Since 2005, yield increases in rice production have been modest and are a reflection of improved rainfall across the main rice-growing areas rather than an expansion in irrigation. As previously mentioned, maize production has benefited through contract farming in Battambang and Pailin provinces and the provision of improved hybrids, fertilizer, and pesticides by buyers in Thailand. Likewise, cassava production has benefited from increased commercial interest in contract farming for livestock feed, starch, and biofuel along the borders with Thailand and Viet Nam. The yields are due to both the procurement of high-yielding starch varieties from Thailand and Viet Nam and the conversion of highly fertile red soil land from rubber production to cassava, particularly in Kampong Cham Province.
Based on an analysis of the 2004 CSES and updated with 2007 data on yields and prices, Yu et al. (2008) reported that improvements can be achieved in agricultural productivity with the increased use of fertilizer and irrigation. Comparing the yield functions of wet and dry season agricultural production, application of fertilizer is the largest contributor to yield increases. Irrigation is also a major determinant of yield, as is access to markets. In addition, infrastructure services are important for both cropping seasons, although each season has different priorities. Human capital is also important, with literacy rates and access to government extension services shown to improve wet season yields. The results underscore the importance of modern inputs and infrastructure for increasing agricultural production value.
19 For example, the World Bank (2004b) noted that the value added per worker in agro-industry was 2.6 times lower than that for the garment sector. In contrast, statistics from the National Institute of Statistics (NIS 2006) for gross value added in the food and beverage SME sector indicated that labor productivity was around $3,133.00 per worker in 2005, up by 19.9% from 2004, compared with $1,678.80 for the textile and footwear industry in 2005, down by 30.0% from 2004.
20 Of the top 12 crops by land area, yields of cassava, groundnuts, maize, rice, and soybeans have increased over the past 7 years, while bananas, beans, coconuts, rubber, and sesame have remained stagnant or fallen.

Rural Development for Cambodia20
Figure 9 10-Year Land Area, Total Production, and Yield for Maize and Cassava in Cambodia, 1998–2007
ha = hectare, mt = metric ton.
Source: MAFF (2008).
0.0
0.5
1.0
1.5
2.0
2.5
3.0
3.5
4.0
0
100,000
200,000
300,000
400,000
500,000
600,000
1998 1999 2000 2001 2002
Year
Year
2003 2004 2005 2006 2007
Yie
ld (M
T/ha
)Y
ield
(MT/
ha)
MAIZEA
rea
(ha)
and
Pro
duc
tion
(MT
)A
rea
(ha)
and
Pro
duc
tion
(MT
)
Area (ha)Production (MT) Yield (MT/ha)
0
5
10
15
20
25
0
500,000
1,000,000
1,500,000
2,000,000
2,500,000
1998 1999 2000 2001 2002 2003 2004 2005 2006 2007
CASSAVA
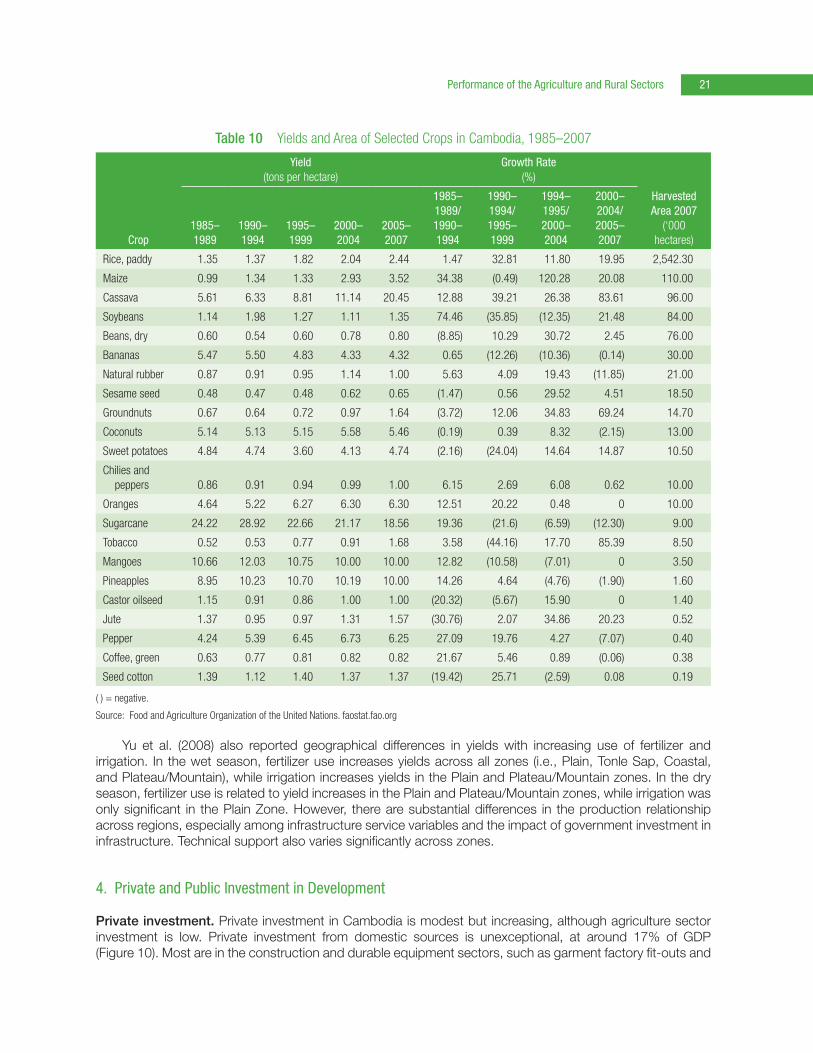
Performance of the Agriculture and Rural Sectors 21
Yu et al. (2008) also reported geographical differences in yields with increasing use of fertilizer and irrigation. In the wet season, fertilizer use increases yields across all zones (i.e., Plain, Tonle Sap, Coastal, and Plateau/Mountain), while irrigation increases yields in the Plain and Plateau/Mountain zones. In the dry season, fertilizer use is related to yield increases in the Plain and Plateau/Mountain zones, while irrigation was only significant in the Plain Zone. However, there are substantial differences in the production relationship across regions, especially among infrastructure service variables and the impact of government investment in infrastructure. Technical support also varies significantly across zones.
4. Private and Public Investment in Development
Private investment. Private investment in Cambodia is modest but increasing, although agriculture sector investment is low. Private investment from domestic sources is unexceptional, at around 17% of GDP (Figure 10). Most are in the construction and durable equipment sectors, such as garment factory fit-outs and
Table 10 Yields and Area of Selected Crops in Cambodia, 1985–2007
Yield
(tons per hectare)Growth Rate
(%)
Harvested Area 2007
(‘000 hectares)Crop
1985–1989
1990–1994
1995–1999
2000–2004
2005–2007
1985–1989/ 1990–1994
1990–1994/ 1995–1999
1994–1995/ 2000–2004
2000–2004/ 2005–2007
Rice, paddy 1.35 1.37 1.82 2.04 2.44 1.47 32.81 11.80 19.95 2,542.30
Maize 0.99 1.34 1.33 2.93 3.52 34.38 (0.49) 120.28 20.08 110.00
Cassava 5.61 6.33 8.81 11.14 20.45 12.88 39.21 26.38 83.61 96.00
Soybeans 1.14 1.98 1.27 1.11 1.35 74.46 (35.85) (12.35) 21.48 84.00
Beans, dry 0.60 0.54 0.60 0.78 0.80 (8.85) 10.29 30.72 2.45 76.00
Bananas 5.47 5.50 4.83 4.33 4.32 0.65 (12.26) (10.36) (0.14) 30.00
Natural rubber 0.87 0.91 0.95 1.14 1.00 5.63 4.09 19.43 (11.85) 21.00
Sesame seed 0.48 0.47 0.48 0.62 0.65 (1.47) 0.56 29.52 4.51 18.50
Groundnuts 0.67 0.64 0.72 0.97 1.64 (3.72) 12.06 34.83 69.24 14.70
Coconuts 5.14 5.13 5.15 5.58 5.46 (0.19) 0.39 8.32 (2.15) 13.00
Sweet potatoes 4.84 4.74 3.60 4.13 4.74 (2.16) (24.04) 14.64 14.87 10.50
Chilies and peppers 0.86 0.91 0.94 0.99 1.00 6.15 2.69 6.08 0.62 10.00
Oranges 4.64 5.22 6.27 6.30 6.30 12.51 20.22 0.48 0 10.00
Sugarcane 24.22 28.92 22.66 21.17 18.56 19.36 (21.6) (6.59) (12.30) 9.00
Tobacco 0.52 0.53 0.77 0.91 1.68 3.58 (44.16) 17.70 85.39 8.50
Mangoes 10.66 12.03 10.75 10.00 10.00 12.82 (10.58) (7.01) 0 3.50
Pineapples 8.95 10.23 10.70 10.19 10.00 14.26 4.64 (4.76) (1.90) 1.60
Castor oilseed 1.15 0.91 0.86 1.00 1.00 (20.32) (5.67) 15.90 0 1.40
Jute 1.37 0.95 0.97 1.31 1.57 (30.76) 2.07 34.86 20.23 0.52
Pepper 4.24 5.39 6.45 6.73 6.25 27.09 19.76 4.27 (7.07) 0.40
Coffee, green 0.63 0.77 0.81 0.82 0.82 21.67 5.46 0.89 (0.06) 0.38
Seed cotton 1.39 1.12 1.40 1.37 1.37 (19.42) 25.71 (2.59) 0.08 0.19
( ) = negative.
Source: Food and Agriculture Organization of the United Nations. faostat.fao.org

Rural Development for Cambodia22
Table 11 Indicators of Factor Productivity in Selected Countries in Asia
CountryIrrigated Land
(% arable)Agricultural Value Added per Worker,
2003–2005, $Fertilizer Use, 2003–2005
(kilogram per hectare)
India 32.7 219 107
Republic of Korea 47.1 6,922 389
Philippines 14.5 429 84
Viet Nam 33.9 182 245
Cambodia 7.0 181 3
Thailand 26.6 554 113
Malaysia 4.8 2,898 203
Lao People’s Democratic Republic 17.2 264
Indonesia 12.7 421 91
People’s Republic of China 47.5 292 395
Source: Various sources, cited in Alamgir (2008).
other medium-sized industry. Cambodia still relies heavily on foreign direct investment (FDI) to fund investment projects, and outflows of income continue to expand, largely in the form of dividends and profits from foreign investments and payments for foreign technical assistance (EIC 2008). EIC (2008) noted that in 2008, the income account was expected to reach a deficit of around $340 million, or 3.9% percent of GDP, an increase of 19.3% from 2007. Despite this, the economy was expected to have a net surplus in its transfers account of around $809 million, or 7.3% of GDP, due to significant net private transfers into the country for the garment, tourism, and construction industries, as well as a large inflow of foreign aid.
Figure 10 Gross Domestic Capital Formation in Cambodia, 1990–2008
GDP = gross domestic product.
Source: ADB (2009b).
60
50
40
30
20
10
0
–10
–20
–30
%
1990
1991
1992
1993
1994
1995
1996
1997
1998
1999
2000
2001
2002
2003
2004
2005
2006
2007
2008
Year
Annual Growth Rate % of GDP
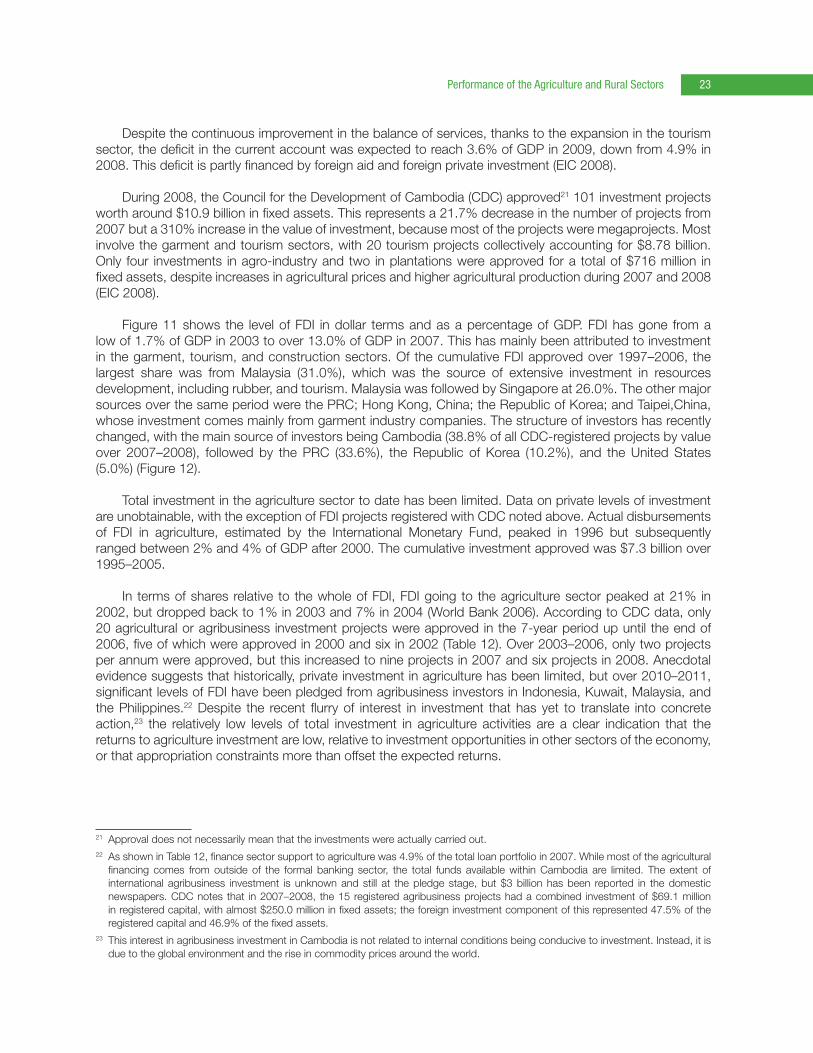
Performance of the Agriculture and Rural Sectors 23
Despite the continuous improvement in the balance of services, thanks to the expansion in the tourism sector, the deficit in the current account was expected to reach 3.6% of GDP in 2009, down from 4.9% in 2008. This deficit is partly financed by foreign aid and foreign private investment (EIC 2008).
During 2008, the Council for the Development of Cambodia (CDC) approved21 101 investment projects worth around $10.9 billion in fixed assets. This represents a 21.7% decrease in the number of projects from 2007 but a 310% increase in the value of investment, because most of the projects were megaprojects. Most involve the garment and tourism sectors, with 20 tourism projects collectively accounting for $8.78 billion. Only four investments in agro-industry and two in plantations were approved for a total of $716 million in fixed assets, despite increases in agricultural prices and higher agricultural production during 2007 and 2008 (EIC 2008).
Figure 11 shows the level of FDI in dollar terms and as a percentage of GDP. FDI has gone from a low of 1.7% of GDP in 2003 to over 13.0% of GDP in 2007. This has mainly been attributed to investment in the garment, tourism, and construction sectors. Of the cumulative FDI approved over 1997–2006, the largest share was from Malaysia (31.0%), which was the source of extensive investment in resources development, including rubber, and tourism. Malaysia was followed by Singapore at 26.0%. The other major sources over the same period were the PRC; Hong Kong, China; the Republic of Korea; and Taipei,China, whose investment comes mainly from garment industry companies. The structure of investors has recently changed, with the main source of investors being Cambodia (38.8% of all CDC-registered projects by value over 2007–2008), followed by the PRC (33.6%), the Republic of Korea (10.2%), and the United States (5.0%) (Figure 12).
Total investment in the agriculture sector to date has been limited. Data on private levels of investment are unobtainable, with the exception of FDI projects registered with CDC noted above. Actual disbursements of FDI in agriculture, estimated by the International Monetary Fund, peaked in 1996 but subsequently ranged between 2% and 4% of GDP after 2000. The cumulative investment approved was $7.3 billion over 1995–2005.
In terms of shares relative to the whole of FDI, FDI going to the agriculture sector peaked at 21% in 2002, but dropped back to 1% in 2003 and 7% in 2004 (World Bank 2006). According to CDC data, only 20 agricultural or agribusiness investment projects were approved in the 7-year period up until the end of 2006, five of which were approved in 2000 and six in 2002 (Table 12). Over 2003–2006, only two projects per annum were approved, but this increased to nine projects in 2007 and six projects in 2008. Anecdotal evidence suggests that historically, private investment in agriculture has been limited, but over 2010–2011, significant levels of FDI have been pledged from agribusiness investors in Indonesia, Kuwait, Malaysia, and the Philippines.22 Despite the recent flurry of interest in investment that has yet to translate into concrete action,23 the relatively low levels of total investment in agriculture activities are a clear indication that the returns to agriculture investment are low, relative to investment opportunities in other sectors of the economy, or that appropriation constraints more than offset the expected returns.
21 Approval does not necessarily mean that the investments were actually carried out.22 As shown in Table 12, finance sector support to agriculture was 4.9% of the total loan portfolio in 2007. While most of the agricultural
financing comes from outside of the formal banking sector, the total funds available within Cambodia are limited. The extent of international agribusiness investment is unknown and still at the pledge stage, but $3 billion has been reported in the domestic newspapers. CDC notes that in 2007–2008, the 15 registered agribusiness projects had a combined investment of $69.1 million in registered capital, with almost $250.0 million in fixed assets; the foreign investment component of this represented 47.5% of the registered capital and 46.9% of the fixed assets.
23 This interest in agribusiness investment in Cambodia is not related to internal conditions being conducive to investment. Instead, it is due to the global environment and the rise in commodity prices around the world.

Rural Development for Cambodia24
Figure 11 Foreign Direct Investment and External Assistance in Cambodia, 1993–2007
FDI = foreign direct investment, GDP = gross domestic product.
Note: External assistance calculated as grants and foreign borrowing under central government finance.
Source: ADB (2008a).
0.0
2.0
4.0
6.0
8.0
10.0
12.0
14.0
0
100
200
300
400
500
600
700
800
900
1000
1993
1994
1995
1996
1997
1998
1999
2000
2001
2002
2003
2004
2005
2006
2007
FDI (
% G
DP
)
FDI (
$ m
illio
n)
Year
External assistance ($ million) % of GDP
0.0
2.0
4.0
6.0
8.0
10.0
12.0
14.0
0
100
200
300
400
500
600
700
800
900
1000
1993
1994
1995
1996
1997
1998
1999
2000
2001
2002
2003
2004
2005
2006
2007
% o
f G
DP
$ m
illio
n
Year
FDI ($ million) % of GDP

Performance of the Agriculture and Rural Sectors 25
Figure 12 Foreign Direct Investment in Cambodia by Source, 2007–2008
Note: Projects approved from 1 January 2007 to 31 December 2008 by value of fixed assets.
Source: Cambodian Investment Board (CIB, Council for the Development of Cambodia [CDC]). Phnom Penh.
Cambodia, 38.8%
People’s Republic of China, 33.6%
Republic ofKorea, 10.2%
United States, 5.0%
Israel, 2.2%
Malaysia, 1.8%
Thailand, 1.3%
Viet Nam, 1.2%
Rest of World, 12.4%
Table 12 Foreign Direct Investment in Cambodia, 1997–2008
1997 1998 1999 2000 2001 2002 2003 2004 2005 2006 2007 2008 1997–2008Ratio (%)
Agriculture 19 4 8 5 1 6 2 2 2 2 9 6 66 6.36
Manufacturing 168 124 74 40 28 19 29 48 54 42 96 66 788 75.92
Wood processing 8 7 1 0 1 1 2 1 2 23 2.22
Cement 4 2 1 0 1 1 1 10 0.96
Building material 4 4 1 9 0.87
Food processing 11 1 5 1 1 2 1 1 1 24 2.31
Garment 98 83 48 23 14 13 19 36 53 40 39 38 504 48.55
Footwear 13 6 5 2 1 3 2 32 3.08
Electronics 1 0 0 2 1 4 0.39
Machinery 0 2 3 2 2 9 0.87
Others 29 23 11 6 10 5 6 8 51 24 173 16.67
Service 17 16 11 16 10 9 16 10 6 7 23 29 170 16.38
Tourism 7 7 2 8 6 3 10 5 6 7 11 20 92 8.86
Others 10 9 9 8 4 6 6 5 13 9 79 7.61
Total 204 144 93 61 39 34 47 60 65 61 129 101 1,038
Note: Blank spaces indicate data not available.
Source: CDC et al. http://www.cambodiainvestment.gov.kh/?q=ii_fdi_trend

Rural Development for Cambodia26
Ex�ternal assistance and public investment. In each sector, external assistance has been guided by both donor and government strategy. The government’s strategy for agricultural and rural development has been articulated in a number of strategies and programs, starting in 1994, and has been continuously updated over time. The National Program to Rehabilitate and Develop Cambodia was implemented in 1994–1995, before being superseded by the First Socio-Economic Development Plan (SEDP), 1996–2000; and then the Second SEDP, 2001–2005. Overlapping plans have included the long-term Triangle Strategy, 2001–2015 and the National Poverty Reduction Strategy, 2003–2005. These were replaced by the Rectangular Strategy for Growth, Employment, Equity, and Effi ciency, 2004; and the National Strategic Development Plan, 2006–2010, which was then updated for 2009–2013 (RGC 2009). Both of these current policy documents highlight the role of agricultural development as a vehicle for rural development in Cambodia (Figure 13).
For more nearly 2 decades, Cambodia has been the recipient of development assistance from international donor agencies as well as scores of nongovernment organizations (NGOs). Initial efforts in the 1990s were directed toward famine relief, poverty alleviation, community development, and rebuilding
Figure 13 Rectangular Strategy for Growth, Employment, Equity, and Effi ciency, Phase II
ICT = information and communication technology, SMEs = small and medium-sized enterprises.
Source: RGC (2009).
Implementation ofgender policy
Implementation ofpopulation policy
Enhancinghealth services
Strengthening of thequality of education
Strengthening
private sector
and attracting
investment
Creation of job
s and
ensuring imp
roved
working cond
itions
Prom
oting SM
Es
Creation of
social safety nets
Improving agricultureproductivity anddiversification
Land reform andclearing of mines
Fisheries reform Forestry reform
Man
agem
ent
of w
ater
reso
urce
s an
d ir
rigat
ion
Furt
her
reha
bili
tatio
nan
d c
onst
ruct
ion
oftr
ansp
ort
infr
astr
uctu
re
Dev
elop
men
t of
the
ener
gy s
ecto
rD
evel
opm
ent
of IC
T
Partnership
ind
evelopm
ent
Favorable macroeconomicand financial environment
Fightingcorruption
Legal andjudicial reform
Publicadministration
reform
Reform of theCambodian
Armed Forces
Peace, political stability,security, and social order
Cam
bod
ia’s
inte
grat
ion
into
the
reg
ion
and
the
wor
ld
Good Governance
Private S
ector D
evelop
ment
and E
mp
loym
ent Generatio
n
Capacity Building and Human Resources Development
Enhancement of Agriculture Sector
Fur
ther
Reh
abili
tatio
n an
d
Co
nstr
uctio
n o
f P
hysi
cal I
nfra
stru
ctur
e

Performance of the Agriculture and Rural Sectors 27
infrastructure. Since 2000, increasing emphasis has been placed on health, education, and good governance initiatives. Table 13 shows the number of official development assistance projects by sector, indicating that in 2007 there were 196 projects in agriculture and 156 projects in rural development. Some of the projects in the manufacturing sector involved SME development, which could be classified as relevant to rural development initiatives. As also shown in Table 13, the global financial crisis has impacted heavily on official development assistance funding allocated to Cambodia. There has been a marked drop in the number of ongoing projects across all sectors, with the exception of emergency and food aid, which has increased.
Table 14 shows NGO funding by sector (not including direct development partner initiatives) for 2007, while Table 15 shows the funding for 2008 and 2009. In 2007, the majority of funding went into the health sector (43.2%, including HIV/AIDS), education (12.9%), and governance programs (12.5%). Agriculture and rural development was only 11.7% of total NGO-financed projects in 2007. By 2009, the NGO funding landscape had changed, as donor funding was cut due to the global financial crisis. Some 46.8% of NGO disbursements were in the governance and administration sector, while health (including HIV/AIDS) was reduced to 22.9% of all disbursements. Social welfare fell to 12.9% from 25.4% in 2008, while agriculture and rural development comprised 4.6% of spending.
External assistance to Cambodia across all sectors has been modest compared with FDI. ADB (2008a) data indicated that total grants and foreign borrowings of the central government accounted for 6.7% of GDP in 2007, and this has slowly been rising since 2004 where it was 4.6% of GDP (Figure 11).
Table 13 shows official development assistance funding for private sector development activities by donor and sector from 2000 to 2013 (as committed by the end of 2007). Overall, some $409.5 million was allocated to a diverse range of initiatives, including agriculture and SME development. The data show that despite a clear need for rural development, foreign aid flows have been skewed away from agriculture. Despite the size of the agriculture sector, the share of foreign aid going to the sector since 1999 has only been 8%–10%. Most of this funding has been for technical assistance, often for institutional capacity building, and the impact of such technical assistance has been largely disappointing (World Bank 2006).
Table 13 Number of Official Development Assistance Projects in Cambodia, 2007 and 2010
Sector or Subsector
Number of Ongoing Projects
Sector or Subsector
Number of Ongoing Projects
2007 2010Difference
(%) 2007 2010Difference
(%)
Social Services and Cross-Sector Programs
Health 202 82 (59) Community and social welfare 124 45 (64)
Education 218 85 (61) Culture and arts 35 22 (37)
Economic Environment and conservation 70 26 (63)
Agriculture 196 134 (32) Gender 34 19 (44)
Manufacturing, mining, and trade 60 19 (68) HIV/AIDS 42 23 (45)
Rural development 156 65 (58) Governance and administration 315 142 (55)
Banking and business services 39 15 (62) Tourism 12 5 (58)
Urban planning and management 18 9 (50) Budget and balance of payments support 9 7 (22)
Infrastructure Emergency and food aid 7 8 14
Information and communications 66 10 (85) Others 49 19 (61)
Energy, power, and electricity 40 16 (60)
Transport 72 43 (40)
Water and sanitation 46 17 (63)
Source: Cambodia Rehabilitation and Development Board and CDC. http://cdc.khmer.biz

Rural Development for Cambodia28
Table 14 Nongovernment Organization Disbursement by Sector, 2007
Nongovernment Organization Funded by Donors
Nongovernment Organization Core Funds Total
Sector ($ million) (%) ($ million) (%) ($ million) (%)
Health 22.5 22.4 32.1 41.3 54.6 30.7
Education 7.1 7.1 15.9 20.4 23 12.9
Agriculture 3.2 3.1 2.8 3.6 6 3.3
Manufacturing, mining, and trade 4.3 4.3 0.3 0.4 4.6 2.6
Rural development 7.4 7.4 7.6 9.8 15 8.4
Banking and business services 1.3 1.3 0.3 0.4 1.6 0.9
Information and communications 0.1 0.2 0.1 0.1
Transport 0 0 0 0
Water and sanitation 0.7 0.7 0.2 0.3 0.9 0.5
Community and social welfare 5.3 5.3 13.4 17.3 18.8 10.6
Culture and arts 0.4 0.5 0.4 0.2
Environment and conservation 2.3 2.3 0.9 1.2 3.3 1.9
Gender 1.7 1.7 1.7 0.9
HIV/AIDS 18.9 18.8 3.3 4.3 22.2 12.5
Governance and administration 21.9 21.8 0.3 0.4 22.2 12.5
Tourism 0 0 0 0
Others 3.7 3.6 3.7 2.1
Total 100.3 100.0 77.7 100.0 178.1 100.0
Note: Only nongovernment organization funding, does not include multilateral and bilateral donor support. Blank spaces indicate data not available.
Sources: Cambodia Rehabilitation and Development Board and CDC. http://cdc.khmer.biz
External support to agriculture and rural development in 2007 was around $114.0 million, compared with a total aid allocation across all sectors of $790.4 million (14.4%). The CDC noted that overall external support was equivalent to 95% of National Poverty Reduction Strategy financing requirements in 2007, continuing reallocation toward the agriculture and rural development sectors, ensuring that priorities in the Rectangular Strategy could be adequately supported.
Public investment in the agriculture sector, inclusive of both domestic and donor funds, has grown in recent years but remains low. Public investment is around 1.4% of agricultural GDP or about 0.5% of total GDP (World Bank 2006). The main vehicles for such investments in the sector were the programs of the Ministry of Agriculture, Forestry and Fisheries (MAFF), MOWRAM, and Ministry of Rural Development (MRD). Government investment has been limited to an average of 2.2% of total government expenditure since 2000 and has not been related to sector performance. The data in Figure 14 show that government expenditure shares in agriculture fluctuated widely at the same time as agricultural growth rates, but without any correlation. As noted previously, the main driver for changes in agricultural growth has been related to the climate, with variations in rainfall, flooding, and incidences of pest infestation affecting crop production and, hence, agricultural GDP. Despite a significant proportion of government investment and external financing spent on rural infrastructure, primarily roads, and irrigation schemes, these have yet to translate into reducing production risk and yield variability.
Investment in rural infrastructure has been low, and this has resulted in lower rates of rural development. As an example, the World Bank (2007) and Yu et al. (2008) noted that inadequate rural roads and poor road maintenance impede development in Cambodia. The country has the least-developed road network in the

Performance of the Agriculture and Rural Sectors 29
Table 15 Nongovernment Organization Disbursement by Sector, 2008–2009
No. Sector
Disbursements in 2008 Disbursements in 2009
NGO Core Funds
NGO Funded by Donors Total %
NGO Core Funds
NGO Funded by Donors Total %
1 Agriculture 1,223,649 4,197,133 5,420,781 2.6 1,337,582 4,550,283 5,887,865 1.5
2 Banking and business services 67,933 67,933 0 92,202 92,202 0
3 Community and social welfare 31,660,395 21,686,820 53,347,215 25.4 32,464,497 19,595,853 52,060,351 12.9
4 Culture and arts 112,649 314,089 426,738 0.2 128,541 222,722 351,263 0.1
5 Education 26,757,327 8,377,916 35,135,243 16.7 27,379,293 8,365,217 35,744,510 8.8
6 Energy, power, and electricity 0 0
7 Environment and conservation 1,536,318 9,147,203 10,683,521 5.1 4,404,327 10,053,782 14,458,109 3.6
8 Gender 232,051 111,243 343,294 0.2 295,790 243,267 539,057 0.1
9 Governance and administration 169,676 5,056,318 5,225,994 2.5 52,058 189,089,450 189,141,508 46.8
10 Health 36,818,430 27,632,047 64,450,477 30.6 32,630,879 37,792,952 70,423,831 17.4
11 HIV/AIDS 5,305,668 15,703,667 21,009,334 10.0 3,349,034 18,817,239 22,166,273 5.5
12 Information and communications 0 0
13 Manufacturing, mining, and trade 121,774 454,110 575,884 0.3 241,035 241,035 0.1
14 Rural development 1,287,356 12,161,135 13,448,491 6.4 1,402,694 11,177,729 12,580,423 3.1
15 Tourism 62,795 62,795 0 74,181 466,425 540,606 0.1
16 (Not reported) 142,239 142,239 0.1 174,006 174,006 0
Total 105,435,464 104,904,476 210,339,940 100.0 103,785,084 300,615,953 404,401,037 100.0
NGO = nongovernment organization.
Note: Blank spaces indicate data not available.
Sources: Cambodia Rehabilitation and Development Board and CDC. http://cdc.khmer.biz.
region with the smallest percentage of paved roads. Of the 12,323 kilometers of the existing road network in Cambodia, only 16.2% is paved. In comparison, Thailand has 98.0% of its road network paved; the Lao People’s Democratic Republic, 14.4%; and Viet Nam 25.0% (Table 17). There are no secondary roads, and tertiary roads often feed directly into the primary network. In addition, Cambodia’s rail system is in need of major rehabilitation.
Road conditions are worse in rural areas, particularly in the northwest and northeast. In 2003, only 41.5% of rural roads were trafficable (World Bank 2004a). Phyrum (2007) noted that only 0.3% of rural roads were paved. In most cases, more than 70% of the unpaved rural road network is accessible in the wet season, often forcing some parts of the country to stay isolated and face potential economic difficulties. Additionally, about 15% of the rural population (1.6 million people) lived more than 5 kilometers away from an all-season accessible road in 2005, and 11% of them needed to travel more than 30 minutes by motorcycle to reach the nearest all-season road (Yu et al. 2008).
The annual investment in rural roads took up to 64% of the total infrastructure investment during 2002–2005. In absolute terms, the annual investment in rural roads has increased from $2.7 million in 2002

Rural Development for Cambodia30
Figure 14 Agricultural Growth and Government Investment Share in Cambodia, 1990–2007
GDP = gross domestic product.
Source: Calculations based on ADB (2008a).
1994
1995
1996
19971998
1999
2000
2001
2002
2003
2004
2005
2006
2007
–5.0
0.0
5.0
10.0
15.0
20.0
0.0 0.5 1.0 1.5 2.0 2.5 3.0
Gro
wth
in A
gri
cultu
ral G
DP
(%)
Government Investment in Agriculture (% of total expenditure)
GROWTH IN AGRICULTURE VERSUS GOVERNMENT INVESTMENT IN AGRICULTURE AS A PERCENT OF TOTAL GOVERNMENT EXPENDITURES
GROWTH IN AGRICULTURE VERSUS GOVERNMENT INVESTMENT IN AGRICULTURE AS A PERCENT OF TOTAL GDP
1994
1995
1996
19971998
1999
2000
2001
2005
2007
–5.0
0.0
5.0
10.0
15.0
20.0
0.10 0.12 0.14 0.16 0.18 0.20 0.22 0.24 0.26
Ag
ricu
ltur
al G
DP
Gro
wth
(%)
Public Sector Expenditure on Agriculture (% of GDP)
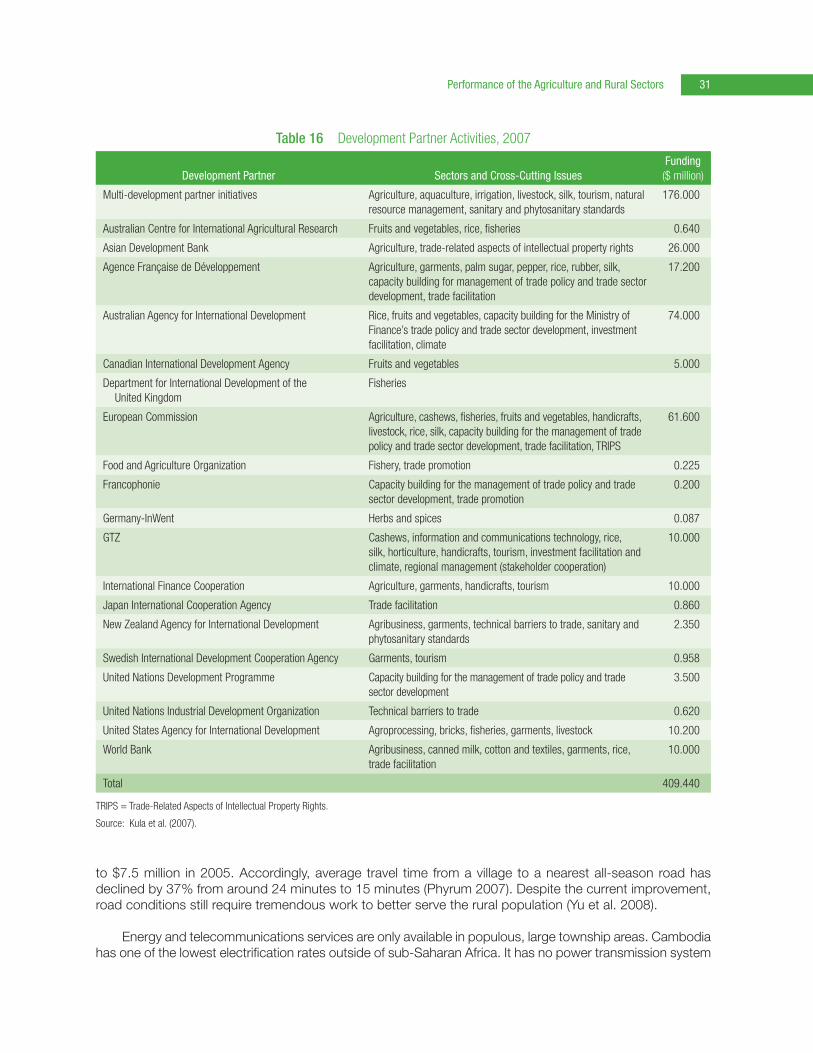
Performance of the Agriculture and Rural Sectors 31
Table 16 Development Partner Activities, 2007
Development Partner Sectors and Cross-Cutting IssuesFunding
($ million)
Multi-development partner initiatives Agriculture, aquaculture, irrigation, livestock, silk, tourism, natural resource management, sanitary and phytosanitary standards
176.000
Australian Centre for International Agricultural Research Fruits and vegetables, rice, fisheries 0.640
Asian Development Bank Agriculture, trade-related aspects of intellectual property rights 26.000
Agence Française de Développement Agriculture, garments, palm sugar, pepper, rice, rubber, silk, capacity building for management of trade policy and trade sector development, trade facilitation
17.200
Australian Agency for International Development Rice, fruits and vegetables, capacity building for the Ministry of Finance’s trade policy and trade sector development, investment facilitation, climate
74.000
Canadian International Development Agency Fruits and vegetables 5.000
Department for International Development of the United Kingdom
Fisheries
European Commission Agriculture, cashews, fisheries, fruits and vegetables, handicrafts, livestock, rice, silk, capacity building for the management of trade policy and trade sector development, trade facilitation, TRIPS
61.600
Food and Agriculture Organization Fishery, trade promotion 0.225
Francophonie Capacity building for the management of trade policy and trade sector development, trade promotion
0.200
Germany-InWent Herbs and spices 0.087
GTZ Cashews, information and communications technology, rice, silk, horticulture, handicrafts, tourism, investment facilitation and climate, regional management (stakeholder cooperation)
10.000
International Finance Cooperation Agriculture, garments, handicrafts, tourism 10.000
Japan International Cooperation Agency Trade facilitation 0.860
New Zealand Agency for International Development Agribusiness, garments, technical barriers to trade, sanitary and phytosanitary standards
2.350
Swedish International Development Cooperation Agency Garments, tourism 0.958
United Nations Development Programme Capacity building for the management of trade policy and trade sector development
3.500
United Nations Industrial Development Organization Technical barriers to trade 0.620
United States Agency for International Development Agroprocessing, bricks, fisheries, garments, livestock 10.200
World Bank Agribusiness, canned milk, cotton and textiles, garments, rice, trade facilitation
10.000
Total 409.440
TRIPS = Trade-Related Aspects of Intellectual Property Rights.
Source: Kula et al. (2007).
to $7.5 million in 2005. Accordingly, average travel time from a village to a nearest all-season road has declined by 37% from around 24 minutes to 15 minutes (Phyrum 2007). Despite the current improvement, road conditions still require tremendous work to better serve the rural population (Yu et al. 2008).
Energy and telecommunications services are only available in populous, large township areas. Cambodia has one of the lowest electrification rates outside of sub-Saharan Africa. It has no power transmission system

Rural Development for Cambodia32
and has developed no large generation capacity. Where electricity is available, firms and individual consumers face some of the highest energy costs in the world. In rural areas, electrification is largely absent, making the cost of energy in agricultural production relatively high (World Bank 2004b). Electricity consumption per capita is less than 10% of Viet Nam and Thailand (Table 17).
An extremely low level of infrastructure (i.e., roads, electricity, and telecommunications) raises marketing costs, reducing sale volumes and profits for smallholder farmers. There is evidence that poor transport, electricity supply, and telecommunications have a significant, negative impact on the operation and growth of Cambodian firms (World Bank 2004b; Yu et al. 2008). Yu et al. (2008) estimated, using 2004 CSES data, that infrastructure improvements (e.g., reducing the distance to permanent markets, increasing the incidence of electrification, and improving telecommunications) impact crop yields in both the wet and dry seasons, although each season and different agro-ecological zones have different priorities.
Clearly, improved infrastructure benefits the economy in general, but the initial benefits in rural areas will occur mostly through increases in agricultural income. For example, Purcell and Rich (2002), estimated that improvement in export-orientated infrastructure could increase agricultural income by 5% and rice exports by 25%.
In looking at the CSESs, the results suggest that access to infrastructure, such as roads, raises household income primarily through the provision of better access to nonfarm opportunities, and revenue from cultivation or crop profitability is not systematically higher among those with better road access (World Bank 2007). The results also indicate that facilitating small agro-enterprise businesses to link with markets will provide income generation, consistent with the premise that infrastructure allows additional opportunities for value-added processes.
D. The Finance Sector
The finance sector services a large proportion of the commercial business sector in Cambodia and has substantial outreach in rural areas. The Law on the Organization and Conduct of the National Bank of Cambodia (the Central Banking Law) of 1996 established the role of the National Bank of Cambodia as the regulator and supervisor (IFC 2007). The Law on Banking and Financial Institutions of 1999 and several decrees regulate three types of banks: (i) commercial banks that can conduct all banking activities, (ii) specialized banks that can conduct one category of banking activities, and (iii) licensed microfinance institutions that can offer credit.
Table 17 Infrastructure Services Coverage in Cambodia and Neighboring Countries, 2001–2007
Country% of Total Roads
Paved% of People with Telephone
MainlinesElectric Power Consumption
(kilowatt-hour per capita)
Cambodia 6.3 0.2 14.6
People’s Republic of China 81.6 28.0 1,781.0
Indonesia 55.3 6.6 509.0
Lao People’s Democratic Republic 14.4 1.3 179.0
Malaysia 81.3 16.6 3,262.0
Myanmar 11.9 1.1 82.0
Philippines 9.9 4.2 588.0
Thailand 98.0 11.1 1,988.0
Viet Nam 25.0 19.1 573.0
Source: World Bank (2008b).

Performance of the Agriculture and Rural Sectors 33
Table 18 Deposits and Loans in Cambodia’s Financial Institutions, 2008 and 2009 ($ million)
Financial Institution
Outstanding Loans Deposit Balance No. of Borrowers No. of Depositors
31 Mar 2008
31 Dec 2009
31 Mar 2008
31 Dec 2009
31 Mar 2008
31 Dec 2009
31 Mar 2008
31 Dec 2009
ACLEDA 418.64 538.24 417.32 688.02 192,889 247,987 291,169 603,224
PRASAC 36.06 64.09 0.13 0.48 71,129 87,945 3,140 1,444
AMRET 32.28 53.15 0.88 2.93 178,710 224,708 840 3,293
CEB 27.33 1.70 28,232 19,052
HKL 17.73 31.18 0.72 1.51 26,915 41,110 29,000 47,835
TPC 14.16 17.38 0.10 0.10 75,199 91,170 16,256 4,048
VFC 13.71 21.31 0.15 0.05 58,310 98,777 84 61
AMK 13.30 25.13 0.16 0.17 130,809 217,818 14,701 5,234
CREDIT 11.92 22.37 1.15 0.61 20,498 39,358 9,157 2,191
SEILANITHIH 4.62 6.29 0.32 0.41 4,850 10,433 5,313 11,017
CHC 2.58 0.01 6,921 4,462
IPR 2.31 4.00 0 3,261 4,219
EAP 1.86 1.91 0 235 198 1
CBIRD 1.01 1.26 0.15 0.12 1,799 2,294 2,218 2,595
MAXIMA 0.96 1.71 0.01 0 1,611 2,467 4
TFMF 0.18 0.09 0 802 131
PAS 0.16 0 323 1
SATHAPANA 39.69 3.06 36,228 22,875
SAMIC 5.55 0.03 10,987 2,300
FUDF 1.44 0 2,545
GCMF 1.26 0 868
CHAMROEUN (NGO) 0.68 0.20 7,158 23,139
First Finance 0.49 0 39
Farmer Finance 0.21 0.04 66 66
YCP 0.12 0 40
Total 598.80 299.30 422.81 9.70 802,493 878,559 395,397 126,099
ACLEDA = Association of Cambodia Local Economic Development Agencies, AMK = Angkor Microheranhvatho Kampuchea, AMRET = AMRET Microfinance Institution, CBIRD = Cambodian Business Integrated in Rural Development Agency, CEB = formerly Cambodian Entrepreneur Building Limited, CHAMROEUN (NGO) = Chamroeun Microfinance Limited, CHC = formerly Cambodia Health Committee, CREDIT = Cambodia Rural Economic Development Initiatives for Transformation Microfinance Institution, EAP = Entean Akpevath Pracheachun Microfinance Institution, Farmer Finance = Farmer Finance Limited, First Finance = First Finance Microfinance Institution, FUDF = Farmer Union Development Fund, GCMF = Green Central Micro Finance Limited, HKL = Hattha Kaksekar Limited, IPR = Intean Poalroath Rongroeurng Microfinance Institution, MAXIMA = Maxima Microfinance Institution, PAS = Sihanoukville Autonomous Port, PRASAC = PRASAC Microfinance Institution, SAMIC = Samic Microfinance Institution, SATHAPANA = Sathapana Limited (formerly CEB), SEILANITHIH = Seilanithih Microfinance Institution, TFMF = Tong Fang Micro Finance Limited, TPC = Thaneakea Phum Cambodia Limited, VFC = Vision Fund (Cambodia) Limited, YCP = YCP Microfinance.
Note: Blank spaces indicate data not available.
Source: Cambodian Central Bank.
As of the end of 2007, the banking system included 17 commercial banks, 7 specialized banks, 17 microfinance institutions, and 25 registered rural credit operators (NBC 2008). By the end of 2009, the banking structure changed due to the global financial crisis, merging some microfinance institutions and closing some nonperforming commercial banks (Table 18). The trend in private sector credit availability rapidly declined from July 2008 and had yet to recover by 2010 (Figure 15).

Rural Development for Cambodia34
In 2007, about 286,000 clients (i.e., companies and consumers) were serviced by commercial banks, and 500,000 families received credit from microfinance institutions. By 2009, this had risen to just under 880,000 households receiving credit from microfinance institutions while the number of depositors had more than halved, from just under 400,000 in 2008 down to just under 130,000 households in 2009. Most credits were short term (i.e., 70% is less than 1 year). Formal, longer-term finance for investments in capital goods was virtually nonexistent (IFC 2007). Most loans were relatively small in size and heavily reliant on fixed assets for collateralization. As an example, the categorizations of lending for ACLEDA Bank are (i) micro, up to $5,000; (ii) small, $5,000–$10,000; and (iii) large, over $10,000.
Microfinance institutions typically have set $10,000 as a loan ceiling—occasionally, they have loans or aggregate commitments that are larger—and while this is increasing slowly, realistically, the largest amount of credit that microfinance institutions are likely to extend is about $25,000. Conversely, commercial banks, except for ACLEDA Bank, are not likely to lend less than $10,000. Eighteen months to 2 years is the longest term for such loans, and commercial banks will make loans with terms of 4 years. All institutions are offering more flexible terms than in the past, recognizing the uneven cash flows of farmers and agro-processors.
Land is regularly taken as collateral, although at a micro level, this is likely to be a land title that is certified by the village or commune chief, attesting that the property is owned by the borrower and is pledged on the loan. The pledging of land is likely to continue, even if financial institutions start using less conventional collateral, because of the tremendous significance attached to land pledges. A goal in encouraging alternate collaterals, therefore, would be for financial institutions to drop rigid loan–value requirements with respect to land collateral.
Cambodia is dominated by private SMEs and micro-businesses, and the largest number of these is found in rural areas. As of 2006, the number of commercial enterprises registered with the Ministry of Commerce was 13,239, of which 99% were micro and SMEs, employing 31% of the labor force (IFC 2007).
Figure 15 Growth of Private Sector Credit in Cambodia, 2007–2009
Source: CEIC Data. http://www.ceicdata.com/
JanuaryJanuary July July January July0
30
2008 20092007
60
90
120
%
Performance of the Agriculture and Rural Sectors 35
Historically, banks have not provided much finance for agriculture in Cambodia. As of 31 December 2009, only 12.95% of all bank credit was for agricultural loans.24 Since 2010, commercial banks have been focusing on real estate development lending, although there are some exceptions as follows:
(i) ACLEDA Bank. This was originally a microfinance institution that was upgraded to a commercial bank in 2003. It has an extensive branch network and maintains a microenterprise, poverty-based mission. It now offers a full range of commercial services.
(ii) ANZ Royal Bank. In many ways, this is the market leader among the banks, especially in retail services, as it has access to substantial technical resources from its Australia-based parent. While it has no interest in microlending, it has been expanding its branch network into the provinces and is offering products that are designed to meet middle-market needs. It specifically sees SMEs as a target market.
(iii) Canadia Bank and Cambodian Public Bank. These banks have been expanding their branch networks. While neither is regarded as a market leader, they are likely to follow and imitate new products being introduced to the market, thus providing some needed competition.
(iv) Rural Development Bank. This bank provides retail banking operations to agricultural and rural clients.25 In 2008, it had $18 million in outstanding loans, 45% in its microfinance portfolio, and the balance in its SME portfolio.26
The microfinance sector of the financial system is robust, having benefited from considerable donor investment and technical support. The pluses in dealing with these microfinance institutions are that they are committed to serving farmers and small entrepreneurs, in that 40% of loan portfolios are in the agriculture sector, and portfolio at risk measures are low.27 However, they have limited funds to lend, as they are mostly reliant on donor and social investment fund lines of credit, hence, are already fully loaned up with the lowest risk loans.28 The three largest microfinance institutions as of the end of 2009 were as follows:
(i) AMRET. At present, it operates in 13 of 24 provinces, although it is expanding its branch network countrywide. It will be applying for a deposit license, and already has more than enough equity to qualify. It is interested in new lending mechanisms, such as lending against contracts, and wants to do more SME lending. Almost 60% of loans are group loans, and 67% of loans are to the agriculture sector (AMRET 2008).
24 Some loans for agricultural processing are included in the 10% of bank credit that comprises manufacturing loans.25 The Rural Development Bank is one of the government’s specialized banks that is designed to be a conduit for foreign donor loan
funds for agriculture, as well as a wholesale lender to microfinance institutions for onlending. It has been the pass-through lender for International Fund for Agricultural Development and Agence Française de Développement loans for family rubber plantations and rice miller associations. Overall, the bank’s role in the market may have been overtaken because there is more credit available, but it may be an appropriate intermediary for donor lines of credit if these are required to pass through a government agency.
26 According to the Rural Development Bank, it had 11 microfinance institutions, 6 credit operators, 9 rice miller associations, 3 SMEs, and 1 community organization as its direct customers, along with 700 households with long-term loans under the Agence Française de Développement Smallholder Rubber Project.
27 PRASAC has 46% of its portfolio devoted to agricultural lending. Within the agriculture sector, overdue loans only comprise 0.26% of the total portfolio, while the Portfolio at Risk (PAR) ratio for agriculture is 0.23% (PRASAC 2008).
28 A new prakas allows microfinance institutions with sufficient capitalization to apply for a license to take deposits. While this will be an expensive source of funding because of heavy reserve requirements, several fast-growing microfinance institutions will be getting such licenses to expand access to lendable funds. In the future, a split between microfinance institutions into deposit-taking and nondeposit-taking is likely, with the former comprising the larger institutions and more oriented to SME lending. Prior to the issuance of the prakas, some of the microfinance institutions were mobilizing deposits (under uncertain regulatory authority), although they are now allowing these deposits to run off while complying with the new prakas requirements.

Rural Development for Cambodia36
(ii) PRASAC. Historically, this has the greatest number of clients, reached through group lending.29
Relative to other microfinance institutions, it is expected to maintain this orientation toward smaller, poverty-addressed lending.
(iii) CEB. Historically oriented toward individual lending, this has targeted somewhat larger loans. It is pursuing getting a deposit license and is interested in expanding the range of acceptable collateral and lending structures. In the past, CEB has done some agricultural lending (16% of its loan portfolio) but is more interested in lending for equipment for agro-processing.
Table 19 shows the outstanding loan and deposit amounts for microfinance institutions and ACLEDA Bank as of the end of March 2008 and the end of December 2009. It also shows the range of coverage by provinces. As the figures indicate, ACLEDA Bank dominates the microfinance sector in Cambodia in terms of loan volume, although the microfinance institutions, excluding ACLEDA, serve more loan clients. Comparable data are not available for the commercial banking sector.
Tables 20 to 23 show the most up-to-date picture on household financing in Cambodia, taken from the CSES 2004 dataset (NIS 2004). Of interest is that only 20% of households surveyed obtained their loans from the formal banking sector, including banks and NGOs (presumably through microfinance institutions). Instead, the majority obtained loans from their relatives (28%), friends or neighbors (15%), or moneylenders (25%). With the exception of moneylenders, these informal sources of credit have much lower interest rates than banks or NGOs. Further, despite higher interest rates, moneylenders provide ready access to emergency credit with little or no collateral. Only 24% of loans were taken out for agricultural purposes, with the rest comprising household consumption needs (32%), health or other emergencies (13%), and nonagricultural activities (13%).
29 The amount of money loaned to groups has declined substantially. As of 31 December 2007, some 4% of loans were under group loans, the rest under individual loans. This was in comparison with 2006, where almost 11% of loans were made to groups (PRASAC 2008). In 2007, group loans attracted interest rates of either 36% or 42% per annum, versus individual loans of 24%–42%.
Table 19 Finance and Credit by Sector, 2003–2009 (KR million)
Sector December 2003 December 2004 December 2005 December 2006 December 2007 December 2008 December 2009
% % % % % % %
Agriculture 43,947 3.09 64,774 3.39 69,287 3.02 148,717 4.28 305,245 4.88 516,297 9.62 708,874 12.95
Manufacturing 187,563 13.2 269,187 14.08 258,756 11.29 410,579 11.82 625,585 9.99 983,664 18.32 920,411 16.82
Construction 83,154 5.85 97,972 5.12 144,957 6.32 269,067 7.75 640,685 10.24 773,808 14.41 904,485 16.52
Wholesale and retail 225,564 15.88 363,049 18.99 532,450 23.23 783,479 22.56 1,371,077 21.9 1,617,970 30.13 1,352,907 24.72
Export 117,471 8.27 77,615 4.06 37,507 1.64 26,209 0.75 13,728 0.22 … … … …
Import 81,356 5.73 110,973 5.80 168,046 7.33 142,642 4.11 229,663 3.67 … … … …
Finance 102,148 7.19 100,068 5.23 26,485 1.16 24,004 0.69 36,495 0.58 658,710 12.27 878,576 16.05
Real estate and public utilities 66,392 4.67 50,329 2.63 147,555 6.44 298,886 8.61 495,447 7.91 737,442 13.37 662,826 12.95
Services 478,440 33.68 675,634 35.33 667,473 29.12 1,146,160 33.01 1,802,350 28.79 … … … …
Others 34,569 2.43 102,568 5.36 239,925 10.47 222,388 6.40 739,422 11.81 81,313 1.51 45,622 0.83
Total 1,420,604 100.00 1,912,169 100.00 2,292,442 100.00 3,472,130 100.00 6,259,697 100.00 5,369,204 100.00 5,473,701 100.00
… = data not available.
Source: NBC (2010).

Performance of the Agriculture and Rural Sectors 37
Tabl
e 20
St
atus
of F
inan
cial
Inst
itutio
ns in
Cam
bodi
a, M
arch
200
8
No.
Orga
niza
tion
Prov
ince
s
Num
ber i
n Op
erat
ing
Area
Outs
tand
ing
Loan
sDe
posi
t Bal
ance
Amou
nt
(KR
mill
ion)
Num
ber o
f Bor
row
ers
Amou
nt
(KR
mill
ion)
No. o
f Dep
osito
rs
Dist
rict
Com
mun
eVi
llage
Mal
eFe
mal
eTo
tal
Mal
eFe
mal
eTo
tal
1AC
LEDA
Smal
l24
202
1,61
513
,559
539,
101
177,
232
1,66
9,28
729
1,16
9
Larg
e24
202
1,61
513
,559
1,13
5,44
115
,657
1,66
9,28
729
1,16
9
2PR
ASAC
1611
61,
019
6,36
714
4,25
533
,739
37,3
9071
,129
531
2,69
944
13,
140
3AM
RET
1372
594
3,37
012
9,10
329
,881
148,
829
178,
710
3,51
684
00
840
4CE
B14
102
631
3,15
510
9,33
56,
394
21,8
3828
,232
6,81
44,
676
14,3
7619
,052
5HK
L10
6841
61,
997
70,9
206,
723
20,1
9226
,915
2,86
17,
453
21,5
4729
,000
6TP
C9
9964
13,
090
56,6
410
075
,199
416
00
16,2
56
7VF
C8
5936
61,
903
54,8
528,
924
49,3
8658
,310
594
4143
84
8AM
K17
101
668
3,51
053
,210
19,7
3211
1,07
713
0,80
965
63,
421
11,2
8014
,701
9CR
EDIT
762
367
1,49
547
,675
899
19,5
9920
,498
4,59
348
48,
673
9,15
7
10SE
ILAN
ITHI
H6
4021
674
818
,476
1,62
53,
225
4,85
01,
299
1,76
63,
547
5,31
3
11CH
C6
2613
538
510
,323
4,49
72,
424
6,92
128
04,
462
4,46
2
12IP
R5
1452
189
9,23
00
03,
261
00
00
13EA
P
921
6510
67,
424
5118
423
50
00
0
14CB
IRD
517
7830
14,
030
573
1,22
61,
799
608
798
1,42
02,
218
15M
AXIM
A2
1338
135
3,82
134
11,
270
1,61
146
22
4
17TF
MF
315
4048
717
162
640
802
00
00
16PA
S1
49
2364
415
716
632
30
10
1
Tota
l1,
031
6,95
040
,381
2,39
5,19
811
3,69
841
7,44
680
2,49
31,
691,
251
22,1
8165
,791
395,
397
Prev
ious
Qua
rter
926
6,53
236
,565
1,87
9,47
811
4,08
241
1,64
678
8,01
71,
400,
250
19,3
3365
,781
354,
545
Chan
ge0
105
418
3,81
651
5,72
0(3
84)
5,80
014
,476
291,
001
2,84
810
40,8
52
ACLE
DA =
Ass
ocia
tion
of C
ambo
dia
Loca
l Eco
nom
ic D
evel
opm
ent A
genc
ies,
AM
K =
Ang
kor M
icro
hera
nhva
tho
Kam
puch
ea, A
MRE
T =
Am
ret M
icro
finan
ce In
stitu
tion,
CBI
RD =
Cam
bodi
an B
usin
ess
Inte
grat
ed in
Ru
ral D
evel
opm
ent A
genc
y, CE
B =
form
erly
Cam
bodi
an E
ntre
pren
eur B
uild
ing
Lim
ited,
CHC
= fo
rmer
ly Ca
mbo
dia
Heal
th C
omm
ittee
, CRE
DIT
= C
ambo
dia
Rura
l Eco
nom
ic D
evel
opm
ent I
nitia
tives
for T
rans
form
atio
n M
icro
finan
ce In
stitu
tion,
EAP
= E
ntea
n Ak
peva
th P
rach
each
un M
icro
finan
ce In
stitu
tion,
HKL
= H
atth
a Ka
ksek
ar L
imite
d, IP
R =
Inte
an P
oalro
ath
Rong
roeu
rng
Mic
rofin
ance
Inst
itutio
n, M
AXIM
A =
Max
ima
Mic
rofin
ance
In
stitu
tion,
PAS
= S
ihan
oukv
ille A
uton
omou
s Po
rt, P
RASA
C =
Pra
sac
Mic
rofin
ance
Inst
itutio
n, S
EILA
NITH
IH =
Sei
lani
thih
Mic
rofin
ance
Inst
itutio
n, T
FMF
= T
ong
Fang
Mic
ro F
inan
ce L
imite
d, T
PC =
Tha
neak
ea P
hum
Ca
mbo
dia
Lim
ited,
VFC
= V
isio
n Fu
nd (C
ambo
dia)
Lim
ited.
Sour
ce:
Cam
bodi
an C
entra
l Ban
k.

Rural Development for Cambodia38
Table 21 Sources of Financing in Cambodia, 2004
Source of Loan
Primary Loan Secondary Loan Tertiary Loan Total Loans
No. %Interest % pm No. %
Interest % pm No. %
Interest % pm No. %
Relatives in Cambodia 1,747 27.12 1.13 15 0.23 2.00 0 1,762 26.79
Relatives abroad 93 1.44 1.17 8 0.12 1.88 0 101 1.54
Friends or neighbors 950 14.75 3.40 43 0.66 4.13 3 2.42 2.67 996 15.14
Moneylender 1,626 25.24 8.80 23 0.35 6.61 3 2.42 4.33 1,652 25.12
Trader 452 7.02 3.90 14 0.22 7.36 5 4.03 1.60 471 7.16
Landlord 14 0.22 2.77 0 0 14 0.21
Employer 21 0.33 5.75 2 0.03 10.50 0 23 0.35
Bank 238 3.70 6.15 4 0.06 4.00 0 242 3.68
Nongovernment organization 1,065 16.53 4.91 12 0.19 8.13 1 0.81 15.00 1,078 16.39
Others 235 3.65 2.25 3 0.05 0.67 0 238 3.62
No more loans taken out 6,361 98.09 112 90.32 6,473
pm = per month.
Source: NIS (2004).
Table 22 Purpose for Borrowing Money in Cambodia, 2004
Purpose of Loan
Kampong Cham Cambodia
No. % No. %
Agricultural production 198 22.25 1,530 24.23
Nonagricultural activities 121 13.60 834 13.21
Household consumption needs 240 26.97 2,040 32.30
Illness, injury 133 14.94 791 12.53
Other emergencies 2 0.22 22 0.35
Marriage ceremony 17 1.91 103 1.63
Funeral 11 1.24 75 1.19
Other ceremonials 3 0.34 28 0.44
Purchase or improvement 50 5.62 353 5.59
Purchase for consumer 21 2.36 94 1.49
Agricultural implementation 36 4.04 95 1.50
Servicing of existing debts 13 1.46 78 1.24
Others 45 5.06 272 4.31
Source: NIS (2004).

Performance of the Agriculture and Rural Sectors 39
Table 23 Interest Rates on Loans in Cambodia, 2004
Monthly Interest Rates
Kampong Cham Cambodia
No. % No. %
No Interest 2,525 39.24 386 42.79
Less than 1% 19 0.30 0 0.00
1%–2% 255 3.96 22 2.44
2%–5% 2,214 34.41 246 27.27
5%–10% 1,017 15.81 174 19.29
10%–20% 300 4.66 58 6.43
20%–50% 75 1.17 14 1.55
More than 50% 29 0.45 2 0.22
Source: NIS (2004).
While interest rates in Cambodia are not that high compared to other International Development Association (IDA) countries, they are high compared with Viet Nam and Thailand, Cambodia’s major competitors. This means that, all other things equal, cost of production in Cambodia is relatively higher because of a greater cost of credit.
The majority of financing for rice farmers and small businesses also comes from immediate family or close friends. These loans tend to be fairly small and of a fixed duration. In the case of purchase of inputs for rice production, the loans will be for at least as long as the growing season. Repayment is made at harvest time and is either in-kind as paddy, or cash upon a sale to traders or millers. Interest rates are comparatively high, but there are no collateral requirements or paperwork.
Some loans are taken out by farmers with small traders or input suppliers. In these cases, there is an informal contract to deliver a fixed amount of paddy at harvest. In some cases where there is a formal contract (e.g., with AQIP Seed Company), the cost of the inputs is deducted from the final payment for the seed. Input suppliers for fertilizer and pesticides may extend credit, as will some rice millers, but only to farmers that are well known to them.
Microfinance institutions have become increasingly responsive to the needs of the agriculture sector. In 2001 and 2002, several studies (JICA 2001, ACI 2002) cited the accessibility of credit as a major constraint. Six years later, that was not the case; every small town and almost all major villages had a microfinance institution present. Loans to farmers are commonly $300–$600 and, in some cases, as much as $10,000.
Commercial banks are not as well represented in Cambodia’s rural areas. While major banks do have agricultural portfolios, they are not as comfortable working with small agricultural companies or farmers as are microfinance institutions. Banks follow strict corporate procedures and require collateral for all loans, which tend to put off borrowers since they know that they can get loans from family members or business associates at about the same interest rates but without the bureaucracy.
NGOs and bilateral organizations have had varying degrees of success in developing and maintaining loan programs for farmer groups. Most of these initiatives have been some sort of credit union or have a cooperative philosophy surrounding them. In such cases, a group of farmers will donate a set amount of money to a community account and then draw against it for small loans to purchase crop inputs or to cover emergencies. Few of these programs last more than 1–2 years. Inadequate cash reserves and poor repayment by borrowers soon bankrupt the accounts.

Rural Development for Cambodia40
Access to finance for both farmers and processors is a major constraint to the development of Cambodia’s rice industry. With a lack of land titles and collateral, there are significant financial hurdles for smallholder producers to overcome in accessing finance. Several microfinance institutions, such as ACLEDA Bank, Cambodia Public Bank, and Canadia Bank, are taking the lead in providing financial support to smallholder farmers, but more needs to be done to expand access to credit.
Similarly, processors find it difficult to access finance because commercial banks are often reluctant to deal with agribusiness enterprises, most of which do not have adequate collateral. Private processors face even higher hurdles since they do not have the land to use as collateral for bank loans.
The Rural Development Bank has a $10 million facility for financing working capital requirements for rice milling. This comprises a $9 million line of credit from the Ministry of Economy and Finance (MEF), and $1 million from the bank’s own finances. Some 144 rice millers are currently using the facility. The facility works through the rice millers’ associations in nine provinces, backed up by an overall guarantee from the Cambodian Rice Millers Association.

41
III. Evolution of Rural Development Policies for Economic Growth and Poverty Reduction
A. Rural Development Policies
Rural development is a major crosscutting issue, covering health, education, agriculture, water, and sanitation. It is central to poverty reduction since 85% of Cambodia’s population live in rural areas, which have high poverty incidence. The Government of Cambodia has adopted a multipronged approach to foster rural development and to empower local communities to plan and manage their development. The decentralization and deconcentration of public services delivery; support for participatory, decentralized, and area-based programs; and provision of credit to households and small businesses are part of this approach.
There is a broad consensus within the government, civil society, and development partners that the engines of growth that have driven improvements since the early 1990s (e.g., in garments, tourism, and construction) need to be complemented with other sources of growth that are more rural, broad-based, and pro-poor. Acceleration of poverty reduction will require (i) secure property rights to private land, particularly for smallholders; (ii) emphasis on smallholder agriculture for both growth and poverty reduction; (iii) equitable access to common property resources (e.g., water and forestry) as a critical source of income and security for the rural poor; (iv) increased investment in productivity-enhancing infrastructure; and (v) improved human development and human capital, achieved through the pro-poor delivery of basic services in education and health.
A review of the government’s development plans show a consistent approach to economic development and growth as followed by other Southeast Asian countries, through monetary and fiscal reforms for restoring and maintaining macroeconomic stability; trade, industrial, and financial reforms for improving economic efficiency and competitiveness; governance reform and decentralization for improving the effectiveness of the national and local governments; and social policies and programs for fighting poverty, improving income distribution, and achieving Millennium Development Goals.
In 2004, the government adopted the Rectangular Strategy for Growth, Employment, Equity and Efficiency (RGC 2005a) as the framework for the country’s socioeconomic development. This was also incorporated into the National Strategic Development Plan, 2009–2013 (RGC 2009). Founded on the platforms of good governance, peace, political stability, social order, macroeconomic stability, partnerships, and economic integration, these plans focus on critical development issues such as enhancement of the agriculture sector, rehabilitation and construction of physical infrastructure, private sector development and employment generation, and capacity and human resources development.
In its Rectangular Strategy (RGC 2005a), the government indicated that its agriculture policy is “to improve agricultural productivity and diversification, thereby enabling the agriculture sector to serve as the dynamic driving force for economic growth and poverty reduction” (p. 11). The government has also highlighted the role of land and committed to a policy of
strengthening an equitable and efficient system of land management, distribution and utilization, including land registration and distribution, land tenure security, eradication of illegal settlements and land grabbing, and the control of land ownership concentration for speculative purposes (p. 12).

Rural Development for Cambodia42
This strategy is supported by the ongoing implementation of new policy instruments established under the 2001 Land Law, including social land concessions (i.e., distribution of state land to the poor), economic land concessions (i.e., long-term contracts for plantation-type developments on large areas); state land management (i.e., mapping, land use, and allocation procedures); and implementation of the unused land tax.
The Rectangular Strategy also highlights inclusive growth, and given Cambodia’s relatively rich natural resources endowment and concentration of poverty in rural areas, agricultural and rural development are the key mechanisms to achieve this. However, neither the Rectangular Strategy nor other key strategic documents, such as the SEDP II30 (Ministry of Planning 2001) or the National Poverty Reduction Strategy, clearly identify the role of smallholder agriculture in achieving growth, including export production.
Similar to the Rectangular Strategy, the Cambodian National Strategic Development Plan, 2006–2010, which was also updated for 2009–2013, aims to reduce poverty, and serves as the guiding document for implementing the Rectangular Strategy (Box 1). The plan is a combination of earlier plans, Socioeconomic Development Plan (SEDP) I and SEDP II, National Poverty Reduction Strategy, National Population Policy, and other sector policies and strategies aimed to ensure Cambodia‘s rapid progress toward achieving the Cambodia Millennium Development Goals31 and other socioeconomic goals.
30 Under the SEDP II, the government has recognized the importance of growth and diversification within the agriculture sector to drive the economy and to shift the focus from food security to diversification and commercialization. Diversification opportunities within the current resource base lie with crops other than rice, plantation crops, and fisheries including aquaculture and intensive livestock. Continued focus on rice production, particularly in subsistence or near-subsistence farming systems, may create a surplus of low-quality paddy that could drive prices down and undermine efforts to raise incomes and generate employment in rural communities. This emphasizes the need to integrate the production system with markets and their price structures.
31 In 2003, the Royal Government of Cambodia (RGC) adapted the eight universally agreed Millennium Development Goals (MDGs) to better suit the realities of the country. Recognizing that one major constraint to development is the continued contamination of mines and explosive remnants of war (ERW), the RGC added de-mining, ERW, and victim assistance as the ninth major development goal.
Box 1 Key Commitments of the National Strategic Development Plan, 2006–2010
Good governance. Implement anticorruption measures, legal and judicial reforms, administrative reform, decentralization and deconcentration, and military reform.
Environment for the implementation of the Rectangular Strategy. Ensure peace, political stability, and social order through elections; strengthen development partnerships; sustain a favorable macroeconomic and financial environment; further promote economic integration into the region and the world; and address poverty, ensuring that all strategies focus on poverty reduction.
Enhancement of the agriculture sector. Formulate and implement a comprehensive agriculture and water resources strategy, improve agricultural productivity and diversification, reform land administration and management, and invest in environmental conservation and rural infrastructure development.
Continued rehabilitation and construction of physical infrastructure. Restore and construct transport infrastructure, improve management of water resources and irrigation, develop energy and power grids, manage future oil and gas resources and revenues, and develop information and communication technology.
Private sector growth and employment. Carry out the government’s Twelve Point Plan and the recommendations in the Investment Climate Survey; promote small and medium-sized enterprises, trade, tourism, and rural credit; create jobs and ensure improved working conditions; and establish social safety nets for the disadvantaged.
Capacity building and human resources development. Enhance the quality of education, improve health outcomes through the Health Action Plan, foster gender equity, and implement a population policy to decrease fertility and promote birth spacing.
Source: RGC (2005a).

Evolution of Rural Development Policies for Economic Growth and Poverty Reduction 43
The government has indicated in its national strategic development plan that the overall goal is “poverty reduction and economic growth through enhancement of agriculture sector development” (RGC 2009, p. 28). The sector goal is to
ensure food security, increase incomes, create employment and improve nutrition status for all people by improving productivity and diversification, and commercialization of agriculture with environmentally sound protection and food security (RGC 2009, p. 28).
The government recognizes that land reform is vital to enhance social stability, develop an efficient land market, sustain the environment, and increase agricultural productivity through the issuance of land titles to citizens, especially to farmers who are cultivating land that they occupy. The government also recognizes that issuing land titles is vital for improving the management of land use, especially the management of state-owned lands, to ensure security of land tenure in a transparent, equitable manner, and to reduce poverty by enabling the population to have access to financial markets by using their land titles as collateral. It was estimated in 2001 that there are 6 million–7 million parcels of land for which land titles have to be issued (RGC 2009). Thus, under the national strategic development plan, the priority is on strengthening security of land tenure (both state land and private land) through land registration for systematic and sporadic land-titling procedures to provide land titles to people as well as institutions entitled to tenure rights (RGC 2009).
To strengthen land management, the required policy and legal framework for effective implementation of the Land Law has been developed and approved. The work so far has included a subdecree on state land management; a guiding circular on illegal occupancy of state land; a prakas (declaration) on the identification, mapping, and classification of state land; an interministerial prakas on strengthening cadastral commission; a joint prakas on a mechanism for agricultural dissemination service delivery for social land concessions using farmers; joint guidelines on strengthening all levels of cadastral commissions; draft policy and a subdecree on registration of indigenous peoples’ community lands; and draft policy on a land evaluation system. In addition, the Committee for Land Dispute Resolution has been established to promote efforts in resolving land conflicts (RGC 2009).
In addition to overarching development goals, the national strategic development plan recognizes the need to address rural development and makes improving the lives and livelihoods of the rural poor a top priority. Agricultural productivity improvement is the core strategy to meet this need.
Two sector-specific development plans are also relevant in the context of rural development and the agriculture sector, the Agriculture Sector Strategic Development Plan, 2006–2010 and the Strategy for Agriculture and Water, 2006–2010 and 2010–2013.
Under the agriculture sector strategic development plan, it is recognized that the commercialization of agriculture creates links with agro-industries, post-farm gate processing, and support services to ensure that smallholder producers obtain reasonable incomes. Private sector participation and investment provide greater income-earning opportunities (on-farm and off-farm) for the rural poor, with the government more likely to achieve its vision of transforming agriculture into a driving force to attain higher economic growth.
Under successive policies including the SEDP II, Rectangular Strategy, the agriculture sector strategic development plan, and the agriculture and water strategy, the government has recognized the importance of growth and diversification within the agriculture and rural sectors to drive the economy and to shift the focus from food security to diversification and commercialization. However, while the policies have been well articulated and are a sound basis for development, there has been a disconnect between the development of policies at the central level and their implementation at the local level. Since the rural development ministries (i.e., MAFF, MOWRAM, and MRD) are tasked with the implementation of these policies, their programs and activities are not necessarily aligned with those independently developed at the provincial and municipal levels.
Rural Development for Cambodia44
Firstly, the national strategic development plan is organized on a sector-wide, not ministry-wide, basis and therefore presses ministries toward planning in a cross-sector and coordinated manner (TWGAW 2007, p. 4). Further, the government’s Strategic Framework for Decentralization and Deconcentration Reform is mandating a progressive transfer of responsibilities and resources to councils at the provincial, municipal, district, and commune levels. As decentralization and deconcentration are further designed and implemented, institutional weaknesses in the agriculture and water sectors will be identified more precisely, and the lead ministries will be required to develop remedies (TWGAW 2007, p. 4).
Secondly, there is a limited joint strategy base for the agriculture and water sectors. A national water resources policy was promulgated in 2004, which provides a comprehensive, up-to-date statement of policy related to all aspects of water resources management. Further, the Law on Water Resources Management presents difficulties for regulation of water utilization. Issues related to the international waters of the Mekong River, however, are dealt with under the Mekong Agreement, with assistance from the Mekong River Commission. This agreement provides an overarching framework for water resources and flood management along the Mekong Floodplain and around Tonle Sap Lake, and therefore provides a context for the more focused strategy on agriculture and water (TWGAW 2007, p. 4).
1. Strategy for Agriculture and Water
The national strategic development plan states that the government’s priority for national development during 2006–2010 was poverty reduction and economic growth, achieved particularly through enhancement of the agriculture sector. The strategic development plans for agriculture and water resources, prepared by the Ministry of Agriculture, Forestry and Fisheries (MAFF) and the Ministry of Water Resources and Meteorology (MOWRAM), state sector visions and goals that contribute to national development.
The Strategy for Agriculture and Water (TWGAW 2007) draws heavily on an analysis of strengths, weaknesses, opportunities, and threats. The analysis is summarized in Table 24. The strengths listed suggest that Cambodia’s strategic advantage lies in the availability of natural resources (e.g., water, land, and biodiversity for agriculture) and manpower inputs, which at present are underutilized. Of the 10 weaknesses, 5 relate to natural resources (e.g., soil fertility and unreliable water sources) and labor. Hence, they set limits on the extent to which natural resources and labor can be seen as strengths. In particular, the three weaknesses that relate to labor are aspects of the effectiveness with which labor is mobilized in Cambodia. They appear to limit the potential value of abundant labor, and firm action will be needed to deal with them.
Four more weaknesses indicate that access to three types of input—capital, information and technology, and access to markets—is limited in Cambodia. The remaining weakness—low productivity of agricultural labor, land, and water—summarizes the consequence of all of the other weaknesses. Taken together, the 10 weaknesses give an overview of Cambodia’s strategic disadvantages in agriculture and water, which need to be tackled by the implementation of this strategy for agriculture and water. Three types of input are regarded as weak, while the other two (listed as strengths in Table 24) have significant limits placed upon them. On the other hand, there are many opportunities to develop strengths and overcome weaknesses.
The opportunities have many links with the strengths and weaknesses, and relate to four of the five types of input mentioned above. The threats do not, in general, relate to inputs, but principally to the environment in which agriculture and water resources function. Hence, they include four that are related to political, governance, social, and legal factors. All of these control whether the environment enables and encourages farmers to invest in and develop the sectors, or whether it provides disincentives and obstacles to investment. Overall, the risk is that present commitments to the implementation of reforms could falter or issues that are of particular relevance to agriculture and water resources are not addressed. If this were the case, then components of a strategy that depended on an enabling environment would be difficult to implement fully. A particular concern is that the government’s Strategic Framework for Decentralization and Deconcentration Reform may encounter difficulties in implementation, which could hinder implementation of the strategy for agriculture and water resources, particularly at subprovincial levels.

Evolution of Rural Development Policies for Economic Growth and Poverty Reduction 45
Table 24 Agriculture and Water Management: Summary of Strengths, Weaknesses, Opportunities, and Threats Analysis
Strengths1. Land resources are available.2. Water resources are available. 3. Abundant manpower is available in rural areas at low
labor costs.4. MAFF and MOWRAM have good human resources potential.5. Policy and/or strategic frameworks are being developed for
MAFF and MOWRAM.6. Stakeholders are committed to and recognize the
importance of the sector. 7. Diverse agro-ecosystems are available, with many land
types and cultivars.8. Focus is enhanced for community empowerment and
engagement, through community councils, farmer water user communities, and farmer organizations.
9. Agribusiness is developing.
Weaknesses 1. Institutional capacity, management, and project implementation by
MAFF and MOWRAM are weak. 2. Water resources are highly variable, and agricultural water
management technology is poorly developed. 3. There is limited capacity or interest in investing in agriculture. 4. Technology transfer is weak, and farmers and extension workers have
a low level of knowledge, access to technology, and skills. 5. Soil fertility is low in many areas. 6. Sociocultural weaknesses include low community solidarity,
vulnerability of farmers to landlessness, and a cultural focus on subsistence agriculture.
7. Information asymmetry exists among stakeholders. 8. The productivity of agricultural labor, land, and water is low. 9. There is weak access to markets.10. Legal instruments for agriculture and water resources are inadequate.
Opportunities1. Improvement of governance, including government
commitment, policy definition, and political stability2. Market development and integration with the regional and
global economy3. Strong support from external development partners for
investment in agriculture and water resources4. Science and new technologies5. Exploit natural resources that are under- or unutilized6. Availability of investment funds, including incentives, private
funds, and rural credit services7. Decentralization and deconcentration policy
Threats 1. Market changes, including highly competitive international markets 2. High cost of oil and gas 3. Political circumstances, including competing demands for government
funds from other sectors 4. Legal circumstances, mitigated by continued efforts to enforce laws
on land, water, and forests 5. Natural disasters 6. Climate change 7. Degradation of the environment 8. Ongoing efforts to implement governance, judicial, and other reforms 9. Social and political changes, such as social conflict over access to
water, and land and labor migration10. Decreasing external development partner support for agriculture and
water resources
MAFF = Ministry of Agriculture, Forestry and Fisheries; MOWRAM = Ministry of Water Resources and Meteorology.Source: TWGAW (2007).
The Strategy for Agriculture and Water identifies the long-term vision for agriculture and water as
to ensure enough, safe and accessible food and water for all people, reduce poverty, and contribute to economic growth (GDP per capita), while ensuring the sustainability of natural resources (TWGAW 2007, p. 10).
The overarching goal for agriculture and water resources management is
to contribute to poverty reduction, food security and economic growth through enhancing agricultural productivity and diversification and improving water resources development and management (TWGAW 2007, p. 10).
To achieve this overarching goal, the strategy recognized that focus must be on (i) increasing food security and income of rural communities and households, (ii) reducing vulnerability of rural communities and households, (iii) increasing surpluses of agricultural products for processing and export, and (iv) sustainable management and development of the country’s land and water resources. The strategy recognizes that the goal will be achieved principally by increased agricultural productivity, more efficient use and management of land and water, and enhanced agribusiness processes. Institutional capacity building, particularly in the area
Rural Development for Cambodia46
of knowledge and technology transfer, will be also needed. Accordingly, the following development goals were set (TWGAW 2007, p. 10):
(i) Arrangements that provide a sound policy, legal, institutional, and administrative basis for effective work performance in agriculture and water resources development and management.
(ii) Agricultural systems and community arrangements that enable poor and food-insecure Cambodians to have improved physical and economic access to sufficient, safe, and nutritious food at all times to meet their dietary needs and food preferences for an active and healthy life.
(iii) Agriculture and agribusiness that make effective use of inputs and market opportunities; are steadily intensifying and diversifying production; and deliver full benefits to farmers, rural communities, and other stakeholders.
(iv) Sustainable and pro-poor management of water resources, water management facilities, water-related hazards, and land resources that is integrated, efficient, and carried out in a river basin context.
(v) Comprehensive and coordinated capacity to assemble and utilize agricultural and water-related knowledge, information, and technology transfer.
Under the strategy, the first three development goals were so placed because they deliver social and economic benefits directly to the community. The last two provide indirect benefits to the community, through building the institutional capacity of the lead agencies to carry out their responsibilities. Nevertheless, the five development goals have equal priority for action, as they are all necessary for success in the agriculture and water sectors. The development goals lead directly to defining the program areas under the strategy (Figure 16).
The six pillars of the strategy are designed as three enabling pillars and three core or implementing pillars. Pillar A (i.e., the roof) sets the overarching policies and enabling environment for the strategy, while pillars B and C (i.e., the supporting beams) provide capacity building to MAFF and MOWRAM to implement strategy activities. Pillars D, E, and F (i.e., the walls) serve as the main implementation vehicle for the strategy, concentrating on delivering interventions and services in food security, water resources management, agricultural land management, and agricultural business and marketing. Crosscutting services, such as gender mainstreaming functions and extension services (i.e., the foundations), are fully embedded in pillars D, E, and F (Figure 16).
2. Strategic Framework for Decentralization and Deconcentration
Decentralization and deconcentration are key governance reforms for local democratic development and service delivery improvement.32 Following commune council elections in February 2002, the government engaged in a broad range of decentralization initiatives.
In 2005, the Strategic Framework for Decentralization and Deconcentration was developed to guide the process of governance reform at the provincial, district, and commune levels. This framework established the basic principles and scope for a comprehensive decentralization program. This program now forms part of the good governance strategy of the national strategic development plan. In May 2008, the Organic Law was
32 The MAFF, MOWRAM, and Ministry of Rural Development (MRD) play a key role in subnational activities. The Ministry of Interior is the leading central agency; drove the most recent legislations; and has chaired all major decentralization committees, including the current body, the National Committee for Democratic Development. This is an interministerial body comprising four subcommittees focused on (i) functions and resources; (ii) financial and fiscal affairs; (iii) subnational administrative personnel; and (iv) subnational policy, legislation, and guidelines of development plans and investment programs.
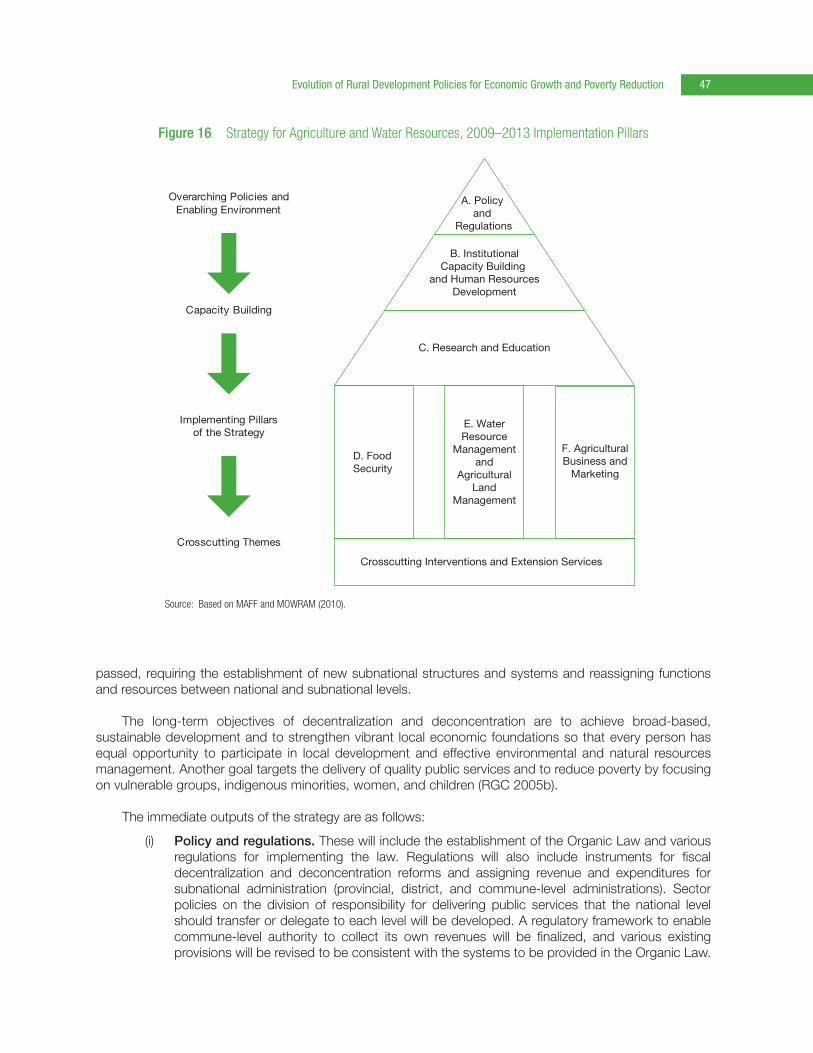
Evolution of Rural Development Policies for Economic Growth and Poverty Reduction 47
passed, requiring the establishment of new subnational structures and systems and reassigning functions and resources between national and subnational levels.
The long-term objectives of decentralization and deconcentration are to achieve broad-based, sustainable development and to strengthen vibrant local economic foundations so that every person has equal opportunity to participate in local development and effective environmental and natural resources management. Another goal targets the delivery of quality public services and to reduce poverty by focusing on vulnerable groups, indigenous minorities, women, and children (RGC 2005b).
The immediate outputs of the strategy are as follows:
(i) Policy and regulations. These will include the establishment of the Organic Law and various regulations for implementing the law. Regulations will also include instruments for fiscal decentralization and deconcentration reforms and assigning revenue and expenditures for subnational administration (provincial, district, and commune-level administrations). Sector policies on the division of responsibility for delivering public services that the national level should transfer or delegate to each level will be developed. A regulatory framework to enable commune-level authority to collect its own revenues will be finalized, and various existing provisions will be revised to be consistent with the systems to be provided in the Organic Law.
Figure 16 Strategy for Agriculture and Water Resources, 2009–2013 Implementation Pillars
Source: Based on MAFF and MOWRAM (2010).
D. Food Security
C. Research and Education
B. InstitutionalCapacity Building
and Human ResourcesDevelopment
A. Policy and
Regulations
Crosscutting Interventions and Extension Services
Overarching Policies andEnabling Environment
Capacity Building
Implementing Pillarsof the Strategy
Crosscutting Themes
E. Water Resource
Managementand
AgriculturalLand
Management
F. Agricultural Business and
Marketing

Rural Development for Cambodia48
(ii) Institutional management strengthening. This includes provision of management systems at the provincial, district, and commune levels and the strengthening of commune management systems, including the establishment of unified administrations at the provincial, district, and commune levels and the revision of the roles and duties of ministries and institutions at the national level. Legal instruments for institutional strengthening will be prepared to improve effective resource mobilization (e.g., the assessment of sources of revenue, revenue collection, and revenue sharing) and expenditure management (e.g., preparation of a strategic plan of administration, formulation of investment programs, preparation of annual and multiyear budgets, implementation of plans, asset management, financial and accounting reporting, and internal monitoring). The systems and procedures of transfer or delegation of public service delivery will be developed, and cooperation and coordination among national institutions and provincial, district, and commune will be promoted.
(iii) Sector development management. Provincial, district, and commune-level administrations will deliver infrastructure, social and economic services, as well as other public services, such as investment for natural resources management; and local socioeconomic development.
Decentralization and deconcentration have widespread implications for the agriculture sector, such as in the provision of agricultural and marketing extension services and development of local policy and by-laws. Projects implemented with or through local government partners will need to consider capacity levels and to include institutional strengthening as a core activity to ensure successful outcomes. Management of public marketplaces is already under the jurisdiction of local governments and will need to be considered accordingly for the proposed interventions.
Decentralization and deconcentration committees have been established in each line ministry as has a joint MEF–Ministry of Information technical working group to coordinate the reform agenda, finalize a draft subnational finance law, and oversee public financial management (PFM) and decentralization reforms. A 10-year national program for subnational democratic development is also being prepared by the National Committee on Democratic Development. A strong link between national priorities and plans with decentralized service delivery will enhance the effectiveness and efficiency of the government’s resource utilization and strengthen accountability and transparency, including measures that will ensure revenue sharing by subnational government levels. The Ministry of Economy and Finance (MEF) has taken the lead in fiscal decentralization, overseeing commune intergovernmental transfer and financial management systems, and delegating some tasks to its provincial departments.
Authority may be devolved, but the capacity of lower levels of government to plan, implement, and manage rural development infrastructure limits infrastructure provision. Once built, the ability of local administrative levels to raise revenues for cost recovery and operations and maintenance may remain limited and needs to be reflected in investment design, implementation arrangements, and capacity development for effective and efficient results. Issues include the efficiency of public infrastructure and finance and utilities, subsector regulatory and contractual arrangements, and financial flows through levels of government.
3. Social Services Policies
Education policies. The national strategic development plan recognizes education as a crucial factor in developing the country’s human resources, and endorses the Education Strategic Plan, a 5-year rolling plan for developing the education sector.33 This plan articulates the vision of the Ministry of Education, Youth and
33 The current education system comprises primary (grades 1–6), lower secondary (grades 7–9), and upper secondary (grades 10–12). Basic education is defined as grades 1–9. Entry to upper secondary level is regulated by a national examination at the end of grade 9. Technical and vocational education programs run parallel to upper secondary programs and are the responsibility of the Ministry of Labor and Vocational Training.

Evolution of Rural Development Policies for Economic Growth and Poverty Reduction 49
Sports to “establish and develop human resources of the very highest quality and ethics in order to develop a knowledge-based society within Cambodia” (ADB 2007b, p. 1).
The Rectangular Strategy includes capacity building and human resources development as one of its four pillars, with enhancing the quality of education being the main feature. The strategy states that the government will continue to increase budget expenditures and to mobilize increased international assistance to (i) provide incentives for teachers; (ii) ensure quality instruction; (iii) provide educational materials, equipment, libraries, and laboratories; (iv) build dormitories for students, especially female students; (v) continue to reform curriculums and training programs; (vi) provide scholarships to poor students; (vii) promote informal education programs; (viii) finance construction of schools in rural areas; and (ix) support schools’ operating costs.
The government’s goals for the expansion of education opportunities are reflected in the education strategic plan, which was the first step toward adopting a sector-wide strategy for education development. The plan emphasizes the strengthening of appropriate Ministry of Education, Youth and Sports departments at central and provincial levels, including delegation of responsibilities to districts, clusters, and/or communes, and schools. The government also accords the highest priority to the Education for All national plan (ADB 2007b).
The education strategic plan defines the long-term mission of the Ministry of Education, Youth and Sports as ensuring that all children and youth have equal opportunity to access quality education consistent with the Constitution and the government’s commitment to the United Nations Convention on the Rights of the Child, regardless of social status, geography, ethnicity, religion, language, gender, or disabilities. The plan highlights three main policies: (i) equitable access to education services, (ii) quality and efficiency of education services, and (iii) institutional development and capacity building for decentralization. It is supported by the Education Sector Support Program, which is reviewed annually in consultation with development partners and serves as the action plan to achieve the sector goals set out in the plan. The program identifies the necessary activities and priorities in reaching the Cambodian Millennium Development Goals and the goals set out in the Education for All national plan (ADB 2007b).
In 2006, the Council of Ministers approved a draft education law, which has been submitted to the National Assembly for ratification. Under this law, the National Council for Education will be established to promote the development of the education sector. The Ministry of Education, Youth and Sports has also prepared the Policy and Strategies on Information and Communication Technology in Education (2004), Gender Mainstreaming Strategy in Education (2006–2010), and Policy for Curriculum (2005–2009), and provided guidelines for the integration of these policies into the broader process of education reform (ADB 2007b).
The Directorate General of Technical and Vocational Education under the Ministry of Labor and Vocational Training is divided into three departments: (i) Department of Management, responsible for institutional management monitoring; (ii) Department of National Competent Standards, responsible for competency standards and the national qualifications framework; and (iii) Department of Labor Market Information, which is also responsible for managing apprenticeships. A stakeholder-based National Training Board, chaired by the deputy prime minister, approves the National Technical and Vocational Education Development Plan annually, which sets overall policy (ADB 2008c).
Health policies. In Cambodia, health service delivery is defined through the Ministry of Health’s Health Coverage Plan 2002, which designated 77 operational districts throughout the country responsible for health care for 100,000–200,000 people each. Most operational districts are composed of a referral hospital delivering a comprehensive package of activities and authorizing the provision of appropriate curative care for first referral. Referral hospitals are further supported by 965 health centers, each catering to around 10,000 residents and delivering a minimum package of activities, encompassing a basic set of preventive programs, health promotion activities, and outpatient curative health services (Ryan 2007).

Rural Development for Cambodia50
Donor organizations have been very active since the early 1990s to support the health coverage plan and to help build capacity and improve service delivery and infrastructure, particularly through the implementation of the Health Sector Support Project, which has been piloted in 22 provinces and concluded in 2008. ADB, Department for International Development of the United Kingdom, International Development Association–World Bank, and the United Nations Population Fund, with the Ministry of Health, collaborated under a sector-wide management protocol to implement the project to improve health service quality, utilization, and access, especially for women, children, and the poor (Ryan 2007).
The project involved building and renovating referral hospitals and health centers; supplying equipment, drugs, and other medical essentials; as well as training staff members to deliver either minimum or complementary package of activities. The project also financed contracting of health management in selected operational districts to nongovernment organizations (NGOs) to improve access of poor communities to health care, in conjunction with establishing health protection funds (Ryan 2007).
The Ministry of Health’s Health Workforce Development Plan, 2006–2015 provides an overview of the challenges facing the public health system, in terms of future workforce and training needed to comply with the national health strategies and service plans. The plan is intended to be a framework document to allow planners to target optimum workforce levels to effectively deliver practical outcomes (Ryan 2007).
Water and sanitation policies. The government’s National Water Supply and Sanitation Policy (2003) states that every Cambodian in rural areas will have access to safe water and sanitation by 2025. In line with the Cambodian Millennium Development Goals, the government is committed to increasing the coverage of improved water supply to 50% of the rural population by 2015, and sanitation coverage to 30%. According to the Rural Water Supply and Sanitation Sector Investment Plan, 2005–2015 (MRD 2005), $116.0 million in capital investment and $4.8 million in recurrent costs will be required to reach the Cambodian Millennium Development Goals. About 58% of the investment, or $67.0 million, is expected to come from external sources. The remaining balance needs to be financed by the government ($11.0 million) and communities ($39.0 million). The major share of the communities’ contribution ($30.0 million) is for construction materials for sanitation works, such as latrines. External and government financing are needed for hygiene education and awareness raising, and for financing schemes to improve access to sanitation materials and equipment, especially for the poor (ADB 2008b).
The rural water supply and sanitation sector is supported by various NGOs and development agencies as follows: (i) the Water and Sanitation Program of the World Bank has active projects on validating domestic water treatment technologies and on assessing the potential of small-scale private sector involvement in rural water supply; (ii) the Japan International Cooperation Agency is preparing the third phase of its rural water supply project in Kampong Cham Province; (iii) the European Commission’s Humanitarian Aid Program provides funds to various NGOs to implement health programs and to provide access to safe water and sanitation for whole villages in the most remote rural areas; and (iv) the United Nations Development Programme provides assistance in the fields of governance reforms, political processes, and private sector development (ADB 2008b).
ADB is currently the only donor providing substantial investment funds ($18 million) through the Tonle Sap Rural Water Supply and Sanitation Sector Project. It is a sector project designed to increase water supply coverage in 6 years from 20% to 50% and to improve sanitation coverage from 10% to 30% for the rural population of five provinces around Tonle Sap, through (i) investment in water supply infrastructure, (ii) community mobilization and skills development, (iii) subsidies for latrine construction, and (iv) capacity building and institutional support (ADB 2008b).

Evolution of Rural Development Policies for Economic Growth and Poverty Reduction 51
B. Impact of Rural Development Policies
Despite the difficulties in harmonizing development programs and activities, the policies and reforms initiated and implemented so far have had some visible impact on the economy. Particularly in the past 5 years, growth has picked up. Apart from reduced growth in 2009, Cambodia is targeted to return to positive sustained growth in 2010–2011. Poverty levels have consistently fallen, and most indicators for education and health have improved.
At the same time, until the sharp spike in food prices in late 2007 to early 2008, inflation was under control and ranged from a low of 1.8% in 2003 to a high of 6.5% in 2007. The external payments position has also become more sustainable than in recent past decades. The strongest evidence is the fact that the country’s domestic investment share in GDP has continued to improve, and the balance of payments has been supported by significant inflows of foreign direct investment and foreign aid.
However, the reliance on three economic pillars (i.e., garments, tourism, and construction) as the drivers of economic growth raises the question of whether the recent pace of growth can be sustained. While the agriculture sector is the mainstay of the vast majority of the population, its absence as a significant contributor to value added within the country is worrisome, and there are significant missed opportunities that need to be exploited. Moreover, while the reduction in poverty incidence has been impressive, there are many opportunities for improvement. The Gini coefficient remains high, suggesting that the fruits of economic growth have not been widely shared among all Cambodians.
The patterns of poverty reduction are not unexpected given where and how growth occurred. The main reason that the rural poor have made advances but have nonetheless fallen behind is that the twin engines of growth over the period (i.e., garments and tourism) were generally urban-focused with weak urban rural links. Meanwhile, agriculture, the primary livelihood of the poor, has attracted little investment in recent years and has experienced relatively slow growth, while its level of productivity has remained very low. Agribusiness, a traditional link to a more manufacturing-based economy, has failed to expand despite surplus agricultural output.
In addition to sustaining its existing twin engines of growth, development also needs to be more pro-poor and rural-focused to accelerate poverty reduction. The obvious choices are agriculture-related activities. Given the size of the agriculture sector, growth in this sector will have the greatest poverty reduction impact, compared with the industrial or services sectors. In Cambodia, almost two-thirds of the heads of poor households in 2004 report farming as their main occupation, either self-employed tending to their own land or working for other farms (NIS 2004). Over 20% of the poor depended only on crop cultivation for over one-half of their income (NIS 2004). Thus, because of the importance of agriculture, steps to facilitate improvement in agricultural productivity and expansion of rural small and medium-sized enterprises (SMEs) and agro-industry activities are necessary conditions for enduring poverty reduction.
The recent pace of growth may not be sustainable unless investment in agriculture-based activities and rural SMEs is increased. While the public sector plays an important role in investing in infrastructure, the private sector should be the driving force of investment in productive activities required for sustaining growth in the medium and long term.

52
IV. Public Expenditure Review of the Rural Development Ministries
A. Overall Macroeconomic Environment
Cambodia’s macroeconomic environment is robust and stable, yet concerns linger about the depth of the finance sector and the underlying risks from poor fiduciary oversight. Cambodia’s macroeconomic situation has stabilized in recent years, with gross domestic product (GDP) growth averaging over 10%, inflation until 2007 being around a manageable 5% per annum, and external positions improving (Figure 17). However, investors remain wary of macroeconomic instabilities and resulting uncertainties in the country’s economic policies. Cambodia ranked 113 out of 131 countries in terms of perception of macroeconomic stability, much lower than its Southeast Asian counterparts such as the People’s Republic of China (PRC) (ranked 61), Indonesia (78), Malaysia (26), the Philippines (86), Thailand (63), and Viet Nam (88) (Figure 34).
Cambodia has recorded consistent fiscal deficits since 1990 (Figure 18). The most important cause of the deficits in recent years has been weak revenue generation. In 2008, tax revenue accounted for 85.4% of total revenue, or 31.5% more than the amount that the government collected in taxes in 2007. Other sources of state income, including capital revenue, represented only about 14.53% of total current revenue (ADB 2009a).
Figure 17 Inflation and Current Account Balance for Cambodia, 1990–2007
Source: ADB (2008a).
%
–10
–5
0
5
10
15
20
1993
1994
1991
1990
1992
1995
1997
1996
1998
1999
2000
2001
2002
2003
2004
2005
2006
2007
Current account balance (% of GDP) Inflation
Year

Public Expenditure Review of the Rural Development Ministries 53
Figure 18 Cambodian National Government Deficits, 1990–2007
Source: ADB (2008a).
–8
–7
–6
–5
–4
–3
–2
–1
0
19
90
19
91
19
92
19
93
19
94
19
95
19
96
19
97
19
98
19
99
20
00
20
01
20
02
20
03
20
04
20
05
20
06
20
07
% o
f G
DP
Year
Figure 19 Government Expenditure by Type of Service, 1994–2007
Source: ADB (2008a).
0.0
0.5
1.0
1.5
2.0
2.5
3.0
3.5
4.0
4.5
5.0
1994 1995 1996 1997 1998 1999 2000 2001 2002 2003 2004 2005 2006 2007
% o
f G
DP
Year
General public services Defense
Education Health
Social security and welfare Economic services
Others

Rural Development for Cambodia54
Figure 20 Government Expenditure by Economic Activity, 1994–2007
Source: ADB (2008a).
0.0
0.1
0.2
0.3
0.4
0.5
0.6
0.7
1994 1995 1996 1997 1998 1999 2000 2001 2002 2003 2004 2005 2006 2007
% o
f GD
P
Year
Agriculture Industry
Transport and communications Other economic services
Figure 21 Fiscal Indicators, 2005–2009
Source: ADB (2009b).
% o
f G
DP
Year
0
–10
10
20
Overall balance RevenueExpenditure
2005 2006 2007 2008 2009

Public Expenditure Review of the Rural Development Ministries 55
During 2000–2008, total government expenditure grew faster than the economy, and capital expenditure faster than recurrent expenditure. During the same period, there was steady growth in the government recurrent budget, from KR1,215 billion in 2000 to KR4,439 billion in 2009, with real increases exceeding 14% annually in 2006–2008. On average, government recurrent expenditure, in real terms, increased by 10.1% during 2000–2008, which was above the trend rate of growth in GDP. The government recurrent expenditure–GDP ratio has remained broadly unchanged over 2000–2008, at between 8%–9% (Figure 22) (Mokoro 2010).
Trend performance of government-financed capital expenditure data is presented in Figure 23. The government capital budget has taken on increased importance, growing from KR297 billion in 2004 to KR1.02 trillion in 2009. Appropriations to the government capital budget have increased each year, growing at an annual average rate of 17% in real terms between 2004 and 2008. The government-financed capital expenditure–government recurrent expenditure ratio has increased from 16.0% in 2005 to 22.9% in 2009. Taken together, government recurrent and capital expenditure, as a proportion of GDP, increased from 8.9% in 2005 to 9.8% in 2008 (Mokoro 2010).
During 2004–2007, the government worked to lower fiscal deficits, but the impact of the global financial crisis increased levels of debt for 2009 (Figure 21). The deficits were reduced mainly through deep cuts in
Figure 22 Government Recurrent Expenditure in Nominal and Real Terms, 2000–2009
Source: Ministry of Economy and Finance, Tables of Government Financial Operations (Mokoro 2010).
0
500
1,000
1,500
2,000
2,500
3,000
3,500
4,000
4,500
5,000
KR
bill
ion
Year
–10
–5
0
5
10
15
20
25
30
35
% C
hang
eTotal recurrent outturn
Total recurrent outturn (real)
Recurrent nominal (Right-hand scale)
Recurrent real (Right-hand scale)
2000 2001 2002 2003 2004 2005 2006 2007 2008 2009

Rural Development for Cambodia56
defense spending (Figure 19), although in 2008, the budget allocations for the ministries of Defense and Interior were 60% of the total budget, mainly in response to the Preah Vihear Temple standoff with Thailand. Within the economic services category of expenditure, transport and communications have fallen, and there have been only modest increases in agriculture sector spending.
Given Cambodia’s continued strong economic growth and the highly concessional structure of its lending, debt is on a sustainable path. However, moderate risks remain, particularly given the low level of current government revenues, continued existence of external arrears, and potential for contingent liabilities.
External debt constitutes about 95% of public debt, and about 35% of the external debt was owed to the Russian Federation and the United States (US) (IMF and World Bank 2007). The risk of debt distress will decline further, although low revenue collection will continue to pose risks to debt sustainability (IMF and World Bank 2007).
With external (public and private) debt at 50.6% of gross national income in 2006, interest payments reached 3.5% of GDP and 16.4% of the budget in 2007. Cambodia, given its large public debt, is vulnerable to increases in interest rates, which may rise with high inflation (i.e., the rising price of food is the most immediate threat to inflation). The risk of defaulting on foreign debt, which always dents appropriability of investment returns, may not be high, but Cambodia is always vulnerable to currency risks, which may reverse the stable situation very quickly, as happened during the 1997/98 Asian financial crisis. The tight fiscal situation is also constraining the public sector’s ability to finance key infrastructure and services.
Figure 23 Government-Financed Capital Expenditure in Nominal and Real Terms and Capital Expenditure–Recurrent Expenditure Ratio, 2000–2008
Source: Ministry of Economy and Finance, Tables of Government Financial Operations (Mokoro 2010).
0
100
200
300
400
500
600
700
800K
R b
illio
n
0
5
10
15
20
25
30
%
Locally financed capital Locally financed capital expenditure in real terms
Capital to recurrent ratio
Year
2000 2001 2002 2003 2004 2005 2006 2007 2008

Public Expenditure Review of the Rural Development Ministries 57
The inflation rate jumped to double digits in December 2007 to 10.8% from only 2.8% in December 2006. External factors such as soaring crude oil and food prices, fears of an economic recession in the US and weak economic performances in certain sectors of Cambodia’s economy have caused higher inflation. These problems persisted through 2008.34 Year-on-year averages for the Consumer Price Index went from 4.7% in 2006 to 5.9% in 2007 and then jumped to 19.7% in 2008 (ADB 2009b).
The monetary and financial market reforms implemented by the government and the National Bank of Cambodia since 2001 have rendered the risk of new crises low at this time, and macroeconomic risks are not seen as a binding constraint to economic development.
B. Public Expenditure on Rural Development35
Achieving the Millennium Development Goal target for poverty reduction (i.e., 20% of the population by 2015) will require an average economic growth of 7.5% per annum from 2008 to 2015, inflation in the range of 3.0%, and no change in the distribution of income between urban and rural families. If inequality between rural and urban areas increases, higher growth may be necessary to achieve this target (Oum 2007). This will not be easy, with one-half of the population under 20 years of age and more than 85% of employment in the informal sector (mainly subsistence agriculture), as well as the relatively high rural poverty rate. Thus, increasing the efficiency of public resources targeted for rural development and private sector-led economic opportunities in rural areas will be crucial to accomplishing poverty reduction. The government’s economic strategies underline the importance of agriculture and rural development as the key to economic diversification. The institutional framework supporting rural development, therefore, requires sustained support in public financial management (PFM) mechanisms.
Of particular concern for rural development is that the line ministries that support rural development in Cambodia are some of the most underfunded ministries. The Ministry of Agriculture, Forestry and Fisheries (MAFF), Ministry of Water Resources and Meteorology (MOWRAM), and Ministry of Rural Development (MRD) have shortages of qualified staff members that affect effective delivery of services in rural areas, reducing economic opportunities for the rural poor. Further, public investment in agriculture only has averaged 2.6% of total government expenditure since 2000, and donor funds have grown in recent years but still remain low. While there are major difficulties in accurately estimating what portion of public resources go to rural development or the rural population, based on available data, total expenditure for rural development has been estimated to range from 1.4% to 1.9% over 2006–2010.36 This has increased over time from 0.5% in the mid-1990s (Table 25).
34 On average, the riel appreciated by 1.3% against the dollar during the first half of 2008 compared to the same period in 2007. This relative strength of the riel was due to the financial crisis in the US, increasing demand for the riel in rural areas during the farming season (i.e., farmers need the riel to begin agricultural cultivation), prudent monetary policy by the National Bank of Cambodia, and a surplus in the balance of payments (EIC 2008).
35 Unless otherwise noted, this section is based on Mokoro (2010).36 Analyzing expenditure patterns for rural development as a sector on its own is very difficult in Cambodia, and it is unlikely that this
figure is wholly accurate. In reality, it is nearly impossible given the paucity of existing data to define exactly how much government and donor resources is allocated to rural development to support the joint sector budgets and strategies of the three rural development ministries. In the area of rural development, there are multiple agencies responsible for broadly similar policy and program areas, resulting in fragmentation and even program duplication. Rural development is also not limited to the activities of the three ministries, so suggesting a figure that only takes these ministries into account does not provide an accurate picture of the real level of expenditure for rural development sector priorities. Finally, it is very difficult to determine expenditure patterns at the line ministry level, because parallel negotiations also take place between provincial departments under line ministries and MEF. As incremental adjustments are made throughout the year to cover cash deficits at the provincial level, the actual budget execution levels presented by MEF for the sectors are likely to be inaccurate. However, increasing expenditures in productive areas will not lead to an optimum result in the absence of serious investment in capacity development and strong support for PFM reforms in these ministries by the government and development partners.

Rural Development for Cambodia58
Tabl
e 25
Di
strib
utio
n of
Exp
endi
ture
for t
he E
xecu
ted
Stat
e Bu
dget
by
Func
tion
and
Econ
omic
Sec
tor,
1996
–201
0 (%
of t
otal
exp
endi
ture
)
Item
1996
1997
1998
1999
2000
2001
2002
2003
2004
2005
2006
2007
2008
2009
2010
Core
Gov
ernm
ent
62.6
63.2
69.4
54.7
58.9
51.0
46.6
43.0
44.6
36.7
34.5
35.1
35.6
38.6
29.8
Ge
nera
l adm
inis
tratio
n17
.015
.726
.019
.029
.125
.722
.224
.623
.918
.415
.516
.617
.514
.811
.0
De
fens
e, s
ecur
ity, a
nd ju
dici
ary
32.5
32.7
29.5
25.2
20.2
16.5
12.3
11.6
12.7
11.4
19.0
18.5
18.1
23.8
18.8
Econ
omic
Ser
vice
s10
.914
.29.
214
.212
.516
.816
.012
.912
.212
.910
.09.
810
.77.
45.
1
Ag
ricul
ture
2.1
2.6
1.7
1.9
2.3
3.9
3.3
3.4
3.2
4.1
2.0
1.7
1.4
1.4
1.4
Pu
blic
wor
ks2.
62.
61.
22.
24.
75.
47.
04.
65.
14.
32.
83.
32.
32.
6…
Ot
her t
rans
port
0.5
1.5
0.5
0.4
0.4
1.0
0.2
0.3
0.3
0.4
0.6
0.6
0.6
0.5
0.5
Ot
her e
cono
mic
ser
vices
5.5
7.3
5.7
9.5
4.8
6.1
5.1
4.2
3.2
3.7
4.2
3.9
6.1
2.6
2.8
En
viron
men
tal p
rote
ctio
n0.
20.
20.
10.
20.
30.
40.
40.
40.
40.
40.
30.
30.
40.
30.
3
Rura
l Dev
elop
men
t0.
50.
40.
61.
20.
81.
83.
03.
63.
82.
71.
71.
61.
51.
41.
9
Soci
al S
ervi
ces
19.5
21.2
18.9
26.3
24.9
28.1
26.9
26.7
31.7
28.8
29.0
27.0
23.4
19.5
29.8
He
alth
4.8
5.9
4.2
9.4
6.7
7.9
7.9
7.6
9.1
9.6
9.3
10.0
9.3
9.0
9.5
Re
crea
tion,
cul
ture
, and
relig
ion
0.6
0.8
0.6
0.8
1.8
1.9
1.4
1.4
1.2
1.3
0.7
0.7
0.7
0.6
0.7
Ed
ucat
ion
9.1
9.0
9.5
11.3
10.7
12.9
13.1
12.7
15.3
13.8
13.9
11.1
8.6
5.2
14.8
So
cial
pro
tect
ion
5.0
5.5
4.6
4.8
5.7
5.4
4.5
5.0
6.1
4.1
5.0
5.0
4.8
4.7
4.8
Othe
rs6.
51.
01.
93.
62.
92.
37.
513
.87.
718
.924
.826
.528
.733
.033
.4
De
bt p
aym
ents
6.5
1.0
1.9
2.5
2.0
1.8
1.7
6.5
3.9
5.5
5.3
4.7
4.7
7.0
8.9
Ca
pita
l exp
endi
ture
……
……
……
4.9
5.8
3.3
7.7
15.9
17.6
19.3
23.1
21.4
Ot
hers
not
cla
ssifi
ed…
……
1.1
0.9
0.5
0.9
1.5
0.5
5.7
3.6
4.2
4.7
2.9
3.1
Tota
l10
010
010
010
010
010
010
010
010
010
010
010
010
010
010
0
... =
dat
a no
t ava
ilabl
e.
Sour
ce:
Min
istry
of E
cono
my
and
Fina
nce.
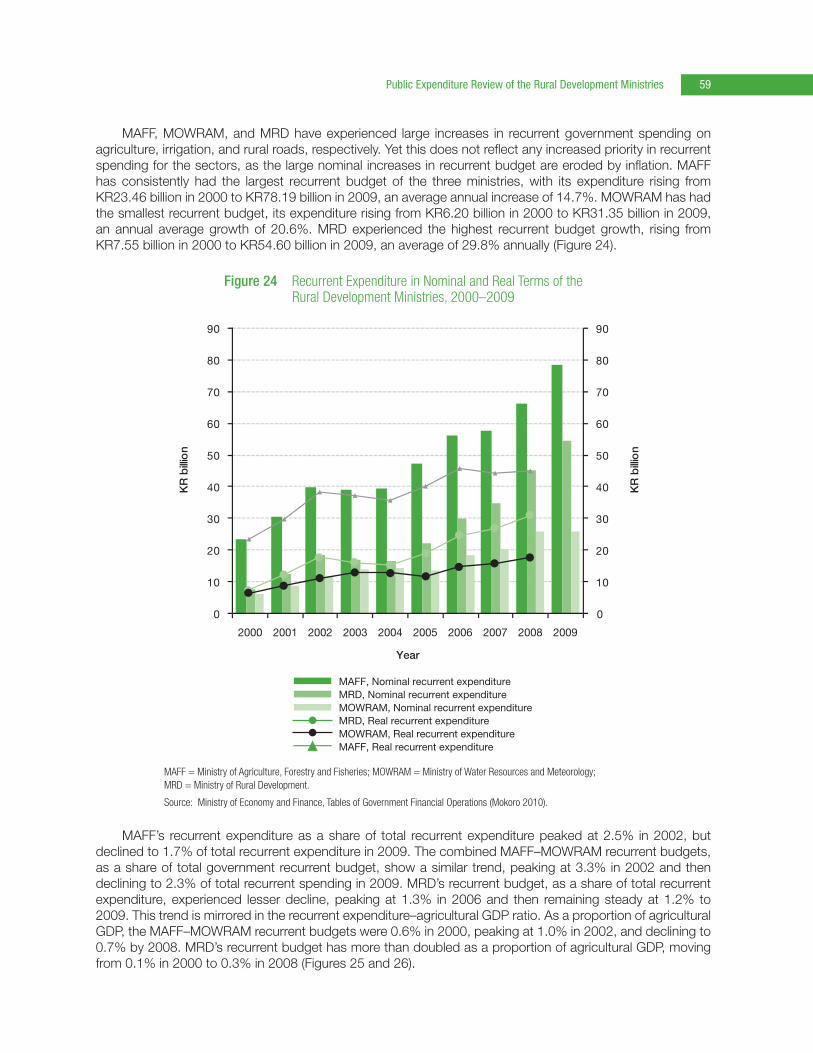
Public Expenditure Review of the Rural Development Ministries 59
MAFF, MOWRAM, and MRD have experienced large increases in recurrent government spending on agriculture, irrigation, and rural roads, respectively. Yet this does not reflect any increased priority in recurrent spending for the sectors, as the large nominal increases in recurrent budget are eroded by inflation. MAFF has consistently had the largest recurrent budget of the three ministries, with its expenditure rising from KR23.46 billion in 2000 to KR78.19 billion in 2009, an average annual increase of 14.7%. MOWRAM has had the smallest recurrent budget, its expenditure rising from KR6.20 billion in 2000 to KR31.35 billion in 2009, an annual average growth of 20.6%. MRD experienced the highest recurrent budget growth, rising from KR7.55 billion in 2000 to KR54.60 billion in 2009, an average of 29.8% annually (Figure 24).
MAFF’s recurrent expenditure as a share of total recurrent expenditure peaked at 2.5% in 2002, but declined to 1.7% of total recurrent expenditure in 2009. The combined MAFF–MOWRAM recurrent budgets, as a share of total government recurrent budget, show a similar trend, peaking at 3.3% in 2002 and then declining to 2.3% of total recurrent spending in 2009. MRD’s recurrent budget, as a share of total recurrent expenditure, experienced lesser decline, peaking at 1.3% in 2006 and then remaining steady at 1.2% to 2009. This trend is mirrored in the recurrent expenditure–agricultural GDP ratio. As a proportion of agricultural GDP, the MAFF–MOWRAM recurrent budgets were 0.6% in 2000, peaking at 1.0% in 2002, and declining to 0.7% by 2008. MRD’s recurrent budget has more than doubled as a proportion of agricultural GDP, moving from 0.1% in 2000 to 0.3% in 2008 (Figures 25 and 26).
Figure 24 Recurrent Expenditure in Nominal and Real Terms of the Rural Development Ministries, 2000–2009
MAFF = Ministry of Agriculture, Forestry and Fisheries; MOWRAM = Ministry of Water Resources and Meteorology; MRD = Ministry of Rural Development.
Source: Ministry of Economy and Finance, Tables of Government Financial Operations (Mokoro 2010).
0
10
20
30
40
50
60
70
80
90
0
10
20
30
40
50
60
70
80
90
KR
billi
on
KR
billi
on
MAFF, Nominal recurrent expenditureMRD, Nominal recurrent expenditureMOWRAM, Nominal recurrent expenditureMRD, Real recurrent expenditureMOWRAM, Real recurrent expenditureMAFF, Real recurrent expenditure
2000 2001 2002 2003 2004 2005
Year
2006 2007 2008 2009

Rural Development for Cambodia60
Figure 25 Combined Recurrent Expenditure as a Share of Total Government Expenditurein the Rural Development Ministries, 2000–2009
MAFF = Ministry of Agriculture, Forestry and Fisheries; MOWRAM = Ministry of Water Resources and Meteorology; MRD = Ministry of Rural Development.
Source: Ministry of Economy and Finance, Tables of Government Financial Operations (Mokoro 2010).
0.0
0.5
1.0
1.5
2.0
2.5
3.0
3.5%
to
to
tal
Year
MAFF recurrent MRD recurrentMOWRAM recurrent MAFF and MOWRAM
2000 2001 2002 2003 2004 2005 2006 2007 2008 2009
Figure 26 Recurrent Expenditure–Agricultural Gross Domestic Product Ratios of the Rural Development Ministries, 2000–2008
MAFF = Ministry of Agriculture, Forestry and Fisheries; MOWRAM = Ministry of Water Resources and Meteorology; MRD = Ministry of Rural Development.
Source: Ministry of Economy and Finance, Tables of Government Financial Operations (Mokoro 2010).
0.0
0.2
0.4
0.6
0.8
1.0
1.2
MAFF recurrent MRD recurrent
MOWRAM recurrent MAFF and MOWRAM
% o
f no
min
al a
gri
cultu
re G
DP
Year
2000 2001 2002 2003 2004 2005 2006 2007 2008
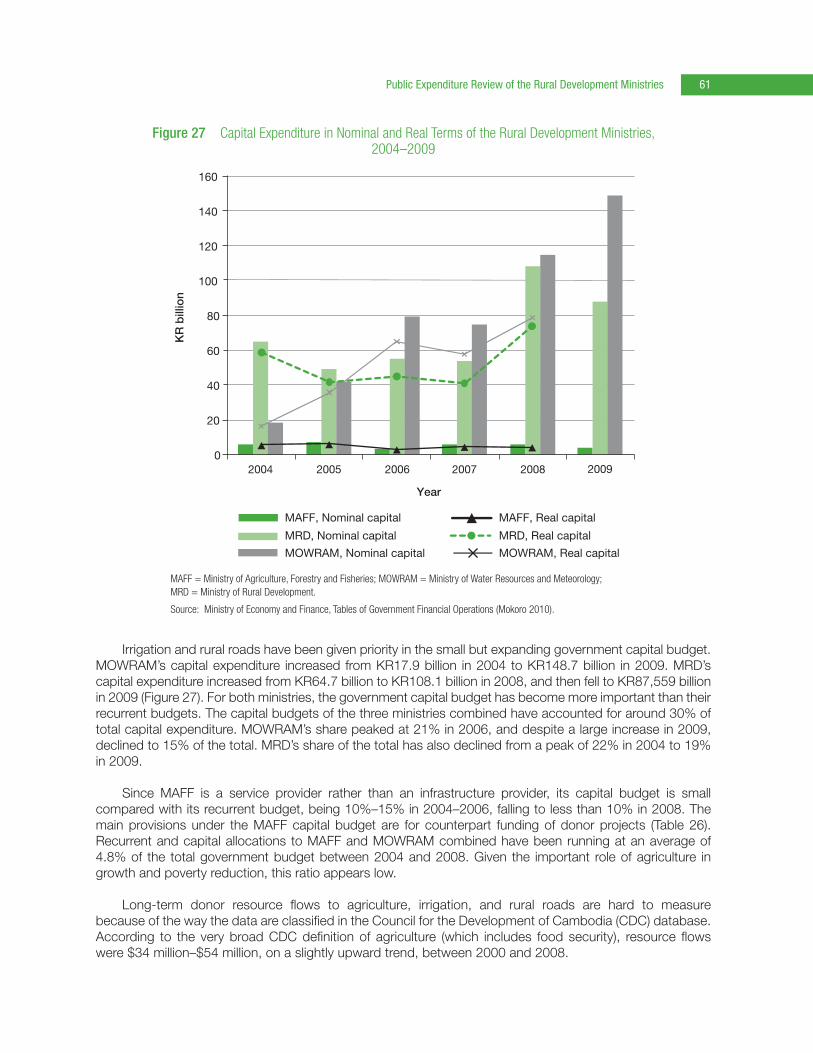
Public Expenditure Review of the Rural Development Ministries 61
Irrigation and rural roads have been given priority in the small but expanding government capital budget. MOWRAM’s capital expenditure increased from KR17.9 billion in 2004 to KR148.7 billion in 2009. MRD’s capital expenditure increased from KR64.7 billion to KR108.1 billion in 2008, and then fell to KR87,559 billion in 2009 (Figure 27). For both ministries, the government capital budget has become more important than their recurrent budgets. The capital budgets of the three ministries combined have accounted for around 30% of total capital expenditure. MOWRAM’s share peaked at 21% in 2006, and despite a large increase in 2009, declined to 15% of the total. MRD’s share of the total has also declined from a peak of 22% in 2004 to 19% in 2009.
Since MAFF is a service provider rather than an infrastructure provider, its capital budget is small compared with its recurrent budget, being 10%–15% in 2004–2006, falling to less than 10% in 2008. The main provisions under the MAFF capital budget are for counterpart funding of donor projects (Table 26). Recurrent and capital allocations to MAFF and MOWRAM combined have been running at an average of 4.8% of the total government budget between 2004 and 2008. Given the important role of agriculture in growth and poverty reduction, this ratio appears low.
Long-term donor resource flows to agriculture, irrigation, and rural roads are hard to measure because of the way the data are classified in the Council for the Development of Cambodia (CDC) database. According to the very broad CDC definition of agriculture (which includes food security), resource flows were $34 million–$54 million, on a slightly upward trend, between 2000 and 2008.
Figure 27 Capital Expenditure in Nominal and Real Terms of the Rural Development Ministries, 2004–2009
MAFF = Ministry of Agriculture, Forestry and Fisheries; MOWRAM = Ministry of Water Resources and Meteorology; MRD = Ministry of Rural Development.
Source: Ministry of Economy and Finance, Tables of Government Financial Operations (Mokoro 2010).
0
20
40
60
80
100
120
140
160K
R b
illio
n
Year
MAFF, Nominal capital
MRD, Nominal capital
MOWRAM, Nominal capital
MAFF, Real capital
MRD, Real capital
MOWRAM, Real capital
2004 2005 2006 2007 2008 2009

Rural Development for Cambodia62
With the exception of MAFF, there has been no significant shift in the structure of wage and nonwage spending in recurrent budgets, and the wage bill is relatively small. During 2000–2006, salaries were just 24% of total recurrent expenditures for MAFF, although this increased to 34% by 2008. The share of salaries and wages in MOWRAM rose slightly from 15% to 18%, and for MRD, it was static at 15%. Low provisioning of wages and weak incentives are concerns across the government, but the responsibilities lie with the Council for Administrative Reform and are outside of the mandates of the line ministries.
Operating budgets have been an area of difficulty for all three ministries. Shortfalls in the MAFF operating budget for research and extension have been covered by donors. Historically, large parts of the recurrent operating budgets of MOWRAM and MRD have been used for irrigation and rural road rehabilitation works, and maintenance was not a priority. Recently, however, more funds were provided for rural road maintenance but still at a level of only 20%–30% of that required, as estimated by the Rural Roads Department. Meanwhile, the full responsibility for the maintenance of irrigation schemes is being shifted to farmer water user communities (FWUCs) in an ambitious policy move by MOWRAM.
Budget execution for the three ministries has been volatile but has improved. Total government budget execution performance has been relatively stable. Execution has been within 5% of Budget Law provisions in 6 out of 9 years between 2000 and 2009. The execution figures for the three ministries reflect considerable expenditure volatility, in terms of underspending. MAFF and MOWRAM were within 5% of the budget in 4 years out of 9, with MRD in only 1 year out of 9 (Figure 28). Deviations from the budget were greatest during 2001–2005, where budget underspending was often more than 10% of the budget. Reportedly, this was due to cash flow difficulties relating to the budget cash management system. Since 2006, spending performance has improved. The average budget execution rate for the 3 years 2007–2009 was 99% for MAFF, 94% for MOWRAM, and 91% for MRD.
Functional expenditure analysis shows that MAFF has been providing very low levels of recurrent expenditure to research, extension, and agro-industry. During 2007–2009, 2.4% of total MAFF recurrent expenditure was spent on agricultural extension, 4.2% on agricultural research, and 8.9% on livestock and veterinary services. Forestry and fisheries, which are supported by dedicated joint technical working groups, received 18.5% and 11.4%, respectively. MAFF overhead costs of policy, planning, and management averaged 28.8% (Table 27).
On the other hand, donor funding has given priority to agricultural services, particularly extension. In 2007, 39% of total donor funding to MAFF was for extension, 18% for fisheries, and 9% for agronomy and land improvement.37 Agricultural research received only 3% of donor funds. On average, during 2007–2009, extension received 31.0% of total donor funding, followed by 14.5% for fisheries, 13.9% for agro-industry, and 10.1% for livestock and veterinary services (Table 28).
37 Data from 2008 are distorted by very large farmer agricultural input support.
Table 26 Ministry of Agriculture, Forestry and Fisheries: Breakdown of Government-Funded Capital Expenditure (KR million)
Year Construction and Equipment Counterpart Funds Budget Support Total Capital Total Recurrent
2004 372 1,984 3,335 5,691 39,368
2005 6,738 6,738 47,110
2006 2,684 459 3,143 55,941
2007 3,834 1,628 5,462 57,606
2008 2,311 3,389 5,699 65,823
Source: Ministry of Economy and Finance, Tables of Government Financial Operations (Mokoro 2010).

Public Expenditure Review of the Rural Development Ministries 63
Figure 28 Budget Execution Rates by Ministry, 2000–2009 (%)
MAFF = Ministry of Agriculture, Forestry and Fisheries; MOWRAM = Ministry of Water Resources and Meteorology; MRD = Ministry of Rural Development.
Source: Ministry of Economy and Finance, Tables of Government Financial Operations (Mokoro 2010).
0
20
40
60
80
100
120
140
% o
f B
udg
et L
aw
2000 2001 2002 2003 2004 2005
Year
2006 2007 2008 2009
MAFF MRD MOWRAM
Table 27 Broad Distribution of the Central Ministry of Agriculture, Forestry, and Fisheries Budget (KR million)
2007 2008 2009 Average Share (%)
Agronomy and land improvement 3,275 3,380 2,136 6.9
Agricultural machinery 609 667 257 1.2
Agricultural extension 957 1,212 932 2.4
Livestock and veterinary 2,503 3,495 6,168 8.9
Rubber production 1,842 1,865 1,558 4.1
Agro-industry 317 514 372 0.9
Agricultural research 1,750 1,682 2,073 4.2
Agricultural education and training 5,239 5,124 6,310 12.7
Forestry 8,495 8,868 6,242 18.5
Fisheries 4,544 6,972 3,013 11.4
Policy planning and management 7,459 9,338 23,433 28.8
Total Central MAFF 36,990 43,116 52,494 100.0
Provinces MAFF 20,665 22,705 27,678
Total Central and Provincial MAFF 57,655 65,821 80,172
MAFF = Ministry of Agriculture, Forestry and Fisheries.
Source: Department of Finance, MAFF, as cited in Mokoro (2010).

Rural Development for Cambodia64
Overall, agricultural extension is a substantial recipient of total resources. After consolidating MAFF central and provincial recurrent expenditures with donor disbursements, agricultural extension received 24% of the total in 2007 and 16% in 2008. However, government extension services would find it difficult to operate without donor subsidies. Agronomy and land improvement had a 9% share of total resources in 2007, and livestock and veterinary services had 6%. Fisheries and forestry, which both have donor-supported sector plans in place, continue to be major beneficiaries under the consolidated scenario, although forestry receives a much lower share of donor support than support from the government budget. Some areas are hardly financed by the government, making them extremely donor-dependent.
As previously stated, the government budget provides little for the operations and maintenance of irrigation and inadequate levels for rural roads. Operations and maintenance accounted for less than 10% of MOWRAM’s recurrent budget during 2006–2008, but increased to 14% in 2009. Even at this level, the operations and maintenance provision was less than $1 million for the whole country, a fraction of the asset value, and this is generally not used for maintenance (Table 29). During 2007–2009, the government provided over two-thirds of the resource flows to the sector, a reasonably comfortable position in terms of aid dependency. The government’s policy on operations and maintenance is for the FWUCs to take responsibility for all levels of scheme maintenance over a 5-year transition period, during which time the committees will receive training and technical support. Experience from some of the larger donor-supported irrigation schemes where this approach has been adopted shows that this is an ambitious target. Consideration should be given to a more graduated approach based on joint government–farmer cost sharing over the medium term.
Table 28 Donor Total Shares of Resource Provision in the Ministry of Agriculture, Forestry and Fisheries (KR million)
2007 2008 2009 Average Share (%)
Agronomy and land improvement 7,956 6,575 5,151 7.0
Agricultural machinery 0 0 0 0
Agricultural extension 33,166 24,389 29,702 31.0
Livestock and veterinary 4,469 10,959 14,286 10.1
Rubber production 4,740 3,065 – 2.9
Agro-industry 3,760 31,355 6,843 13.9
Agricultural research 3,375 2,852 3,905 3.6
Agricultural education and training 2,586 3,705 6,839 4.5
Forestry 5,293 3,550 5,685 5.2
Fisheries 15,219 9,005 16,638 14.5
Policy planning and management 3,805 7,514 9,639 7.2
Total Donor Funding 84,369 102,969 98,688
Source: Estimates based on the Council for the Development of Cambodia database and the Department of International Cooperation records in Mokoro (2010).
Table 29 Ministry of Water Resources and Meteorology: Breakdown of Government-Funded Capital Expenditure (KR million)
Year Construction and Equipment Counterpart Funds Budget Support Total Capital Total Recurrent
2004 4,981 3,686 9,191 17,859 14,305
2005 12,938 10,778 17,780 41,495 13,745
2006 40,826 7,237 31,088 79,151 18,355
2007 50,476 5,791 18,241 74,508 20,427
2008 63,157 8,365 43,071 114,593 25,861
Source: Department of International Cooperation, as cited in Mokoro (2010).

Public Expenditure Review of the Rural Development Ministries 65
The domestic capital budget for irrigation is substantial (it was more than double the level of donor resources in 2007), but it is not effectively utilized. The practice is to use the capital budget to rebuild main canals in the first instance, leaving the construction of secondary and tertiary parts of the irrigation scheme until a later date, when funds might become available. There are serious negative economic consequences to this approach, as many farmers are still unable to irrigate due to the lack of secondary and tertiary systems, and the returns to the investment are delivered late. The government–total consolidated resources ratio for the irrigation sector was favorable at 74% in 2007 and 75% in 2009 (Table 30).
The government budget for the operations and maintenance of rural roads has increased from negligible levels in the early 2000s to KR18.8 billion in 2009 (one-third of the MRD recurrent budget), but this is still not enough to provide adequate maintenance. The Rural Roads Department estimates that the operation and maintenance budget is only sufficient for 20%–30% of the real periodic and routine maintenance requirement annually (Table 31 and Table 32).
Government capital, commune/sangkhat38 funds (CSFs), and donor funds have had a positive impact on improving Cambodia’s rural road network in the last 10 years. However, of the current total network of 33,005 kilometers, up to one-half is not kept in good condition.
38 Another word for commune.
Table 30 Consolidated Resource Allocation to Irrigation by Government and Donors (KR million)
Allocation 2007 2008 2009
MOWRAM recurrent 20,427 25,861 31,352
MOWRAM capital 74,508 114,593 148,691
Irrigation donors 33,570 64,975 59,768
Total 128,505 205,429 239,811
Government–total ratio (%) 74 68 75
MOWRAM = Ministry of Water Resources and Meteorology.
Source: Mokoro (2010).
Table 31 Recurrent Expenditure of the Rural Roads Department (KR million)
Year Periodic MaintenanceRoutine
MaintenanceOperations and Maintenance Share
of MRD Total (%) Salaries MRD Total
2008 14,500 1,500 35% 45,243
2009 17,300 (contracted amount) 1,497 34% 281 54,296
MRD = Ministry of Rural Development.
Source: MRD, Department of Finance (Mokoro 2010).
Table 32 Ministry of Rural Development: Breakdown of Government-Funded Capital Expenditure (KR million)
Year Construction and Equipment Counterpart Funds Budget Support Total Capital Total Recurrent
2004 60,618 1,909 2,214 64,741 16,627
2005 42,088 5,082 1,439 48,609 22,144
2006 44,976 9,624 806 55,046 30,014
2007 49,763 3,490 53,253 34,754
2008 101,978 6,133 108,111 45,243
Source: Department of International Cooperation, as cited in Mokoro (2010).

Rural Development for Cambodia66
The CSFs are financed by a subdecree, which provides for a fixed amount of domestic government revenues to be allocated to the funds annually. This fixed amount has increased from the original 1.5% of domestic revenues to 2.8%. These funds are complemented by incremental funding from the Department for International Development of the United Kingdom, Swedish International Development Cooperation Agency, and United Nations Development Programme (about $2 million annually). Assistance is also provided through a reimbursement arrangement with the World Bank under its Rural Investment and Local Governance Project. In 2010, funds reached $35.3 million (Table 33). Of these funds, one-third is allocated for administration. Of the balance, 90% is used for infrastructure, of which historically about 80% has been spent on rural roads.
Funding from communities and private charity groups is also important in provisioning rural roads. Private and community funding is usually included in commune investment plans and often cofinance activities with the CSFs. A recent survey found that funding for pagodas accounted for over one-half of the private and community-funded spending, with schools and rural roads accounting for the majority of the rest of the funding. The total private and community funding, excluding pagodas, was about 3 times higher than the CSFs on average (Craig and Kimchoeun, forthcoming).
The government–total consolidated resources ratio for the rural roads sector was 60% in 2007 and 78% in 2009 (Table 34). These levels provide a comfortable balance between government and donor funding.
Table 33 Commune/Sangkhat Funds Total Resources Managed by Councils, 2002–2010
Year CS Fund CS Targeted ($) Total CS Fund to Roads (KR million) Exchange Ratea
2002 7,868,695 – 7,868,695 16,349 3,935
2003 13,184,494 – 13,184,494 27,706 3,980
2004 14,500,000 370,000 14,870,000 30,861 4,031
2005 16,320,988 1,787,916 18,108,904 35,470 4,116
2006 18,527,143 3,420,622 21,947,765 39,726 4,061
2007 21,201,160 5,601,103 26,802,263 44,810 4,003
2008 22,148,810 16,527,578 38,676,388 47,726 4,081
2009 26,985,714 16,567,280 43,552,994 59,345 4,165
2010 35,392,619 13,076,219 48,468,838a Exchange rate USD/Riel eop (EAP Brief Nov 2009 update).
Notes: CS Fund:
– of which 66% is development element
– of which 90% is infrastructure
– of development element, approximately 80% is spent on rural roads
Approximately 53% of CS Fund is spent on rural roads in 1,621 communes.
Source: National Committee for sub-National Democratic Development, as cited in Mokoro (2010).
Table 34 Consolidated Resource Allocation to Rural Roads by Government and Donors (KR million)
Allocation 2007 2008 2009
Rural roads recurrent 13,902 18,097 25,503
Ministry of Rural Development capital 53,253 108,111 87,559
Commune funds 44,810 47,726 59,345
Rural roads donors 75,270 52,282 38,843
Total 187,685 226,215 221,250
Government–total ratioa (%) 60 77 78a Because 95% of commune funds are domestically sourced, they are treated as government funds in the ratio.
Source: Mokoro (2010).

Public Expenditure Review of the Rural Development Ministries 67
Given the progress made with establishing new and rehabilitated rural road infrastructure and the need to avoid high future rehabilitation costs by better maintenance, there should be a shift in resource allocation to provide adequate funding to maintain the value of the asset stock. This might need to involve a rebalancing of government capital and recurrent resources in the sector and changing from laterite surface road to double bituminous surface treatment pavement.
Progress has been made with budget planning processes in government. The 3-year rolling Medium-Term Expenditure Framework is active in predicting and guiding resource flows to priority sectors within the government. However, priorities in high-level 5-year planning documents, such as the national strategic development framework, are very broad and may become outdated as development takes place and circumstances change.
The ministry strategic budget frameworks, introduced under Public Financial Management Reform Program (PFMRP) in 2007, are key policy and budget-planning tools for ministries. They are performance- and program-oriented, medium-term planning and budgeting tools. Used by line ministries to prepare their medium-term and annual budgets as well as their program budgets, these frameworks should become the central planning tool for the implementation of the Strategy for Agriculture and Water. At the moment, their effectiveness is constrained by capacity limitations and by the difficulties of integrating donor flows due to the separation around project implementation units. The movement away from projects toward more programmatic approaches is appreciated by the donor community, reflected in the support that donors have given to the preparation of the Strategy for Agriculture and Water and its five programs. The transition to programs should be coordinated with the budget planning and management instruments, which are being developed by the government. Of these, the Medium-Term Expenditure Framework and the ministry strategic budget frameworks are probably the most crucial. Donors, in consultation with the government, are preparing to map the way forward for this transition.
C. Public Expenditure Efficiency and Impact Analysis
The MAFF, MOWRAM, and MRD currently use an incremental approach to planning and budgeting that relies on donors for most financing of new investment projects. Government recurrent expenditure arising out of existing and proposed activities on donor-financed projects is usually underfunded, adversely impacting service delivery to the poor. The focus of these ministries is on projects, which creates a vacuum for policy and budget strategizing. In addition, there are overlaps of responsibilities in the three ministries. They suffer from weak interministerial and intra-ministerial coordination mechanisms, and tend to operate within “policy silos”39 despite recent initiatives, such as a joint strategic plan for water and agriculture. Further, they have shortages of qualified staff members. The key areas of weakness related to PFM in the three line ministries are (i) weak links among their policies, programs, and the budget process; (ii) program duplication and unrealistic budget estimation without identified sources of funding; and (iii) inadequate budget execution process, including lack of effective internal control in the procurement processes.
An Asian Development Bank (ADB) assessment conducted in May–June 2007 found that MRD’s financial and accountability systems needed urgent strengthening. Procurement risks for donor-assisted projects were also identified. ADB’s Office of the Auditor General findings on the Northwest Rural Development Project (NRDP) also raised concerns (ADB 2006). Over the years, lessons from ongoing projects also underlined major weaknesses in internal control and procurement practices (ADB 2000, 2003a, 2003b). Internal audit departments in MOWRAM and MAFF were established in 2007 and in MRD in 2008. However, the capacity for effective internal audit in line ministries remains low.
39 This means being in isolation from each other.

Rural Development for Cambodia68
Table 35 Key Outputs Achieved in the Ministry of Agriculture, Forestry and Fisheries; Ministry of Water Resources and Meteorology; and Ministry of Rural Development, 2002–2009
Units 2002 2003 2004 2005 2006 2007 2008 2009
Research
New varieties developed 13 (1999–2009)
Cash crop varieties no. 6 (1999–2009)
Soil, water, harvest packages no. 2 4 4
Leveling, tillage demos no. 2 1 1
Extension
Farmers at training courses ‘000 15.4 17.1 17.4 56.4 11.0 21.3 20.7
Farmers at workshops/meetings ‘000 2.5 1.5 6.0 24.1 6.5 8.1 4.4
Farmers at field visits ‘000 0.1 0.6 1.5 1.3 1.8 0.0 0.4
Farmers at field school ‘000 2.4 2.9 3.1 5.3 4.3 0.4
Farmers at demonstrations ‘000 1.1 1.0 1.1 0.9 4.7 0.5 0.6
Farmers at demonstration days ‘000 2.4 4.7 3.0 8.4 0.8 3.2 2.2
Total farmers contacted ‘000 23.9 27.8 32.1 96.4 24.7 37.5 28.7 20
as % of all farmers 0.9 1.1 1.2 3.6 0.9 1.4 1.0
Irrigation
New areas irrigated (DoP) ‘000 ha 24.20 51.1 28 43.8 89.2 52.1 54.1 25
as % of total irrigated area 3.8% 7.5% 4.1% 5.9% 10.6% 5.9% 5.8% 2.7%
Rural Roads
Rehabilitation km 107 349 256 277 204 262 585 43
as % of total rural road 0.4% 1.2% 90.0% 90.0% 70.0% 80.0% 1.8% 1.3%
No. of rehabilitated roads no. 11 17 11 8 13 23 34 3
Periodic Maintenance km 297 999 609 0 353 510 50
as % of total rural road 0 1.0% 3.4% 2.0% 0 1.1% 1.6% 1.6%
Routine Maintenance km 82 159 124 241 334 384 535 59
as % of total rural road 0.3% 0.6% 0.4% 0.8% 1.1% 1.2% 1.7% 1.8%
DoP = Department of Planning, ha = hectare, km = kilometer.
Note: Blank spaces indicate data not available.
Sources: Cambodian Agricultural Research and Development Institute 10-year achievement report (1999–2009) and Annual Report (2003–2005), Department of Agriculture Extension Annual Reports, MOWRAM DoP records, and Cambodian Information System on Irrigation Systems, MRD Department of Rural Roads records. Figures aim to include government- and donor-funded activities, but not communes, nongovernment organizations, political parties, or private sector. Cited in Mokoro (2010).
Public expenditure output levels have been sustained since 2002. All concerned departments maintain management records and report these in annual reports. For extension and irrigation, these figures aim to consolidate government and donor activity, but rural road figures are for the government alone. Table 35 summarizes the outputs and shows that the level of activity has been sustained, with some annual variation, due to sporadic donor activity and data collection.
Costs per unit of output have increased for irrigation, but declined for rural roads. The total cost of achieving outputs was analyzed by dividing total expenditure (including all overhead, expressed in real terms) by total outputs. This is summarized in Figure 29, which shows actual figures and trend lines. Annual variations in actual figures reflect changes in the nature of activities and in prices and the lumpy output effects of large projects. The efficiency of extension has been constant, while irrigation costs have increased and the efficiency of rural roads has improved. The difference in performance is not explained by variations in the prices of inputs.
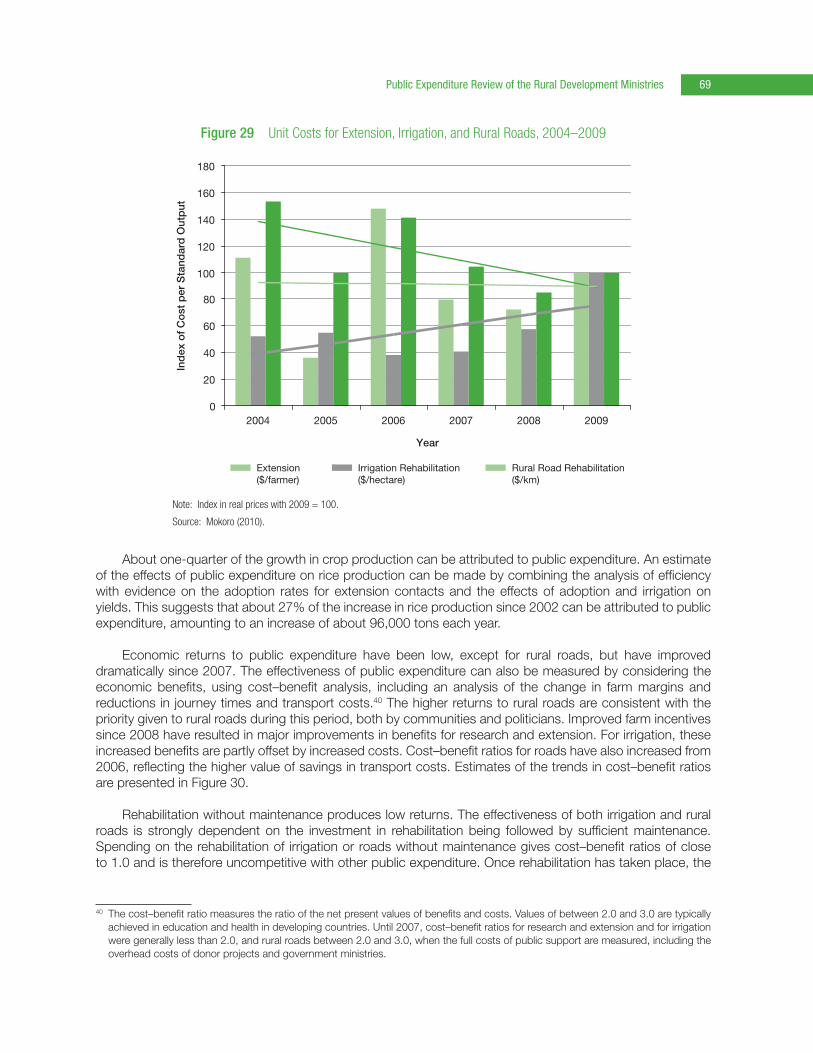
Public Expenditure Review of the Rural Development Ministries 69
About one-quarter of the growth in crop production can be attributed to public expenditure. An estimate of the effects of public expenditure on rice production can be made by combining the analysis of efficiency with evidence on the adoption rates for extension contacts and the effects of adoption and irrigation on yields. This suggests that about 27% of the increase in rice production since 2002 can be attributed to public expenditure, amounting to an increase of about 96,000 tons each year.
Economic returns to public expenditure have been low, except for rural roads, but have improved dramatically since 2007. The effectiveness of public expenditure can also be measured by considering the economic benefits, using cost–benefit analysis, including an analysis of the change in farm margins and reductions in journey times and transport costs.40 The higher returns to rural roads are consistent with the priority given to rural roads during this period, both by communities and politicians. Improved farm incentives since 2008 have resulted in major improvements in benefits for research and extension. For irrigation, these increased benefits are partly offset by increased costs. Cost–benefit ratios for roads have also increased from 2006, reflecting the higher value of savings in transport costs. Estimates of the trends in cost–benefit ratios are presented in Figure 30.
Rehabilitation without maintenance produces low returns. The effectiveness of both irrigation and rural roads is strongly dependent on the investment in rehabilitation being followed by sufficient maintenance. Spending on the rehabilitation of irrigation or roads without maintenance gives cost–benefit ratios of close to 1.0 and is therefore uncompetitive with other public expenditure. Once rehabilitation has taken place, the
40 The cost–benefit ratio measures the ratio of the net present values of benefits and costs. Values of between 2.0 and 3.0 are typically achieved in education and health in developing countries. Until 2007, cost–benefit ratios for research and extension and for irrigation were generally less than 2.0, and rural roads between 2.0 and 3.0, when the full costs of public support are measured, including the overhead costs of donor projects and government ministries.
Figure 29 Unit Costs for Extension, Irrigation, and Rural Roads, 2004–2009
Note: Index in real prices with 2009 = 100.
Source: Mokoro (2010).
Extension($/farmer)
Irrigation Rehabilitation($/hectare)
Rural Road Rehabilitation($/km)
0
20
40
60
80
100
120
140
160
180
2004 2005 2006 2007 2008 2009
Ind
ex o
f C
ost
per
Sta
ndar
d O
utp
ut
Year
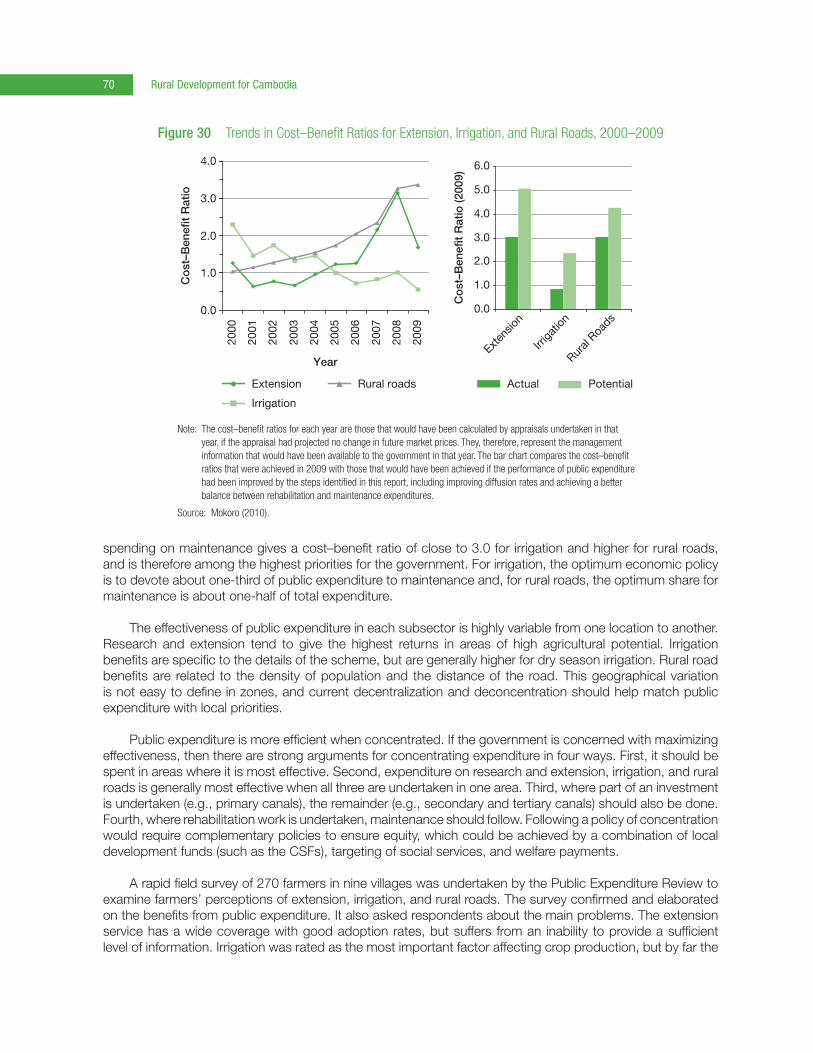
Rural Development for Cambodia70
spending on maintenance gives a cost–benefit ratio of close to 3.0 for irrigation and higher for rural roads, and is therefore among the highest priorities for the government. For irrigation, the optimum economic policy is to devote about one-third of public expenditure to maintenance and, for rural roads, the optimum share for maintenance is about one-half of total expenditure.
The effectiveness of public expenditure in each subsector is highly variable from one location to another. Research and extension tend to give the highest returns in areas of high agricultural potential. Irrigation benefits are specific to the details of the scheme, but are generally higher for dry season irrigation. Rural road benefits are related to the density of population and the distance of the road. This geographical variation is not easy to define in zones, and current decentralization and deconcentration should help match public expenditure with local priorities.
Public expenditure is more efficient when concentrated. If the government is concerned with maximizing effectiveness, then there are strong arguments for concentrating expenditure in four ways. First, it should be spent in areas where it is most effective. Second, expenditure on research and extension, irrigation, and rural roads is generally most effective when all three are undertaken in one area. Third, where part of an investment is undertaken (e.g., primary canals), the remainder (e.g., secondary and tertiary canals) should also be done. Fourth, where rehabilitation work is undertaken, maintenance should follow. Following a policy of concentration would require complementary policies to ensure equity, which could be achieved by a combination of local development funds (such as the CSFs), targeting of social services, and welfare payments.
A rapid field survey of 270 farmers in nine villages was undertaken by the Public Expenditure Review to examine farmers’ perceptions of extension, irrigation, and rural roads. The survey confirmed and elaborated on the benefits from public expenditure. It also asked respondents about the main problems. The extension service has a wide coverage with good adoption rates, but suffers from an inability to provide a sufficient level of information. Irrigation was rated as the most important factor affecting crop production, but by far the
Figure 30 Trends in Cost–Benefit Ratios for Extension, Irrigation, and Rural Roads, 2000–2009
Note: The cost–benefit ratios for each year are those that would have been calculated by appraisals undertaken in that year, if the appraisal had projected no change in future market prices. They, therefore, represent the management information that would have been available to the government in that year. The bar chart compares the cost–benefit ratios that were achieved in 2009 with those that would have been achieved if the performance of public expenditure had been improved by the steps identified in this report, including improving diffusion rates and achieving a better balance between rehabilitation and maintenance expenditures.
Source: Mokoro (2010).
Actual Potential
0.0
1.0
2.0
3.0
4.0
2000
2001
2002
2003
2004
2005
2006
2007
2008
2009
Co
st–B
enef
it R
atio
Year
Extension
Irrigation
Rural roads
0.0
1.0
2.0
3.0
4.0
5.0
6.0
Exten
sion
Irriga
tion
Rural
Roads
Co
st–B
enef
it R
atio
(200
9)

Public Expenditure Review of the Rural Development Ministries 71
largest problem is the lack of water in many schemes. Lack of canals and water-diversion facilities were also very important. Positive views about rural roads were tempered by a belief among the majority of the farmers that maintenance was insufficient and that benefits would not be sustained.
In the longer term, there are substantial challenges for public expenditure, and policies will change to deal with these. For research and extension, the private sector is likely to play an increasingly important role as the sector develops. For irrigation, once the most effective schemes have been rehabilitated and FWUCs have taken over substantial responsibility for maintenance, there will be less demand for public expenditure. Rural roads will remain a public sector responsibility, but there are major challenges in developing new technologies, as laterite soil resources for road construction become more scarce.
Agricultural expenditure has a strong impact on poverty. Improved farm incomes and reduced transport costs lead to improved economic growth and poverty reduction. Because these benefits are mainly in rural areas, and about 90% of the poor live in rural areas, such expenditure will have a strong impact on poverty, although wealthier farmers and rural residents will benefit more in absolute terms. However, the recent strong growth in agricultural wages provides good evidence that the benefits are spreading through the entire rural population.
Poorer farmers spend a much higher proportion of their income on fertilizer than wealthier farmers, and Cambodia’s current policy of duty exemption for fertilizer is therefore reducing inequality. However, in absolute terms, about 75% of the benefits go to the wealthiest 50% of the population. In contrast, poor farmers spend a similar proportion of their income on farm mechanization as wealthy farmers, and this policy can only be justified as a stimulus to growth and not a measure for poverty reduction.
Surveys and statistical analysis provide mixed messages. Recent studies have consulted rural people on priorities. These have tended to confirm that rural roads are a top priority. They have also suggested that extension is valued among farmers and that irrigation is highly valued, but also that many farmers are frustrated by their lack of access to water, despite being within the command area of irrigation schemes.
Several recent studies have undertaken statistical analyses of the Cambodia Socio-Economic Survey’s (CSES) household survey and other survey data to assess the factors that have the greatest impact on crop production and incomes. These provide mixed messages, but the importance of fertilizer is common to all, and most also indicate the importance of rural roads. Conclusions on irrigation and extension are important but more mixed. Other types of rural infrastructure, including telephones and electricity, are also important.
Actual expenditure has deviated from national strategic guidelines. Comparing actual expenditure in 2007 and 2008 with the cost allocations in the agriculture sector development plan, Strategy for Agriculture and Water, and national strategic development plan suggests that rural roads are being overfunded and that research is being underfunded. Although irrigation and extension also tend to be overfunded, the conclusions are more mixed.
For some decades, there has been a widespread international view that the agriculture sector should be dominated by solutions based on the private sector and farmer communities. However, in Cambodia, there are also important roles for the government and nongovernment organizations (NGOs). Both have foster farmer cooperation, most notably in the FWUCs. While FWUCs are being established, the government needs to provide transitional support to the maintenance of irrigation. NGOs can provide intensive support for extension messages for which there is little commercial interest, and the government extension service has a much wider outreach than NGOs and provides technical skills needed for NGOs.
Much work has been done to assess the impact of climate change on agriculture. The Climate Change Department has led some detailed technical work on climate change modeling and the impact of climate change on agriculture. This suggests that, because of Cambodia’s location at the edge of the monsoon

Rural Development for Cambodia72
system, predictions of climate change are difficult. The dry season is likely to become drier in all areas, and the wet season is likely to become wetter in the south and east. Evidence of increased variability of rainfall is mixed, and this does not seem to have a large total impact, although individual events may still have devastating consequences for vulnerable households. Of much greater significance is the likelihood that most areas of the country will be subject to shorter wet seasons.
The implications of climate change for public expenditure suggest that the importance of research and extension will be greatly increased, in view of the need to develop new crop varieties with shorter growing periods and more drought and flood resilience. The importance of irrigation will also be much higher, to ensure that crops have water through to maturity if wet seasons are shortened. Climate change will have less impact on the returns from rural roads.
1. Incidence of Tax Expenditure
The main source of tax expenditure in agriculture is the exemption from import duty for fertilizer and tractors. Figure 31 presents official customs figures, which may understate the volumes and values involved, as there is probably a degree of informal trade, at least in fertilizer. According to official figures, imports of fertilizer have grown substantially since 2004, both in value and quantity. By 2009, nearly 200,000 tons of fertilizer and over 20,000 tractor units were imported, according to customs data. This suggests an average application of about 80 kilograms per hectare across the whole country. In view of the large area of rainfed rice on which fertilizer application is problematic, this suggests that fertilizer application in irrigated crops is high, that informal fertilizer imports are not as substantial as is sometimes reported, and/or that a significant portion of the fertilizer is used for nonrice crops. The most common type of fertilizer imported is urea, and if all urea was applied to fertilizer, with standard response rates of about 7 kilograms of paddy per kilogram of nitrogen, then fertilizer imported in 2009 would be responsible for about 0.6 million tons of paddy production.
The value of imports has increased to over $40 million for fertilizer and about $20 million for tractors. The quantity of imports of both fertilizer and tractors jumped dramatically in 2009, perhaps reflecting renewed interest in agricultural production, after the improved returns in 2007 and 2008. If fertilizer had been taxed at the same 20% rate as fuel imports, then the revenue generated would have been about $8 million in 2009. If tractors had been taxed at the same 15% level as other equipment and machinery, then revenue would have been about $3 million.
Figure 31 Imports of Fertilizer and Tractors, Quantities, and Volumes, 2002–2009
Source: Mokoro (2010).
Tractors Fertilizer Tractors Fertilizer
0
5,000
10,000
15,000
20,000
25,000
2004 2005 2006 2007 2008 2009
Tra
cto
r im
po
rts
(num
ber
)
0
20,000
40,000
60,000
80,000
100,000
120,000
140,000
160,000
180,000
200,000
Fer
tiliz
er im
po
rts
(to
ns)
0.0
5.0
10.0
15.0
20.0
25.0
30.0
35.0
40.0
45.0
50.0
2004 2005 2006 2007 2008 2009
Val
ue o
f im
po
rts
($ m
illio
n)
YearYear

Public Expenditure Review of the Rural Development Ministries 73
Limited information is available about the distribution of benefits from tax exemption. However, the CSES does include information on expenditure on fertilizer and on farm fuel, which is a good proxy for tractor use. Figure 32 shows that fertilizer expenditure is very high, compared with total household consumption expenditure (which excludes farm costs). It is particularly high among the lowest quartile of households. The figure suggests that the policy of duty exemption on fertilizer will lead to a proportionally higher benefit for poor households than rich households and to a reduction in inequality. However, in absolute terms, the poorest quartile consume only 7.6% of all fertilizer and the poorest half consume only 22.0% of all fertilizer, so nonpoor households benefit more than the poor in absolute terms. Expenditure on fuel is more even in comparison with household consumption expenditure, suggesting that the exemption of tractors from duty will have little impact on inequality in Cambodia. The analysis does not take into account household size.
The wider benefits associated with improved farm production and profitability arising from the use of fertilizer and tractors will be distributed in a roughly similar manner to the immediate benefits of lower prices.
2. Consistency of Public Expenditure with National Strategies
Resource allocation by government and donors is guided by the national strategic development plan, Strategy for Agriculture and Water, and the agriculture sector strategic development plan, all of which cover 2006–2010. Table 36 compares actual spending by government and donors with the guidelines presented in these strategic documents. The analysis is complicated by the fact that the agriculture sector strategic development plan and Strategy for Agriculture and Water include substantial allocations to food security, for which there is no single operational responsibility in the government.41
41 Some activities in the food security programs can be assigned to research, extension, and/or crop production. However, a large part of the agriculture sector strategic development plan is assigned to scaling up the National Program for Food Security and Poverty Alleviation, which supports community-based development, with no pre-assigned subsector allocations.
Figure 32 Incidence of Tax Expenditure
Sources: NIS (2007); Mokoro (2010).
0
10
20
30
Quartile 1 Quartile 2 Quartile 3 Quartile 4
Com
par
ed t
o to
tal h
ouse
hold
exp
end
iture
(%
)
Fertilizer expenditure Farm fuel expenditure

Rural Development for Cambodia74
Tabl
e 36
Co
mpa
rison
of A
ctua
l Spe
ndin
g w
ith th
e Ag
ricul
ture
Sec
tor S
trate
gic
Deve
lopm
ent P
lan,
Stra
tegy
for A
gric
ultu
re a
nd W
ater
, an
d Na
tiona
l Stra
tegi
c De
velo
pmen
t Pla
n
Stra
tegy
Inve
stm
ent
Cost
ing
Govt
. Cap
ital
Budg
et O
uttu
rnDo
nor E
xp.
Outtu
rnGo
vt. C
apita
l and
Do
nor O
uttu
rnNS
DP R
ecur
rent
Co
stin
gGo
vt. R
ecur
rent
Bu
dget
Out
turn
5 Ye
ars
3 Ye
arsa
2007
–200
920
07–2
009
2007
–200
9%
of 3
-yr
Stra
tegy
2006
–201
020
07–2
009
% o
f NSD
P Re
c.
ASSD
P Se
ctor
al G
oals
, 200
6–20
10
Rese
arch
ser
vices
388,
112
232,
867
57,2
00
57,2
00
24.6
Exte
nsio
n se
rvic
es40
,359
24
,215
10
,131
10
,131
41
.8
Mar
ket a
cces
s fo
r agr
icul
tura
l pro
duct
s26
,650
15
,990
87
,257
87
,257
54
5.7
Inst
itutio
nal a
nd le
gisl
ative
fram
ewor
k56
,061
33
,637
41
,958
41
,958
12
4.7
Fish
erie
s re
form
—su
stai
nabl
e ac
cess
57,4
53
34,4
72
34,0
89
34,0
89
98.9
Fore
stry
refo
rm16
,428
9,
857
40,8
62
40,8
62
414.
6
Tota
l MAF
F25
,874
15
,524
14
,528
14
,528
93
.6
SAW
Pro
gram
mes
, 200
6–20
10
Inst
itutio
nal c
apac
ity b
uild
ing
and
man
agem
ent
205,
350
123,
210
20,9
59
20,9
59
17.0
Agric
ultu
ral a
nd a
grib
usin
ess
supp
ort
205,
350
123,
210
49,3
95
49,3
95
40.1
A&W
rese
arch
, edu
catio
n, a
nd e
xten
sion
410,
700
246,
420
49,7
63
49,7
63
20.2
Wat
er re
sour
ce, i
rriga
tion,
and
land
man
agem
ent
410,
700
246,
420
337,
864
158,
313
496,
177
201.
4
Tota
l MAF
F/M
OWRA
M20
5,35
012
3,21
011
0,51
811
0,51
889
.7
NSDP
, 200
6–20
10
Agric
ultu
re–M
AFF/
MOW
RAM
1,43
7,45
086
2,47
035
2,59
144
4,33
779
6,92
892
.424
6,46
028
1,28
811
4.1
Rura
l Dev
elop
men
t–M
RD1,
437,
450
862,
470
248,
923
176,
845
425,
768
49.4
121,
260
57,
502
47.
4
ASSD
P =
Agr
icul
ture
Sec
tor S
trate
gic
Deve
lopm
ent P
lan;
Exp
. = E
xpen
ditu
re; g
ov’t
= g
over
nmen
t; M
AFF
= M
inis
try o
f Agr
icul
ture
, For
estry
and
Fis
herie
s; M
OWRA
M =
Min
istry
of W
ater
Res
ourc
es a
nd M
eteo
rolo
gy;
MRD
= M
inis
try o
f Rur
al D
evel
opm
ent;
NSDP
= N
atio
nal S
trate
gic
Deve
lopm
ent P
lan;
SAW
= S
trate
gy fo
r Agr
icul
ture
and
Wat
er.
a 60
% o
f 5 y
ear t
otal
.
Note
: AS
SDP
and
SAW
pro
gram
are
as e
xclu
de fo
od s
ecur
ity.
Sour
ces:
ASS
DP 2
006–
2010
, pp.
31–
32; S
AW 2
006–
2010
, p. 3
1; N
SDP
2006
–201
0, p
p. 8
7 an
d 11
0. C
ited
in M
okor
o (2
010)
.

Public Expenditure Review of the Rural Development Ministries 75
Table 36 suggests that the actual investment for rural roads rose to about 20% above the national strategic development plan costing share for rural development in 2008. In contrast, actual investment in MAFF and MOWRAM, combined, was about 40% below this costing. Recurrent allocations for all ministries were slightly below the national strategic development plan costing. Compared with Strategy for Agriculture and Water costing, actual outturn for investment in irrigation was slightly above in 2007 and substantially above in 2008. The actual outturn for research, extension, and education was over double the Strategy for Agriculture and Water costing in 2007 (largely as a result of the last year of the Cambodia–Australia Agricultural Extension Project [CAAEP] II42), and nearly 20% higher in 2008.
Compared with the agriculture sector strategic development plan costing, research was heavily underfunded, and extension was heavily overfunded. These comparisons demonstrate the large swings in expenditure that have taken place, both because of emerging government priorities and the effects of large donor projects. The relatively low share of costing assigned to extension by the agriculture sector strategic development plan and the Strategy for Agriculture and Water may reflect the more challenging conditions facing agriculture in 2005/06, before the demonstration of growth and the impact of world prices.
3. Public Expenditure Policy Options
As discussed previously, the recommendations for public expenditure reform closely follow that for private sector investment options in rural development, that is, more investment should be allocated to rural roads, irrigation infrastructure, and extension services. The major gaps not identified here refer to private sector property rights and improvement in PFM, fiduciary oversight of the budget execution process, business enabling environment, and finance sector intermediation.
Adjust capital to recurrent budget balance toward maintenance. For irrigation and rural roads, the present balance between recurrent and investment expenditure is not efficient. Rehabilitated roads are not receiving the lower-cost, routine maintenance needed to prevent premature rounds of expensive rehabilitation in the future. For irrigation, the optimal level of maintenance expenditure should be about one-third of total investment, and for rural roads, an average of 45% is required for periodic and routine maintenance combined. This level of maintenance should ensure that the next major rehabilitation is not required for at least 10 years. Table 37 illustrates the reassignment from investment to recurrent that is required to achieve optimum effectiveness from public expenditure.
Increase resource allocation to research and ex�tension. Government funding for research and extension is low, and these services are dependent on donor support. The government, NGOs, and the private sector all have roles to play in research and extension. In Cambodia, there is a strong demand and role for public research and extension activities. An increase in funding to research and extension under the government budget could be matched by budget-style support from a group of donors that provides clearer
42 CAAEP II was the AusAID-funded Cambodia–Australia Agricultural Extension Project Phase 2.
Table 37 Actual and Optimal Balance between Recurrent and Investment Expenditures (KR million)
Irrigation Rural Roads
Actual 2009 Optimal Actual 2009 Optimal
Recurrent 31,352 79,137 25,503 99,562
Investment 208,459 158,275 195,747 121,687
Total 239,811 239,811 221,250 221,250
Source: Mokoro (2010).

Rural Development for Cambodia76
continuity. The financial support from donors should not exceed 40% of total funding. Greater cooperation and complementarity among research, extension, crop production, and agribusiness is required for this support to be effective.
Prepare for climate change. Recent analytical work on climate change for the Vulnerability and Adaptability Assessment suggests that trends in rainfall will be complex, with a general decrease in the dry season and mixed patterns in the wet season (Mokoro 2010). In most places, the growing season will shorten, at least over the next 50 years, and there is some evidence that droughts will increase and floods will decrease in the northern part of the country, while the opposite will happen in the south. These changing conditions increase the importance of having strong research and extension services.
Ensure the effectiveness of irrigation investment. There is an important choice to be made between effectiveness and equity in irrigation. Currently, the government capital budget is used to rehabilitate only primary infrastructure on irrigation schemes to allow scarce capital funds to be spread over more schemes. However, this practice undermines the effectiveness of the investments, since the benefits for farmers and the economy derived from the investment are substantially reduced and delayed.
Support the seed industry. Improved seeds have played a strong role in the success of Cambodia’s agriculture in the last decade. There is currently a healthy balance between public and private sector activity in seed research, multiplication, and marketing, but there is still inadequate private sector activity in seed multiplication and formation of distribution networks. Public funds should be used to provide more support to the seed sector, without disturbing this balance. Including supporting investment in the AQIP Seed Company.43
Promote increased competition in rice marketing and ex�ports. It appears that farmers have received a small share of the benefits of recent increased world rice prices. Official and unofficial public intervention in export markets has contributed to this, along with a lack of trading competition and milling capacity in Cambodia. Greater transparency and government support for competition in export marketing would help ensure that Cambodia receives a fairer share of the increased export incentives that appear likely to be a permanent feature of world markets.
Investigate the economic viability of new technologies for rural road construction. Rural roads have provided positive economic returns and have consistently been ranked a top priority for public expenditure by rural communities. Because of extensive rehabilitation, the proportion of rural roads in good condition may now be more than 50%. However, the declining reserves of gravel mean that the costs of road rehabilitation are increasing faster than construction costs. There are new technologies that could sustain the progress in rural roads, and the government could invest in promoting skills in these technologies.
Increase public ex�penditure in agriculture. The analysis suggests that about one-quarter of growth in rice production over the last decade has occurred as a result of public expenditure. Through much of this period, the cost–benefit ratio from public expenditure in extension, irrigation, and rural roads has been below 2.0; therefore, it has been difficult to justify increased public expenditure in these subsectors. However, the jump in world food prices in 2008 will be sustained, and Cambodian farmers will eventually receive a better share of the improved incentives arising from this. Improved food prices could double the cost–benefit ratio of public expenditure in agriculture. As a result, extension, irrigation, and rural roads will jump from being relatively modest performers to become one of the most effective subsectors of public expenditure and should receive a higher share of total government expenditure (Table 38).
43 The AQIP Seed Company was founded under the AusAID-funded Agricultural Quality Improvement Project (AQIP).
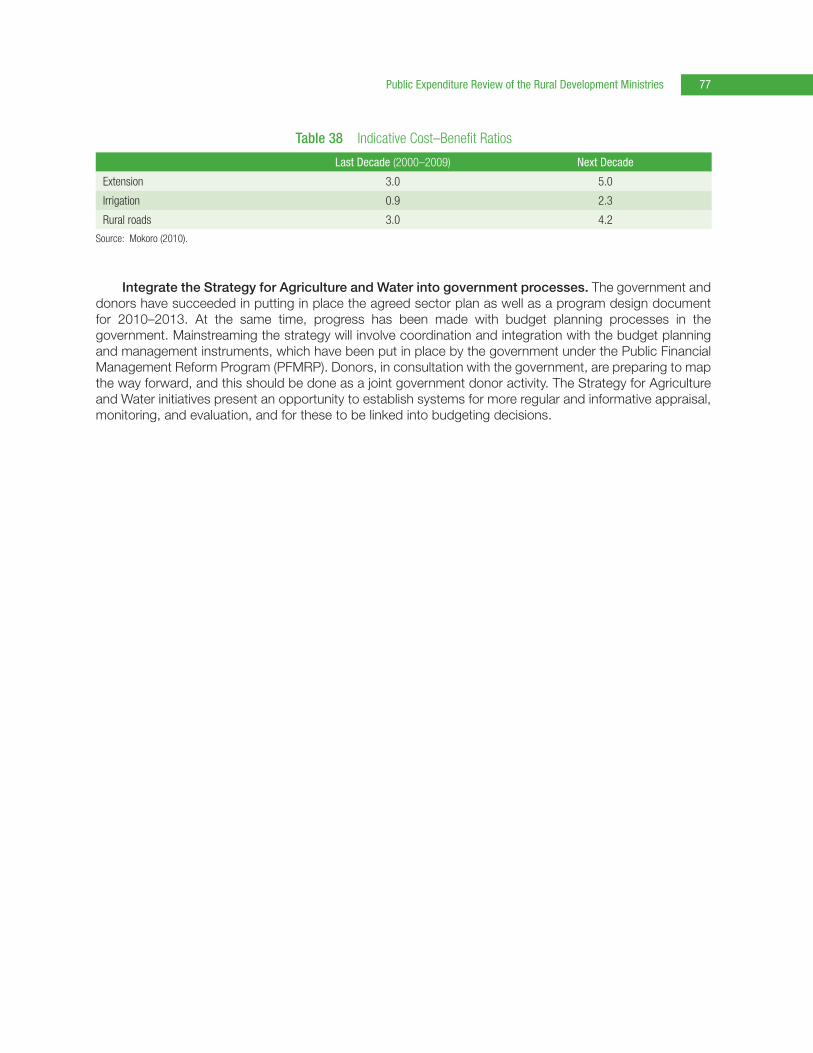
Public Expenditure Review of the Rural Development Ministries 77
Integrate the Strategy for Agriculture and Water into government processes. The government and donors have succeeded in putting in place the agreed sector plan as well as a program design document for 2010–2013. At the same time, progress has been made with budget planning processes in the government. Mainstreaming the strategy will involve coordination and integration with the budget planning and management instruments, which have been put in place by the government under the Public Financial Management Reform Program (PFMRP). Donors, in consultation with the government, are preparing to map the way forward, and this should be done as a joint government donor activity. The Strategy for Agriculture and Water initiatives present an opportunity to establish systems for more regular and informative appraisal, monitoring, and evaluation, and for these to be linked into budgeting decisions.
Table 38 Indicative Cost–Benefit Ratios
Last Decade (2000–2009) Next Decade
Extension 3.0 5.0
Irrigation 0.9 2.3
Rural roads 3.0 4.2
Source: Mokoro (2010).

78
V. Governance, Competitiveness, and Institutional Issues in Rural Development
A. Governance Issues
Many studies have indicated that poor governance is a major concern for Cambodia, seriously affecting appropriability for private investors, and is a critical constraint to investment and growth. Most research has concentrated on governance at the national level, but the International Finance Corporation and the Asian Foundation (2007), for example, have carried out provincial-level analysis, showing local issues impacting rural business and agribusiness operations.
The prevalence of informal fees may not rank as first- or second-order constraints in the agriculture sector but constitute the primary binding constraint to growth of rural businesses. Large agribusiness companies have found that commercial returns to both manufacturers and traders can be attractive if (i) commercial barriers are sufficiently reduced to compensate for the high informal fees, (ii) protection from excessive fees is secured in exchange for the exclusive right to operate, or (iii) production occurs higher up the value chain to cushion against high fees. However, the majority of smaller agribusiness companies do not have such options.
Even for rural companies already operating, the high uncertainty and seemingly arbitrary nature of these fees make it impossible to plan activities, and therefore impossible to finance any expansion. Productivity-enhancing investments are not made, keeping small processors small and larger processors few in number. As has been well documented in previous studies, informal payments for licensing, securing access to domestic markets, trade facilitation, and carrying out economic activities in general is frequent (82% of responding firms) and substantial (5% of sales) (World Bank 2006). Worst of all, those charged with law enforcement, such as police, customs agents, and regulators, are often the same people involved in extracting rents.
Governance outcomes collected by Kaufmann et al. (2008) indicated that, for most years that the study covered, Cambodia scored poorly compared to other East Asian countries, although in some indicators, small gains were made in ranking levels (Figure 33).
On individual governance aspects, the shifting pattern across countries becomes apparent, particularly in the last few years. For corruption, Thailand has remained above other East Asian countries, particularly Cambodia, which remains at the bottom along with Myanmar. In terms of stability, Viet Nam rates the highest, consistently doing better than the 50th percentile. Cambodia has increased its ranking in this regard, particularly relative to 1996.
While Cambodia has done well on aspects such as political stability, other indicators are less than optimistic. While remaining below other countries’ rankings, Cambodia has had varied success in increasing voice and accountability since 1996 and remains locked into the 20th–25th percentile. Similarly, government effectiveness has been varied over time and, despite an upturn in rankings since 2006, remains depressingly low. Rankings on the rule of law have increased steadily from a low in 2004, but remain much lower than Cambodia’s peak ranking of being in the bottom 18% of the world in 2000.
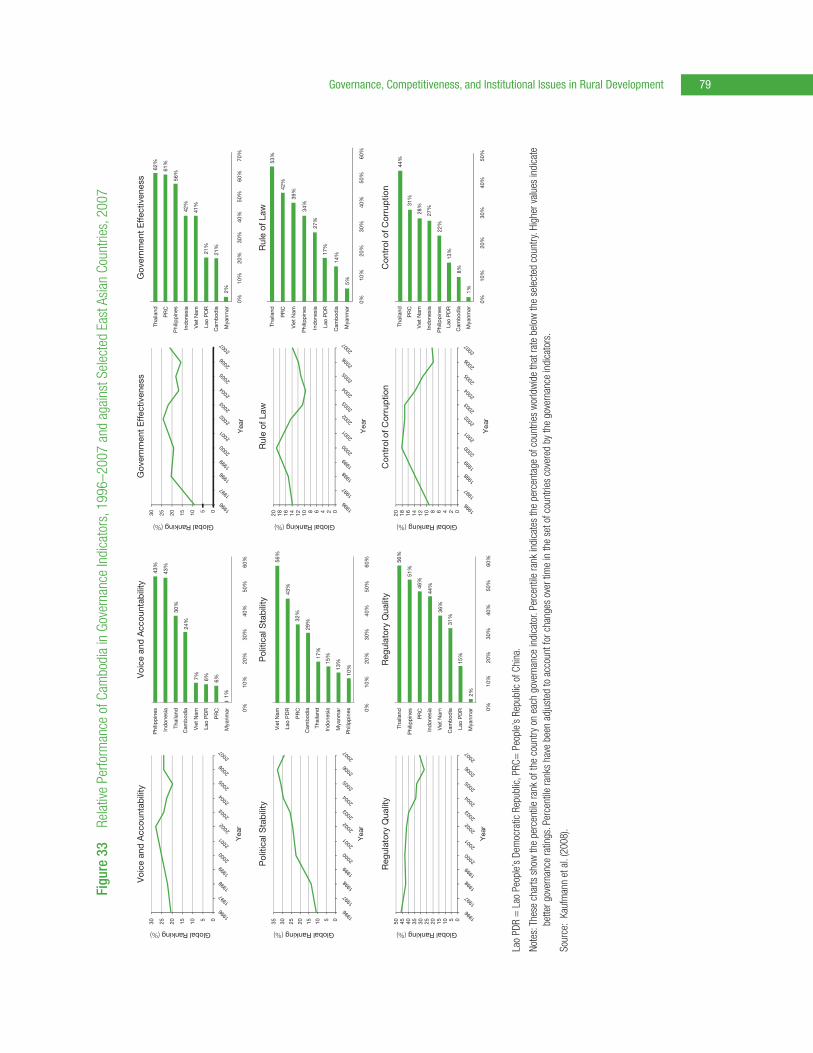
Governance, Competitiveness, and Institutional Issues in Rural Development 79
Figu
re 3
3 Re
lativ
e Pe
rform
ance
of C
ambo
dia
in G
over
nanc
e In
dica
tors
, 199
6–20
07 a
nd a
gain
st S
elec
ted
East
Asi
an C
ount
ries,
200
7
Lao
PDR
= L
ao P
eopl
e’s
Dem
ocra
tic R
epub
lic, P
RC=
Peo
ple’
s Re
publ
ic o
f Chi
na.
Note
s: T
hese
cha
rts s
how
the
perc
entil
e ra
nk o
f the
cou
ntry
on
each
gov
erna
nce
indi
cato
r. Pe
rcen
tile
rank
indi
cate
s th
e pe
rcen
tage
of c
ount
ries
wor
ldw
ide
that
rate
bel
ow th
e se
lect
ed c
ount
ry. H
ighe
r val
ues
indi
cate
be
tter g
over
nanc
e ra
tings
. Per
cent
ile ra
nks
have
bee
n ad
just
ed to
acc
ount
for c
hang
es o
ver t
ime
in th
e se
t of c
ount
ries
cove
red
by th
e go
vern
ance
indi
cato
rs.
Sour
ce:
Kauf
man
n et
al.
(200
8).
051015202530
Ind
ones
ia
Ind
ones
ia
Thai
land
Vie
t N
am
Vie
t N
am
Vie
t N
am
Lao
PD
R
Lao
PD
R
PR
C
Mya
nmar
Mya
nmar
1%
56%
43%
32%
29%
17%
15%
10%13
%
6%7%
24%
30%
43%
43%
6%
Global Ranking (%)
Yea
r
Voi
ce a
nd A
ccou
ntab
ility
Voi
ce a
nd A
ccou
ntab
ility
051015202530
Global Ranking (%)
Yea
r
05101520253035
Global Ranking (%)
Yea
r
Pol
itica
l Sta
bili
tyP
oliti
cal S
tab
ility
02468101214161820
Global Ranking (%)
Yea
r
Rul
e of
Law
Rul
e of
Law
05101520253035404550
Global Ranking (%)
Yea
r
Reg
ulat
ory
Qua
lity
Reg
ulat
ory
Qua
lity
024681
01
21
41
61
82
0
Global Ranking (%)
Yea
r
Con
trol
of C
orru
ptio
n
1%
8%
13%
22%
27%
28%31
%
44%
Con
trol
of C
orru
ptio
n
Gov
ernm
ent
Eff
ectiv
enes
sG
over
nmen
t E
ffec
tiven
ess
1996
1997
1998
1999
2000
2001
2002
2003
2004
2005
2006
2007
1996
1997
1998
1999
2000
2001
2002
2003
2004
2005
2006
2007
1996
1997
1998
1999
2000
2001
2002
2003
2004
2005
2006
2007
1996
1997
1998
1999
2000
2001
2002
2003
2004
2005
2006
2007
1996
1997
1998
1999
2000
2001
2002
2003
2004
2005
2006
2007
1996
1997
1998
1999
2000
2001
2002
2003
2004
2005
2006
2007
Phi
lipp
ines
Phi
lipp
ines
Phi
lipp
ines
PR
C
Cam
bod
ia
Cam
bod
ia
Thai
land
Ind
ones
ia
Vie
t N
am
Mya
nmar
56%
51%
46%
44%
36%
31%
2%
15%
0%10
%20
%30
%40
%50
%60
%0%
10%
20%
30%
40%
50%
0%10
%20
%30
%40
%50
%60
%
0%10
%20
%30
%40
%50
%60
%
PR
C
Cam
bod
ia
Lao
PD
R
Thai
land
Phi
lipp
ines
Ind
ones
ia
Vie
t N
am
Mya
nmar
PR
C
Cam
bod
ia
Lao
PD
R
Thai
land
2%
21%
21%
41%
42%
56%
61%
62%
0%10
%20
%30
%40
%50
%60
%70
%
Phi
lipp
ines
Ind
ones
ia
Vie
t N
am
Mya
nmar
PR
C
Cam
bod
ia
Lao
PD
R
Thai
land
5%
14%17
%
27%
34%
39%
42%
53%
0%10
%20
%30
%40
%50
%60
%
Phi
lipp
ines
Ind
ones
ia
Vie
t N
am
Mya
nmar
PR
C
Cam
bod
ia
Lao
PD
R
Thai
land

Rural Development for Cambodia80
Despite attempts to improve private entrepreneurship and reduce poverty, Cambodia has backtracked regarding regulatory quality and control of corruption. Findings of studies based on regression analysis are that corruption, political instability, and weak rule of law have negative effects on investment (ADB 2007a). More generally, the perception of worsening corruption figures into the investment rate, partly explaining the low levels of investment. This effect is mediated largely through lending rates, which reflect a premium for worsening corruption, regulatory quality, and the rule of law. It thus becomes evident that poor governance weakens the appropriability of returns from investments and, in the long run, contributes to low-level real per capita gross domestic product (GDP).
Governance issues are linked to other major constraints on growth. The thin fiscal buffer is due to continued inefficiencies in administering revenue collection and compliance. Despite government efforts in improving tax administration, the tax leakage remains huge. Governance issues (both in terms of bureaucratic ineffectiveness and leaks) have perennially plagued the government’s fiscal position, leading to low levels of spending on infrastructure and social services.
The Rectangular Strategy and national strategic development plan have underlined the need to improve the governance environment through effective implementation of the governance action plans I and II.44
These plans stress five crosscutting reform areas: (i) administrative reform and anticorruption; (ii) legal and judicial reform; (iii) decentralization, deconcentration, and police affairs reform; (iv) economic and finance reform; and (v) social development (including poverty reduction, food security, education, health, and rural development). They also emphasize reforms in three sectors: (i) the armed forces, (ii) land policy, and (iii) natural resources management. The government is aware that implementation will be a challenge, as will the time required to develop new institutional capacities and competencies. Accountability institutions must take time to fully develop.
The government has made major progress toward establishing accountability and oversight mechanisms. The Law on Audit was adopted in 2000, and the National Audit Authority was set up in 2002 as the supreme audit institution in Cambodia. Internal audit departments have been established in 36 line ministries and agencies, and more timely audits have begun to enhance budgetary accountability. The Law on Access to Public Information is under preparation, and considerable efforts have been made to involve the population in local service delivery and to participate in policy deliberations. A law guaranteeing press freedom has been adopted, and the media regularly reports incidents of corruption and other public policy issues. The institutions working as corruption watchdogs, such as the Anti-Corruption Unit in the Council of Ministers, the Ministry of National Assembly Relations and Inspections, and the Anti-Corruption Working Group, have been restructured and strengthened.45 Cambodia also joined the ADB–Organisation for Economic Co-operation and Development Anti-Corruption Initiative and Action Plan for Asia and the Pacific in 2003. It is one of the countries that have adopted the United Nations Convention against Corruption, and is a signatory to the Memorandum of Understanding on Preventing and Combating Corruption. The recent adoption of the Anti-Corruption Law is a significant milestone, and its legal framework has improved with the passage of the law in March 2010.
Improvements in public financial management (PFM), public administration reforms, and decentralization and deconcentration reforms are also key governance initiatives. One of the thrusts of the government’s strategy for good governance is public administration reforms, including attractive pay and other incentives for the civil service, which have a strong link with PFM that entail probity and higher-level commitments. The Council of Administrative Reforms has undertaken several initiatives in this regard. Further, the government
44 In 2001, the government approved the Governance Action Plan I to promote multisector and cross-sector governance reforms. On the basis of experience gained, a second plan was formulated in 2005 and is under implementation.
45 In August 2006, the Anti-Corruption Unit was restructured, and the Corruption Complaint Office was created with the aim of enhancing public participation in the supply and receipt of corruption-related information.
Governance, Competitiveness, and Institutional Issues in Rural Development 81
has embarked on a series of reform measures fostering decentralization to help improve service delivery, bolster accountability, and encourage popular participation in the development process. The government’s policy and program of decentralization is also seen as a key initiative to contributing to peace and stability.
B. The Business-Enabling Environment and Competitiveness
The business-enabling environment refers to the institutions, laws, and regulations that determine the cost of doing business and the ability of businesses to compete in both domestic and international markets. Ease of entry and exit of firms, free and open access to information about markets and regulations, access to input markets, and protection of property are a few of the critical factors in a functioning enabling environment.
The business-enabling environment in Cambodia is weak, yet rural businesses have adapted to constraints. Many businesses prefer to remain small and informal to avoid bureaucratic scrutiny, severely restricting business growth, fiscal revenue, and economic development.
Compared with its regional neighbors, Cambodia performs badly in global competitiveness rankings, consistently scoring over 100 out of 131 countries in business competitiveness, sophistication of company operations, and quality of the national business environment (Figure 34). High transaction costs caused by expensive, time-consuming, and complex regulations are linked to high levels of informality, high rates of under- and unemployment, lack of investment, and inability of enterprises to compete with imports or more broadly in the global market. Meanwhile, lack of meaningful regulations on quality standards—which would enable producers to obtain higher prices—excludes enterprises from important markets and results in competition based on cost.
The business-enabling environment is poor compared with regional neighbors, and the environment is not improving relative to other countries. The World Bank’s Doing Business report measures the time and cost to start, run, and close a business in Cambodia, based on the assumption of a limited liability company. The results for Cambodia are shown in Table 39. There were no improvements in the cost of starting a business and dealing with licenses from 2007 to 2010, but because limited liability companies are rare in Cambodia, the results refer to only a very small percentage of Cambodian firms. The time and cost to start a business can vary widely in Cambodia, depending on whether the business is registered through the Ministry of Commerce46 as captured by the World Bank report or through the Council for the Development of Cambodia (CDC), which is able to facilitate business registration much more quickly for investments over $2 million. Lastly, it is important to note that the costs of doing business still remain far higher in Cambodia than in other countries of the region and the world. Overall, Cambodia ranks 145th out of 183 economies.
Provinces vary regarding their business-enabling environments, which is reflective of their economic performance. A Cambodia-specific index, the Provincial Business Environment Scorecard, was prepared for Cambodia in late 2008 (IFC-MPDF and Asia Foundation 2007) and updated in 2009. Although Cambodia is not a highly decentralized country, large differences in the business climates and perceptions on the ease of doing business were measured. In 2007, Kampong Cham was the strongest performer on the scale, while Sihanoukville was found to have the least-supportive business environment (Table 40). In 2009, the situation was dramatically different, with Sihanoukville rising to fifth place and Phnom Penh ranking last (Figure 35). Such geographical and temporal variations in policy implementation must be factored into donor and government interventions.
46 It costs around $1,000 a year before 2007 to register a new business at the national level through the Ministry of Commerce, which includes both official and unofficial charges for both the ministry and the Tax Department. The time taken to complete the necessary paperwork is extremely rapid (overnight), while the actual processing time takes 2–4 weeks, depending on the workload of the registration department. According to the Ministry of Commerce and ADB (2008), the official fee is KR420,000 ($105.00) for the ministry, and KR119,000 ($29.75) for the Tax Department.

Rural Development for Cambodia82
Figure 34 Relative Performance of Cambodia in Global Competitiveness Indicators against Selected East Asian Countries, 2007–2008
PRC = People’s Republic of China.
Source: WEF (2008).
114
57
36
21
76
106
54
23
20
4666
3637
79
114
57
40
22
73
36
78
0 20 40 60 80 100 120
0 20 40 60 80 100 120 140
Global Competitiveness Rankings, 2007–2008
Efficiency Enhancers for Competitiveness Innovation and Sophisticationfor Competitiveness
Basic Requirements for Competitiveness
Quality of the national business environment
Sophistication of company operations and strategy
Quality of the national business environment
Health and primary education
Infrastructure
Total
Macroeconomic stability
Global RankingGlobal Ranking
Global Ranking
Global Ranking
Institutions
0 20 40 60 80 100 120
Cambodia
PRC
Indonesia
Malaysia
Philippines
Thailand
Viet Nam
Cambodia
PRC
Indonesia
Malaysia
Philippines
Thailand
Viet Nam
Total
Technological readiness
Goods market efficiency Total Business sophistication Innovation
Market size
Financial market efficiency
Higher education and training
0 20 40 60 80 100 120
Cambodia
PRC
Indonesia
Malaysia
Philippines
Thailand
Viet Nam
Cambodia
PRC
Indonesia
Malaysia
Philippines
Thailand
Viet Nam
Taxation rates are not perceived to be inhibiting businesses; however, tax compliance and procedures are major costs to business. Of firms responding to the World Bank Enterprise Survey, only 18.6% considered the high tax rate as a major or severe constraint to doing business in Cambodia (Figure 36). This is also apparent from a comparison of the tax rates, which shows that the tax rate in Cambodia is the second-lowest among comparable East Asian neighbors. Similarly, tax administration was only perceived by 20.67% of respondents as being a major constraint, the third-lowest among Cambodia’s regional neighbors. This result is confirmed by the results of the World Bank Doing Business Survey shown in Table 39, where Cambodia was ranked 21st in the world for ease of paying taxes and is substantially better than its neighbors in the regulatory burden of tax. From this information, it is clear that tax itself is not a binding constraint.

Governance, Competitiveness, and Institutional Issues in Rural Development 83
Table 39 Business Environment in Cambodia Compared with Regional Competitors
Cambodia Thailand Malaysia Indonesia Philippines Lao PDR
Ease of... 2007 2008 2009 2010 2010 2010 2010 2010 2010
Doing business 146 150 135 145 12 23 122 144 167
Starting a business 164 163 169 173 55 88 161 162 89
Dealing with licenses 145 144 147 145 13 109 61 111 115
Employing workers 135 133 134 134 52 61 149 115 107
Registering property 98 102 108 116 6 86 95 102 161
Getting credit 177 180 68 87 71 1 113 127 150
Protecting investors 62 66 70 73 12 4 41 132 182
Paying taxes 21 22 24 58 88 24 127 135 113
Trading across borders 136 144 122 127 12 35 45 68 168
Enforcing contracts 134 135 136 141 24 59 146 118 111
Closing a business 178 181 181 183 48 57 142 153 183
Lao PDR = Lao People’s Democratic Republic.
Note: Rank out of 183 economies in 2012.
Sources: IFC and World Bank. http://www.doingbusiness.org
Table 40 Provincial Business Environment Scorecard, 2007
Province Entry CostsProperty Rights Transparency Participation Time Costs
Kampong Cham 8.95 8.62 7.29 7.48 8.18
Svay Rieng 8.08 6.74 4.56 3.56 6.72
Kampong Chhnang 7.20 8.52 4.32 3.28 8.10
Kampot 5.49 6.31 3.68 4.24 5.86
Kandal 7.49 8.04 5.08 2.08 7.57
Battambang 6.50 8.23 6.16 4.12 1.67
Banteay Meanchey 4.13 5.40 4.50 6.40 8.00
Phnom Penh 4.33 6.65 5.13 2.95 7.02
Siem Reap 3.40 5.73 4.16 7.46 6.10
Sihanoukville 6.41 6.08 5.72 1.84 6.25
ProvinceInformal Charges
Crime Prevention Tax Proactivity
Dispute Resolution Score
Kampong Cham 5.86 7.89 6.57 5.96 6.11 40.52
Svay Rieng 5.22 8.59 6.38 8.33 5.96 29.66
Kampong Chhnang 6.30 6.87 8.43 3.92 4.73 31.42
Kampot 5.66 7.64 7.77 7.58 6.94 25.58
Kandal 4.54 5.75 6.01 5.02 5.98 30.26
Battambang 7.30 6.29 4.34 5.23 6.62 26.68
Banteay Meanchey 5.23 6.62 5.71 4.39 5.97 28.43
Phnom Penh 4.58 2.70 3.88 4.77 7.36 26.08
Siem Reap 5.87 3.65 3.74 1.70 7.11 26.85
Sihanoukville 6.40 4.09 4.60 1.96 4.46 26.30
Source: IFC-MPDF and Asia Foundation (2007).

Rural Development for Cambodia84
Cumbersome processes and rules tend to induce firms to engage in corrupt practices to avoid bureaucratic red tape. Surveys of businesses in Cambodia indicate that the red tape associated with starting and operating a business is considered a constraint. According to the World Bank Doing Business survey, in 2009, Cambodia ranked 135th out of 181 economies on the ease of doing business, 169 for starting a business, 147 for dealing with licenses, and 136 for enforcing contracts (Table 39). These constraints manifest themselves in businesses trying to circumvent the problems by remaining in the informal economy as much as possible.
The poor business-enabling environment is not conducive to formalization and thus is a constraint to business growth. As identified in the Provincial Business Environment Scorecard (IFC-MPDF and Asia Foundation 2007), the five levels of formalization identifiable in the Cambodian business context are (i) fully formal, national level; (ii) fully formal, provincial level; (iii) unregistered with an operating license; (iv) possession of patent tax; and (v) fully informal.
In most rural activities, the relatively unsophisticated nature of production, trading, and value added means that firms are extremely small and often comprise just family businesses. In this case, registration for value-added tax purposes is unlikely, and most will just have a patent tax registration. In most sectors of the economy, particularly across the agriculture and rural sectors, the business-enabling environment is similar. Agribusiness firms and rural small and medium-sized enterprises (SMEs) mainly operate in the informal economy, preferring not to be registered lest they attract the attention of the authorities and have additional regulatory burdens and tax burdens placed on them.
Figure 35 Provincial Business Environment Scorecard, 2009
Source: IFC and Asia Foundation (2009).
0 10 20 30
2009 Provincial Business Environment Score
KampotKoh Kong
Ratanak KiriSihanoukville
Odor MeancheyPursat
Kampong ChhnangPrey Veng
Kampong ThomPreah Vihear
KepSvay RiengSiem Reap
PailinKampong Speu
Stung TrengMondul Kiri
KandalTakeo
Banteay MeancheyBattambang
KratiePhnom Penh
Kampong Cham 65.3064.1464.1063.8163.80
62.9262.51
61.6760.8160.6160.3560.2159.4359.2558.68
58.5958.3057.5457.0857.0756.60
55.7648.31
63.33
40 50 60 70 80 90 100

Governance, Competitiveness, and Institutional Issues in Rural Development 85
Figure 36 Relative Performance of Cambodia in Tax Administration and Tax Rate Indicators against Selected East Asian Countries (% of firms identifying major constraints)
Lao PDR = Lao People’s Democratic Republic.
Source: IFC and World Bank. http://www.enterprisesurveys.org
1.85
18.62
21.68
22.04
24.50
29.45
30.38
36.80
65.58
4.61
20.67
13.26
19.92
22.31
23.00
25.15
26.67
51.09
0 10 20 30
%
40 50 60 70
Viet Nam
Cambodia
Malaysia
Lao PDR
Thailand
Indonesia
Philippines
People’s Republicof China
Mongolia
Tax administration Tax rates
Apart from the general business-enabling environment affecting all firms in Cambodia, two specific issues are of relevance to the agriculture sector—formalization of businesses and export procedures. Unless businesses are formalized, they are unlikely to be able to access formal sources of finance, even if they have sufficient collateral. Formalization brings on its own problems, particularly the unwanted attention of regulatory authorities including the tax department. Hence, despite the benefits of registration, the costs invariably outweigh the benefits, and most firms prefer to remain in the informal sector as much as possible.
Second, export procedures are complex and time-consuming, and require a formalized company structure in the case of formal exports through Sihanoukville Port. In addition to the additional costs of transport to Sihanoukville, the costs associated with formal export channels are much higher than informal exports through Viet Nam’s Saigon Port. Exports through Sihanoukville Port require extensive paperwork, including evidence of value-added tax and export duties being paid. The additional transport costs of getting the goods to Sihanoukville, as well as the taxes that are required to be paid, make the informal cross-border trade much more attractive.47
The International Finance Corporation and Ministry of Commerce (2008) developed a comprehensive handbook on export procedures for SMEs that details what is required for each of the export border
47 In 2007, to meet export paperwork requirements, there were six signatures and three stamps required on various pieces of paper: certificate of origin, inspection certificate (customs and excise, Camcontrol, and transporter), customs declaration, factory invoice, packing list, and customs clearance form. The cost of clearing a single container for import was $879.00, plus $655.00 for export. When the cost of transport was included, this export cost increased to $1,044.00 per 20-foot container, or $57.12 per ton (JDI et al. 2007).
Rural Development for Cambodia86
crossings. Once this handbook obtains wide readership, SMEs will be better able to obtain a smoother exporting experience.
Milling and processing is the main example of value-added activities in the agriculture and rural sectors. The relatively visible nature of these operations makes millers and processors more likely to be at least registered at the provincial level, although tax obligations are a matter of negotiations with the local tax office. Traders are less likely to be registered, particularly those dealing with smaller amounts of volume. Rice millers and traders tend to underreport by around one-half the annual volumes of their sales to minimize their tax burdens48 (Chandarrot et al. 2006; DAI et al. 2008). As an example of this, Chandarrot et al. (2006) cited a rice miller from Kampong Cham who openly admits to undervaluing his revenue so as to reduce his tax burden.
For those involved in cross-border trade, the prevalence of cash transactions means that registration as businesses in the formal sector is unlikely, as it will also attract unwanted attention of the provincial and tax authorities. Traders in rural areas either registered at the provincial level or are unregistered, while export traders are most often unregistered, but need to be registered at the national level because of their exporting business. Interviews with export traders indicated a general desire to have the benefits of formal registration (i.e., the ability to receive bank transfers from their buyers in Viet Nam without any questions being raised as to where the money was coming from), but this was balanced with their reluctance to enter the real regime and having to pay turnover and value-added taxes on their sales. This means that for those traders who are formally registered, they receive bank transfers on part of their consignments (for those buyers who prefer to pay through the banking system), and cash payments for the other part of their consignments. Thus, they only have to declare tax on part of their sales.
In all rural sectors, the weaknesses in the business-enabling environment are such that firms will continue to operate in the informal economy and continue to export unprocessed commodities to neighboring countries in the foreseeable future. This constrains the opportunities for value addition in the agriculture sector and limits the set of possible interventions available to the government.
C. Policy and Institutional Issues
Policy inadequacies and slow implementation of the reform process are of particular concern since they set the environment for accelerated agricultural growth and poverty reduction. Critical issues include (i) absence of subdecrees and supporting legislation to the 2001 Land Law; (ii) weak capacity to implement the new Water Law and forestry subdecrees, and inadequate fishery sector reform; (iii) lack of incentive for improved resources management and increased private sector participation, and weak support for smallholders and agribusinesses; (iv) lack of trade and biosecurity policy reforms to enhance competitive and comparative advantage of exports; and (v) inadequate fiscal allocation for investment in social and physical infrastructures and public works (Alamgir 2008).
Over the past decade, the government has articulated many policy and strategy statements, legislated laws, and issued decrees and subdecrees. Many of the reform measures have taken longer than anticipated, gotten diluted in the process, or events have overtaken legislation. Many laws are not operational without subdecrees and supporting legislation (Alamgir 2008).
The institutional setting of the agriculture and water sectors are complex. Although the lead government agencies are the Ministry of Agriculture, Forestry and Fisheries (MAFF) and the Ministry of Water Resources
48 This is indicative of businesses’ adaptation to prevailing constraints and why the results of perception surveys may underreport how Business Enabling Environment constraints are binding; see, for example, IFC-MPDF and Asia Foundation (2007).

Governance, Competitiveness, and Institutional Issues in Rural Development 87
and Meteorology (MOWRAM), several other ministries are involved such as the Ministry of Commerce, Ministry of Land Management, Ministry of Rural Development (MRD), and Ministry of Urban Planning and Construction (Table 41). Others, such as the MEF and the Cambodia National Mekong Committee, have a less direct but important interest.49 Because of the link of agriculture and water to rural affairs, other stakeholders include provincial and subprovincial administrations, community-based organizations, and nongovernment organizations (NGOs).
The roles, responsibility, and organization of MAFF were established by the Council of Ministers Subdecree No. 18 (2 October 1984) and have been subsequently amended several times by Subdecree No. 17 (7 April 2000), Subdecree No. 105 (22 August 2005), and Subdecree No. 188 (14 November 2008). The current organizational structure of MAFF is new (from November 2008) and is presented in Figure 37.
MOWRAM is the dominant water sector ministry with overall legal responsibility for the development and management of water resources. MOWRAM was established in 1999, although it was developed from an agency that performed some of its current mandate. The structure of MOWRAM is shown in Figure 38. MOWRAM has two main divisions, headed by a director-general of administrative affairs and a director-general of technical affairs. Under administrative affairs are four departments: administration and human resources, planning and international cooperation, finance, and the technical service center for irrigation and meteorology. Under technical affairs are seven departments: water management and conservation, hydrology and river works, meteorology, irrigated agriculture, water supply and sanitation, and engineering. The seventh—community water user development—is recent and offices under this department are still being developed.
49 The Cambodia National Mekong Committee coordinates the involvement of the government with the Mekong River Commission and manages some elements of projects under the commission, but does not have a management role. The coordination arrangements between the Cambodia National Mekong Committee, MOWRAM, and MAFF are relevant to the performance of the water sector, as is the significance of such programs to water resources management in Cambodia.
Table 41 Government Organizations with Agriculture and Water Management Roles
Organization Major Roles
Ministry of Agriculture, Forestry, and Fisheries
Agriculture-related functions such as support for dryland agriculture; upland and lowland crops; rice production and marketing; and agricultural support services including research, extension, and education
Water resources-related functions such as support for irrigated agriculture, fisheries development, and forest and catchment programs
Reports to the minister for Agriculture, Forestry and Fisheries
Ministry of Water Resources and Meteorology
Development and management of all water resources according to the Law on Water Management (2007)
Reports to the minister for Water Resources and Meteorology
Cambodia National Mekong Committee
Undertakes liaison between the government and the Mekong River Commission and facilitates programs of the Mekong River Commission
Reports to the minister for Water Resources and Meteorology
Ministry of the Environment
Responsible for the protection of the water environment and regulation of pollution, including discharges into water bodies
Reports to the ministers for Environment and Water Resources and Meteorology
National Committee for Disaster Management
Flood and drought included among disasters for which the committee provides support programs and organizes response to events
Source: Taylor (2009).

Rural Development for Cambodia88
Figure 37 Organogram for the Ministry of Agriculture, Forestry and Fisheries, 2009
CARDI = Cambodian Agricultural Research and Development Institute, Dept. = department, HRD = human resource development, NSAKC = Kampong Cham National School of Agriculture, NSAPL = National School of Agriculture Prek Leap, RUA = Royal University of Agriculture, SPS = sanitary and phytosanitary measures.
Source: MAFF. 2009. Subdecree No. 188, 14 November 2008.
Minister
Secretary of State
Under Secretary of StateCabinet Advisor/
Office
General Secretariat
GeneralDirectorate of
Ministry
Dept. ofAdministrative
Affairs
Dept. of Accountingand Finance
Dept. of AgriculturalLegislation
Dept. of Planningand Statistics
Dept. of Personneland HRD
Dept. of InternalAudit
Dept. of InternationalCooperation
Agricultural Information and Documentation
Center
Dept. ofAgro-Industry
Dept. ofAnimal Health
ForestryAdministration
Dept. ofAdministration,Planning and
Finance
Dept. ofForestry and
Community Forestry
Dept. of Wildlifeand Bio-diversity
Dept. of Legislationand Law
Enforcement
Dept. of ForestIndustry andInternationalCooperation
Research Institute of Forestry and
Wildlife Conservation
FisheriesAdministration
Dept. of FinancialPlanning andInternationalCooperation
Dept. of AquacultureDevelopment
Dept. of FisheriesAffairs
Dept. of FisheriesCommunity
Development
Dept. of TechnicalProcessing and
Quality
Dept. of FisheriesConservation
Research Instituteand Fresh Water
FisheriesDevelopment
Research Instituteand MarineFisheries
Development
GeneralDirectorate of
Agriculture
Dept. of Administration,Finance andInternationalCooperation
Dept. of Rice Crop
Dept. of Horticultureand Secondary
Crops
Dept. of IndustrialCrops
Dept. of PlantProtection and
SPS
Dept. of AgricultureLand Management
Dept. of AgriculturalMechanization
Dept. of AgriculturalExtension
Cambodia
NationalLaboratory ofAgriculture
GeneralDirectorate of
Rubber
Dept. ofAdministrationand Legislation
Dept. of RubberDevelopment
Dept. of Finance,Planning and
Statistics
Dept. of RubberProcessing
Dept. of Marketingand International
Cooperation
Institute of Rubber Research
of Cambodia
Public Institutions:NSAPLNSAKC
RUACARDI
Audit Unit
Provincial Departments of
Agriculture
District Offices of Agriculture
Dept. ofAdministrationand Legislation

Governance, Competitiveness, and Institutional Issues in Rural Development 89
Provincial departments of water resources and meteorology have been established in each province. The departments are staffed with technically qualified personnel but remain underresourced. Two or three staff members in any department may have some engineering qualification, but the department director, who does not perform as an engineer, is normally one of the qualified staff members (Taylor 2008).
The structure of MRD is shown in Figure 39. Like MOWRAM, MRD has two main divisions, headed by a director general of administrative affairs and a director general of technical affairs. The general department for administration and finance is in charge of different departments such as training and research, ethnic minority development, and the general inspectorate. The department of internal audit and the financial control entity are at the same hierarchy level as the other departments, but are functionally separate from the general directorates.
Provincial and municipal departments of rural development have been established in each province or municipality. The departments are staffed with technically qualified personnel but remain underresourced.
Figure 38 Organogram for the Ministry of Water Resources and Meteorology, 2008
Source: Ministry of Water Resources and Meteorology, October 2008.
Minister
Secretaries of State
Under Secretaries of State
Cabinet and Advisors
General Inspector Director General ofAdministrative Affairs
Director General of Technical Affairs
Deputy Director General of Technical Affairs
Provincial Department of WaterResources and Meteorology
District Water Resources
Offices
Water Resources Managementand Conservation Offices
Irrigation and Drainage Offices
Water Supply andSanitation Offices
Administration andPersonnel Offices
Hydro-Meteorology Offices
Internal AuditingDepartment
Deputy Director General ofAdministrative Affairs
Planning and InternationalCooperation Department
Technical Service Center forIrrigation and Meteorology
Administration and Human Resources Department
Finance Department
MeteorologyDepartment
Hydrology and River WorksDepartment
Water Management and Conservation Department
Water Supply and Sanitation Department
Irrigated AgricultureDepartment
EngineeringDepartment
Deputy GeneralInspector
Community Water User Development
Department
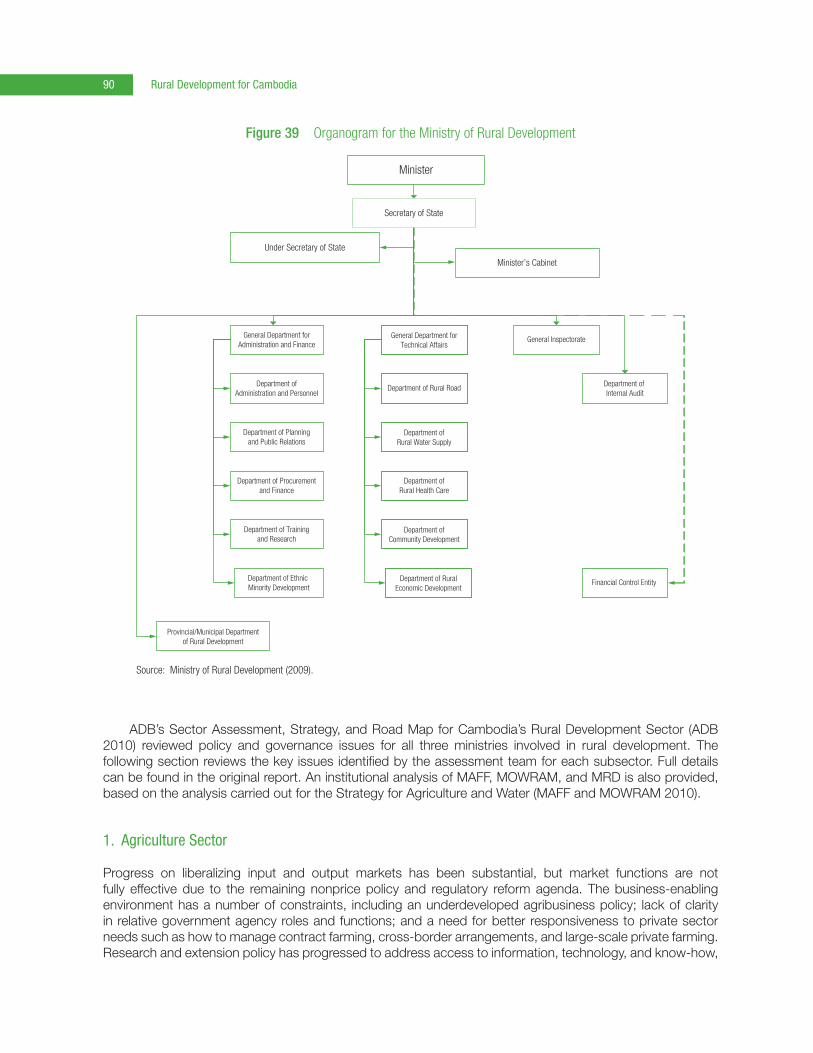
Rural Development for Cambodia90
ADB’s Sector Assessment, Strategy, and Road Map for Cambodia’s Rural Development Sector (ADB 2010) reviewed policy and governance issues for all three ministries involved in rural development. The following section reviews the key issues identified by the assessment team for each subsector. Full details can be found in the original report. An institutional analysis of MAFF, MOWRAM, and MRD is also provided, based on the analysis carried out for the Strategy for Agriculture and Water (MAFF and MOWRAM 2010).
1. Agriculture Sector
Progress on liberalizing input and output markets has been substantial, but market functions are not fully effective due to the remaining nonprice policy and regulatory reform agenda. The business-enabling environment has a number of constraints, including an underdeveloped agribusiness policy; lack of clarity in relative government agency roles and functions; and a need for better responsiveness to private sector needs such as how to manage contract farming, cross-border arrangements, and large-scale private farming. Research and extension policy has progressed to address access to information, technology, and know-how,
Figure 39 Organogram for the Ministry of Rural Development
Source: Ministry of Rural Development (2009).
Minister
Secretary of State
Under Secretary of State
Minister’s Cabinet
General Department forAdministration and Finance
Department ofAdministration and Personnel
Provincial/Municipal Departmentof Rural Development
Department of Planningand Public Relations
Department of Procurementand Finance
Department of Trainingand Research
General Department forTechnical Affairs
Department of Rural Road
Department ofRural Water Supply
Department ofRural Health Care
Department ofCommunity Development
General Inspectorate
Department of Internal Audit
Financial Control Entity Department of Ethnic Minority Development
Department of RuralEconomic Development
Governance, Competitiveness, and Institutional Issues in Rural Development 91
but gaps remain on links between these services, priorities and targets are underdeveloped, and private–public synergies are not being fully exploited.
Specific institutional and governance constraints that affect agricultural productivity include (i) agencies involved in land titling (e.g., Ministry of Land Management, Urban Planning and Construction) lack the resources to issue titles on a scale that is necessary to turn the majority of farmers into a class of asset-owning micro-entrepreneurs, hence, the inability to secure property rights is a significant binding constraint to rural development; and (ii) the agricultural research system (in particular the Cambodian Agricultural Research and Development Institute) is underperforming, and the national agricultural extension system (especially at the commune level) is almost nonexistent. There is an absence of information, communication, and technology services to which farmers, traders, and processors can turn to access product and price information. As a result, trade patterns tend to become ossified and not necessarily efficient.
Next-round policy and institutional issues include (i) the need to issue subdecrees and supporting legislation to the 2001 Land Law and 2008 Seed Law; (ii) building technical capacity to implement the newer aspects of the Water Law, forestry subdecrees, and fishery sector reforms; (iii) developing and applying policies for improved common property resource pricing and demarcation; (iv) increased community-based management of natural resources and payment for environmental services; (v) increasing legal provisions for increasing private sector participation; (vi) further addressing access to improved farming technology and market information; and (vii) closing the coverage and gap on standards and biosecurity institutions.
2. Analysis of the Organizational and Institutional Structure of the Ministry of Agriculture, Forestry and Fisheries50
At the institutional level, MAFF has undergone a recent reorganization as part of the drive toward reducing overlapping mandates and addressing some institutional weaknesses in the planning and budgeting process. The reorganization carried out under Subdecree No. 188 (dated November 2008) is a step in the right direction, but more time is needed before a proper evaluation is made.
In the agricultural planning process, MAFF retains a valuable role in strategic guidance for the agriculture sector, supported by stronger planning capacity and direction at subnational levels as a result of the decentralization and deconcentration process. The foundations exist for a better-informed, relevant, and harmonized policy and planning process, supported by more effective communications and information systems. There is, however, widespread recognition of the need for improvement through rationalization of the prevailing strategic framework and institutionalizing a single, successor framework more closely linked to policy formulation, monitoring and evaluation, and the processes of annual national and decentralized planning.
Planning functions are supported by planning and finance specialists in each department; dedicated planning and finance departments; and the planning, monitoring, and evaluation activities of externally supported projects and programs. It is widely acknowledged, however, that closer links between plan and budget formulation would lead to improvement in both service delivery and the efficiency of resource allocation, and render the planning process more effective. Activity planning remains dominated by historical operations, and links between activities and departments or to the availability of operational funds could be improved. Monitoring and evaluation of activities is constrained. Mandates across departments retain some duplication, and continue to foster independent operations among those departments.
50 See MAFF (2006) for an overview of its organizational and institutional issues.

Rural Development for Cambodia92
Policy and planning capacity is concentrated in department planning offices, and the decentralization process is strengthening skills at the provincial, district, and commune levels. Human resources development is supported by a number of projects, but existing human resources strategies could be improved. Planning, monitoring, and evaluation skills are less than robust and underutilized as a result of approaches to personnel management and ad hoc task allocation. Where donor support is provided, it tends to be project-based and skewed to the needs of individual donors. In this environment, many activities, including planning, fall to a limited number of skilled staff members, many of whom are overloaded with multiple duties.
Overview of the planning process. The planning environment of the agriculture sector is changing in response to the evolving decentralization and deconcentration process, which has established a structure for decentralized planning and decision making at the commune level through a participatory and community-oriented local planning process. In conjunction, the parallel deconcentration of service delivery to district and provincial levels is occurring, completing the process of relocating development planning and resource allocation from national to subnational levels through a combination of provincial, district, and commune block funding. The decentralization and deconcentration process is further institutionalized through the Organic Law, which provides the legal basis for delegating respective mandates to province, district, and commune authorities.
The decentralization and deconcentration process has been instrumental in realizing government strategy as set out by the National Program for Administrative Reform. Specifically, MAFF’s role is expected to change, focusing on (i) policy formulation and guidance to the government on the agriculture sector; (ii) generating new technologies to support agricultural production; (iii) transferring new technologies to farmers and other private sector stakeholders; and (iv) establishing and enforcing regulatory standards related to the agriculture sector.
The process is already facilitating these changes by shifting service delivery responsibilities away from MAFF. The ensuing discussions and analyses should be viewed in light of this reform process and the urgent need for MAFF personnel, systems, and procedures to adapt to these changes, particularly the deconcentration of service delivery. The Public Financial Management Phase II Project will address capacity development issues at the provincial level, and there is already a draft law of financial management for the local levels.
Annual ministry activity planning. In September and October of each year, every department and all provincial departments of agriculture prepare development plans, annual department plans, and provincial agricultural development plans. At the national level, chiefs of each office and unit within a department consult with their respective office chiefs in provincial departments of agriculture on planned activities for the coming year. Each department’s planning team then coordinates with the office chiefs to generate a draft department plan for submission to the Department of Planning and Statistics and MAFF Cabinet Office. Department plans seek supplementary funding from supporting donors and aid agencies. Annual department plans are independent of the respective department budget plans (i.e., recurrent budgets), and to that extent, are an unfunded wish list for circulation to potential donors.
At the subnational level, as noted above, planning is now driven by the local planning process (LPP) through which individual communes formulate and prioritize their own commune development plan. The local planning process is the basic framework through which communes mobilize internal and external resources and decide on their use to solve priority local problems. The commune development plan is an annual plan consisting of five sections, two of which (i.e., economic, and natural resources and environmental management) may incorporate agricultural development-oriented plans and proposals.
Individual commune development plans are subsequently brought together in a district integration workshop that serves as a marketplace where priority needs identified in the plans are matched with development resources from the commune/sangkhat funds (CSFs) and/or the Provincial Investment Fund. The workshop leads to the consolidation of each plan, and the development of district and provincial sector plans, including agriculture, which support and service the commune development programs negotiated

Governance, Competitiveness, and Institutional Issues in Rural Development 93
at the workshop. A provincial agricultural development plan is, therefore, now borne of the local planning process, and funded directly from the Provincial Investment Fund. The prevailing role of MAFF in this process is the provision of sector and subsector policy and regulatory frameworks by which provincial agricultural plans are guided and coordinated, and where it retains a competitive advantage, in the provision of technical and capacity-building support.
Annual budget planning. The MAFF budget planning process is conducted by the Budget Unit, which is chaired by the secretary general of MAFF and comprises representatives of the director, deputy director, and technical officers from the Department of Accounting and Finance and the Department of Planning and Statistics. The annual budget plans follow the Strategic Budgeting Framework,51 which is a rolling 3-year plan, thus the scope and effectiveness of MAFF’s activities depends to a considerable extent upon resources made available to it each year. The annual budget is composed of a program budget, nonprogram budget, and revenue program. There are three potential sources that determine MAFF’s access to resources:
(i) Recurrent budget. This is MAFF’s annual budget plan that it uses for its basic operating costs, comprising the nonprogram budget as well as a smaller program budget allocation.
(ii) Development budget. This budget is usually supported by external bilateral and multilateral aid agencies in partnership with the government. It has followed the Medium-Term Strategic Budgeting Framework since 2007 and comprises mainly program budget allocations.
(iii) Nonbudget activity. This item refers to activities usually carried out in the sector by NGOs, bilateral aid agencies (either directly or indirectly through financing NGOs), and the private sector.
Of the first two budgets, the development budget describes the volume of donor-supported resources managed by MAFF, and as part of its partnership contribution, includes government counterpart commitments of a capital nature. These funds are all earmarked for the respective donor-supported initiatives. What is frequently overlooked in the development budget, however, and what subsequently contributes to the lack of sustainability in the development investment, is the impact on the scarce resources of the government’s operational budget.
It is this recurrent budget (i.e., the annual budget plan) that determines MAFF’s ability to undertake its routine activities. This budget is largely derived from the operating budget of the preceding year, and is only indirectly linked to the activity plan for the ensuing year. The budget is generated from respective department budgets prepared in September each year and consolidated by the Department of Accounting and Finance into a MAFF budget for submission to MEF in October or November. During this period, internal review of the budget takes place between the Department of Accounting and Finance, Department of Planning and Statistics, and senior managers. Budget revisions do not necessarily involve departmental stakeholders.
At the provincial level, the budgeting process followed by provincial departments of agriculture reflects the decentralization process. The departments submit annual budgets directly to MEF, and provide financial reporting to MEF. The departments are no longer obliged to submit budgets to the Department of Accounting and Finance within MAFF, although some do appear to provide copies to it.
Provincial level. Several studies have been conducted looking at the institutional and management capacity at the provincial level (Vindel 2003, Pousse 2004). The reviews highlight weaknesses in the planning mechanism, which link back to MAFF at the national level. In particular, skills gaps in strategic planning and analysis, and procedural constraints to effective intra-institutional coordination, are recognized as a limitation at all levels (MAFF 2006).
51 The Medium-Term Expenditure Framework concept was developed by the World Bank and promoted in non-Organisation for Economic Co-operation and Development countries, particularly in the context of the Poverty Reduction Strategy Papers. The Strategic Budgeting Framework in the Royal Government of Cambodia’s terminology has replaced the Medium-Term Expenditure Framework.

Rural Development for Cambodia94
Several issues that constrain the ability of provincial departments of agriculture to implement national and subnational programs are as follows:
(i) The compartmentalized structure and mandate of provincial departments of agriculture, which consequently tend to reflect the structure at the national level; they also have overlapping responsibilities;
(ii) A lack of long-term, strategic planning for provincial agricultural development, with provincial priorities not translated into integrated programs;
(iii) No consolidated budget for department activities, with data on national-level budget allocation not available;
(iv) Diversity of procedures and systems in relation to different bilateral and multilateral projects and programs;
(v) Lack of reliable planning data, which nevertheless are subsequently relied upon for planning at both the provincial and national levels;
(vi) Lack of planning capacity among department staff, and a planning process often limited to aggregation of ongoing activities;
(vii) While departments collect raw data for planning on behalf of the Department of Planning and Statistics, they lack analytical skills to utilize those data themselves;
(viii) Limited understanding and/or recognition of the difference between policy formulation and technical support at the national level, and local planning and implementation at subnational levels;
(ix) Incomplete decisions regarding the deconcentration process and the division of responsibilities and mandates among departments and MAFF at the national level;
(x) Ineffective management approaches with vertical lines of reporting between provincial offices and national departments that constrain integrated provincial planning and activities and do not support interoffice collaboration or coordination;
(xi) No direct link between department budgets and development activities or program performance, and the deconcentration process generating two parallel systems whereby departments participating in the decentralization and deconcentration system are required to submit budgets and account directly to MEF but not to MAFF; and
(xii) Field staff members are underpaid and their attendance is determined by their involvement with donor-funded projects from which means of salary supplementation may be found.
3. Water Sector
As reviewed in ADB (2010), the overall water resources management policy framework is still evolving. There are policy documents and legal instruments that establish principles of water resources management, notably the adoption of the Water Law in 2007, but a framework to institutionalize integrated water resources management is not yet in place. Additional policy positions are needed on (i) the development of tributary rivers, and the need to balance upstream and downstream benefit and related ecological services; (ii) the conditions for operating major dams, and the mechanisms for monitoring and enforcing such conditions; (iii) how to balance the competing economic benefits of such values as fisheries, irrigated agriculture, and urban or tourism development; (iv) the role of water fees for the right to store or divert water; and (v) water quality.
Governance, Competitiveness, and Institutional Issues in Rural Development 95
A critical water resources policy area is the lack of clarity regarding irrigation service fee collection and the operation and maintenance responsibilities of farmers. Further, the legislative framework for environmental protection and natural resources management remains incomplete. Reform in the fisheries subsector is ongoing, but incomplete. The adoption of the Fisheries Law in 2006 was a positive step, but the burden of fishing within the law overwhelms small fishers. Commercial fisheries still circumvent the law and interfere with community and small-scale fishing in the absence of strong enforcement leading to unsustainable extraction of fisheries resources.
The lead institution in the water resources subsector is MOWRAM, which is essentially a technical ministry responsible for irrigation services, flood and drought control, hydrology, and meteorology. MOWRAM is mandated to manage, lead, and supervise the implementation of the Water Law, and carries out this mandate through its national agencies and provincial departments. MOWRAM’s organizational structure and staffing reflects its historical functions rather than the new and expanding responsibilities of regulating and authorizing access to Cambodia’s water resources under the terms of the Water Law; thus, ad hoc organizational arrangements dictate which new tasks associated with donor-mandated functions are performed as well as probable overstaffing by untrained or unqualified personnel. MOWRAM has the characteristics of a supply-driven service provider with users lacking information on alternatives, and an upward government-orientated accountability mechanism rather than accountability to users.
Other ministries with roles in water management are the (i) Ministry of Environment, which has a mandate to maintain the quality of water and the environment; (ii) Ministry of Health, which focuses on drinking water and the reduction of water-related diseases and hazards; and (iii) National Disaster Management Committee, which coordinates efforts with MOWRAM on both droughts and floods, although the historical emphasis has been on the response to events rather than planning to minimize future risk. Uncoordinated institutions with overlapping responsibilities arising from unclear mandates and weak capacity at the provincial level remain a constraint.
4. Analysis of the Organizational and Institutional Structure of the Ministry of Water Resources and Meteorology
For reasons described below, the main activity occurring under MOWRAM is that of construction on a project-by-project basis, managed by a project management office. These activities are conducted separately from the authority structure and financial management systems of MOWRAM.
MOWRAM contains line departments that are not fully functional because they lack staff and budgetary capacity. Where donor funding becomes available to conduct project activities of a management nature, line departments may benefit from enhanced capacity in the form of equipment, training, software, and systems. However, these frequently become inactive after the project concludes (Taylor 2009). The impediments to normal operations are such that investment in capacity building at this time is not strongly supported. Investment in capacity building at the provincial, district, and grassroots levels is currently a better strategy (Taylor 2009). Nevertheless, in the area of professional qualifications and training, it is very important to invest, because this will improve the capacity of Cambodia as a whole, whether or not MOWRAM is capable of capturing and retaining qualified staff.
Decision making in MOWRAM is centralized, and budget and approval delegation to the provincial level is minimal. This situation can only persist because, apart from design and construction projects, little other activity is occurring. An example is the registration of farmer water user communities (FWUCs) at national level instead of at the provincial or district level (Taylor 2009). These limitations have, in turn, meant that the provincial department capacities remain limited. In line with the decentralization and deconcentration policy, administrative and financial decisions should be delegated further.

Rural Development for Cambodia96
Both donor- and nationally funded projects are managed through the central project management office, its units, and subsidiary provincial project implementation units. The project management office and its structure are not shown on the organizational chart of MOWRAM as it is outside of the line management structure. The project management office reports to the minister via a project manager for each project, who may be at the secretary of state level. The project management office’s financial accounting system is separate from that of the ministry, and funds do not flow through the Department of Finance or line departments (Taylor 2009).
The establishment of a project management office with project management units and project implementation units outside of line departments has created overlapping mandates of line departments and the project management offices. Staff members have been attracted from departments into the project management units, because funding arrangements are more free and workable than in the ministry itself (Taylor 2009). Thus, key issues for the management of the water sector is that the further support of the project management office system is counterproductive, as it contributes to the continuing underutilization of the line departments and, as a consequence, erodes their ability to carry out their mandated tasks. The desire to place projects with the appropriate line department should be further discussed within MOWRAM (Taylor 2009). In addition, it will be necessary for the financial management arrangements to comply with the following (Taylor 2009):
(i) The Medium-Term Expenditure Framework is introduced and operational throughout the ministry.
(ii) Project funds are routed to the line department accounting system under framework codes.
(iii) Staff members responsible for implementation activities in MOWRAM are not placed in a unit that removes them from either (a) normal lines of authority under the departmental structure; or (b) the ministry financial system, reporting requirements, and audit mechanisms.
These measures are designed to ensure that the project is embedded within the ministry and that knowledge and capacity transfer is improved, and financial accountability is enabled.
Provincial level. The provincial offices of MOWRAM need to strengthen capacity to implement national and subnational programs. There is usually no more than one member of staff with an engineering qualification, and that person is usually the director who is therefore consumed by management and cannot work as an engineer.
The bulk of activity of the provincial departments involves small-scale construction projects and responsibility for irrigation and other works in the province. These departments are responsible for operating dams and reservoirs and, in theory, for the maintenance of the works. However, they have limited funding for maintenance and may not have much knowledge of structures. Administration and financial management capacity may also be low (Taylor 2009). Another responsibility of the provincial departments is to organize and oversee the functioning of FWUCs after they are set up. The provincial departments are often a joint signatory to the FWUC bank account and must agree to the expenditure of funds by the chair of the FWUC.
The provincial department structure follows the head office structure of MOWRAM, with departments for water resources management and conservation, water supply and sanitation, irrigated agriculture, hydrometeorology, and administration and human resources. Some departments are more notional than real, such as the Department of Water Supply and Sanitation (Taylor 2009).
The provincial level is the logical level for the main activities in the following areas (Taylor 2009):
(i) The planning, design, and construction of works that do not require national attention;
(ii) The operation of hydraulic works in the province not undertaken by farmers;

Governance, Competitiveness, and Institutional Issues in Rural Development 97
(iii) The maintenance (including asset management planning and budgetary planning) of hydraulic works in the province;
(iv) Assistance to farmers to enable them to manage their level of irrigation works and activities successfully and sustainably;
(v) Water rights and conflict issues outside of the scope of farmer organizations; and
(vi) Measures to remedy provincial river channel, drainage, and flooding problems, including the investigation, design, and construction oversight for relevant works.
These are logical roles for the provincial departments and are not necessary for the national level to undertake, except in cases where large expenditures are required, high levels of technical expertise must be applied, or a project of national significance is involved. If undertaken at the provincial level, these responsibilities would result in a considerable workload, but at present they are not being undertaken comprehensively. It would also be consistent with the decentralization policies of the government to give more formal responsibilities to provincial offices.
District level. The district level of MOWRAM is very limited in staff and function. District offices are usually staffed with a single person who is not technically qualified and whose function is mainly as a liaison between the commune level and the provincial level (Taylor 2009). In some districts, MOWRAM does not have its own office, and the district officer may be located at the district office of MAFF. For this reason, irrigation scheme management and FWUCs link directly to the provincial offices (Taylor 2009).
It will be more appropriate in the long term for the district function to be upgraded and for management and operation issues between irrigation schemes and MOWRAM to be handled by a district office (Taylor 2009). The district level of MOWRAM should be built up to help farmers manage irrigation at the appropriate levels by (i) assisting farmers to form farmer irrigation organizations, (ii) supporting irrigation organization operations and management, (iii) providing or facilitating general technical support for irrigation, (iv) facilitating training and development of farmers in irrigation skills and knowledge, (v) liaising between provincial departments and farmers regarding maintenance and refurbishment requirements, and (vi) facilitating the financing of irrigation improvements.
5. Rural Infrastructure Sector
Policy issues that affect rural infrastructure provision include continued underinvestment and underallocation of funds. This is particularly the case from the government’s own sources due to a lack of clarity in policy on fiscal allocations for investment in physical capital infrastructure and public works. Several policy issues affect the efficient use of limited finance; the most important of these is the underinvestment in operations and maintenance. In the water sector, this is manifested by the failure to enforce reasonable levels of cost recovery for irrigation scheme maintenance, and the abrogation of FWUC responsibilities leads to premature asset deterioration.
Policy and institutional problems with operations and maintenance include (i) generalized underfunding by national government agencies; (ii) inability of subnational authorities and communities to raise sufficient funds for operations and maintenance, and the inability to plan on a lifecycle basis; (iii) discontinuities in planning, such as the high-level objectives set by ministries and the lists of investment projects submitted by provincial authorities, which do not match, resulting in projects being financed without any regard to operations and maintenance implications; and (iv) inappropriate technical standards being applied at the design stage without any real consideration of the ability to fund the ongoing operations and maintenance obligations.

Rural Development for Cambodia98
Policy issues for sustainable transport include (i) market-based pricing mechanisms such as levies, fines, betterment taxes, and road tolls to create sustainable transport funds (including hypothecated taxation revenues); (ii) more focus on the end users of transport services and better accounting for environmental costs in project evaluation; and (iii) a closer scrutiny of issues regarding rural roads and network development such as excessive land take, use of recycled road construction material, and the extent of local resource requirements.
Institutional issues include (i) the need to strengthen capacity at the national and subnational levels, (ii) locating rural infrastructure interventions in the context of the ongoing decentralization and deconcentration process, (iii) promoting effective community participation, and (iv) dealing with climate change impacts.
Decentralization and deconcentration are still evolving, and despite legislation that decentralizes functional responsibility, actual authority and capacity at the local level are still limited. Authority may be devolved, but the capacity of lower levels of government to plan, implement, and manage rural development infrastructure limits infrastructure provision. Once built, the ability of local administrative levels to raise revenues for cost recovery and for operations and maintenance will be limited and needs to be reflected in investment design, implementation arrangements, and capacity development for effective and efficient results. Issues include the efficiency of public infrastructure and finance and utilities, subsector regulatory and contractual arrangements, and financial flows through levels of government.
6. Institutional Issues with Farmer Organizations
There has been a proliferation of committees and cooperative bodies in which farmers can participate. At the village level, it is common for the following to exist: (i) agricultural farmer cooperatives, (ii) community disaster committees (in flood- and drought-prone areas), (iii) savings committees or cooperatives, (iv) community forest organizations, (v) community finance organizations, (vi) community fisheries organizations and other commune-level committees, and (vi) FWUCs.
The most relevant formal organizations in the agriculture and water sectors are the FWUCs, which are registered under the Water Law. In larger irrigation schemes, a scheme-wide FWUC is established, and subgroups are created to report to the central committee. Further, farmer groups are vital, established as cooperatives by MAFF, which enables them to enter into contracts and conduct business as a group. These have been operating as commercial bodies, able to attract finance in various ways. The corporate structure of the farmer organizations set up by MAFF, under the Law on Farmer Cooperatives, allows them to engage in commercial activities. A question is whether irrigation organizations would benefit from a similar legal status. For instance, the ability to contract out activities such as maintenance or construction could be an advantage for irrigation farmers (Taylor 2009).
The formal FWUC program results in the registration and setting up of a committee under the regulation pursuant to the Water Law. A chairperson and committee members are formally appointed, and an office building may be located or provided. For larger schemes, a system of subcommittees is organized. The main responsibilities of FWUCs are to undertake operations and maintenance of minor canals, organize the contribution of labor for routine main canal activity, and collect water user fees from farmers to fund these activities (Taylor 2009).
FWUCs have been seen as relatively ineffective in turning over real management from the provincial departments to farmers due to the lack of training and capacity of FWUC members and the farmers. This has not been supplied by the ministry or by provincial departments, as the provinces do not have the capacity by themselves.

Governance, Competitiveness, and Institutional Issues in Rural Development 99
The main issues with the strengthening of FWUCs are as follows (Taylor 2009):
(i) The FWUCs are registered at the national level with MOWRAM, and the provincial departments, in practice, have joint control of their financial accounts and liaise with the FWUCs on programs and activities. The district office does not have a defined role in supporting or overseeing the FWUCs. There is no reason why they cannot be registered by the province or even the district. The district office should become the main support and capacity development arm of the ministry. At present, the district office is not capable of providing technical support. A strengthening strategy is required that involves staffing, training, and budget allocation.
(ii) FWUCs are not independent of MOWRAM. The central role of FWUCs as presently constituted is to empower the committee to collect fees from farmers for irrigation works. However, the account is jointly controlled by the provincial departments, which must sign off withdrawals by the FWUC chairperson and treasurer.
(iii) The financial affairs of FWUCs are controlled by the provincial departments, although the fees are collected from the farmers themselves. Although it is wise for the ministry to exercise some oversight over the activities of the farmer organizations (and a proper audit procedure should apply to collected fees), it is desirable that the farmers become as self-determining as possible and that their finances are at their own disposal. The pilot training interventions of the Technical Services Center (TSC) of MOWRAM appear to demonstrate that farmers, when properly trained, are capable of more development and management work in irrigation schemes than has been assumed. Ultimately, the financial control of the provincial departments should be cut, and farmers allowed to determine how the money is spent. This may not readily come about without procedures that allow the farmers to choose their leaders at regular intervals.
There is a need to set up a cooperative organizational structure for farmers. The creation of separate agriculture and irrigation committees or organizations is not a problem provided that (i) they are not attempting to undertake the same activities competitively, and (ii) relevant activities are undertaken cooperatively or there is adequate communication between them. However, there must be a general understanding between MOWRAM and MAFF about who will do what (Taylor 2009).
7. Planning, Budgeting, and Financial Management Activities and Systems
Discussions with MAFF, MOWRAM, and MRD indicated that there is a gap between the annual work plan activities being carried out by technical departments and the information available to administrative departments, which hampers the planning and budgeting functions. For example, the planning departments under MAFF, MOWRAM, and MRD do not have a clear idea of the particular projects or activities being implemented by the various technical departments and thus cannot align these activities with the national strategies being developed at higher levels of the ministries. The finance departments are only responsible for being the liaison between technical departments and MEF in passing on budgetary requests and the subsequent budget allocations, and have no oversight on actual expenditures.
At the provincial level, the gap is even more pronounced, as the decentralization and deconcentration reform has resulted in provincial departments being responsible to the provincial governor for expenditures. At the same them, they are not providing MAFF, MOWRAM, and MRD with reports on plans or budgets. While the Department of Finance is responsible for passing on MEF allocations, it is unable to receive adequate feedback from the provincial level to enable a proper monitoring and evaluation system to be put into place. The asset management procedures follow MEF guidelines but are limited in that there are no policies on asset replacement or asset maintenance.
With the separation of MOWRAM into a general directorate of administrative affairs and a general directorate of technical affairs, each of the technical departments has an administrative unit but not a dedicated

Rural Development for Cambodia100
finance unit. Financial responsibilities are undertaken by administrative staff. One of the proposed solutions to the coordination issue is to establish a dedicated finance unit in each technical department staffed with trained accountants who could then liaise directly with the Department of Finance and provide the necessary feedback to enable the department to oversee financial disbursements and expenditures.52
Discussions with MOWRAM indicate that the Medium-Term Expenditure Framework Financial Management Information System, currently being piloted in MAFF, needs to be expanded to include MOWRAM and MRD. The use of a consistent financial management information system across ministries and within ministerial departments will go a long way to enabling higher-level financial and planning units to access information and coordinate the implementation of national strategies throughout the system.
In terms of national budget expenditures, ministries do not control government budget allocations, as these are tightly held by MEF. Ministries must seek MEF’s approval for spending on an item-by-item basis before the funds are disbursed to them. Similarly, ministries receive funds for salaries directly from MEF but do not have much control over expenditure for other items. Further, MEF may decide to make arbitrary cuts to approved budget allocations for a project, which, in some cases, have rendered the project ineffective.
Within MAFF, MOWRAM, and MRD, the finance departments have difficulty getting full information on the spending of the line departments, receiving only general statements of monies spent. MEF therefore exerts controls, not by post-expenditure audit and review, but by controlling the funds disbursement stage, a strategy that hinders ministry performance. In MOWRAM, the finance department has no role in control or review of funds assigned to the project management offices or project implementation units because they report directly to the minister. Similarly, in MAFF, the finance department has no oversight on project management units from donor projects as only line departments are obligated to report budgetary expenditures.53
Some management consequences of these practices (in addition to the gross limits on the availability of finance) are the following:
(i) Line departments may be severely restricted as to their funding sources, and often find it difficult to operate. For instance, budgets allocated by the Council of Ministers are not guaranteed to be passed on by MEF.
(ii) There is no financial flexibility even at the petty cash level, so routine activities can be restricted or halted.
(iii) Ministry staff members often seek additional work outside of the ministry, as workable projects do not exist on which they can spend their time.
(iv) The lack of institutional improvement is serious because it means that the government ultimately has limited ability to undertake activities by normal administrative means and must use special measures to get things done. So long as construction projects are being financed by external lenders and donors, the operational inadequacies of ministries are masked to some extent.
52 The situation for MAFF is similar in that there are difficulties in coordinating budget and planning functions between departments. Under the ADB-funded Agriculture Sector Development Program, recommendations were made to separate the general directorate into a general directorate of administrative affairs and a general directorate of technical affairs to streamline the budget and planning functions and provide higher-level oversight to individual line department activities. MAFF felt that such a separation was not necessary and that a planning and budget formulation unit at the general directorate level would provide the same functions and level of oversight. Discussions within MAFF are ongoing as to the feasibility of separating administrative and technical functions at the subgeneral directorate level.
53 Put simply, under the Medium-Term Expenditure Framework, line departments are obligated to submit Form P4 (Activity Profiles), which detail sources of funding from internal and external sources. Since project management units are formed to manage donor projects and are therefore outside of the line department mandate, the finance departments are unable to report how official development assistance funds are spent.

Governance, Competitiveness, and Institutional Issues in Rural Development 101
(v) The Council on Administrative Reform has been rolling out a reform program in some ministries, but it has not yet been applied to MOWRAM. It may have the potential to improve some of the difficulties described above, but will not address the salary problem.
8. Salary Supplementation and Allowances
The chief constraint on ministries in Cambodia is the low level of salaries available to government staff members, including at the director level. The official salaries of technical staff members are $80–$250 per month depending on seniority, clearly not enough to live on. Therefore, staff members often take alternative work. For MAFF, MOWRAM, and MRD, alternatives include private sector hiring and working directly on externally funded projects where the remuneration is higher. Other sources for senior officials may include fees for participating in various committees. Thus, staff members are not available to work within departments of the ministry unless special funding is available, nor can they gain experience in their field through the ministry, only through working outside. While the capacity of individuals may be improved, institutional capacity is not advanced.
Both donors and the government recognize that donors and NGOs bear some of the responsibility in ensuring that provincial and district staff members are adequately compensated for their efforts. As such, the secondment of government staff members to donor and NGO projects does little to ensure the longer-term sustainability of government institutions, as they tend to choose the best-qualified staff members and leave the rest behind to pick up the workload.
This problem is one that cannot be resolved at the level of the ministry because it is government-wide and requires a significant change in policy and funding. Donors have attempted to address the problem by creating the Merit-Based Pay Incentive Program, which was canceled in December 2009.54 Under this program, some staff members became eligible for additional salary incentive payments up to $100 per month. However, payments at these levels do not make up the difference between government and private sector pay rates, which may differ by $400–$600 per month.
External inputs to staff salaries could come from donors in two ways: (i) via projects where incentive payments are made or where staff members are hired directly on higher salary rates, and (ii) through budgetary support mechanisms (following the Paris Declaration on Aid Effectiveness). These measures would be temporary, but if budgetary support is provided directly to the government for ministry salaries, the core responsibility of the government to remunerate its staff adequately could be undermined.
There have been some efforts by donors to ensure that government agencies at the provincial and district levels maintain their cadre of skilled personnel. The Australian Agency for International Development-funded CAAEP (II) Project implemented a scheme where provincial departments were contracted out as an entity to provide project services (e.g., agro-ecosystems analyses), thereby ensuring that government staff members were retained within their departments, the departments’ capacities were built, and the directors of departments could manage staff time allocations across different priority areas. The direct contracting of provincial departments, coupled with transparent contracting arrangements (e.g., publishing of contract terms and conditions as well as staff members allocated to specific tasks), may provide a mechanism through which all donors can cooperate with ministries and provincial departments while ensuring institutional capacity building, merit-based pay incentives, and efficient project implementation.
54 The decision to terminate salary supplement schemes was taken within the framework of measures to address the adverse impact of the global financial crisis and to maintain macroeconomic stability. The government’s wage bill had increased drastically in the last few years, reaching 49.0% of total current expenditure (4.8% of GDP) in 2009. If the program had been expanded to other line ministries, the wage bill could have been higher than 5.0% of GDP in 2010, which is much higher than in many countries in the region.

102
VI. Binding Constraints to Rural Development
In this section, the growth diagnostics framework of Hausmann, Rodrik, and Velasco (2005) is used to identify a set of critical and binding constraints to poverty reduction, improved productivity in the rural sector, and improved private and public engagement in increasing value added (Figure 40). Basically, the critical
constraints fall into five main areas: (i) low levels of technology adoption and human capital required to utilize such technology; (ii) poor infrastructure (e.g., rural roads; irrigation; and postharvest storage and handling, processing, transport, and logistics); (iii) microeconomic risks to appropriation of returns (e.g., property rights, corruption, and the business-enabling environment related to taxation and fees); (iv) difficulties in coordinating markets and marketing through formalized mechanisms of exchange; and (v) difficulties in accessing finance for agricultural investments, including the high cost of finance relative to the economic returns to investment in agriculture and agro-industry. Many of these critical constraints are interlinked. Unequal access to opportunities manifests itself in fewer educational opportunities for the poor and reduced health outcomes, which in turn are linked to human capital constraints. The uneven playing field for the poor relative to the rich manifests in unequal access to infrastructure, productive assets such as land and credit, and policy outcomes that discriminate against the poor.
Fundamentally, the underdeveloped nature of infrastructure and its unequal access are primary binding constraints to rural development and poverty reduction. However, only when the fiscal situation sufficiently improves will the government be in a position to allocate more resources to infrastructure investment. Improved infrastructure alone is not enough to lower the cost of doing business and to stimulate private investment. Better infrastructure has to be accompanied by investor confidence, which can be improved through the government adequately addressing governance concerns by implementing initiatives aimed at reducing corruption and strengthening the rule of law.
Removing weak financial intermediation, inadequate infrastructure, and weak investor confidence will result in increased private investments from domestic and foreign sources. Yet to ensure that growth can be sustained at a high level similar to that achieved by many Southeast and East Asian economies in recent decades, the government will also need to address market failures (e.g., information and coordination externalities) to encourage investments in diversifying and expanding the manufacturing sector and agro-based exports, and in upgrading the level of technology.
The core problem of binding constraints to rural development manifests itself in low levels of private investment and entrepreneurship in the rural economy. This, in turn, has impacts throughout the economy, resulting in low levels of diversity in production, low incentives to invest in agricultural and rural industries, and a lack of competitiveness in the rural sector.
Rural business ventures need financial, technical, and managerial assistance aimed at improving their profitability. Primary producers and small and medium-sized enterprises (SMEs) are limited in their ability to diversify because of traditional agricultural and processing practices. They are unable to break into new crops or new products, and to some degree, are locked into them by donor and government programs that only present information on how to produce more of the same thing. With little likelihood of seeing higher profit margins, there is little incentive to invest in better high-priced inputs, machinery, or infrastructure.
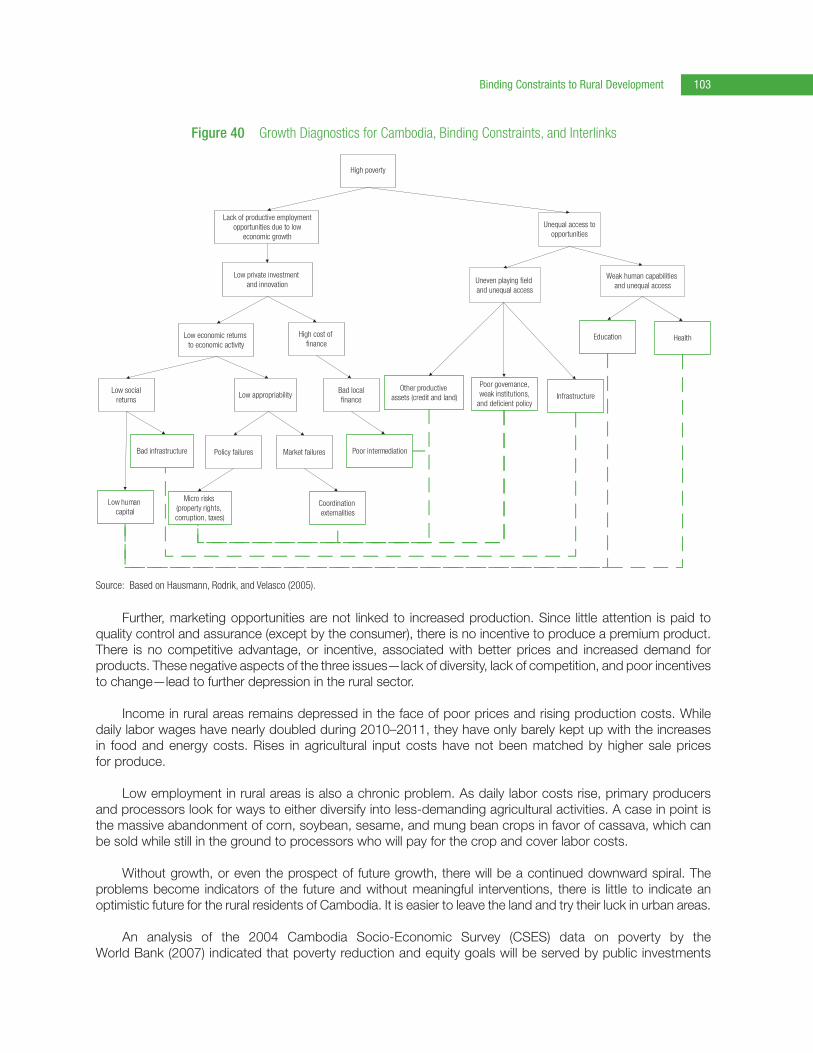
Binding Constraints to Rural Development 103
Further, marketing opportunities are not linked to increased production. Since little attention is paid to quality control and assurance (except by the consumer), there is no incentive to produce a premium product. There is no competitive advantage, or incentive, associated with better prices and increased demand for products. These negative aspects of the three issues—lack of diversity, lack of competition, and poor incentives to change—lead to further depression in the rural sector.
Income in rural areas remains depressed in the face of poor prices and rising production costs. While daily labor wages have nearly doubled during 2010–2011, they have only barely kept up with the increases in food and energy costs. Rises in agricultural input costs have not been matched by higher sale prices for produce.
Low employment in rural areas is also a chronic problem. As daily labor costs rise, primary producers and processors look for ways to either diversify into less-demanding agricultural activities. A case in point is the massive abandonment of corn, soybean, sesame, and mung bean crops in favor of cassava, which can be sold while still in the ground to processors who will pay for the crop and cover labor costs.
Without growth, or even the prospect of future growth, there will be a continued downward spiral. The problems become indicators of the future and without meaningful interventions, there is little to indicate an optimistic future for the rural residents of Cambodia. It is easier to leave the land and try their luck in urban areas.
An analysis of the 2004 Cambodia Socio-Economic Survey (CSES) data on poverty by the World Bank (2007) indicated that poverty reduction and equity goals will be served by public investments
Figure 40 Growth Diagnostics for Cambodia, Binding Constraints, and Interlinks
Low private investment and innovation
Bad infrastructure
Low human capital
Micro risks (property rights, corruption, taxes)
Coordination externalities
Market failuresPolicy failures Poor intermediation
Bad localfinance
Low appropriabilityLow social
returns
High cost of finance
Low economic returns to economic activity
High poverty
Uneven playing field and unequal access
Weak human capabilities and unequal access
Unequal access toopportunities
Lack of productive employmentopportunities due to low
economic growth
Education Health
InfrastructureOther productive
assets (credit and land)
Poor governance,weak institutions,
and deficient policy
Source: Based on Hausmann, Rodrik, and Velasco (2005).

Rural Development for Cambodia104
in productivity-enhancing infrastructure such as roads and irrigation; public spending on basic services to enhance human capabilities; and policies to improve land tenure, encouraging investments in land. In particular, infrastructure such as roads and irrigation is crucial for improving and stabilizing the livelihoods of rural households and providing access to markets and key social services. While a small number of farmers can afford to invest in small-scale irrigation structures, the majority depends on the government to provide these resources. Investments in irrigation are needed to raise and stabilize agricultural productivity and diversify crop production. As noted above, while irrigation infrastructure is not a primary binding constraint, it follows closely after the provision of technical knowledge and improved inputs.
The accelerating demand for food produce in Southeast Asia is likely to continue at an accelerated pace for the foreseeable future. Efficient producers of basic and processed food commodities, using high-intensity methods on well-organized and well-managed water resources systems will enjoy a competitive market position. These systems should be able to deliver a range of products to maximize the returns to rural enterprises and their associated value chains. Cambodia, lying at the heart of a market comprising several hundred million persons (Cambodia, the People’s Republic of China, the Lao People’s Democratic Republic, Thailand, and Viet Nam), is strategically placed to capitalize on its favorable geography and productivity. Importantly, the diverse agro-ecological and climatic variations in the country’s farming systems enable Cambodia to produce a wide range of high-valued agricultural and agro-industrially processed products destined for local, national, and regional markets, provided that land tenure, infrastructure, market access, and financial intermediation issues could be addressed.
Improvements in productivity, processing efficiency, and export opportunities are the desired outcomes of any sector development strategy. These should be broad-based and not targeted toward any particular commodity or market to enable the private sector to make the most of its entrepreneurial skills in investment strategies. The challenge for the government and donors is to turn the core problem of low levels of private investment and entrepreneurship in rural areas and the associated binding constraints into solutions. Reformulating the core problem into a core objective implies that a successful intervention would give rise to higher levels of private investment and greater entrepreneurship. This would have consequent impacts in a greater diversity of production; increased incentives to invest in agriculture and rural industry; improved competitiveness; and higher incomes, increased employment, and finally higher economic growth in rural areas. The overall impact of the intervention would be more growth in business, a vibrant rural economy, and a reduction in poverty.
The potential for agriculture as a driver for rural economic growth lies not so much in specific products or processes, but in overall increases in efficiency arising from the removal of subsector-wide constraints. While it is important to address these constraints, the analysis and discussion in this report points out that once land tenure, human capital, infrastructure, market access, and access to credit have been achieved, movement of smallholder farmers along the commercialization path to improved household incomes will occur only after the enabling environment of value chains have been addressed. However, it is clear that there are some specific areas in which considerable benefits could be realized.
Most of the constraints identified are well recognized and have been the focus of the government’s policy and reform agenda in recent years. Thus, this report confirms their continued relevance and points to the need for more concerted efforts to overcome them. Other critical constraints identified have been less recognized and discussed, therefore, the report offers some new thinking and insights into the development problems that Cambodia faces.
Actions are needed to promote the use of modern technology in production and postharvest storage processes; expand investment in agricultural research and development; strengthen rural infrastructure, particularly roads and irrigation drainage systems; develop markets and institutions; improve financial intermediation; and improve access to health and education services. The following priorities are proposed to address the constraints and are for the government’s consideration.

Binding Constraints to Rural Development 105
Security of land tenure is a precondition for investment in productive activities. As a priority, the government and donors should speed up and extend the Land Management and Administration Project (LMAP)55 land-titling program. The majority of current land disputes, both in agricultural and commercial real estate, can be traced to disagreements over the validity of land titles. Governance issues and the rule of law can only be addressed once an objectively verifiable title or contract can be produced.
Well-defined property rights improve private appropriability of returns, and owners with secure land titles are more willing to invest in higher-risk and potentially more lucrative activities, such as irrigation and drainage systems, perennial trees, and vegetable and cash crops. Land titles enable titleholders to use these as collateral for production and working capital loans. The evidence demonstrates that secure land tenure on private plots raises revenue, yields, productivity, rental and sales value, as well as household consumption (NIS 2004; World Bank 2007).
The poor can benefit most from improvements in agricultural productivity and technology. It is clear that Cambodia has to focus on the agriculture sector to achieve pro-poor growth and thus poverty reduction. As the majority of the poor live in rural areas and depend on agriculture, higher agricultural growth will provide food security by increasing supply, reducing prices, and raising incomes of poorer farm households. These can be achieved by improving value-added production through the implementation of good agricultural practices, good manufacturing practices, and organic certification systems.
The huge potentials in agriculture can only be tapped through better-informed farming practices to increase yield (thus production) with minimal effort, even without a quick expansion in cultivated land. Agricultural productivity of the major staple crop, rice, is far from its full potential and can be increased substantially. Productivity can be improved by introducing new seeds, using fertilizers and pesticides, and improving irrigation and drainage systems. For example, Viet Nam and Indonesia have achieved twice that of Cambodia’s average yield under similar weather and soil conditions. Thus, a clear, coherent strategy for the rice sector needs to be formulated around the dual objective of achieving food security and exporting rice.56
The promotion of modern technology and crop diversification should be tailored to local conditions. For example, fertilizer response rates with respect to nonrice crop yields are impressively high in the northeast mountain provinces (Yu et al. 2008). However, poor road and market conditions prevent local producers from benefiting from this comparative advantage. More investments in infrastructure could enable farmers to collect the latest market information and transport their produce to Phnom Penh and other regional markets.
Concomitantly, an expansion of the technology frontier through agricultural research and development to improve yields has become increasingly important, especially under difficult farming conditions such as in upland regions. This will need to be supplemented with measures to counter the adverse impacts of decreasing soil fertility.
For the development of the rural economy, it is important that the commercialization of agriculture creates links between agricultural production and downstream agro-industries, post-farm gate processing, and support services to ensure that smallholder producers obtain a reasonable income. By facilitating the participation of the private sector and providing markets and local employment, there will be a greater
55 LMAP was a Royal Government of Cambodia–implemented land-titling project partly funded by the World Bank, Canadian International Development Agency, and German development cooperation through GTZ. Despite extremely negative outcomes in relation to land-rights issues outside of LMAP areas (and subject to a World Bank operations freeze in Cambodia as a result), the project did achieve its primary goal of issuing more than 1 million land titles, providing security of land tenure to those households that have had their titles awarded to them.
56 Given that Cambodia has an annual surplus averaging 4 million tons of paddy, the food security issue, at least on a national level, is of less importance—geographical and distribution issues of food self-sufficiency notwithstanding.
Rural Development for Cambodia106
income-earning opportunity (on-farm and off-farm) for the rural poor, with the government more likely to achieve its vision of transforming agriculture into a driving force to attain higher economic growth.
To leverage the benefits from improved productivity and technology, the poor can benefit substantially from increased access to education and vocational opportunities. Schooling has high returns to individuals in terms of increased earnings, and there is a direct correlation between higher levels of education and higher average incomes and standards of living. In addition to formal education systems, opportunities for adult education in terms of agricultural extension and business training will provide substantial benefits to the rural population. Further strengthening of the formal schooling system for children and youth needs to be carried out, as well as the establishment of adult and continuing education systems for those who have not had the opportunities before.
Improved access to education needs to be addressed through a multifaceted approach with interventions situated within an overall long-term strategy to (i) expand access and strengthen the quality of general education; (ii) strengthen the quality of higher education, including technical education; and (iii) strengthen the Technical and Vocational Education and Training system so that it can respond to the needs of both the rapidly growing urban economy and the underdeveloped rural economy. However, provision of education and skills needs to be complemented by strong links with industry, partnerships with the private sector, and an enabling policy framework that places an adequate and appropriate focus on employment generation and rural development.
There is a direct correlation among poverty reduction, increased labor force participation, and improvements to health services. Plans to encourage a higher demand for health services, such as home visits from health care staff or expansion of equity funds or a voucher system, have been a positive way to increase utilization, particularly by the poor. This also broadens public health priorities, although commonly, a lack of funds or transport difficulties are barriers to success. Potentially, the best option for this scenario is for demand strategies to be coordinated and concurrent with the expansion of equity funds and community-based health insurance.
Market failures and coordination issues need to be addressed. These can be improved by (i) providing agricultural and technical advisory services at both the farm and processor level; (ii) strengthening links and access to markets through the development of public–private sector forums, and formalizing dialogue between stakeholders; (iii) developing contract-based production systems; (iv) linking value-added production with higher-valued marketing systems through niche product identification and promotion, branding, and labeling; and (v) providing timely and relevant market information and intelligence.
Diversification opportunities within the current resource base lie with crops other than rice, plantation crops, and fisheries including aquaculture and intensive livestock. Continued focus on rice production, particularly in subsistence or near-subsistence farming systems, may create a surplus of low-quality paddy that could drive prices down and undermine efforts to raise incomes and generate employment in rural communities. As a consequence, this emphasizes the need to integrate the production system with markets and their price structures. Similarly, it highlights the role of SMEs in the rural economy to generate value-added activities predicated on the availability of raw materials for processing.
Sustainable growth in the agriculture sector can be achieved through the commercialization of those industries in which Cambodia enjoys a comparative advantage. The government thus sees the private sector as the engine for economic growth while the role of the government is to establish the policy framework to stimulate such development (RGC 2004, 2005a). A viable agricultural, agribusiness, and agroprocessing sector will have the opportunity to influence and jointly fund its own research and contribute to the delivery of extension services. To support commercialization of post-farm gate agriculture, effective institutions are required to facilitate the integration of farmers and private enterprises into rapidly growing urban and international markets.

Binding Constraints to Rural Development 107
There are significant poverty alleviation impacts in improving rural road infrastructure. The inadequate road system is a major bottleneck to economic development. Investment in rural roads yields high returns to poverty reduction in developing countries (Fan 2008), and this has been demonstrated to be the case in Cambodia as well (NIS 2004, World Bank 2007). Improving rural roads will help rural populations gain access to key services, including education and health, and improve opportunities for nonfarm income-generating activities.
There is no one-size-fits-all recipe for higher rural incomes in all geographic regions. Each agro-ecological zone has unique soil and water conditions, as well as infrastructure and human capital stocks. It is important to target public investment with the highest impact on productivity and poverty, and to set up government support programs accordingly. The effect of public investment could be enhanced if spatial variations are taken into consideration during planning and implementation. For example, improved roads could increase the yield of dry season paddy and other crops in the Plain Zone but has little impact on farmers in the Plateau/Mountain Zone (Yu et al. 2008). Investment in road construction and rehabilitation will more likely to generate additional income and alleviate food insecurity through increased agricultural yields and incomes in the Plain Zone (Yu et al. 2008).
The government and donor community have achieved significant progress in reconstruction and development of the major arterial road network in Cambodia. This should be continued, and a sufficient operations and maintenance budget should be allocated to this valuable asset. Given the clear relationship between poverty reduction and road infrastructure, now is an opportune time for the expansion of the national infrastructure network to more remote areas, particularly in the northeast and north. Farm-to-market and feeder roads need to be developed and maintained, which will provide opportunities for farm households to secure inputs and market their products, provide opportunities for off-farm income-generating activities, and provide access to education and health services.
Investments in irrigation and drainage infrastructure will reduce climatic risk, reduce yield volatility, and provide food and income security to agriculture-based households. The government and donors, such as ADB and the Japan International Cooperation Agency, have already invested heavily in irrigation-based infrastructure. This development assistance focus should continue, and ADB and the Australian Agency for International Development (among many other donors) have already indicated a long-term commitment to irrigation infrastructure development. The evidence on the returns to large-scale irrigation systems is mixed, as is the sustainability of publicly funded (or NGO-led) water user groups. Accordingly, more focus should be placed on smaller-scale irrigation schemes linked with private sector–led water user groups. The main issue in Cambodia regarding water is not a lack of water, but flooding and the lack of drainage systems. There should therefore be an emphasis on flood mitigation and drainage schemes.
Financial intermediation needs to be improved. The issue of weak financial institutions must be viewed with the understanding that the financial community in Cambodia is successful and robust. The real issue is getting the institutions (particularly the commercial banks) to focus on the rural and agribusiness sector and the profit opportunities it offers. The inability of rural enterprises and farm households to access financial services is a source of raised production and distribution costs. As a result, farmers are undercapitalized and have few means of adopting new technology, improving seeds, or using fertilizers. Rural credit in Cambodia needs to be expanded such that credit is available easily and at reasonable rates. Land titling is a precondition for collateralizing land assets, which can then be used for loans to provide much-needed funds for farmers to purchase seeds and fertilizer.
From the rural business and SME perspective, there is a need for the (i) development of innovative financial products for leveraging real assets and inventories to increase the amount of working and operating capital available to traders and processors, and (ii) provision of agribusiness and finance advisory services to financial institutions and agribusiness. These advisory services aim to improve the quality of risk assessment, lending services, and financial products of banks and microfinance institutions for agribusinesses. These will also improve the business skills of SMEs in managing and operating their businesses and increasing their ability to access finance.

108
VII. Cause-and-Effect Analysis for Rural Development and Public Financial Management in the Sector
A. Key Issues and the Identification of the Core Problem
This section is derived from the Strategy for Agriculture and Water, which presents the agreed-upon strategy for rural development in the Ministry of Agriculture, Forestry and Fisheries (MAFF) and the Ministry of Water Resources and Meteorology (MOWRAM) after wide consultations within the ministries, beneficiary stakeholders, and development partners. The Asian Development Bank (ADB) has a particular interest in the strategy as it forms the basis of both the upcoming Water Resources Management Sector Development Program, as well as ADB’s Sector Assessment, Strategy, and Road Map (ADB 2010).
The analysis conducted in the previous sections of this report indicate a large number of constraints and problems affecting the capacity of the MAFF, MOWRAM, and the Ministry of Rural Development (MRD) to meet the goal to contribute to poverty reduction, food security, and economic growth by enhancing agricultural productivity and diversification and by improving water resources development and management. These areas for improvement can be grouped into six overall problem areas, such as (i) policy and legal framework are unable to contribute to the development of the agriculture and water sectors; (ii) institutions, administration, research, and education are unable to be effective in agricultural and water resources development and management; (iii) the capacity to assemble and utilize agricultural and water-related knowledge, information, and technology transfer is lacking; (iv) agricultural systems and community arrangements are unable to ensure that the poor and food insecure have physical and economic access to sufficient, safe, and nutritious food; (v) management of land and water resources and facilities is unsustainable and unrepresentative; and (vi) agriculture and agribusiness are unable to make effective use of inputs and market opportunities, and are not diversifying production.
To achieve the above, there are institutional and public financial management (PFM) constraints and problems that also need to be addressed as a precondition. These areas for improvement can be grouped into three overall areas: (i) resource constraints and effective implementation of PFM measures, compliance, and budgetary control; (ii) procurement inefficiencies leading to losses and suboptimal value for money; and (iii) governance outcomes. These will take time to produce measurable impact.
1. The Core Problem
By developing a logical series of observations based on the preceding analysis in this report, the core problem has been defined as: Agricultural productivity is stagnant and narrowly based on a few crops. Water resources remain underdeveloped and underperforming. The Core Problem for PFM in rural development was defined as: Reduced investment and funding pledges by the international private sector and donor community in support of Cambodia’s economic and development opportunities are a result of underperforming PFM arrangements and the operational risks from investment.

Cause-and-Effect Analysis for Rural Development and Public Financial Management in the Sector 109
The identification of a core problem is the logical conclusion drawn from an analysis of the immediate and primary causes as presented in Figure 41 and Figure 42, respectively.
Figure 41 Rural Development Problem Tree
MAFF = Ministry of Agriculture, Forestry and Fisheries; MOWRAM = Ministry of Water Resources and Meteorology; REE = rural electricity enterprises; SMEs = small and medium-sized enterprises.
Source: Author.
ImmediateCauses
PrimaryCauses
CoreProblem
Impacts
OverallImpacts
Policy and legal frameworkunable to contribute to the
development of theagriculture andwater sectors
Capacity to assemble andutilize agricultural and
water-related knowledge information and technology
transfer is lacking
Agricultural productivity is stagnant and narrowly based on a few crops.Water resources remain underdeveloped and underperforming
Persistent andincreasing poverty
Reduction infood security
Slow and variableeconomic growth
Reduction and variationagricultural output
Reduction in beneficiary income
Agribusiness and agro-industrial
employment opportunitieslacking
Area planted to cash crops decreased
Value of agriculturalexports decreased
Capital investment inagriculture is low
Imported processedagri-foods are increasing
Slow growth andmorbidity in
agribusiness SMEs
Irrigation servicesare limited
Incidence of drought orflood-affected farmlands
are increasing
Institutions, administration,research and education unable to be effective inagricultural and water
resource development andmanagement
Agricultural systems andcommunity arrangementsare unable to ensure that
the poor and food insecure have physical and
economic access tosufficient, safe and
nutritious food
Unsustainable andunrepresentative
management of land andwater resources and
facilities
Agriculture and agri-business are unable to make effective use of
inputs and market opportunities and are notdiversifying production
• Policy, regulatory frameworks, and laws are yet to be fully implemented• Legal framework for agricultural lands is not fully developed• Legal framework for water licensing and FWUCs is incomplete • Marketing policies are fragmented and inconsistent
• Human resources and management capacity is underdeveloped• The planning, budget, and financial management systems are not fully integrated across line departments and provincial departments• Management Information Systems are not implemented across line departments or provincial departments
• Organizational structure and mechanisms in MAFF and MOWRAM are not able to handle the new challenges facing the agriculture and water sectors• REE capacity limited• Research and technology is underdeveloped
• Community self-reliance for food security and poverty reduction is limited• The Institutional and Policy Environment for Food Security and Nutrition (FSN) has yet to be developed
• Inputs and farm production are lacking• Markets are underdeveloped and market opportunities have not been seized• Extension and outreach does not cover all farmers• Market infrastructure is limited
• Water data management needs to be improved• Integrated water resource management is unimplemented • The development of irrigation and water management infrastructures does not take into account local stakeholder needs or the alternative options• National land resource assessments have yet to be undertaken• Productivity of lowland rice soils is low• Productivity and sustainability of upland soils is low• Smallholder land tenure security and productivity is low• The management of state land resources is underperforming• The implementation of land use and land tenure policies are haphazardly undertaken with little understanding of long-term impact

Rural Development for Cambodia110
Figure 42 Problem Tree for Public Financial Management Reform in Rural Development
• Staff competency is limited in establishing and implementing policies, procedures, and reporting requirements• Overlapping mandates among a number of agencies• PFM and public administration reforms in infancy• Insufficient fiscal checks and balances and limited accessibility to public finances• BP is bargained rather than formula-based• MEF annual budget bears little relation to original PBB planning and budgeting• Continuing inefficiencies in administering revenue collection and enforcing compliance• Inefficient payroll and salary establishment control• Unrealistic projections for budget allocation and limited resources to finance budget• Budget leakages — recording of transactions and preparation of accounts subject to inaccuracies and are noncompliant • Limitations in the quality of external audit function and culture of nonresponse by management of audited entities • Limited capacity of parliamentary oversight and accountability systems
PFM policy, legal framework, andbudget control has limited
procedural and resourcing support
• Tax administration needs further strengthening
• Narrow tax base
Losses and poor value for money
from procurement inefficiencies
• Anticorruption policy is not yet fully operationalized and decentralized through specific procedures and controls
• Procurement frameworks for national and externally funded procurements aligned to international standards is currently under review but not yet operational
• Limited compliance with procurement rules and regulations
• Inefficient use of force account
• Shopping procedures unclear
• Lack of competitiveness under local procurement
• Current procedures need strengthening to ensure effective control over the relationship between internal technical expertise and external technical bids
• Capacity development in Stage 1 of PFMRP was limited and the capacity development in Stage 2 is yet to be fully achieved in line ministries and subnational ministries
• ADB’s A-C policy only applies to its own funded projects as determined by loan/grant agreements and is not fully enforceable in RGC-based initiatives
• The sanctions regime is being strengthened and harmonized with Development Partners for fraudulent and corrupt activity but is not yet operational
Anticorruption policy is sound but has no measurable impact
in the short term
Reduced investment and funding pledges by international private sector and donor community in support of Cambodia’s economic and
development opportunities
Slow and variableeconomic growth
Persistent and highrural poverty levels
Low capital investmentin private sector
Low levels of service delivery and agricultural output
Employment opportunities limited
Low probability to meetsocial progress toward MDGs
Unpredictable funds releasecreates a system of arrears
ImmediateCauses
PrimaryCauses
CoreProblem
Impacts
OverallImpacts
Pro-poor development initiativesunsustainable/low value for money
ADB = Asian Development Bank, BP = budget plan, MDGs = Millennium Development Goals, MEF = Ministry of Economy and Finance, PBB = program-based budgeting, PFM = public financial management, PFMRP = Public Financial Management Reform Program, RGC = Royal Government of Cambodia.
Source: Author.

Cause-and-Effect Analysis for Rural Development and Public Financial Management in the Sector 111
2. Impacts of the Core Problem
The impacts of the core problem are broken down as immediate and overall as shown in Figure 41 and Figure 42, and are briefly discussed in their bottom-to-top relationships. The ultimate, and negative, impacts to the economy are shown as the top set of boxes in Figure 41 and Figure 42.
Low capital investment in the private sector. Agricultural ventures need financial, technical, and managerial assistance aimed at improving their profitability. Primary producers are limited in their ability to diversify because of traditional cropping practices. They are unable to break into new crops or products and, to some degree, are locked into them by donor and government programs that only present information on how to produce more of the same thing and have limited rates of success. Coupled with reduced investment from the public and private sectors due to concerns over the probability of returns to investment because of weak PFM, and with little likelihood of seeing higher profit margins, there is little incentive to invest in better, higher-priced inputs, machinery, or infrastructure, which in turn leads to low service delivery and reducing variable industry output.
Low employment in rural areas. As daily labor costs rise, primary producers and processors look for ways to either diversify into less-demanding crops. Slow growth in the rural economy is the result of all the factors mentioned. Without growth, or even the prospect of future growth, there will be a continued downward spiral and a low probability of meeting the Millennium Development Goals.
Income in the rural areas remains depressed in the face of poor prices and rising production costs. While daily labor wages have nearly doubled in the last few years, they have only barely kept up with the increases in food and energy costs. Rises in agricultural input costs have not been matched by higher sale prices for produce. Increasing income inequality (whether real) fuels tensions among the sectors of society and increases the risk of a destabilized civil society and an increase in crime.
Marketing opportunities are not linked to increased production. Since little attention is paid to quality control and assurance (except by the consumer), there is no incentive to produce a premium product. There is no competitive advantage, or incentive, associated with better prices and increased demand for their products. Income in rural areas remains depressed in the face of poor prices and rising production costs. While daily labor wages have nearly doubled in the last few years, they have only barely kept up with the increases in food and energy costs. Rises in agricultural input costs have not been matched by higher sale prices for produce.
In the face of uncertainties in investment efficiency and effectiveness, private, public, and donor initiatives become uncertain and result in development initiatives becoming unsustainable. Projects become funded on a short-term basis, and when those appear not to be working, they are shut down, and funding is then allocated to the next new idea. Unpredictable funds release creates a system of arrears, and budget credibility is lost.
PFM capacity gaps become the indicators of the future directions in development initiatives. Recognizing that without meaningful interventions to address the weaknesses (and opportunities) in PFM reform there would be little room for optimism, so the initiatives in this area by development partners is a welcome development for the future of the rural sector in Cambodia.
3. Turning Problems into Solutions: The Objective Tree and Improved Sector Outputs
Reformulating the core problem into a core objective implies that a successful program would give rise to enhanced agricultural productivity and diversification and improved water resources development and management. This would have consequent impacts through greater diversity of production; higher success rates in agriculture and water sector programs; improved competitiveness; and higher incomes, increased employment, and finally higher economic growth in rural areas. The overall impact of the intervention would be a higher growth in productivity, a vibrant rural economy, and a reduction in poverty (Figure 43).

Rural Development for Cambodia112
Figure 43 Rural Development Objective Tree
FWUCs = farmer water user communities; MAFF = Ministry of Agriculture, Forestry and Fisheries; MOWRAM = Ministry of Water Resources and Meteorology; REE = rural electricity enterprises; SMEs = small and medium-sized enterprises.
Source: Author.
ImmediateMeans
PrimaryMeans
CoreObjective
Impacts
OverallImpacts
A sound policyand legal framework
to enable developmentof the agricultureand water sectors
A comprehensive andcoordinated capacity to
assemble andutilize agricultural and
water-related knowledge,information and technology
transfer
Enhancing agricultural productivity and diversification and improving water resources development and management
Reduction in povertyImprovement in
food securitySustained
economic growth
Increasingagricultural output
Increasing beneficiary income
Agribusiness and agro-industrial
employment increased
Area planted to cash crops increased
Value of agriculturalexports increased
Capital investment inagriculture increased
Reduction inimported processed
agri-foods
Increase in agribusiness SMEs
Provision ofirrigation services
extended
Incidence of drought orflood-affected farmlands
decreased
A sound institutional,administrative, researchand education as basis
for effective workperformance in
agricultural and waterresource development
and management
Agricultural systems andcommunity arrangements
that enable poor andfood insecure
Cambodians to havesubstantially improvedphysical and economic
access to sufficient, safe,and nutritious food
Sustainable andprop-poor management
of water resources,water management
facilities, water-relatedhazards, and land resourcesthat is integrated, efficient,
and carried out in ariver basin context
Agriculture and agribusiness that makeeffective use of inputs
and market opportunities,are steadily intensifying anddiversifying production, and
deliver full benefits to farmers,rural communities,
and other stakeholders
• Policy, regulatory frameworks, and law are strengthened• Legal framework for agricultural lands is developed• Legal framework for water licensing and FWUCs is developed • Marketing policies are strengthened
• Human resources and management capacity is built• Improve the planning, budget, and financial management systems• Management information systems are implemented
• Organizational structure and mechanisms in MAFF and MOWRAM are improved• REE capacity is built• Research and technology is developed
• Community self-reliance for food security and poverty reduction • Enhancement of institutional and policy environment for Food Security and Nutrition (FSN) and an improved information base
• Inputs and farm production are improved• Markets are developed and market opportunities are expanded• Extension and outreach is improved• Market infrastructure is improved
• Water data management is improved• Development of integrated water management• Continuation of the development of irrigation and water management infrastructures with a more participatory design and in a more integrated way• National land resource assessments are developed• Productivity of lowland rice soils is improved• Productivity of upland soils for sustainable management and utilization is improved• Strengthening of smallholder land tenure security and productivity• Strengthening of the management of state land resources• Strengthening the implementation and impact of land use and land tenure policies

Cause-and-Effect Analysis for Rural Development and Public Financial Management in the Sector 113
The primary causes of the core problem also have primary solutions to achieving the core objective. These are also presented in Figure 43 and form the basis for the proposed interventions outlined next. Improvement can be grouped into six areas as (i) a sound policy and legal framework to enable development of the agriculture and water sectors; (ii) a sound institutional, administrative, research, and educational basis for effective work performance in agricultural and water resources development and management; (iii) a comprehensive and coordinated capacity to assemble and utilize agricultural and water-related knowledge, information, and technology transfer; (iv) agricultural systems and community arrangements that enable poor and food insecure Cambodians to have improved physical and economic access to sufficient, safe, and nutritious food; (v) sustainable and pro-poor management of water resources, water management facilities, water-related hazards, and land resources that is integrated, efficient, and carried out in a river basin context; and (vi) agriculture and agribusiness that make effective use of inputs and market opportunities are steadily intensifying and diversifying production, and deliver full benefits to farmers, rural communities, and other stakeholders.
In terms of PFM in the rural sector, the areas for improvement can be grouped into three overall areas as (i) sound PFM policies, strengthened legal frameworks, and institutionalized budget control processes within all three rural development ministries; (ii) increase procurement efficiencies, which will result in value for money from investment projects; and (iii) good governance and an effective and enforced anticorruption policy.
The following two subsections provide an overview of the main program components and a program logical framework for (i) the strengthening of the agriculture and water sectors, and (ii) the PFM systems needed to be put in place to achieve the former objective.
B. Strengthening the Agriculture and Water Sectors: Program Components and Logical Framework
The long-term program goal is “to contribute to poverty reduction, food security, and economic growth through (a) enhancing agricultural productivity and diversification and (b) improving water resources development and management” (TWGAW 2007, p. 11). This section briefly reviews the main program outputs and provides a higher-level logical framework for illustrative purposes. The full program logical framework is contained in the Strategy for Agriculture and Water program design document (MAFF and MOWRAM 2010) and is summarized in Table 42.
The program is a rolling medium- to long-term program that would comprise 24 components arranged over six pillars (Figure 44).
The six pillars of the strategy are designed as three enabling pillars and three core or implementing pillars. Pillar A sets the overarching policies and enabling environment for the strategy, while pillars B and C provide the capacity building to MAFF and MOWRAM for them to implement the activities. Pillars D, E, and F serve as the main implementation vehicle for the strategy, concentrating on delivering interventions and services in food security, water resources management and agricultural land management, and finally agricultural business and marketing. It is worth emphasizing that crosscutting services such as gender mainstreaming functions and extension services are fully embedded in pillars D, E, and F.
The program is designed at the national level with the aim of strengthening the enabling environment, while mobilizing natural, human, and financial resources to empower national and subnational authorities, communities, and families to manage agricultural and water resources; increasing the productivity of agriculture; and enabling secure food supplies and economic growth in the face of increasing challenges such as droughts, floods, and climate change.

Rural Development for Cambodia114
Overall program impact ex�pected. The program will lead to significant longer-term impact of the capacity of MAFF and MOWRAM to perform their mandated functions in the agriculture and water resources sectors and to support the implementation of the implementing pillars D, E, and F. In relation to the intermediate outputs contributing to the program goal, the program is expected to achieve the following results.
Output A. MAFF and MOWRAM will implement and enforce policies, plans, laws, and regulations for which they are responsible. Ministerial prakas will be issued, devolving the implementation of development programs to provincial departments, as mandated under the Organic Law.
Output B. Facilities and equipment will be improved. An increase in performance and output in organizational capacity in planning, administration, management (i.e., financial and contract management; human resources management; information management; engineering and public works; and project management, monitoring, and evaluation) at the national and provincial levels will also be observed. Information systems will be implemented. A gender unit in MAFF and MOWRAM will be functioning and fully funded to implement gender-mainstreaming policies, and gender action plans will be updated yearly and implemented.
Figure 44 Strategy for Agriculture and Water Resources, 2009–2013 Implementation Pillars
D. Food Security
C. Research and Education
B. InstitutionalCapacity Building
and Human ResourcesDevelopment
A. Policy and
Regulations
Crosscutting Interventions and Extension Services
Overarching Policies andEnabling Environment
Capacity Building
Implementing Pillarsof the Strategy
Crosscutting Themes
E. Water Resource
Managementand
AgriculturalLand
Management
F. Agricultural Business and
Marketing
Source: Based on MAFF and MOWRAM (2010).
Cause-and-Effect Analysis for Rural Development and Public Financial Management in the Sector 115
Output C. Training institutes’ facilities and curriculums will be improved, and strategic and applied research and technologies will be developed and adopted that are pro-poor, pro-women, and pro-environment. Capacity for research, extension, and education will be built, and partnerships with national and international institutes will be strengthened. Training will be provided to directors, senior staff, and provincial staff of the MAFF and MOWRAM as well as to farmer water user communities (FWUCs). Agriculture processing technology will be improved, and niche products will meet market needs. Commune councils and rural communities will develop and implement community development plans for communal aspects of agriculture, agribusiness, and water management, and all action plans will incorporate gender policy.
Output D. Beneficiary farmers will benefit from extension, technology transfer, improved production training, and sets of low-input and improved technical packages. They will be organized into groups and conduct smallholder farming activities based on the principles of sustainable and good agricultural practices and natural resources management. Community projects will be implemented using participatory planning techniques. Communities will be involved in the local planning processes under the provisions of the Organic Law. Finally, food security concepts will be integrated into development programs and policy.
Output E. The Tonle Sap Authority will develop and implement an integrated water resources management plan for the Tonle Sap and connected river basins. The MOWRAM and MAFF will develop and implement a water resources and agricultural resources management data collection and dissemination system. Provincial and local authorities, farmers, and other stakeholders will be involved in integrated water resources management and irrigation infrastructure planning and implementation. An inventory and appraisal of land and water resources will be carried out. Master plans and identified priorities for land and water resources utilization will be implemented. Agricultural and economic productivity of lowland and upland areas and cropping systems will be assessed, and subsequent land-use plans will be implemented. The MAFF and MOWRAM will provide extension services for increased agriculture and water productivity in irrigable and rainfed croplands; 100,000 hectares of wetland and dryland irrigation (25,000 hectares per annum) will be constructed; and sustainable water management, harvesting, and use practices will be adopted by beneficiary farmers. Land-use certificates will be provided to smallholder farmers, and communal land rights will be provided to indigenous communities. The MOWRAM and MAFF will develop and implement a drought and flood forecasting system that provides timely warning to local authorities and farmers on the likely incidence and severity of events as well as appropriate drought and flood mitigation measures.
Output F. Beneficiary farmers will have access to rural financial packages and contract farming agreements (i.e., agricultural insurance products, long-term loans through the Rural Development Bank and financial institutions, and leasing arrangements) to provision agriculture and water public and private extension services to increase and sustain agricultural productivity. Beneficiary farmers, agriculture merchants, suppliers, and traders, through the coordination of a national network supported by the Department of Agricultural Extension, will have adopted high-value crop production, appropriate farm mechanization technologies, and alternative delivery mechanisms that are proven to increase agricultural yields and quality. Marketplaces will have the human, financial, and infrastructure resources to store, grade, package, process, and transport agricultural products. Farmers will be linked directly with high-value markets, agri-clinics, and SMEs to enable trade in agricultural products supported by farmer marketing schools, market-led extension services, farmer contract law, and subdecrees. Finally, exports in certified processed agri-food products that meet international standards will increase by 20%.

Rural Development for Cambodia116
Budget Indicators Source of Verification Assumptions and Risks
Overall Goal:
To contribute to poverty reduction, food security, and economic growth through (i) enhancing agricultural productivity and diversification, and (ii) improving water resources development and management
Program = $489,815,000; program management support = $11,480,000; total program cost = $501,295,000
• Agricultural output increased by 20% over 4 years
• Beneficiary income increased by 20% over 4 years
• Employment in agribusiness and agro-industrial sector increased by 20% over 4 years
• Area planted to cash crops increased by 20% over 4 years
• Value of agricultural exports increased by 30% over 4 years
• Value of formal bank loans for capital investment in agriculture increased by 25% over 4 years
• Volume of imported processed agri-foods decreased by 20% over 4 years
• Number of agribusiness SMEs increased by 10% over 4 years
• Area of cropping land with access to irrigation services is increased by 100,000 hectares over 4 years
• Incidence of drought or flood-affected farmlands reduced by 20% over 4 years
• Annual statistics
• MAFF and MOWRAM annual reports
• Monitoring and evaluation reports
Output A. Creation of a sound policy and legal framework to enable development of the agriculture and water sectors
$6,210,000 • MAFF and MOWRAM implement and enforce policies, plans, laws, and regulations for which they are responsible.
• Ministerial prakas are issued devolving the implementation of development programs to provincial departments, as mandated under the Organic Law.
• MAFF and MOWRAM annual reports
• Interministerial circulars
• Program management support unit reports
• Steering committee reports
• Subdecrees and prakas’
• Technical report
• Project reviews
Assumptions
Government accords high priority to program implementation.
Resource allocations are provided to fund the program from donor and government budgets.
The market economy is able to provide sufficient stimulus to increase productivity and diversify agriculture.
The investments outlined in the program document are net additive to the ongoing or currently planned pipeline investments.
Table 42 Final Goal and Output: Harmonized Logical Framework for Rural Development
continued next page
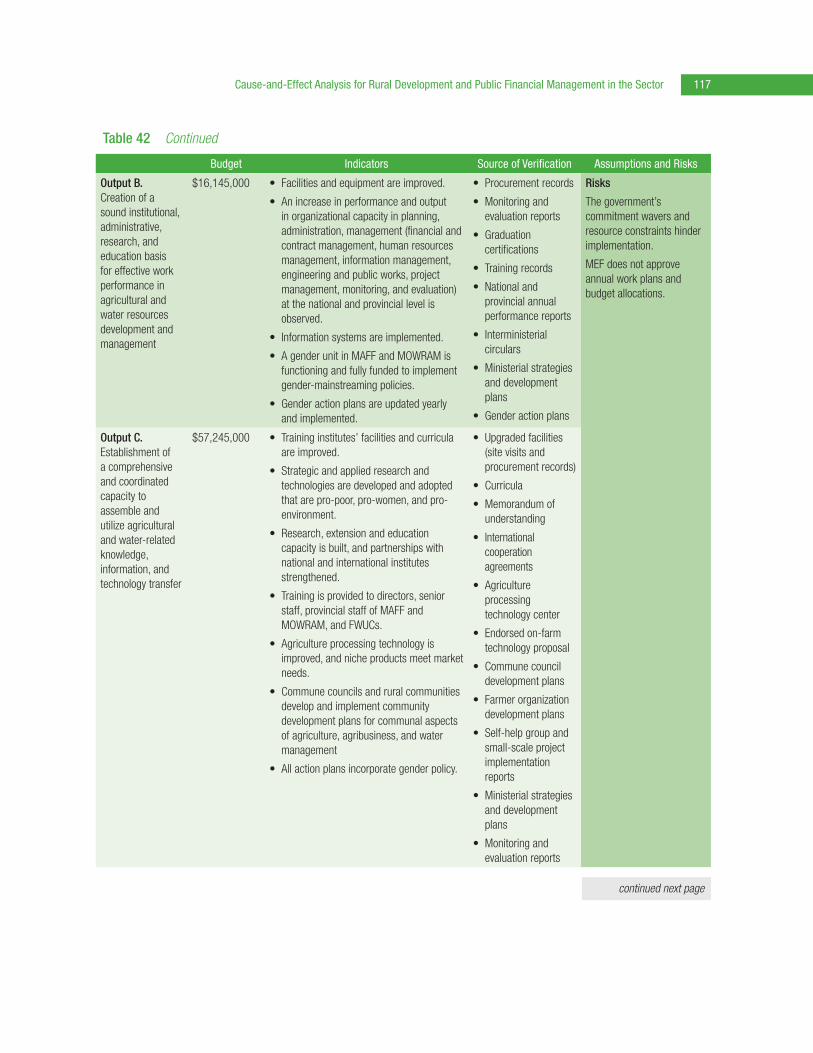
Cause-and-Effect Analysis for Rural Development and Public Financial Management in the Sector 117
Budget Indicators Source of Verification Assumptions and Risks
Output B. Creation of a sound institutional, administrative, research, and education basis for effective work performance in agricultural and water resources development and management
$16,145,000 • Facilities and equipment are improved.
• An increase in performance and output in organizational capacity in planning, administration, management (financial and contract management, human resources management, information management, engineering and public works, project management, monitoring, and evaluation) at the national and provincial level is observed.
• Information systems are implemented.
• A gender unit in MAFF and MOWRAM is functioning and fully funded to implement gender-mainstreaming policies.
• Gender action plans are updated yearly and implemented.
• Procurement records
• Monitoring and evaluation reports
• Graduation certifications
• Training records
• National and provincial annual performance reports
• Interministerial circulars
• Ministerial strategies and development plans
• Gender action plans
Risks
The government’s commitment wavers and resource constraints hinder implementation.
MEF does not approve annual work plans and budget allocations.
Output C. Establishment of a comprehensive and coordinated capacity to assemble and utilize agricultural and water-related knowledge, information, and technology transfer
$57,245,000 • Training institutes’ facilities and curricula are improved.
• Strategic and applied research and technologies are developed and adopted that are pro-poor, pro-women, and pro-environment.
• Research, extension and education capacity is built, and partnerships with national and international institutes strengthened.
• Training is provided to directors, senior staff, provincial staff of MAFF and MOWRAM, and FWUCs.
• Agriculture processing technology is improved, and niche products meet market needs.
• Commune councils and rural communities develop and implement community development plans for communal aspects of agriculture, agribusiness, and water management
• All action plans incorporate gender policy.
• Upgraded facilities (site visits and procurement records)
• Curricula
• Memorandum of understanding
• International cooperation agreements
• Agriculture processing technology center
• Endorsed on-farm technology proposal
• Commune council development plans
• Farmer organization development plans
• Self-help group and small-scale project implementation reports
• Ministerial strategies and development plans
• Monitoring and evaluation reports
Table 42 Continued
continued next page

Rural Development for Cambodia118
Budget Indicators Source of Verification Assumptions and Risks
Output D. Establishment of agricultural systems and community arrangements that enable poor and food insecure Cambodians to have substantially improved physical and economic access to sufficient, safe, and nutritious food at all times to meet their dietary needs and food preferences for an active and healthy life
$44,665,000 • Farmers are benefited by extension, technology transfer, improved production training, and sets of low-input and improved technical packages.
• Beneficiary farmers are organized into groups and conduct smallholder farming activities based on the principles of sustainable and good agricultural practices and natural resources management.
• Community projects are implemented using participatory planning techniques.
• Communities are involved in the local planning processes under the provisions of the Organic Law.
• Food security concepts are integrated into development programs and policy.
• MAFF and MOWRAM annual reports
• National and provincial annual performance reports
• Program management support unit reports
• Monitoring and evaluation reports
• Steering committee reports
• Policy review report
Output E. Facilitation of sustainable and pro-poor management of water resources, water management facilities, water-related hazards, and land resources that is integrated, efficient, and carried out in a river basin context
$283,790,000 • The Tonle Sap Authority develops and implements an integrated water resources management plan for the Tonle Sap and connected river basins.
• MOWRAM and MAFF develop and implement a water resources management and agricultural resources management data collection and dissemination system.
• Provincial and local authorities, farmers, and other stakeholders are involved in integrated water resources management and irrigation infrastructure planning and implementation.
• An inventory and appraisal of land and water resources are carried out.
• Master plans and identified priorities for land and water resources utilization are implemented.
• Agricultural and economic productivity of lowland and upland areas and cropping systems are assessed, and subsequent land use plans are implemented.
• MAFF and MOWRAM provide extension services for increased agriculture and water productivity.
• MAFF and MOWRAM provide extension services for increased agriculture and water productivity in irrigable and rainfed croplands.
• Subdecrees and prakas
• Ministry of Land Management, Urban Planning, and Construction; MAFF; and MOWRAM annual reports
• National and provincial annual performance reports
• Program management support unit reports
• Monitoring and evaluation reports
• Steering committee reports
Table 42 Continued
continued next page

Cause-and-Effect Analysis for Rural Development and Public Financial Management in the Sector 119
Table 42 Continued
Budget Indicators Source of Verification Assumptions and Risks
• 100,000 hectares of wetland and dryland irrigation are constructed, and sustainable water management, harvesting, and land use practices are adopted by beneficiary farmers.
• Land use certificates are provided to smallholder farmers.
• Communal land rights are provided to indigenous communities.
• MOWRAM and MAFF develop and implement a drought and flood forecasting system that provides timely warning to local authorities and farmers on the likely incidence and severity of events.
• MOWRAM and MAFF develop and implement drought and flood mitigation measures.
Output F. Facilitation of agriculture and agribusiness that make effective use of inputs and market opportunities, are steadily intensifying and diversifying production, and deliver full benefits to farmers, rural communities, and other stakeholders
$81,760,000 • Beneficiary farmers have access to rural financial packages and contract farming agreements (i.e., agricultural insurance products, long-term loans through the Rural Development Bank and financial institutions, and leasing arrangements) to provision agriculture and water public and private extension services to increase and sustain agricultural productivity.
• Beneficiary farmers, agriculture merchants, suppliers, and traders, by coordination of a national network supported by the Department of Agricultural Extension, have adopted high-value crop production, appropriate farm mechanization technologies, and alternative delivery mechanisms that are proven to increase agricultural yields and quality.
• Marketplaces have the human, financial, and infrastructure resources to store, grade, package, process, and transport agricultural products.
• Farmers are linked directly with high-value markets, agri-clinics, and SMEs (through information and communications technology applications and rural networks) to enable trade in agricultural products supported by farmer marketing schools, market-led extension services, farmer contract law, and subdecrees.
• Export of certified processed agri-food products that meet international standards increases by 20%.
• Commercial bank long-term guarantees
• Commercial bank credit lines
• Rural financial systems
• Alternative agricultural insurance products
• Farmer contract law and subdecrees
• 10 farmer marketing schools
• Ministry of Commerce export trade records
• National and provincial annual performance reports
• Program management support unit reports
• Monitoring and evaluation reports
• Steering committee reports
• Memorandum of understanding
FWUCs = farmer water user communities; MAFF = Ministry of Agriculture, Forestry and Fisheries; MEF = Ministry of Economy and Finance; MOWRAM = Ministry of Water Resources and Meteorology; SMEs = small and medium-sized enterprises.
Source: High-level logframe from MAFF and MOWRAM (2010).

Rural Development for Cambodia120
C. Strengthening Public Financial Management for Rural Development: Program Components and Logical Framework
This section briefly reviews the main program outputs of the recently approved Public Financial Management for Rural Development Program, Subprogram 2 and provides a higher-level logical framework for illustrative purposes, summarized in Table 43.
The program, approved by ADB and the government, is a rolling medium- to long-term program to guide the implementation of individual projects and actions aimed at improving PFM in rural development through (i) providing a sound PFM policy and legal framework; (ii) ensuring that budget control and procurement practices are institutionalized; and (iii) ensuring that the government and ADB governance policies are made fully operational and provide a measurable impact.
For the rural development ministries, the program supported the establishment of a PFM coordination group, chaired by high-ranking senior management from MEF and empowering working groups in MAFF, MOWRAM, and MRD with knowledge and skills associated with ADB capacity-building initiatives. This results in working groups becoming the leaders for budget reforms and improved accounting processes in the three rural development ministries. Major strides have been made in revenue management and the rationalization of bank accounts, whereby the three rural development ministries are now making more use of the centralized government system, contributing to improved revenue raising and expenditure rationalization. This, combined with the adoption of Management for Development Results and monitoring and evaluation systems in budget execution, has led to better use and allocation of resources, particularly in the formulation of the budget strategic plan and budget plan for 2012–2014.
Overall program impact ex�pected. As to intermediate outputs contributing to the program goal, the program is expected to achieve (i) output 1, a sound PFM policy and legal framework; (ii) output 2, institutionalized budget control and procurement practices; and (iii) output 3, the government and ADB governance measures made fully operational and providing a measurable impact.
The program will institutionalize these governance regime elements and directly benefit targeted beneficiaries. However, the program and the perceived governance program will have many knock-on effects, such as increased capacity of government staff to create and manage budget formulation and expenditures, and more efficient recording and reporting of budget execution against an agreed on and credible budget. It will provide an integrated budget, incorporating program budgeting, budget strategic plans, and budgets of externally financed programs and projects in ministry strategic budget plans and annual budget plans.
Accountability and transparency will be increased by the creation of budget entities and budget holders, where both organizational and individual responsibility can be readily and transparently identified. Revenue generation will be enhanced, and the population will be more able to gauge that the value for money in the expenditure of the generated expenditure (from, for example, better customs practices) is more in line with expectations.

Cause-and-Effect Analysis for Rural Development and Public Financial Management in the Sector 121
Tabl
e 43
Lo
gica
l Fra
mew
ork
for P
ublic
Fin
anci
al M
anag
emen
t in
Rura
l Dev
elop
men
t
Outp
uts
Key
Activ
ities
Indi
cato
rsSo
urce
of V
erifi
catio
nAs
sum
ptio
ns a
nd R
isks
PFM
To in
stitu
tiona
lize
polic
y, le
gal
fram
ewor
k, a
nd
budg
et c
ontro
l
•Pr
ovid
e su
ppor
t to
deve
lop
and
faci
litat
e tra
inin
g co
urse
s fo
r cap
acity
bui
ldin
g th
roug
h th
e di
ssem
inat
ion
and
unde
rsta
ndin
g of
pol
icy
and
lega
l fra
mew
orks
.
•Re
view
and
upd
ate
the
SOPs
, FM
M, a
nd P
M fo
r ext
erna
lly
fund
ed p
roje
cts.
•De
velo
p SO
P, FM
M, a
nd P
M tr
aini
ng c
ours
es a
nd m
ater
ials
in
fina
ncia
l pol
icie
s an
d st
anda
rds;
ele
men
ts o
f int
erna
l co
ntro
l; fin
anci
al a
ccou
ntin
g sy
stem
, led
gers
, and
jour
nals
; ba
nk a
ccou
nts
and
cred
it an
d gr
ant w
ithdr
awal
s; p
roje
ct
expe
nditu
re, a
udit,
and
cou
nter
part
fund
s w
ithdr
awal
s;
and
prov
isio
ns u
nder
the
finan
cing
agr
eem
ent a
nd A
DB
proc
urem
ent a
nd c
onsu
lting
gui
delin
es.
•Im
plem
ent t
rain
ing
wor
ksho
ps to
exe
cutin
g an
d im
plem
entin
g ag
enci
es in
sub
ject
s ou
tline
d ab
ove.
•Es
tabl
ish
PFM
wor
king
gro
ups
in e
ach
of th
e ru
ral
deve
lopm
ent m
inis
tries
acr
oss
a br
oad
rang
e of
ad
min
istra
tive
and
tech
nica
l dep
artm
ents
.
•Fa
cilit
ate
revie
ws
and
reco
mm
enda
tions
for t
he
impr
ovem
ent o
f rel
evan
t pol
icie
s, le
gal f
ram
ewor
k,
and
budg
et c
ontro
l mea
sure
s in
con
sulta
tion
with
PF
M w
orki
ng g
roup
s.
•TA
pro
ject
s re
crui
ted
begi
nnin
g ye
ar 1
•Tr
aini
ng m
anua
ls a
nd g
uide
lines
de
velo
ped
by m
id-y
ear 1
•Tr
aini
ng w
orks
hops
and
re
fresh
ers
run
ever
y m
onth
be
ginn
ing
from
mid
-yea
r 1
•PF
M w
orki
ng g
roup
est
ablis
hed,
an
d ro
les
and
resp
onsi
bilit
ies
agre
ed b
y en
d of
yea
r 1
•Re
leva
nt p
olic
ies,
lega
l fra
mew
ork,
and
bud
get c
ontro
l m
easu
res
deve
lope
d by
end
of
year
2
•Ex
tern
al fi
nanc
e da
taba
se
func
tiona
l by
mid
-yea
r 3
•Fi
nanc
ial m
anag
emen
t and
SOP
m
anua
ls in
Eng
lish
by m
id-y
ear 3
•Co
nsol
idat
ion
of b
ank
acco
unts
, ne
w c
hart
of a
ccou
nts
budg
et
class
ifica
tion,
and
BSP
ac
com
plish
ed b
y en
d of
yea
r 3
•TA
term
s of
refe
renc
e an
d co
ntra
cts
•Tr
aini
ng m
anua
ls a
nd
guid
elin
es
•At
tend
ance
and
per
form
ance
re
cord
s
•PF
M w
orki
ng g
roup
at
tend
ance
reco
rds
and
mee
ting
min
utes
•Re
leva
nt p
olic
ies
and
lega
l fra
mew
ork
endo
rsed
by
min
istri
es
•Fi
nanc
ial r
epor
ts fr
om
data
base
•Fi
nanc
ial m
anag
emen
t and
SO
P m
anua
ls in
Eng
lish
•Co
nsol
idat
ion
of b
ank
acco
unts
, new
cha
rt of
ac
coun
ts b
udge
t cla
ssifi
catio
n,
and
BSP
Assu
mpt
ions
SOPs
, FM
M, a
nd P
M a
re
not r
equi
red
in K
hmer
.
The
cons
ulta
tion
proc
ess
for t
he S
OPs,
FM
M, a
nd
PM p
rovid
es a
con
sens
us
amon
g al
l dev
elop
men
t pa
rtner
s an
d th
e go
vern
men
t.
Guid
elin
es c
over
ing
BSP
form
ulat
ion
are
prod
uced
on
a tim
ely
man
ner f
rom
MEF
, an
d th
e ca
paci
ty-b
uild
ing
prog
ram
enh
ance
s m
inist
ry
capa
city
to p
rodu
ce B
SP.
Risk
The
char
t of a
ccou
nts
and
budg
et c
lass
ifica
tions
ar
e de
pend
ent o
n M
EF
prod
ucin
g fra
mew
orks
for
use
in th
e FM
IS.
To s
uppo
rt PF
M
deco
ncen
tratio
n an
d in
tegr
atio
n
•De
velo
p an
d fa
cilit
ate
PFM
inte
grat
ion
and
awar
enes
s-ra
isin
g ca
mpa
ign
targ
eted
at m
inis
try m
anag
emen
t to
deve
lop
com
mitm
ent t
o re
form
pro
cess
.
•Fa
cilit
ate
esta
blis
hmen
t of c
lear
role
s an
d re
spon
sibi
litie
s be
twee
n M
EF d
epar
tmen
ts a
nd P
FM a
reas
by
assi
stin
g th
e ru
ral d
evel
opm
ent m
inis
tries
to c
ompl
ete
a fu
nctio
nal
revie
w o
f ope
ratio
ns.
•As
sist
the
rura
l dev
elop
men
t min
istri
es to
cre
ate
a fu
nctio
nal r
evie
w a
ctio
n pl
an a
s re
ques
ted
by th
e M
inis
try
of In
terio
r.
•En
sure
coo
rdin
atio
n be
twee
n de
cent
raliz
atio
n an
d de
conc
entra
tion
initi
ative
s an
d PF
M im
prov
emen
ts.
•PF
M in
tegr
atio
n an
d
awar
enes
s-ra
isin
g ca
mpa
ign
run
inte
nsive
ly ov
er th
e fir
st
6 m
onth
s of
the
prog
ram
•Ro
les
and
resp
onsi
bilit
ies
deve
lope
d an
d ag
reed
by
m
id-y
ear 1
•Aw
aren
ess-
rais
ing
wor
ksho
p he
ld to
laun
ch th
e fu
nctio
nal
revie
w p
roce
ss a
nd to
cre
ate
awar
enes
s of
the
func
tiona
l re
view
act
ion
plan
Atte
ndan
ce re
cord
s
Role
s an
d re
spon
sibi
litie
s en
dors
ed
Func
tiona
l rev
iew
act
ion
plan
co
mpl
eted
Assu
mpt
ion
PFM
RP is
act
ively
enga
ging
st
akeh
olde
rs to
dev
elop
un
ders
tand
ing
and
com
mitm
ent,
and
this
co
mpo
nent
bui
lds
on th
at
effo
rt.
Risk
The
revie
w p
roce
ss
does
not
incl
ude
enou
gh
repr
esen
tativ
es fr
om
subn
atio
nal g
over
nmen
ts.
cont
inue
d ne
xt p
age

Rural Development for Cambodia122
Outp
uts
Key
Activ
ities
Indi
cato
rsSo
urce
of V
erifi
catio
nAs
sum
ptio
ns a
nd R
isks
To im
prov
e bu
dget
co
mpr
ehen
sive
ness
an
d tra
nspa
renc
y w
ith e
ffect
ive
finan
cial
ac
coun
tabi
lity
•Te
chni
cal s
uppo
rt to
the
cont
inua
tion
of P
FMRP
su
bpro
gram
1 p
lann
ed a
ctivi
ties
to im
prov
e cr
edib
ility
of
the
budg
et
•Su
ppor
t to
the
cont
inua
tion
of P
FMRP
sub
prog
ram
2
plan
ned
activ
ities
cov
erin
g ro
les,
func
tions
, and
re
spon
sibi
litie
s; in
cent
ives
and
sanc
tions
; bud
get
clas
sific
atio
n an
d ch
art o
f acc
ount
s; b
udge
t exe
cutio
n an
d tra
nsac
tions
; acc
ount
ing
and
finan
cial
repo
rting
; int
erna
l au
ditin
g an
d in
spec
tion;
fisc
al d
ecen
traliz
atio
n; a
nd
inst
itutio
nal c
apac
ity a
nd m
otiva
tion
•Ne
w b
udge
t cla
ssifi
catio
n an
d ch
art o
f acc
ount
s de
velo
ped
by y
ear 2
•Pr
ogra
m b
udge
ting
esta
blis
hed
by y
ear 2
•Pr
ogra
m b
udge
ting
inte
grat
ed
with
a B
SP m
etho
dolo
gy
deve
lope
d by
yea
r 3
•Bu
dget
inte
grat
es re
curre
nt
capi
tal (
incl
udin
g ex
tern
ally
finan
ced
expe
nditu
re) a
nd d
ata
for
publ
icly
owne
d ag
enci
es b
y ye
ar 3
•M
etho
dolo
gies
and
gui
delin
es
deve
lope
d fo
r int
erna
l aud
it an
d in
spec
tion
•BS
P ac
cept
ed b
y M
EF a
nd
incl
udes
app
ropr
iate
mon
itorin
g an
d ev
alua
tion
indi
cato
rs
Assu
mpt
ions
The
char
t of a
ccou
nts
and
budg
et c
lass
ifica
tion
will
be
deve
lope
d an
d su
ppor
ted
by
an M
EF d
ecre
e in
a ti
mel
y m
anne
r.
PFM
RP s
ubpr
ogra
m 2
is
faci
litat
ed b
y gu
idel
ines
and
a
circ
ular
from
MEF
.
Risk
The
time
betw
een
train
ing
and
actu
al im
plem
enta
tion
is s
o lo
ng th
at c
apac
ity-
build
ing
gain
s ar
e lo
st.
To a
lign
prog
ram
bu
dget
with
MEF
an
nual
bud
get
•TA
sup
port
to P
FM w
orki
ng g
roup
and
to th
e bu
dget
fo
rmul
atio
n co
mm
ittee
to s
treng
then
the
budg
et
prep
arat
ion
proc
ess
•TA
faci
litat
ion
of w
orks
hops
with
PFM
wor
king
gro
up to
di
ssem
inat
e SO
P an
d FM
M a
pplic
atio
ns a
nd a
rrang
emen
ts
durin
g PA
M fo
rmul
atio
n
•Pr
ogra
m b
udge
ting
fully
alig
ned
with
MEF
bud
get o
n an
ann
ual
basi
s (w
ith b
udge
t var
iatio
ns
auth
orize
d)
•PB
is fu
lly a
ligne
d w
ith M
EF
budg
et o
n an
ann
ual b
asis
.As
sum
ptio
nAl
l pro
ject
var
iatio
ns a
re
gove
rned
by
the
loan
and
gr
ant a
gree
men
ts a
nd a
re
not s
ubje
ct to
mid
-yea
r re
visio
ns, a
s go
vern
men
t bu
dget
s ar
e no
t sub
ject
to
mid
-yea
r rev
isio
ns.
To in
crea
se
pred
icta
bilit
y an
d co
ntro
l in
budg
et
exec
utio
n
•Es
tabl
ish
budg
et e
ntiti
es a
nd b
udge
t hol
ders
to e
nsur
e ac
coun
tabi
lity.
•Es
tabl
ish
a re
porti
ng re
gim
e ba
sed
on a
mon
itorin
g an
d ev
alua
tion
syst
em u
sing
the
BSP
as b
asel
ine
data
.
•Pr
ovid
e su
ppor
t to
budg
et fo
rmul
atio
n pr
oces
ses
to e
nsur
e th
at th
e ag
reed
pro
gram
bud
get i
s re
alis
tic, r
efle
cts
the
gove
rnm
ent p
olic
ies
and
stra
tegi
es, a
nd in
clud
es
exte
rnal
ly fin
ance
d pr
ogra
ms
and
proj
ects
.
•TA
sup
port
to th
e PF
MRP
sub
prog
ram
2 o
bjec
tives
to
furth
er im
prov
e re
venu
e po
licy
and
adm
inis
tratio
n of
the
prov
isio
ns u
nder
the
Reve
nue
Polic
y 20
09.
•In
stitu
tiona
l stru
ctur
e ag
reed
with
M
EF re
flect
s ru
ral d
evel
opm
ent
min
istry
func
tiona
l res
pons
ibilit
ies
base
d on
the
func
tiona
l rev
iew
ca
rried
out
by
TA
•M
onito
ring
and
eval
uatio
n sy
stem
es
tabl
ishe
d fo
r the
BSP
•Gu
idel
ines
and
tech
nica
l not
es
crea
ted
for t
he fo
rmul
atio
n of
th
e BS
P an
d pr
ogra
m b
udge
ting
each
yea
r
•Bu
dget
repo
rts
•M
inis
try e
ndor
sem
ent o
f new
pr
oced
ures
with
gui
delin
es
•W
orks
hops
hel
d to
di
ssem
inat
e ne
w p
roce
dure
s
•Re
venu
e po
licy
adm
inis
tratio
n pr
oced
ures
Assu
mpt
ion
The
reve
nue
polic
y of
200
9 is
impl
emen
ted.
Risk
sDi
ssem
inat
ion
of a
ny n
ew
guid
elin
es a
nd te
chni
cal
note
s ar
e on
ly at
the
natio
nal l
evel
in c
entra
l ad
min
istra
tive
depa
rtmen
ts
and
are
not d
eepe
ned
to lo
wer
leve
ls o
f the
ad
min
istra
tion
in th
e ru
ral
deve
lopm
ent m
inis
tries
.
cont
inue
d ne
xt p
age
Tabl
e 43
Co
ntin
ued

Cause-and-Effect Analysis for Rural Development and Public Financial Management in the Sector 123
Outp
uts
Key
Activ
ities
Indi
cato
rsSo
urce
of V
erifi
catio
nAs
sum
ptio
ns a
nd R
isks
•Re
venu
e co
llect
ion
yield
ach
ieve
s 5%
gro
wth
abo
ve G
DP re
al g
row
th
and
infla
tion
by e
nd o
f yea
r 3
•In
crea
se in
non
tax
reve
nue
is
5% a
bove
GDP
real
gro
wth
and
in
flatio
n by
end
of y
ear 3
•Re
venu
e ou
tturn
clo
se to
ta
rget
ed le
vel i
n ap
prov
ed b
udge
t by
end
of y
ear 3
•Re
venu
e po
licy
adm
inis
tratio
n pr
oced
ures
enh
ance
d by
end
of
year
3
The
budg
et e
ntiti
es a
nd
budg
et h
olde
rs a
re s
till
subj
ect t
o hi
erar
chy
cont
rol,
whi
ch e
ffect
ively
nega
tes
any
dele
gate
d au
thor
ity.
To u
pgra
de
acco
untin
g,
reco
rdin
g, a
nd
repo
rting
sys
tem
s
•Su
ppor
t to
the
PFM
RP s
ubpr
ogra
m 2
for t
he im
plem
enta
tion
of F
MIS
to re
plac
e th
e m
anua
l acc
ount
ing
syst
em
•Su
ppor
t to
the
PFM
RP s
ubpr
ogra
m 2
to d
evel
op F
MIS
m
onito
ring
arra
ngem
ents
•Su
ppor
t to
the
PFM
RP s
ubpr
ogra
m 2
to s
treng
then
in
tern
al a
udit
cove
rage
and
cap
acity
in M
EF a
nd li
ne
min
istri
es
•Es
tabl
ish
annu
al F
MIS
trai
ning
and
wor
ksho
p pl
an w
ith a
n es
timat
ed b
udge
t
•Se
t tra
inin
g an
d w
orks
hop
elig
ibilit
y ru
les
and
cost
and
re
imbu
rsem
ent g
uide
lines
•FM
IS o
pera
tiona
lized
by
2014
•FM
IS m
onito
ring
arra
ngem
ents
fin
alize
d by
end
of 2
013
•M
EF a
nd li
ne d
epar
tmen
ts h
ave
impr
oved
inte
rnal
aud
it co
vera
ge
by m
id-y
ear 2
•FM
IS tr
aini
ng w
orks
hop
plan
and
bu
dget
dev
elop
ed b
y en
d of
yea
r 20
12
•Tr
aini
ng a
nd w
orks
hop
elig
ibilit
y ru
les
and
cost
and
re
imbu
rsem
ent g
uide
lines
de
velo
ped
by e
nd o
f 201
2
•Bu
dget
hol
ders
com
mit
expe
nditu
re in
line
with
bud
gets
an
d ca
sh fl
ow fo
reca
sts
by e
nd
of 2
013
•75
% o
f pay
men
ts to
cre
dito
rs
and
staf
f mad
e th
roug
h ba
nkin
g sy
stem
by
end
of y
ear 2
•60
% o
f tax
reve
nue
colle
cted
th
roug
h ba
nks
by e
nd o
f yea
r 2
•FM
IS re
ports
•FM
IS m
onito
ring
repo
rts
•In
tern
al a
udit
repo
rts
•FM
IS tr
aini
ng a
nd w
orks
hop
plan
with
bud
get
•El
igib
ility
rule
s an
d co
st a
nd
reim
burs
emen
t gui
delin
es
•Ba
nk re
cord
s
Assu
mpt
ions
The
FMIS
is re
ady
to re
plac
e th
e m
anua
l acc
ount
ing
syst
em.
•Th
e FM
IS is
read
y to
“g
o liv
e” b
y 20
14.
Risk
s•
The
FMIS
is fu
rther
de
laye
d.
•Th
e im
plem
enta
tion
sche
dule
will
enda
nger
th
e “g
o liv
e” d
eadl
ine
in 2
014. cont
inue
d ne
xt p
age
Tabl
e 43
Co
ntin
ued

Rural Development for Cambodia124
Outp
uts
Key
Activ
ities
Indi
cato
rsSo
urce
of V
erifi
catio
nAs
sum
ptio
ns a
nd R
isks
To in
crea
se c
apac
ity
in e
xter
nal s
crut
iny
and
audi
t
•De
velo
p a
capa
city
-bui
ldin
g pr
ogra
m to
ass
ist N
AA
capa
city
in e
xter
nal a
uditi
ng, a
s pa
rt of
PFM
RP
•Im
plem
ent c
apac
ity-b
uild
ing
train
ing
prog
ram
to N
AA s
taff
•NA
A ca
paci
ty-b
uild
ing
prog
ram
de
velo
ped
•NA
A au
ditin
g st
aff t
rain
ed
•Sp
ecia
list s
taff
recr
uite
d fo
r NAA
•Pu
blic
fina
nces
(TOF
E) d
evel
oped
•Ex
tern
al a
uditi
ng c
apac
ity-
build
ing
prog
ram
with
trai
ning
sc
hedu
le a
nd b
udge
ts
•At
tend
ance
and
per
form
ance
re
cord
s
•Te
rms
of re
fere
nce
and
cont
ract
s
•Pu
blic
fina
nces
(TOF
E)
regu
larly
ava
ilabl
e w
ithin
2
wee
ks o
f end
of p
erio
d
Assu
mpt
ion
Fund
ing
for c
apac
ity
build
ing
is s
till a
vaila
ble
outs
ide
of th
e PF
MRP
Mul
ti-Do
nor T
rust
Fun
d
Proc
urem
ent
To e
nhan
ce
cent
ral i
nstit
utio
nal
fram
ewor
k fo
r pr
ocur
emen
t
For e
xter
nally
fina
nced
pro
cure
men
ts
•Re
view
and
upd
ate
proc
urem
ent m
anua
l and
SOP
s
•De
velo
p pr
ocur
emen
t man
ual a
nd S
OP tr
aini
ng w
orks
hop
and
train
ing
mat
eria
ls
•Im
plem
ent t
rain
ing
wor
ksho
ps to
the
exec
utin
g an
d im
plem
entin
g ag
enci
es a
nd d
istri
ct a
nd p
rovin
cial
pro
ject
im
plem
enta
tion
pers
onne
l
For n
atio
nally
fina
nced
pro
cure
men
t
•Al
ign
train
ing
prog
ram
s w
ith th
e ne
w L
aw o
n Pu
blic
Pr
ocur
emen
t as
draf
ted
by C
OM in
201
1
•SO
P an
d pr
ocur
emen
t man
ual
train
ing
plan
and
mat
eria
ls
deve
lope
d by
end
of 2
011
•Tr
aini
ng w
orks
hops
impl
emen
ted
on a
rollin
g ba
sis
from
200
9
•Re
porti
ng m
echa
nism
s an
d
post
-rev
iew
pro
cedu
res
intro
duce
d by
mid
-201
2
•Pr
ocur
emen
t rul
es a
nd p
olic
y up
date
d th
roug
h am
endm
ent
of s
ubde
cree
No.
60
and
prak
as N
o. 4
5 on
pro
cure
men
t de
cent
raliz
atio
n by
end
of 2
011
•Pr
ocur
emen
t man
ual i
n En
glis
h re
vised
and
upd
ated
by
end
of 2
011
•Tr
aini
ng p
lan
and
mat
eria
ls
•At
tend
ance
and
per
form
ance
re
cord
s
•Pr
ocur
emen
t rev
iew
as
sess
men
t rep
ort
•Re
porti
ng m
echa
nism
and
po
st-r
evie
w p
roce
dure
s
•Pr
ocur
emen
t rul
es a
nd p
olic
y up
date
d th
roug
h am
endm
ent
of s
ubde
cree
No.
60
and
prak
as N
o. 4
5 on
pro
cure
men
t de
cent
raliz
atio
n
•Pr
ocur
emen
t man
ual a
dopt
ed
unde
r dec
ree
and
prak
as b
y en
d of
201
1
Assu
mpt
ions
•Fi
nal a
gree
men
t is
reac
hed
on th
e re
view
ed a
nd u
pdat
ed
proc
urem
ent m
anua
l an
d SO
Ps in
Sep
tem
ber
2011
.
•Dr
aft l
aw b
y CO
M is
ac
cept
ed a
nd re
ady
for
impl
emen
tatio
n by
the
end
of 2
011
To im
prov
e pr
ocur
emen
t op
erat
ions
•TA
pro
ject
, in
conj
unct
ion
with
MEF
/COM
, rev
iew
s th
e po
licy
that
exp
licitl
y se
ts fo
rth c
riter
ia fo
r dec
isio
ns a
bout
th
e us
e of
the
forc
e ac
coun
t.
•TA
pro
ject
to a
ssis
t bud
get f
orm
ulat
ion
com
mitt
ees
in
prep
arin
g re
alis
tic a
nnua
l pro
cure
men
t pla
ns th
at a
re
linke
d to
the
annu
al w
ork
plan
and
bud
get.
•Fo
rce
acco
unt u
se p
olic
y de
velo
ped
by e
nd o
f 201
1
•An
nual
pro
cure
men
t pla
ns
alig
ned
with
ann
ual w
ork
plan
an
d bu
dget
•Pr
ocur
emen
t com
mitt
ees
esta
blis
h pr
ocur
emen
t gui
delin
es
and
proc
edur
es b
y en
d of
yea
r 1
•Fo
rce
acco
unt u
se p
olic
y
•An
nual
pro
cure
men
t pla
ns
alig
ned
with
ann
ual w
ork
plan
an
d bu
dget
•Pr
ocur
emen
t gui
delin
es a
nd
proc
edur
es
cont
inue
d ne
xt p
age
Tabl
e 43
Co
ntin
ued

Cause-and-Effect Analysis for Rural Development and Public Financial Management in the Sector 125
Outp
uts
Key
Activ
ities
Indi
cato
rsSo
urce
of V
erifi
catio
nAs
sum
ptio
ns a
nd R
isks
•Ru
ral d
evel
opm
ent m
inis
tries
upd
ate
proc
urem
ent
proc
edur
es a
nd g
uide
lines
to a
dher
e to
the
finan
cing
ag
reem
ent,
ADB
proc
urem
ent g
uide
lines
, and
SOP
s an
d pr
ocur
emen
t man
ual t
hat a
lso
cove
r int
erna
tiona
l co
mpe
titive
bid
ding
, nat
iona
l com
petit
ive b
iddi
ng,
shop
ping
, and
com
plai
nts
proc
edur
es.
•Es
tabl
ish
natio
nal a
nd p
rovin
cial
-leve
l pro
cure
men
t co
mm
ittee
s in
acc
orda
nce
with
SOP
s an
d pr
ocur
emen
t man
ual.
To im
prov
e tra
nspa
renc
y in
resp
onse
to
exte
rnal
dem
and
(i.e.
, civi
l soc
iety,
NA
A, N
atio
nal
Asse
mbl
y)
•TA
sup
port
to IC
T un
it to
ens
ure
cont
inue
d de
velo
pmen
t an
d im
plem
enta
tion
of th
e IC
T st
rate
gy fr
amew
ork.
•Co
ntin
ue th
e ca
paci
ty-b
uild
ing
activ
ities
for I
CT u
nit f
rom
su
bpro
gram
1.
•TA
sup
port
to M
EF to
dev
elop
cap
abilit
y to
resp
ond
to e
xter
nal d
eman
d fo
r inc
reas
ed tr
ansp
aren
cy in
im
plem
enta
tion,
pro
gres
s re
porti
ng, a
nd d
ialo
gue.
•IC
T st
rate
gy fr
amew
ork
deve
lope
d by
end
yea
r 1
•Ca
paci
ty-b
uild
ing
activ
ities
co
mpl
eted
by
end
of y
ear 3
•Tr
ansp
aren
t MEF
impl
emen
tatio
n,
prog
ress
repo
rts, a
nd d
ialo
gue
by
end
of y
ear 2
and
ong
oing
•PF
M re
porti
ng p
ublis
hed
on a
re
gula
r bas
is
•De
velo
pmen
t of I
CT s
trate
gy
fram
ewor
k by
end
of y
ear 1
•Ca
paci
ty-b
uild
ing
activ
ities
co
mpl
eted
by
end
of y
ear 3
•Tr
ansp
aren
t MEF
im
plem
enta
tion,
pro
gres
s re
ports
, and
dia
logu
e by
end
of
year
2 a
nd o
ngoi
ng
•PF
M re
porti
ng is
pub
lishe
d on
a
regu
lar b
asis
and
is a
vaila
ble
to th
e pu
blic
Corr
uptio
n
To o
pera
tiona
lize
antic
orru
ptio
n po
licy
TA s
uppo
rt to
pro
ject
con
sulta
nts
to im
plem
ent t
he
antic
orru
ptio
n po
licy
acco
mpa
nied
with
cha
nges
in
impl
emen
tatio
n an
d m
onito
ring
proc
edur
es.
•An
ticor
rupt
ion
polic
y op
erat
iona
lized
by
end
of y
ear 1
•Re
gula
r aud
it of
ADB
pro
ject
s ca
rried
out
•An
ticor
rupt
ion
polic
y op
erat
iona
lized
•An
nual
aud
it re
ports
To in
stitu
tiona
lize
proc
urem
ent a
nd
MTR
/PCR
•De
velo
p pr
ocur
emen
t and
MTR
/PCR
ToT
plan
and
mat
eria
ls
•Im
plem
ent p
rocu
rem
ent a
nd M
TR/P
CR T
oT tr
aini
ng
•TA
sup
port
to p
roje
ct c
onsu
ltant
s to
dev
elop
and
im
plem
ent p
roce
dure
s to
con
trol e
ndog
enou
s ab
use
and
prot
ectio
n ag
ains
t exo
geno
us p
ress
ure
•To
T pl
an a
nd m
ater
ials
dev
elop
ed
by m
id-y
ear 1
•To
T co
nduc
ted
at th
e en
d of
yea
r 1
•Tr
aine
rs c
ondu
ct p
rocu
rem
ent
and
MTR
/PCR
trai
ning
to s
taff
on
a qu
arte
rly b
asis
begi
nnin
g ye
ar 2
•To
T pl
an a
nd m
ater
ials
•To
T at
tend
ance
and
pe
rform
ance
reco
rds
•Qu
arte
rly p
rocu
rem
ent a
nd
MTR
/PCR
trai
ning
atte
ndan
ce
and
perfo
rman
ce re
cord
s
cont
inue
d ne
xt p
age
Tabl
e 43
Co
ntin
ued

Rural Development for Cambodia126
Outp
uts
Key
Activ
ities
Indi
cato
rsSo
urce
of V
erifi
catio
nAs
sum
ptio
ns a
nd R
isks
•Pr
ocur
emen
t and
MTR
/PCR
pr
oced
ures
dev
elop
ed th
at fo
llow
po
licy
by m
id-y
ear 2
•Pr
ocur
emen
t and
MTR
/PCR
pr
oced
ures
inst
itutio
naliz
ed b
y en
d of
yea
r 3
•Pr
ocur
emen
t and
MTR
/PCR
pr
oced
ures
To a
dapt
an
ticor
rupt
ion
oper
atio
ns a
nd
inst
rum
ents
TA s
uppo
rt to
the
proj
ect c
onsu
ltant
s to
con
tinue
NRD
P pr
actic
al a
dapt
atio
ns to
incr
ease
con
trol m
easu
res
NRDP
con
trol m
easu
res
final
ized
by
end
of y
ear 1
NRDP
con
trol m
easu
res
To a
pply
sanc
tions
ag
ains
t fra
udul
ent
and
corru
pt
proc
urem
ent
activ
ity
•Re
fer t
o ha
rmon
ized
sanc
tions
def
ined
und
er th
e re
view
ed a
nd u
pdat
ed S
OPs
and
agre
emen
ts b
etw
een
the
gove
rnm
ent a
nd d
evel
opm
ent p
artn
ers
avai
labl
e un
der
curre
nt la
w a
nd re
gula
tions
•Sa
nctio
ns fo
r ind
ividu
als
may
inclu
de tr
ansf
er o
f dut
ies,
re
train
ing,
sus
pens
ion,
dism
issal
, reg
radi
ng, a
nd/o
r pr
osec
utio
n un
der C
ambo
dian
Law
•Sa
nctio
ns fo
r firm
s m
ay in
clud
e te
rmin
atio
n of
con
tract
, de
barm
ent o
r bla
cklis
ting
unde
r dev
elop
men
t par
tner
pr
ocur
emen
t gui
delin
es a
nd c
onsu
lting
gui
delin
es, a
nd/o
r pr
osec
utio
n un
der C
ambo
dian
Law
.
•Im
plem
ent a
war
enes
s w
orks
hop
cam
paig
n ab
out r
ule
of
law
and
cha
nges
to c
ontra
cts
•Em
ploy
men
t and
pro
cure
men
t co
ntra
cts
mod
ified
to in
clud
e sa
nctio
ns fo
r fra
udul
ent a
nd
corru
pt a
ctivi
ties
by y
ear 2
•Aw
aren
ess
wor
ksho
p ca
mpa
ign
cond
ucte
d on
a q
uarte
rly b
asis
be
ginn
ing
year
2
•85
% re
duct
ion
in fr
audu
lent
and
co
rrupt
act
ivitie
s by
end
of y
ear 3
•Em
ploy
men
t and
pro
cure
men
t co
ntra
cts
•Qu
arte
rly w
orks
hop
atte
ndan
ce re
cord
s
To e
nhan
ce p
ublic
pe
rcep
tion
of
good
gov
erna
nce
prac
tices
•Pr
ovid
e m
ore
com
petit
ion
in p
rocu
rem
ent e
xerc
ises
•En
hanc
e pr
ojec
t des
ign
with
bet
ter i
ndic
ator
s fo
r pe
rform
ance
ass
essm
ent a
nd in
volve
sta
keho
lder
s in
the
resu
lting
dia
logu
e
•Go
vern
men
t to
take
app
ropr
iate
ac
tion
on a
udit
repo
rts
•In
cent
ives
deve
lope
d by
yea
r 2
•10
0% re
duct
ion
in g
over
nanc
e an
d an
ticor
rupt
ion
issu
es in
pr
ojec
t des
ign
by e
nd o
f yea
r 2
and
ongo
ing
Assu
mpt
ion
ADB
and
min
istrie
s co
mm
it to
enh
anci
ng q
ualit
y of
w
orks
and
pub
lic p
erce
ptio
n.
Tabl
e 43
Co
ntin
ued
ADB
= A
sian
Dev
elop
men
t Ban
k; B
SP =
bud
get s
trate
gic
plan
; COM
= C
ounc
il of
Min
iste
rs; F
MIS
= F
inan
cial
Man
agem
ent I
nfor
mat
ion
Syst
em; F
MM
= F
inan
cial
Man
agem
ent M
anua
l; GD
P =
gro
ss d
omes
tic p
rodu
ct;
ICT
= in
form
atio
n an
d co
mm
unic
atio
ns te
chno
logy
; MEF
= M
inis
try o
f Eco
nom
y an
d Fi
nanc
e; M
EF/C
OM =
Min
istry
of E
cono
my
and
Fina
nce/
Coun
cil o
f Min
iste
rs; M
TR/P
CR =
Med
ium
Ter
m R
evie
w/p
roje
ct c
ompl
etio
n re
port;
NAA
= N
atio
nal A
udit
Auth
ority
; NRD
P =
Nor
thw
est R
ural
Dev
elop
men
t Pro
gram
; PAM
= P
roje
ct A
dmin
istra
tion
Man
ual;
PFM
= p
ublic
fina
ncia
l man
agem
ent;
PFM
RP =
Pub
lic F
inan
cial
Man
agem
ent R
efor
m
Prog
ram
; PM
= P
rocu
rem
ent M
anua
l; SM
ART
= s
peci
fic, m
easu
rabl
e, a
chie
vabl
e, re
leva
nt, a
nd ti
me-
boun
d; S
OPs
= s
tand
ard
oper
atin
g pr
oced
ures
; TA
= te
chni
cal a
ssis
tanc
e; T
oT =
trai
ning
of t
rain
ers;
TOF
E =
Tab
le o
f Go
vern
men
t Fin
anci
al O
pera
tion,
or T
able
au d
’Opé
ratio
n Fi
nanc
ier D
’Éta
t.
Sour
ce:
High
-leve
l log
fram
e fro
m M
AFF
and
MOW
RAM
(201
0).

127
References
Agrifood Consulting International (ACI). 2002. Rice Value Chain Study: Cambodia. A Report Prepared for the World Bank. Phnom Penh.
Alamgir, N. 2008. Issues and Options in Agriculture and Natural Resources Sector in Cambodia. Manila: ADB.
AMRET. 2008. Financial Statements and Auditors’ Report, 31 December 2007. Phnom Penh.
Asian Development Bank (ADB). 2000. Report and Recommendation of the President to the Board of Directors: Proposed Loan to the Kingdom of Cambodia for the Stung Chinit Irrigation and Rural Infrastructure Project. Manila.
______. 2003a. Report and Recommendation of the President to the Board of Director: Proposed Loan to the Kingdom of Cambodia for the Northwest Irrigation Sector Project. Manila.
______. 2003b. Report and Recommendation of the President to the Board of Directors: Proposed Loans and Technical Assistance Grant to the Kingdom of Cambodia for the Agriculture Sector Development Program. Manila.
______. 2006. Report and Recommendation of the President to the Board of Directors: Proposed Loan to the Kingdom of Cambodia for the Northwest Rural Development Project. Manila.
______. 2007a. Philippines: Critical Development Constraints. Manila.
______. 2007b. Report and Recommendation of the President to the Board of Directors: Proposed Asian Development Fund Grant for the Kingdom of Cambodia: Enhancing Education Quality Project. Manila.
______. 2008a. Key Indicators for Asia and the Pacific Database. Manila.
______. 2008b. Kingdom of Cambodia: Preparing the Second Rural Water Supply and Sanitation Sector Project. Manila.
______. 2008c. Kingdom of Cambodia: Preparing the Strengthening Technical and Vocational Education and Training Project. Manila.
______. 2009a. Asian Development Outlook Database. Manila.
______. 2009b. Key Indicators for Asia and the Pacific Database. Manila.
______. 2010. Sector Assessment, Strategy and Road Map: Cambodia — Agriculture, Rural Development and Natural Resource Management. Manila.
Chandarrot, K., V. Salze-Lozac’h, and L. Dannet. 2006. Streamlining Local Licensing Procedures in Cambodia. Phnom Penh, Cambodia, The Asia Foundation and Cambodian Institute of Development Study.
Commission on Growth and Development. 2008. The Growth Report: Strategies for Sustained Growth and Inclusive Development. Washington, DC: Commission on Growth and Development, World Bank.
Craig, D., and P. Kimchoeun. Forthcoming. Party Financing of Local Investment Projects: Elite and Mass Patronage. In Caroline Hughes and Kheang Un, eds. Cambodia’s Economic Transformation. Copenhagen: Nordic Institute of Asian Studies. pp. 244–271.

References128
Development Alternatives, Inc. (DAI), Agricultural Development International (ADI), and International Development Enterprises (IDE). 2008. Cambodia SME Development in Selected Agri-Sectors/Value Chains. Phnom Penh, Prepared for the International Finance Corporation/Mekong Private Sector Development Facility (IFC/MPDF) by the DAI, ADI, and IDE.
Economic Institute of Cambodia (EIC). 2008. Cambodia Economic Watch. Phnom Penh.
Fan, S. 2008. Public Expenditure, Growth and Poverty in Developing Countries: Issues, Methods and Findings. Baltimore: Johns Hopkins Publications.
Hausmann, R., D. Rodrik, and A. Velasco. 2005. Growth Diagnostics. Cambridge, Massachusetts: Harvard University Press.
International Finance Corporation (IFC). 2007. Cambodia: Financial Sector Diagnostic. Phnom Penh.
IFC and Asia Foundation. 2009. The Provincial Business Environment Scorecard in Cambodia: A Measure of Economic Governance and Regulatory Policy. Phnom Penh.
International Finance Corporation–Mekong Private Sector Facility (IFC-MPDF) and the Asia Foundation. 2007. The Provincial Business Environment Scorecard in Cambodia: A Measure of Economic Governance and Regulatory Policy. Phnom Penh.
IFC-MPDF and Ministry of Commerce (MOC). 2008. Handbook on Export Procedures: Practical Guide for Small and Medium Enterprises in Cambodia. Phnom Penh.
International Monetary Fund (IMF). 2008. World Economic Outlook: A Survey by the Staff of the International Monetary Fund. Washington, DC.
______. 2009. IMF Country Report No. 09/48, Cambodia: Statistical Appendix. Washington, DC.
IMF and World Bank. 2007. Cambodia: Staff Report for the 2007 Article IV Consultation. Washington, DC.
Jackson, C. 2005. Cambodia Poverty Assessment: Rural Background Note. Phnom Penh: World Bank.
Japan Development Institute (JDI), Global Development Solutions (GDS), and Cambodia Biologicals. 2007. Benchmarking Selected Variables from the 2003 Value Chain Report: Has the Enabling Environment Improved in Cambodia to Strengthen the Competitiveness of Strategic Sectors? Phnom Penh.
Japan International Cooperation Agency. 2001. The Study on Improvement of Marketing System and Post-Harvest Quality Control of Rice in Cambodia: Final Report. Phnom Penh: Japan International Cooperation Agency; Ministry of Commerce and Ministry of Agriculture, Forestry and Fisheries, Royal Government of Cambodia.
Kaufmann, D., A. Kraay, and M. Mastruzzi. 2008. Governance Matters VII: Aggregate and Individual Governance Indicators, 1996–2007. World Bank Policy Research Working Paper No. 4654. Washington, DC: World Bank.
Knowles, J. 2006. A New Set of Poverty Estimates for Cambodia, 1993/94 to 2004. Phnom Penh. Report to the EAS Country Unit of the World Bank.
______. 2008. Poverty Estimates for Cambodia, 2007. Phnom Penh. Report to the EAS Country Unit of the World Bank.
Kula, O., C. Pennotti, and M. Brand. 2007. Cambodia Development Partner Value Chain Activity & Coordination Study. Phnom Penh: Academy for Educational Development for USAID.
Kurczy, S. and N. Vannarin. 2009. Garment Sector Takes a Hit in ’08; Outlook Bleak. The Cambodia Daily. 41: 1, 32.

References 129
Ministry of Agriculture, Forestry and Fisheries (MAFF). 2006. Organizational Restructuring and Rationalizing Roles and Responsibilities to Strengthen Policy and Planning in the Ministry of Agriculture, Forestry and Fisheries. TA 4228-CAM. Working Group on Roles and Responsibilities of MAFF Departments, Department of Personnel and Human Resource Development. Phnom Penh.
______. 2008. Annual Conference on Agriculture, Forestry and Fisheries. Phnom Penh, Cambodia. MAFF. 7–9 April 2005.
MAFF and Ministry of Water Resources and Meteorology (MOWRAM). 2010. Harmonized Strategy for Agriculture and Water, 2010–2013. Technical Working Group on Agriculture and Water, Ministry of Agriculture Forestry and Fisheries and Ministry of Water Resources and Meteorology. Phnom Penh.
Multi-Donor Livelihoods Facility (MDLF). 2010. Review of Community Forestry and Community Fisheries in Cambodia, National Resource Management and Livelihoods Programme. Phnom Penh.
Ministry of Commerce (MOC) and ADB. 2008. A Handbook on Commercial Registration. Phnom Penh.
Ministry of Planning. 2001. Second Socioeconomic Development Plan 2001–2005: National Economic Growth and Poverty Reduction Strategy. Phnom Penh.
Ministry of Water Resources and Meteorology. 2009. Strategic Development Plan. Phnom Penh.
Ministry of Rural Development (MRD). 2005. Rural Water Supply and Sanitation Sector Investment Plan 2005–2015. Phnom Penh: MRD.
Mokoro Ltd. 2010. Integrated Fiduciary Assessment and Public Expenditure Review—Agriculture, Irrigation and Rural Roads Public Expenditure Review. World Bank Contract 7153651. Headington, Oxford: Mokoro Ltd. for World Bank.
National Bank of Cambodia (NBC). 2008. Annual Report 2007. Phnom Penh.
______. 2010. Annual Report 2009. Phnom Penh.
National Institute of Statistics (NIS). 1999. Cambodia Socio-Economic Survey. Phnom Penh.
______. 2004. Cambodia Socio-Economic Survey. Phnom Penh.
______. 2006. Statistical Yearbook. Phnom Penh.
______. 2007. Cambodia Socio-Economic Survey. Phnom Penh.
______. 2008. Statistical Yearbook. Phnom Penh.
Oum, S. 2007. A Recursive Dynamic CGE Assessment of the Cambodian Millennium Poverty Reduction Target. Melbourne: Center for Policy Studies, Monash University.
Phyrum, K. 2007. Rural Infrastructure Development in the Decentralization Process. Phnom Penh: Economic Institute of Cambodia.
Pousse, E. 2004. Study on the Deconcentration of Agricultural Services in Cambodia: A Discussion Paper. Phnom Penh: Ministry of Agriculture, Forestry and Fisheries.
PRASAC Microfinance Institution. 2008. Financial Statements for the Year Ended 31 December 2007. Phnom Penh.
Purcell, T. and K. Rich. 2002. Rice Value Chain Study: Cambodia. A Report Prepared for the World Bank. Phnom Penh: Agrifood Consulting International.

References130
Royal Government of Cambodia (RGC). 2004. The Rectangular Strategy for Growth, Employment, Equity and Efficiency in Cambodia. Phnom Penh: The Third Legislature of the National Assembly.
______. 2005a. National Strategic Development Plan, 2006–2010. Phnom Penh.
______. 2005b. Strategic Framework for Decentralisation and Deconcentration Reforms. Phnom Penh.
______. 2009. National Strategic Development Plan Update, 2009–2013: For Growth, Employment, Equity and Efficiency to Reach Cambodia Millennium Development Goals. Phnom Penh.
Rith, S. 2008. Desperation Takes Hold as Textile Industry Losses Begin to Mount. Phnom Penh Post. Phnom Penh.
Rodrik, D. 2007. One Economics, Many Recipes: Globalization, Institutions, and Economic Growth. New Jersey: Princeton University Press.
Ryan, M. 2007. Cambodian Health System: Health Status of the Cambodian Population and Health Service Delivery. Prepared for the World Bank by EpiConsult. Phnom Penh.
Samnang, C. 2004. The Rice Industry in Cambodia. Special Report, January–March. Phnom Penh: Economic Institute of Cambodia.
SME Secretariat. 2005. Small and Medium Enterprise Development Framework. Phnom Penh.
______. 2007. Technical Report: SME Statistics in Cambodia. Phnom Penh.
Taylor, P. 2008. Review of Capacity to Support Water Resources Management (Sector) Project. Preparing the Water Resources Management (Sector) Program, Cambodia. Phnom Penh: NIRAS for Asian Development Bank.
______. 2009. Water Resources Management (Sector) Project: Preliminary Report on Institutional Issues. Phnom Penh: ADB.
Technical Working Group on Agriculture and Water. 2007. Strategy for Agriculture and Water, 2006–2010. TWGAW, Ministry of Agriculture, Forestry and Fisheries, and Ministry of Water Resources and Meteorology. Phnom Penh.
Vindel, B. 2003. Diagnostic Study of Selected Provincial Departments of Agriculture, Forestry and Fisheries. Prepared for the World Bank, October. Phnom Penh.
World Economic Forum (WEF). 2008. Global Competitiveness Report 2007–2008.
World Bank. 2004a. Pro-Poor Growth in the 1990s: Lessons and Insights from 14 Countries. The Operationalizing Pro-Poor Growth Research Program Report. Washington, DC.
______. 2004b. Seizing the Global Opportunity: Investment Climate Assessment and Reform Strategy. Washington, DC.
______. 2006. Cambodia: Halving Poverty by 2015? Poverty Assessment 2006. Phnom Penh.
______. 2007. Sharing Growth: Equity and Development in Cambodia. Phnom Penh.
______. 2008a. Sustaining Rapid Growth in a Challenging Environment. Cambodia Country Economic Memorandum. Phnom Penh.
______. 2008b. World Development Indicators. Washington, DC.
Yu, B., S. Fan, A. Saurkar, and R. Ramadan. 2008. How Can Cambodian Farmers Respond to Rising Food Prices? Washington, DC: International Food Policy Research Institute.

Rural Development for CambodiaKey Issues and Constraints
Cambodia’s economic performance over the past decade has been impressive, and poverty reduction has made significant progress. In the 2000s, the contribution of agriculture and agro-industry to overall economic growth has come largely through the accumulation of factors of production—land and labor—as part of an extensive growth of activity, with productivity modestly improving from very low levels. Despite these generally positive signs, there is justifiable concern about Cambodia’s ability to seize the opportunities presented. The concern is that the existing set of structural and institutional constraints, unless addressed by appropriate interventions and policies, will slow down economic growth and poverty reduction. These constraints include (i) an insecurity in land tenure, which inhibits investment in productive activities; (ii) low productivity in land and human capital; (iii) a business-enabling environment that is not conducive to formalized investment; (iv) underdeveloped rural roads and irrigation infrastructure; (v) a finance sector that is unable to mobilize significant funds for agricultural and rural development; and (vi) the critical need to strengthen public expenditure management to optimize scarce resources for effective delivery of rural services.
About the Asian Development Bank
ADB’s vision is an Asia and Pacific region free of poverty. Its mission is to help its developing member countries reduce poverty and improve the quality of life of their people. Despite the region’s many successes, it remains home to two-thirds of the world’s poor: 1.8 billion people who live on less than $2 a day, with 903 million struggling on less than $1.25 a day. ADB is committed to reducing poverty through inclusive economic growth, environmentally sustainable growth, and regional integration.
Based in Manila, ADB is owned by 67 members, including 48 from the region. Its main instruments for helping its developing member countries are policy dialogue, loans, equity investments, guarantees, grants, and technical assistance.
Rural Developmentfor Cambodia
Rural Developmentfor CambodiaKey Issues and ConstraintsKey Issues and Constraints
Printed on recycled paper Printed in the Philippines
Asian Development Bank6 ADB Avenue, Mandaluyong City1550 Metro Manila, Philippineswww.adb.org