rural deposit mobilization in the philippines, 1977 … · rural deposit mobilization in the...
TRANSCRIPT

P_8 Journal of Philippine Development _I_sNumber Twenty Eight, Volume XVI, No. 1,1989
RURAL DEPOSIT MOBILIZATIONIN THE PHILIPPINES,
1977 - 1986"
RheneeBlanco and Richard L. Meyer**
Introduction
Governmentattemptsto developruralfinancialmarkets(RFMs)inthePhilippinesbegan inthe early1900s, apparentlyas a correctiveresponseto the urbanorientationof the colonialprivatebankingsystem(Lamberteand Lim 1987). Thelonghistoryof RFMdevelopmentincludesa seriesofgovernment-initiatedfinancialinstitutions,some of whichexistuntiltoday.Thereare otherswhich havebeen dissolved,their functionsabsorbedbynewlycreatedinstitutions,Likeinmanylowincomecountries,severalgov-ernment financial institutions underwent "institutionalrecycling," theprocessof grantingcapitalto highlysubsidizedagriculturallendinginstitu-tionswhicheventuallygo bankrupt,andthenrenamingthemand/ormerg-ing them with another institutionprovided with fresh capital for theresumptionof operations(Meyer 1985).
A major turning point in the approachto RFM developmentin thePhilippinesoccurredin the 1950swhen ruralprivateentrepreneurswereencouragedto enter bankingthroughgovernmentincentivesprovidedbythe creationof RuralBanksand privatedevelopmentbanks. The 60sandthe 70stargettedthe developmentof one ruralbankfor eachmunicipality.Aspartof governmenteffortsto increasefood productionintheearly70s,this networkwas utilizedin the expansionof rurallendingusinggovern-mentandexternalfunds.
It appearsthat muchof the interestinexpandingthe ruralbank net-work was not to increaseruralaccess,to financialservicesgenerallybutratherto expandlending,particularlyof governmentand donor fundsto
*Paper presented during the ACPC-PIDS*OSU sponsored seminar-workshop on"Financial Interrnediation in the Rural Sector: Research Results and Policy Issues" held on26-27 September 1988 at the Cuaderno Hag, Central Bank of the Philippines, The projectwas coordinated by Dr. Mario B. Larnberte (PIDS) and Dr, V. Bruce J, Tolentino (ACPC),
**Respectively, Ph.D. (Candidate) and Professor, Ohio State University (OSU).The authors acknowledge with appreciation the comments made on an early draft by
Dr. Cados Cuevas, Dr. Douglas Graham, Dr. Mario B, Lamber_ and Dr. V. BruceJ. Tolentino.

118 JOURNAL OF PHILIPPINE DEVELOPMENT
counter rural unrest and accelerate agricultural production. The fun-damental reasons why rural lending was below socially optimum levels
• does not appear to have been systematically analyzed. Ultimately, how-ever, the establishement of banking institutions in rural areas and their useas channels for government funds did not reduce nor counter the urbanbias of financial development. As the phenomenon of institutional recy-cling indicates, certain shortcomings in this RFMstrategy frustrated theseefforts to increase rural access to a sustained, dependable flow of finan-cial services.
The urban bias of financial development, i.e., the concentration ofbanking offices and financial services in urban areas that occurs in manylow income countries, must be viewed in conjunction with the overallurban bias of economic development (Gonzalez-Vega and Camacho1988). Government subsidy to the establishment•of the rural banking net-workhardlycompensatesfor the small share the ruralsectorreceivesfromother public investments. Because of the absence of rural infrastruc-tures andthe wide geographicaldispersionof economicunits,transactioncostsare naturallyhigh in rural areas for both banksand their clientele.Alltheseserve to hinderthe developmentof the financialsystem.
Transaction-costreducing innovations,includingthe realizationofscope economiesby financialinstitutions,is crucialto the generationofexpected payoffs from government subsidies. Unfortunately, theschemesadoptedduringthe firsthalfofthe 1970semphasizedthe roleofthe ruralfinancialinstitutionsas conduitsof subsidizedfundsto agricul-ture.As governmenttargettedloansgrew inimportanceinthe portfoliosofthese institutions,intermediatedfundsin the liabilityside of their balancesheetsdeclinedcorrespondingly.
Rather than developtrue financial intermediariesthat realizescopeeconomiesby offeringan increasingrangeoffinancialservices,a dualisticstructureof rural-basedbankinginstitutionsemergedunderthe regimeofsubsidized credit. On one hand, government and quasi-governmentbanksand subsidizedRural Banksemerged primarilyas lenders in ruralareas;on the otherhand,privatecommercialand savingsbank branchesemergedas net borrowers,i.e., they generatedmore depositsthan theylent to the community(TBAC-UPBRF1981). Whenthe presenceof moreprofitablelendingopportunitiesin urbanareas causesthe ruralto urbanflow of funds, then the urban biasof overalleconomicdeveiopmentac-centuatesthe bias of financialdevelopment(as discussedby Gonzalez-Vega and Camacho). This also affirmscriticismsfrequentlymade aboutspecializedagriculturallenders,especiallygovernment-ownedinstitutions.Not only do these institutionsfail to realizecost reductionsthroughthesimultaneousprovisionof lendinganddeposit services,they alsoforegoopportunitiesto developthe skillsof bank managementin matchingand

BLANCOandMEYER : RURAL DEPOSIT 119
synchronizingresource inflowswith credittransactionsand in involvingthe deposit communityas an additionalsourceof pressurefor bank ac_countability(BourneandGraham 1984).
To obtaina betterperspectiveof the impactof governmenteffortstoreducethe urbanbiasof financialdevelopmentinthe Philippines,it isim-portant to examine deposit mobilizationperformance. The progressmade in ruraldepositmobilizationis a key indicatorof the extentto whichfinancialserviceshaveeffectivelypenetratedruralareas. It also indicatesthe progress made in the development of genuine financial inter-mediaries,i. e., institutionsthatengage in intermediationbetweensurplusand deficit unitsin ruralareas. It providesa measureof the successofformalfinancialinstituionsingainingthe confidenceof ruralpeopleandinreducingthe costof financialintermediationservices.The extentto whichintermediatedfunds are lent at market rates in ruralareas rather thanchannelledthroughthe bankingsystemfor urbaninvestmentsignifiestheextent to which investorsperceive profitable rural investmentoppor-tunities. Furthermore, rural lending at market rates, demonstratesthevalueinvestorsplace on formalfinance relativeto traditionalfinancialar-rangementssuch as direct finance (as exemplified by informalmoney_lending) and self-finance. Since the numberof clientsserved by bankdepositfacilitiesis usuallyseveraltimesthe numberwho get loans,effec-tivedepositmobilizationcan servemore peoplethan subsidizedlending.
The objectiveof this paper, then, is to documentand describe ruraldeposit mobilizationin the Philippinesin view of recentgovernmentat-temptsto reduce the urbanbias of financialdevelopment. The analysiscovers the period of 1977-1986,a particularlyinterestingperiodto studyruralfinancialdevelopments.The mid-1970srepresentedthehighpointofgovernmentconcernfor ruralfinance,especiallyfor farm loanstypifiedbyMasagana99 and otherspecial loan programs.This periodalso includesthe downturnof the economy inthe 1980sand the relatedcontractionoffinancialservices,the extremefinancialstressexperiencedbymany finan-.cial institutions,andthe politicalturmoiland eventualchange in govern-ment. Thesedevelopmentscontributedto overall financialinsecurityandcouldbe expectedto havea negativeimpacton ruralfim'_ance.1
1. Becauseof theturmoiland uncertaintyduringthisperiod,it couldbe arguedthattheanalysisdoesnotreflectthetruepotentialofruralbanking. Bothruraland urbanperceptionsaboutthevalueof holdingfinancialassestsin bankswereprobablyinfluencedbythissituation.Itwouldbeusefultoanalyzeissuesbeyondthescopeof thispaper,suchas the possibleimpactofcareful supervisionof bankinginstitutionsanddepositinsuranceon depositbehavior. ButthispaperdooJmentsthe interestingporformancaofdepositbehaviorin spite of theseseveralimportantproblemsthat logicallywouldbe expected to discouragefinancialdevelopmentgenerallyandruraldepositsspecifically.

120 JOURNAL OF PHILIPPINE DEVELOPMENT
The 1977-1986 period is also one in which publisheddata can beused to try to distinguish rural from urban banking operations, but impor-tant limitations must be kept in mind. The National Capital Region (NCR)is defined here as the "urban" area, while the rest of the country is con-sidered "rural". The official Philippine definition of "urban" includesregional centers, chartered cities and other municipalities outside of theNCR, but the available financial data cannot be disaggregated to thislevel. This implies, therefore,an upward bias in some measuresattributedto ruralareas such as deposits and number of banking offices.
Another problem is that thepublished data apparently include, but donot distinguish, inter-bank/inter-branch/head office-to-branch transac-tions.2 Ideally, these transactions should be analyzed separately be-cause, during periods of substantial yield differentials between depositinstruments of varying denominations, small retail deposit institutions inrural areas may take advantage of arbitrage opportunities by makingdeposit placements with larger banks. A placement by a rural banking of-rice with, say, a commercial bank branch in a neighboring rural townwould double-count deposits in favor of rural areas, while a placementwith a bank in the NCRwould credit both rural and urban deposits. In thecase of loans, the location of the banking office that books the loan is notnecessarilythe locality where the proceeds are utilized. Large enterpriseslocated in the hinterlands may have the headquarters of their credit opera-tions in Manila, Thus, the rural-urban distinction of banking services usedhere must be interpreted as only a general indication of comparativefinancialdevelopment and performance of rural relativeto urban areas.
The next section of the paper contains a brief reviewof the key deter_mlnants of rural deposit performance. Section three describes thoseaspects of the Philippine rural economy that could bevery important in in-fluencing rural deposit mobilization performance during the study period:rural income, accessibility of banking offices, and the relative attractive-ness of deposit instrumentsconsidering inflation and the availabilityof alter-native sources of funds for rural depository institutions. Rural deposit
2. The Central Bank of the Philippinesperiodically(annually, semestral, quarterly)publishesthe Regional Profile of Banks asa supplementtotheFactbook Philippine FinancialSystem. Asidefromthe numberof bankingoffices, bytype of bankin each region,selectedbalancesheetitems(assets,loans,deposits)and- beginningin 1983- incomestatementitemsarereported.Hence, the basisof themeasuresusedhereare end-of-quarterloansoutstand-ing.Depositsincludedemand,savings,time,NOW(NegotiableOrdersofWithdrawal)andtrustaccounts.Theorigin(households,firms/organizations,government,otherbanks)of depositsisnotdistinguished,and thedata sedes donot indicatehowthe balance sheet itemsof for-eign banksoverseasbranchesof domesticbanks are reported.

BLANCO and MEYER; RURAL DEPOSIT 121
performanceis analyzed in section four, and section five concludes the,paper.
Determinants of Rural Deposit Performance
The factors consideredimportantin determiningruraldepositsmaybe usefullycategorized into the following: (1) thosethat determinethescope of opportunitiesforfinancialassetholdings;(2) thosethat influencethe incentivesfor savers;and (3) those institutionalfactorsthat impingeon opportunitiesand incentivesto save. Theavailabilityof data constrainsthe analysisto thefactorsof income,accessand availabilityof alternativesourceof funds.
Ina monetizedeconomy,householdsareexpectedtodemanddepo-sits as part of theireffortsto create a balanced portfolioof assets. Asincomesrise,a largerproportionof householdassetsisexpectedtobeheldinfinancialformto facilitatethelargervolumeoftransactionsundertakenbythe household. Moreimportantly,the non-synchronizationof incomeandexpenditureflowsprovidethe basisfor holdingfinancialassetsinordertomanageconsumptionpossibilitiesoptimallythroughtime. 3Ata givenlevelof income,theincentivesto holda growingproportionofwealthina financialform are conditionedbythe relativerisksand returnsof financialassets,which may be implicitor explicit,pecuniaryor otherwise.In this regard,factorssuch as inflationand the transactioncostsassociatedwith,say, asavingsaccountcan be viewed as negativelyrelatedto the demandfordepositssincethey tendto reducethe real returnsof the asset.
The accessibilityof a bankingofficeto the householdis relevantfor atleast two reasons:first,in offeringdepositservicesto the community,thehousehold'sopportunityset is broadenedin that the optionto save/holdfinancialassets is made available;and secondly,when accessibilityim-provesconvenienceand reducesthe resourcesexpendedin conductingbank transactions,theincentiveto savewiththe bank is increased. Thus,transactioncostscan be expected to playa crucialrolein influencingtherural household'sdemand for financial services. Conceivably,there issome thresholdlevel of transactioncostsat which it becomesbeneficialfor evena lowincomehouseholdto convertpartof itscash/orcommoditystocksintobankdeposits.
The motivationof bankinginstitutionsto supplydepositservicesis in-fluencedby the availabilityof profitableopportunitiesto investdeposits,
3. See Niehans for a discussion on the utility maximization based model of demandfor financial assets,

122 JOURNAL OF PHILIPPINE DEVELOPMENT
and the availabilityand cost of alternativesourcesof funds. Governmentpolicies and regulations that impact on the nature, composition and sizeof a financial institution's assets and liabilities will shape its profit oppor-tunities.4 They will also influence the return net of transaction costs thatsavers earn on their deposited funds.
Rural Income
The rural sector is the most dominant sector in the Philippineeconomy in terms of its share of total output and population (Table 1). Asexpected, much of the output in rural areas is agricultural whereas theurban output is entirely nonagricultural. Compared to the urban sector,aggregate rural income flows are larger and probably are characterizedby relatively more seasonality and variability associated with monsoonagriculture. This situation implies that in the aggregate there should begreater rural demand for financial opportunities to manage production un-certainties through time, along with possibilities for capital accumulationthat might facilitate investments for better production and income riskmanagement.
On the other hand, rural income is much lower than urban income inper capita terms. Rural per capita GDP during the 1977-1986period wasabout 30-35 percent of urban per capita GDP, and this is a reflection ofthe urban bias of economic development. Low incomes could representa serious constraint to the rural household's opportunity for financialassetholding, but the heterogeneity of households provides scope for financialintermediation. In particular, the cash flow patterns of some householdsare asynchronous as a result of differences in cropping patterns, enter-prise combinations, procurement and marketing strategies, consumptionpatterns and family lifecycles (Meyer and Alicbusan 1984).
Banking Offices in RuralAreas
There were about 2,500 banking offices in rural areas in 1986, com-prising 70 percent of the nation's banking network (Table 2). While thisnumber was a 27 percent increase over the 1977 figure, urban branchesgrew even more rapidly so that the p_oportion of banking offices servingrural areasactually fell from 1977to 1986.
The urban orientation of the banking system is even more pro-nounced in the bank density ratios which measure the number of in-habitants per banking office. At the peak number of banking offices, thedensity ratio in urban areas reached 5,500 inhabitants per banking office
4. The impact of regulationon the depositoryfirm in a profit-maximizati0nframeworkis extensivelyanalyzed in Spellman.

BLANCO and MEYER; RURAL DEPOSIT 123
Table 1PHILIPPINES: SELECTED ECONOMIC CHARACTERISTICS
RURAL vs, URBANaL=
Item Range b
Real GDP (Billion 1972pesos) 78.5 - 99,9Rural Share (%) 68 - 70
Population(million) 44.57 - 56.0RuralShare(%) 87 - 88
Shareof Agricto GDP(%)Rural 37 - 41Urban 0Philippines 25 - 29
Shareof Industryto GDP (%)Rural 24 - 29Urban 51 - 54Philippines 32 - 36
RealGDPper Capita(1972 pesos)Rural 1,306- 1,520Urban 3,771 - 4,975Philippines 1,621- 1,951
_/ In this and subsequent tables, "Phil" and "Philippines" are used interchangeab-ly; "urban" refers to "NCR" or National Capital Region in the NEDA data series,or "Region IV" in the Central Bank data series. "Rural" refers to the rest of thePhilippines outside of the NCR (NEDA data series), or outside of Region IV(Central Bank data series).
b_/ The minimum and maximum values, respectively during 1977-86.
Source: See Annex Table t.

124 JOURNALOFPHILIPPINEDEVELOPMENT
Table 2NUMBER OF BANKING OFFICES AND BANK
DENSITY RATIOS,URBAN VS.RURAL, 1977. 1986
No. of Bank DensityBanking O.ffices aJ Ratio b/
YearPhil Rural % Rural Phil Urban Rural
1977 2,660 1,957 74 16.8 7.6 20.0
1978 2,888 2,132 74 15.9 7.3 18.9
1979 3,188 2,343 73 14.8 6.8 17.6
1980 3,411 2,479 73 14.2 6.4 17.1
1981 3,538 2,506 71 14.0 5.9 17.3
1982 3,689 2,577 70 13.8 5.7 17.2
1983 3,822 2,635 69 13.6 5.5 17.3
1984 3,791 2,633 69 14.1 5.8 17.7
1985 3,594 .2,525 70 15.2 6.5 18.9
1986 3,581 2,492 70 15.6 6.6 19.6
_/ Year-endtotals.
b_./ Inthousandsof inhabitantsper bankingoffice thedenominatoris1.heyearendnumberofbankingoffices.
Source:C?nl_alBankof the Philippines,Factbookof the PhilippineFinancialSystem,Supplement,RegionalProfileof Banks,variousyears.NationalEconomicDevelopmentAuthority(NEDA),"PhilippineRegionalIncomeAc-counts',mlmeo.

BLANCO and MEYER: RURAL DEPOSIT 125
in 1983 while the lowest ratio in rural areas was achieved at 17,100 perbankingoffice in 1980.Whilethere were improvementsin ruralaccesstobanking offices during this period, these gains have been temporary.Throughoutthis period,the ruralbank densityratiowas more thantwicethe urbanbank densityratio,and by 191_6was aboutthe same levelas itwasa decadeeadier.
Furthermore,the bank densityratiotendsto mask the severityof theproblemof lack of access to rural bankingfacilities. In 1983, when theruraldensityratiowas low, over40 percentof the ruralmunicipalitiesdidnot havea singlebankingoffice(Table3). The scarcityof bankingofficesvariedfrom region to regionwith the extremecasesfound mostlyin theMindanaoRegions- the farthestfrom MetroManila. The data inTable3suggesta trendinrecentyears frommulti-bankmunicipalitiesto one-bankmunicipalities,and from one-bank municipalitiesto unbanked munic-ipalities.
The steadyincreaseinnumberof ruralbankingofficesupto 1983andthe declinethereaftersuggeststhat banks encounteredproblemsin sus-tainingviable rural operationsduringthe period of economicdownturn.Some rural banks closed when Central Bank rediscountfacilitiesweresuspendedin 1984andothersoperatedat impairedlevels.
Governmentefforts to developthe ruralfinancialsystemhave beensuccessfulin promotinga diversityof bankinginstitutions.Numerically,Rural Banks (RBs) predominatein rural areas followed by commercialbank (KBs)branchesElable4). Othertypesof bankinginstitutionsfoundin ruralareas are privatedevelopmentbanks (PDBs), §tooksavingsandloan associations(SSLAs),savingsand mortgagebank (SMBs)branchesand specializedgovernmentbank branches (SGBs). Prior to the 1980bankingreforms,RBs,PDBsandSSLAswere notauthorizedto engageinbranchbankingsothat mostof theirofficesbydefinitionare head offices.However,the head officesof mostKBs,SMBs, and $GBs are locatedinurbanareas.
TheRe/ativeAttractiveness of Deposit Instruments
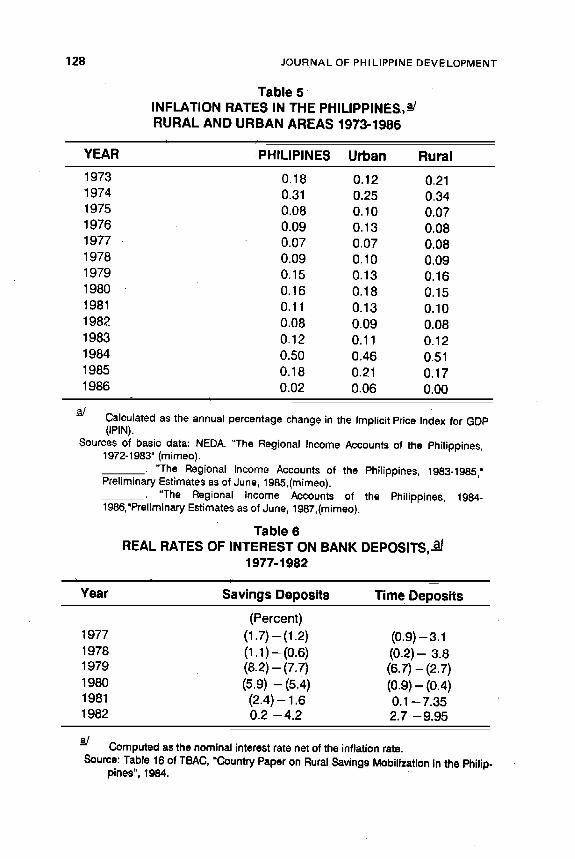
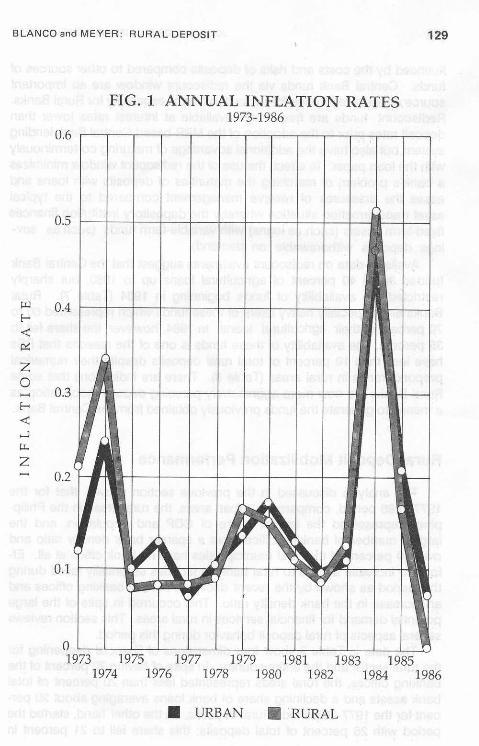
Ruralinflationrates have been somewhatlowerthan urbaninflationinrecentyearsbut higherduringperiodsof rapidlyrisingpricessuchas in1973 and1984 (Table5 and Figure1). Thedisincentiveeffectsof inflationon financialdevelopmentwere most severeduringthe period of interestrate.ceilingsprior to 1981 when realdepositratestendedto be negative(Table 6), Depositors experienced negativereal rates of return on theirbank deposits during the latter part of the 1970s and only began toreceive positive returns after interest rate regulationswere relaxed.
The supply of deposit services offered by banking institutions is in-

126 JOURNAL OF PHILIPPINE DEVELOPMENT
TABLE 3
DISTRIBUTION OF MUNICIPALITIES IN RURAL AREAS,BY NUMBER OF BANKING OFFICES, 1983 - 1986
% of Municipalities
Total With With WithYEAR Municipalities >1 Bank ! Bank No Bank
•1983 1,423 16 " " 44 41
1984 1,423 15 45 41
1985 1,465 14' 42 44
1986 1,469 14 42 44
Source: See Annex Table 2.

BLANCOandMEYER: RURALDEPOSIT 127
TABLE 4
DISTRIBUTION OF BANKING OFFICES, BY TYPE OF INSTITUTION,URBAN vs RURAL, 1977-1986
Type of Bank_/
Year KBs SMBs PDBs SLAs RBs SGBs Total b/
(Percent)RURAL
1977 34 4 4 • 6 48 4 1873
1978 34 5 4 6 47 4 20341979 34 5 4 7 46 4 22321980 33 5 5 8 46 4 2407
1981 36 2 5 8 44 4 25391982 38 3 6 8 42 4 2567
1983 38 3 6 8 42 4 26151984 37 3 6 8 43 4 2644
1985 38 1 6 7 44 4 25711986 36 3 6 7 43 4 2509
PHIL
1977 45 7 4 6 36 3 25371978 44 7 4 6 35 3 27571979 44 7 4 7 35 3 3027
1980 43 8 4 7 35 3 32781981 47 5 5 7 33 3 3519
1982 49 5 5 8 30 3 36801983 49 5 6 8 •30 3 3764
1984 49 5 6 7 30 3 3829
1985 51 3 6 6 31 3 36601986 48 6 6 6 31 3 3597
tg KB--=CommercialBanksSMB=-Savings/MortgageBanksPDB= PrivateDevelopmentBanksSLA= StockSavingsandLoanAssociationsRB =RuralBanksSGB= SpecializedGovernmentBanks
.b_/ Thequarterlyaveragenumberfortheyear,
Soumesofbasicdata:CentralBankofthePhilippines,FactbookPhih'ppineFinancialSystemSupplemen_RegionalProfileof Banks,variousyears.
128 JOURNAL OF PHI LIPPINE DEVELOPMENT'
Table 5
INFLATION RATES IN THE PHILIPPINES, a-/RURAL AND URBAN AREAS 1973-1986
YEAR PHILIPINES Urban Rural
1973 0.18 0.12 0.211974 0.31 0.25 0.341975 0.08 0.10 0.071976 0.09 0.13 0.081977 0.07 0.07 0.081978 0.09 0.10 0.091979 0.15 0.13 0.161980 0.16 0.18 0.151981 0.11 0.13 0.101982 0.08 0.09 0.081983 0.12 0.11 0.121984 0.50 0.46 0.511985 0.18 0.21 0.171986 0.02 0.06 0.00
i.
Calculated as the annual percentage change in the Implicit Price Index for GDP(IPIN).
Sources of basic data: NEDA. "The Regional Income Accounts of the Philippines,1972-1983" (mimeo).
• "The Regional Income Accounts of the Philippines, 1983-1985"Preliminary Estimates as of June, 1985,(mimeo).
"The Regional Income Accounts of the Philippines, 1984-1986,'Preliminary Estimates as of June, t 987,(mimeo).
Table 6
REAL RATES OF INTEREST ON BANK DEPOSITS, a-]1977-1982
= j
Year Savings Deposits Time Deposits
(Percent)
1977 (1.7) - (1.2) (0.9) - 3.11978 (1.1) -- (0.6) (0.2) -- 3.81979 (8.2) -- (7.7) (6.7) -- (2.7)1980 (5,9) -- (5.4) (0.9) - (0.4)1981 (2.4) -- 1.6 0.1 -- 7.351982 0.2 --4.2 2.7 -9.95
_/ Computed as the nominal interest rate net of the inflation rate.
Source:Table16ofTBAC"CountryPaperonRuralSavingsMobilizationinthePhilip-pines",1984.

130 JOURNAL OF PHILIPPINE DEVELOPMENT
fluenced by the costs and risks of depositscomparedto othersourcesoffunds. Central Bank funds via the rediscountwindow are an importantsourceof bank resourcesfor agriculturalloansespeciallyfor RuralBanks.Rediscount funds are frequently availableat interestrates lower thandepositratespriorto the adoptionof the MRR-basedCentralBanklendingsystem,butalsohave the additionaladvantageof maturingco-terminouslywith the loan paper. In effect,the useof the rediscountwindowminimizesa bank's problemof matchingthe maturitiesof deposits with loansandeases the pressures of reserve managementcompared to the typicalasset transformationsituationwherebythe depositoryinstitutionfinancesfixed-termassets(suchas loans)withvariable-termfunds (suchas sav-ings deposits withdrawable on demand).
Availabledata on rediscountavailmentssuggestthattheCentralBankfunded 30 to 40 percent of agriculturalloans up to 1983, but sharplyrestrictedthe availabilityof funds beginningin 1984 (Table 7). RuralBanksare especiallyheavyusersof these fundswhichrepresented60 to70 percentof their agriculturalloans. In 1984,however,the sharefell to35 percent.The availabilityof these funds is one of the reasonsthat RBshave lessthan 10 percentof total rural depositsdespite their numericalpreponderancein ruralareas (Table 8). Thereare indicationsthat someRuralBanksare now more aggressivelypursuingdeposit mobilizationasa meansto generatethe fundspreviouslyobtainedfromthe CentralBank.
Rural Deposit Mobilization Performance
The analysisdiscussedin the previoussectionshows that for the1977-1986period,comparedto urbanareas,the ruralareasin the Philip-pines representedthe largest share of GDP and population,and thelargestnumberof bankingoffices,but a sparserbank densityratioandover 40 percentof the ruralmunicipalitieshaveno bank officeat all. Ef-forts to increaseaccessto ruralbankingfacilitiesessentiallyfailedduringthisperiodas shownby the recentdecreasein ruralbankingofficesandan increasein the bankdensityratio. This occurredin spiteof the largepotentialdemandforfinancialservicesin ruralareas. Thissectionreviewsseveralaspectsof ruraldepositbehaviorduringthisperiod.
The data inTable 9 show four dimensionsof financialdeepeningforthe ruralsectorand the entirecountry. Inspiteof having70 percentofthebankingoffices,the ruralareasrepresentedlessthan 20 percentof totalbank assetsand a decliningshareof bank loansaveragingabout 20 per-centforthe 1977-86period. Ruraldeposits,on the otherhand,startedtheperiod with 26 percent of total deposits;thisshare fell to 21 percent in

BLANCOandMEYER: RURALDEPOSIT 131
Table 7RATIO OF AGRICULTURAL REDISCOUNT AVAILMENTS TO
AGRICULTURAL LOANS GRANTED, BY TYPE OF INSTITUTION1978- !984
Year
Type of Bank 1978 -1979 1980 1981 1982 1983 1984
(Percent)
Government Banks 57.7 15.7 4.8 24.0 4.2 4.1 0.7(PNB, DBP, LBP)
Private CommercialBanks 18.0 37.7 48.5 36.7 38.1 26.6 12.7
Thrift Banks - 8.1 13.0 13.3 i0.9 7.2 2.7
Rural Banks 66.4 67.8 70.8 68.9 73.7 69.3 35,4
ALL BANKS 32.3 36.6 43.2 39.0 37.0 29.9 14.5
Source: Table30 of TBAC,"AGriculturalCreditStudy:TablesandAnnexTables,"1985.

132 JOURNALOFPHILIPPINEDEVELOPMENT
TABLE 8DISTRIBUTION OF BANK DEPOSITS IN RURAL AREAS,
BY TYPE OF INSTITUTION, 1977- 1986
Type of Bank_/
Year KBs SMBs PDBs SLAs RBs SGB$ Total _
(percent)
1977 79.4 4.9 2.6 3.2 9.1 0.8 10.14
1978 77.5 6.4 2.5 3.6 8.9 1,1 12.75
1979 74.6 7.9 2.8 3,8 9.3 1.6 15.22
1980 74.1 7.4 3.0 4.1 9.2 2.4 17,34
1981 76.6 4.8 3.3 4.3 8.9 2.2 21.29
1982 76.7 4.4 3.9 4.6 8,1 2.4 29,86
1983 76.4 4.4 3.9 4.8 8.2 2.3 33.58
1984 79,1 3,0 3.5 4.0 8.0 2.4 36,76
1985 82.4 1.8 3.6 3.3 6.9 2.2 41.08
1986 79.5 4.4 3.7 3.2 7.0 2.2 48.02
_/ KB=CommercialBanksSMB=Savings/MortgageBanksPDB= PrivateDevelopmentBanksSLA= StockSavingsandLoanAssociationsRB = RuralBanksSGB= SpecializedGovernmentBanks
inbillionpesos;thequarterlyaveragevolumeforeveryyear,except1982whichshowsa yearendbalance.
Sourcesofbasicdata:CentralBankofthePhilippines,FactbookPhilippineFinancialSystem,Supplement,RegionalProfileofBanks,variousyears.

¢o
TABLE 9DISTRIBUTION OF BANK ASSETS, zc_OFFICES, DEPOSITS AND LOANS, o
URBAN vs. RURAL,1977-1986ill
YEAR BANK ASSETS BNKG OFFICES DEPOSITS Bank Loans m<PhiP / % Rural Phil _ % Rural Phil_J' % Rural Phil _' % Rural P
-nC
1977 111.75 19 2,660 74 42.60 26 61.67 23 ::o
1978 140.75 19 2,888 74 53.84 26 77.19 22 t-o1979 176.35 18 3,188 73 70.91 23 1O0.47 20 m_o
01980 209.89 17 3,411 73 88.25 21 1t 8.12 20 -t1981 256.48 17 3,538 71 100.32 23 144.28 20
1982 312.09 17 3,689 70 123.99 24 162.06 21
1983 389.02 16 3,822 69 141.46 25 209.45 181984 465.11 14 3,791 69 153.14 26 212.74 16
1985 473.10 15 3,594 70 165.55 26 181.69 17
1986 486.15 17 3,581 70 174.34 31 185.08 18
Yearend totals, amounts are in billion pesos.
Sources of basic data: Central Bank of the Philippines, Factbook Philippine Financial System, Supplement, Regional Profile of Banks,various years.

134 JOURNAL OF PHI LIPPINE DEVELOPMENT
1980, then steadilyroseto 31 percentby 1986. Thesedata suggesttwoimplications. First, the relation between share of bankingoffices andshareof bankassetssuggeststhat ruralofficesare comparativelysmallinterms of assets. Second, the relationbetween ruraldepositsand ruralloans switchedduring the period. Through 1983, total rural loans ex-ceeded ruraldeposits implyingan urbanto ruraltransferof funds. From1984 onward,however,ruraldepositsexceeded ruralloans suggestingareversalin the directionof flow of funds. Thischange occurredbecauseruraldepositssteadilyroseduringthe entireperiod in spite of the declineinbankingoffices,whiletotalbankloanspeakedin 1984.
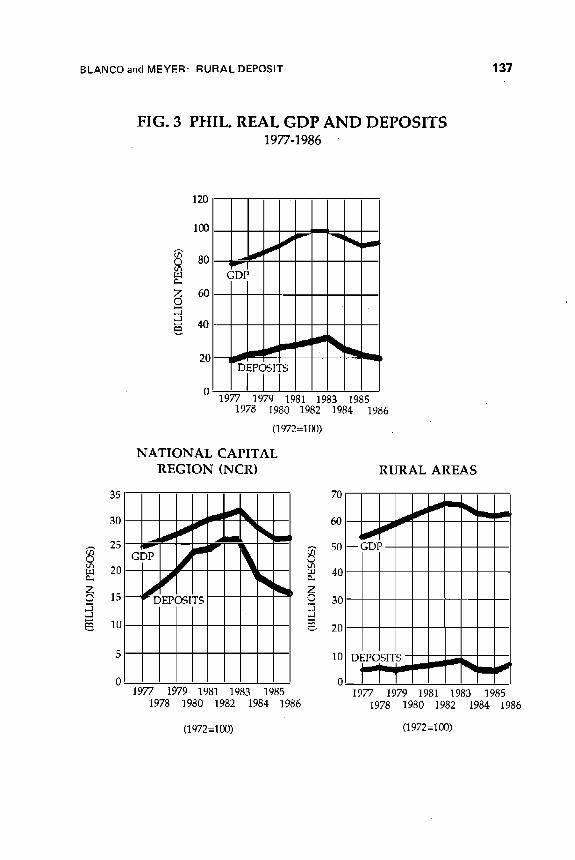
The relationbetweengrowth rates of real GDP, bank depositsandloansis analyzedand reportedin Table 10. The overallperiod is brokeninto two subperiodsdivided at 1981 becausethe completionof interestrate deregulationon deposit instrumentsoccurred inthat year. Two dis-tinct patternsemerge. Duringthe first period,the growth ratesin GDP,depositsand loans are all positivewith the urban rates beingrelativelyhigherthan the rural rates. Urban depositsand loans grew at rates ofabout 12 percent,almost double the rates experiencedin rural areas.During the second period, all these growth rates are negative in bothareas but there are importantdifferences.The rateof declineindepositsisslowerbut the declinein loansis much faster in ruralareasthan in urbanareas,therebycausingthe ruralto urbantransferof funds. One explana*tion may be that the bankingsectoriscompelledto try to sustainlendingoperationswith preferredurbanclientsinthe face of fallingurbandepositseven if it means restrictingrural loans. Alternatively,the economicdownturn may have caused a more rapid decline in rural loan demandthan occurred in urban areas. Another reasoncould be the decline ingovernmentfundsavailablefor rurallending. Furthermore,duringpartofthisperiod,the interestratepaid ongovernmentcertificateswasvery highso it isreportedthat somebanksshiftedpartof theirportfolioout of loansintothese certificates. A more detailed analysisof lendingoperationsisneededto sortoutthis issue.Onthe deposit side, it is clearthat comparedto urbanareas, ruraldeposits_didnotgrowasquicklyintheprosperityof the1970s nordidthey declineas quicklyinthe recessionof the 1980s. (Fig.3)
The two additionalfinancialdeepening measuresof Ioan:GDP anddeposit:GDP ratiosare presentedinTable 11. Thesedata show that thefinancialdeepeningthatoccurredin the early part of the period is a tem-porary and unsustaineddevelopment. The urbanIoan:GDPratiogeneral-ly increasedfrom 1977 to 1983 indicatingthat over time the urbanareautilizeda relativelylargeramountof loansto generatea unitof economicoutput.Duringthesame period,the ruralloan:GDP ratiohardlychanged.The ratio for both sectors declined after 1983 so that by 1986
they were both lowerthan in 1977. In the case of the rural sector,the

BLANCOandMEYER:RURALDEPOSIT 135
Table 10GROWTH RATES OF REAL GDP, BANK DEPOSITS AND
LOANS, RURAL vs. URBAN,a/1977-85
Period
ITEM Whole Period tst Sub-period 2nd Sub-period(1977-1985) (1977-1981) (1981-1985)
RURAL (Percent)
GDP 2.15 4.96 - 1.20
Deposits 3.90 6.63 - 4.41Loans - 2.73 6.49 - 19.20
URBAN
GDP 1.86 5.72 -3,47
Deposits 2.73 12.56 - 8.25Loans 2.74 11.55 - 7.24
PHIUPPINE$
G_P 2.07 5,20 - 1,90
Deposits 2.98 11.36 - 7.43Loans 1.92 10.67 - 8.98
GrowthrateswereestimatedusingOLSonquarterlyfinancialdatadeflatedbytheregionalImplicitGDPdeflator(IPIN).
Sourcesofba_cdata:CentralBankofthePhilippines,FactbookPhih'ppineFinancialSystern,Supplement,RegionalProfileof Banks,variousyears.NationalEconomicDevelopmentAuthority(NEDA),"PhilippinesRegionalIncomeAccounts,"mimeo.
136 JOURNAL OF PHILIPPINE DEVELOPMENT
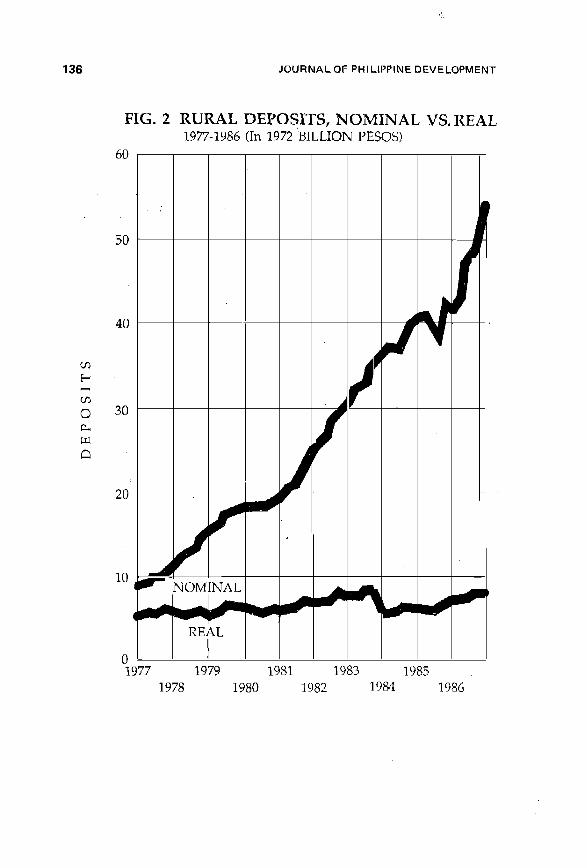
FIG. 2 RURAL DEPOSITS, NOMINAL VS. REAL1.977-1986 (In 1972 BILLION PESOS)
60
5o J
ZU3
O 3O
rrl
)20
f_.,J
10 r NOMINAL
REAL
01977 1979 1981 1983 1985
1978 1980 1982 1984 1986
BLANCO and MEYER: RURAL DEPOSIT 137
FIG. 3 PHIL. REAL GDP AND DEPOSITS1977-1986
120
100
_ 80 _mGDP
r_7 600
4020 DEP__I_ _ J_ _1_
o I1977 1979 1981 1983 '1985
1978 1980 1982 1984 1986
(1972=100)
NATIONAL CAPITAL
REGION (NCR) RURAL AREAS
35 70
30 _J _ - 60 ""a _ _ _" _ _
_.aaaa % _ aa_
cDr j jr S0--CDr-2o _ _ ez 3o-- 15-- I S,..a,._1 _l
1o _ 20
5 10 DEPOSITS-
o o Y'_"""" _" _1977 1979 1981 1983 1985 1977 1979 1981 1983 '1985
1978 1980 1982 1984 1986 1978 1980 1982 1984 1986
(1972=100) (1972=100)

138 JOURNAL OF PHILIPPINE DEVELOPMENT
TABLE 11
FINANCIAL DEEPENING INDICATORS,URBAN vs. RURAL, 1977- 1986
I=-
YEAR PHIL URBAN RURAL
1, Loan: GDP Ratio
1977 0.36 0.94 0,12
1978 0.39 1.03 0.12
1979 0,42 1.15 0.121980 0,44 1.19 0.12
1981 0.44 1.15 0.13
1982 0.45 1.15 0.13
1983 0,49 1.28 0,13
1984 0.40 1.14 0.09
1985 0.31 0.91 0.071986 0.30 0.83 0.08
2. Deposit: GDP Ratio
1977 0.25 0.63 0.08
1978 0.27 0.68 0.091979 0.29 0.74 0.08
• 1980 0.31 0.81 0.08
1981 0.32 0.80 0.09
1982 0.33 0..82 0,111983 0,34 0.81 0.12
1984 0.27 0.68 0,08
1985 0,25 0.65 0.09
1986 0,25 0.60 0.11

BLANCO and MEYER: RURAL DEPOSIT 139
decline is a remarkable50 percent (0.12 to 0.08). This impliesthat self-finance and, most likely, informal finance plays increasinglyimportantrolesin financingruraleconomicactivities.
A differentpicture emerge with deposits. The urbandeposit:GDPratio follows a pattem similarto loans (rising to peak in the eady1980s,then fallingsothe 1986levelwas below1977). Surprisingly,the ruralsec-torfollowsa differentpattern. There is only a slight increaseduringthe1970sas deposit growthwas roughlysimilarto GDP growth. Depositsgrew more rapidlythanGDP duringthe 1980s, however,so that the ratioendedthe periodat 0.11 comparedto 0.08 at the beginning.
The deposit: GDP ratios are also presentedin Figure 4. Althoughthere are significantdifferencesin scale (urbanratiosof 0.8 comparedto0.08 for ruralareas),the similaritiesand differencesbetweenthe two sec-tors are importantto note. in bothsectors,as GDP increaseddepositsrose at a faster pace so the deposit:GDPratio rose, especiallyfor theurbansector. ASrealGDP beganto fallafter 1981,however,depositsdidnot fall as quickly. The decline in deposit:GDP ratioduringthe recess-ion was slower than would have been predicted by the path of the in-creaseobservedduringthe expansionaryperiod.
These findings show that duringthe 1980s rural and urban saverswere willingto hold a higher proportionof GDP in depositsat similarorlower levelsof GDP per capita than in the 1970s. Surprisingly,the ruraldeposit:GDP ratiocontinuallyroseinthe 1980swhenGDPper capitafell.
Thisanalysiswill haveto be extendedwith more recentdata to see ifthese conclusionsholdor simplyrepresentlags in adjustingdepositstofallingGNP. Ifthesetrendscontinue,it willbe usefulto to determinewhythere seemsto havebeena shifttowardhigherdeposit:GDPratiosrelativeto GDP per capitaduringa periodof economicstress,politicalstrifeanduncertainties about banksafety. Severalfactorscouldbeat work. First,this resultcouldrepresentthe effect of learning:depositorsmay havebe-come accustomed to the use of banks during the expansion of theeconomyandthe financialsysteminthe 1970sand choseto keepa largerthan predicted level of depositsin the 1980s eyen thoughthe economyandthe bankingsystemnetworkshrank. Secondly,withthe tighteningofrediscountconditions,banking institutionsmay.have worked hardertomobilizedeposits in the 1980s. Third, the improvementin real rates ofreturnondepositsafterinterestratederegulationmay havestimulatedad-ditionaldeposits_especiallyduring a recessionaryperiod when rates ofreturnon otherinvestmentsmay havebeen low and uncertain. Fourth,there may havebeen a shift indemandfor depositsbecauseof changesin householdincomedistributionand largeamountsof foreignremittan-ces receivedbyruralhouseholds.

140 JOURNAL OF PHILIPPINE DEVELOPMENT
FIG. 4. DEPOSIT AND INCOME GROWTH TRENDSPHILIPPINES1977-1986
035
0386 79__ 025< 77
_ 02
¢_ 015
01
005 --
/31600 1700 1800 1900 --
1650 1750 1850 1930
GDP PER CAPITA (1972 Pesos)
NATIONAL CAPITAL
REGION (NCR) RURAL AREAS •
09 8]3__ 2 O1%_
05 _ 77 78 79-808104 _ OC
02OC
Ol
03600 4000 4400 4800 1300 1350 1400 1450 1500
38O0 4200 4600 5000
GDP PER CAPITA (i972 Pesos).. GDP PER CAPITA (1972 Pesos)

BLANCO and MEYER; RURAL DEPOSIT 141
Conclusion
The analysis in this paper showsthatthereis a largepotentialfinancialmarketto be tapped inruralareasdue to itslargeshareof populationandGDP. Governmentefforts to improverural access to financialservicesresultedinan expansionof ruralbankingofficesup to 1983whenthey ex-ceeded2600 units,but the numberbeganto declinethereafter. Thebankdensity ratio in rural areas was no greater in 1986 than it was in 1977.Over40 percentof the ruralmunicipalitiesstillhad no bankingofficesinthe mid 1980s. Althoughruralareashaveabout70 percentof the bankingoffices,they representlessthan20 percentof bankassetsand loans. Theshareof ruraldepositsincreasedto about30 percentin 1986,however,inspiteof the declinein ruralbankingoffices.
A comparisonof rural and urbanareas in growthin GDP, loansanddeposits over the 1977-86 period reveals an interesting contrast.Depositsand loansgrew faster than GDP in the expansionaryperiod of1977-1981for bothareas,but thegrowthratesinthe ruralareaswereonlyabout one-half of what they were in urban areas. Therefore, financialdeepeningwas occurring much more quickly in urban areas. In therecessionaryperiod of 1981 to 1986, depositsand loans fell in bothsec-tors. Thesedeclineswere roughlyparallelinthe urbanareas soby 1986,the urbanIoan:GDPratioand deposit:GDPratiowere roughlyequalto orbelowtheir1977 levels. In the ruralareas,however,loans fellmuchfasterthan depositsso the rural loan: GDP ratio in 1986 was 50 percent lessthan in 1977,whilethe deposit:GDP ratioactuallyrose from0.08 to 0.11duringthe period. Th.eruraldeposit:GDP ratiocontinuedto increaseinthe 1980sdespitea declineinruralbankingofficesand in percapitaGDP.Severalfactorscould explainthisresultsuch as the increasein the realrate of returnearnedon deposits,changesin incomedistribution,the ef-fect of learningthe bankinghabit,and moreaggressivedepositmobiliza-tion bybanks.
There appearsto be a considerableopportunityremainingto tap ruraldeposits. Past emphasison encouragingrural bankingthrough heavysubsidiesand easy access to governmentfundsmay have discouragedlending institutions,especiallyRural Banks, from aggressivelypursuingdepositaccounts. The regulatedinterestratestructurecoupledwith highinflationmay also have been a disincentive. The currentcontractioninrural banking officesis a disappointingdevelopmentbecauseof the in-crease in depositortransactioncoststhat may occur whenaccessabilityis reduced.Some RuralBanksare now undertakingspecialcampaignstomobilize new deposit accounts. Their experience may help provideguidanceabout the crucialelementsof a ruraldeposit mobilizationpro-gram.

142 JOURNAL OF PHILIPPINE DEVELOPMENT
In spite of a long history of governmentefforts, there is stilla consi-erableurbanbiasinthe financialsystem. The expansionof ruralbankingoffices suffereda contraction.in the past.few years. Rural loans anddepositsrepresenta fairlysmallshare of total bankingactivityin spite ofthe large size of the sectorand its population. It is clearthat the Philip-pines has yet to find the appropriateformulato developrural financialmarketson a viable,self-sustainingbasis.Tappingruraldepositsshouldbe a fairly simpletask of offeringattractivedepositinstruments,reducingdepositor transactions costs, and improving perspectives about thesecurityof banks. The efficientexpansionof rurallendingrequiresa bet-ter understandingof the risksand returnsavailablefrom ruralinvestments,and investors'perceptionsabout such returns. Improvingrural invest-ment climate is a much more difficult.long-termchallengethan simplytinkeringwithfinancialand bankingpolicies.

Annex Table 1 m
PHILIPPINES: STRUCTURAL CHARACTERISTICS,RURAL vs URBAN _ 1977-1886 zi ¢3
o
PER CAPITA SHARE OF SHARE OF INDUSTRYREAL GDP POPULATION GDP _ AGRI .TO GDP (%) TO GDP (%)
Year rn-<PhilN %Rural Phil bJ %Rural Phil Urban Rural Phil Urban Rural Phil Urban Rural m_o
1977 78.5 68.9 44.572 88.0 1,760 4,556 1,378 26.5 0.0 38.4 35.6 53.5 27.4- c1978 82.8 68.9 45.783 87.9 1,808 4,631 1,418 26.1 • 0.0 37.9 35.8 53.4 27.8
3>1979 88.0 68.8 47.031 87.8 1,870 4,774 1,465 25.7 0.O 37.4 36.4 52.5 29.0 1-
1980 92+6 68.5 48.315 87+7 1,917 4,912 1,497 25.6 0.0 37.4 36.1 52.2 28.7 om-g
1981 96.2 68.3 49.526 87.6 1 _943 4,971 1,514 25.6 0.0 37.5 36.3 52.3 28.9 O1982 99.0 68.2 50.741 87.5 1,951 4,975 1,520 25.6 0+0 37.6 36.1 51.9 28+71963 99.9 67.7 52.052 87.4 1,920 4,928 1,487 24.9 0.0 36.7 36.0 51.6 28.5
1984 93.9 68.9 53.350 87.4 1,761 4,339 1,388 27.1 0.0 39.3 34.2 51.4 26.5
1985 89.8 70.4 54.668 87.3 1,643 3,833 1.324 29.0 0.0 41.2 32.2 52.0 23.81986 90.8 70.3 56.005 87.2 .1,621 3,771 1,306
Aggregateforthe Philippinesisinbillion1972Pesos.
b/AggregateforthePhilippines is inmillioninhabitanls.
g'/' AJIin1972Pesos.
._t In thisandsubsequenttables, =PHIL*and "Philippines"are usedinterchanoeably;=urban+refersto "NCR"or NalionalCapitalRegionin the NEDAdatasedes,or =Reg_nIV" in the CentralBankdataseries.=Rural"refersto the restof the Philippinesoutsideof the hlCR(NEDAdataseries),or outsideofRegionIV (CentralBankdataseries).
Sourcesof basicdata:NEDA."TheRegionalIncomeAccou_softhe Philippines,1972-1983"(mimeo).. "TheRegiona_IncomeAccountsof the Phi_ippine+s,'_98.3-1985,"PreliminaryEstimatesasof June,1985_(mimeo). ,,1+."The RegionalIncomeAccountsof thePhilippines,1984-1986,'PreliminacyEstimatesaso1June,1987,(mimeo1.

144 JOURNALOFPHILIPPINEDEVELOPMENT
Annex Table 2
• NUMBER OF MUNICIPALITIES, BY NUMBER OF BANKINGOFFICES, URBAN vs, RURAL, 1983 - 1986 a/
No of Mun With With With
Year/Item Total b-/ > 1 Bank 1 Bank No Bank
1983
RURAL 1,423 225 621 577URBAN 13 13 0 0
PHILIPPINES 1,436 238 621 577
1984
RURAL 1,423 212 634 577URBAN 13 13 0 0
PHILIPPINES 1,436 225 634 577
1985RURAL 1,461 201 615 645URBAN 13 13 0 0
PHILIPPINES 1,474 214 615 645
1986
RURAL 1,469 . 201 615 653URBAN 13 13 0 0
PHILIPPINES 1,482 214 615 653
a_/ Thereportingof numberof townsby numberof bankingofficesbeganonly in1983.
b_/ In 1975,therewere1,461municipalitiesin thePhilippines.Notethat for 1983-84,the totalsreportedarelessthan the 1975total, andfor 1985-1986the totalsaremuch greater.For the latter period, much of the increasein the count ofmunicipalitiesis accountedfor by the FrontierRegions,i.e., the CagayanValley(Regionii) andthe MindanaoRegions.
Sourcesof basicdata: CentralBankof the Philippines,FactbookPhilippineFinancialSystem,Supplement,RegionalProfileof Banks,variousyears.

BLANCO and MEYER: RURAL DEPOSIT 145
BIBLIOGRAPHY
Adams, D.W, D.H.Graham,and Von Pischke,J.D. eds.Undermining RuralDevelopment with Cheap Credit. Boulder, Colorado: Westview Press,1984.Bourne, C. and D.H. Graham. "Problems With Specialized Agricultural
Lenders." Undermining Rural Development with Cheap Credit. Eds.D.W Adams, D.H. Graham and J.D. Von Piscke.Boulder:WestviewPress, 1984.
Central Bank of the Philippines. Factbook on Philippine Financial Sys-tem: Supplement, Regional Profile of Banks. Variousyears.
Gonza!esNega, C. and A.R. Camacho. "Finance and Rural-UrbanInterac-tion in Honduras." Economics and Sociology Occasional Paper No.1478.Departmentof Agricultural Economics and Rural Sociology,theOhio State University, Ohio, 1988.
Lamberte, M.B. and J. Lim. "Rural FinancialMarkets: A Reviewof Litera-ture." PIDS Staff Paper Series No. 87-02. Makati: Philippine Institutefor Development Studies, 1987.
McKinnon, R.I. Money and Capital in Economic Development.Washington D.C.:The Brookings Institution, 1973.
Meyer, R.L. "Rural Deposit Mobilization: An Alternative Approach forDeveloping Rural Financial Markets." Economics and Sociology Oc-casional Paper No. 1168.Department of Agricultural Economics andRural Sociology, the Ohio State University, Ohio, 1985.
and A.P. Alicbusan. "Farm Household Heterogeneity andRural Financial Markets," Undermining Rural Development withCheap Credit. Eds. D.W. Adams, D.H. Graham and J.D. Von Pischke.Boulder: Westview Press, 1984.
Niehans, Jurg. The Theory of Money. Baltimore, Maryland: The JohnHopkins UniversityPress, 1978.
Patrick, H.T. "Financial Development and Economic Growth in Under-developed Countries." Economic Development and Cultural Change14, No. 2 (1966): 174-189.
Shaw, E.S. Financial Deepening in Economic Development. New York,NY.: Oxford University Press, 1973.
Spellman, Lewis J. The Depository Firm and Industryi Theory,History andRegulation. New York, N.Y.: Academic Press, Inc., 1982.
Technical Board for Agricultural Credit. "Country Paper on Rural SavingsMobilization in the Philippines." Manila, 1984.
"Agricultural Credit Study: Tables and Annex Tables." Manila,1985.
and University of the Philippines'Business Research Foundation(UPBRF), "Rural Financial Markets Study in the Philippines." Manila,1981.