runway safety data - international civil aviation organization 2/p2.3_iata... · global aviation...
TRANSCRIPT

Runway Safety Data Global Runway Safety Symposium
Lima, 20-22 November 2017

Accident Database of commercial
aviation accidents
GDDB Database of
ground damage incident reports
STEADES Database of
airline incident reports
FDX Database of FDA and FOQA type
events
Global Data Exchange Programs Individualized Airline Service
Data used to create the IATA Safety Report
Flight Data Analysis Service
Global Aviation Data Management (GADM)

IATA Safety Data This presentation covers data GADM accident Database
using data from January 2012 through December 2016.
There were a total of 375 commercial accidents during this period: Of which, 373 could be assigned an accident category
or End State 55 Fatal Accidents
of which, 54 could be assigned an accident category or End State
1,634 total fatalities
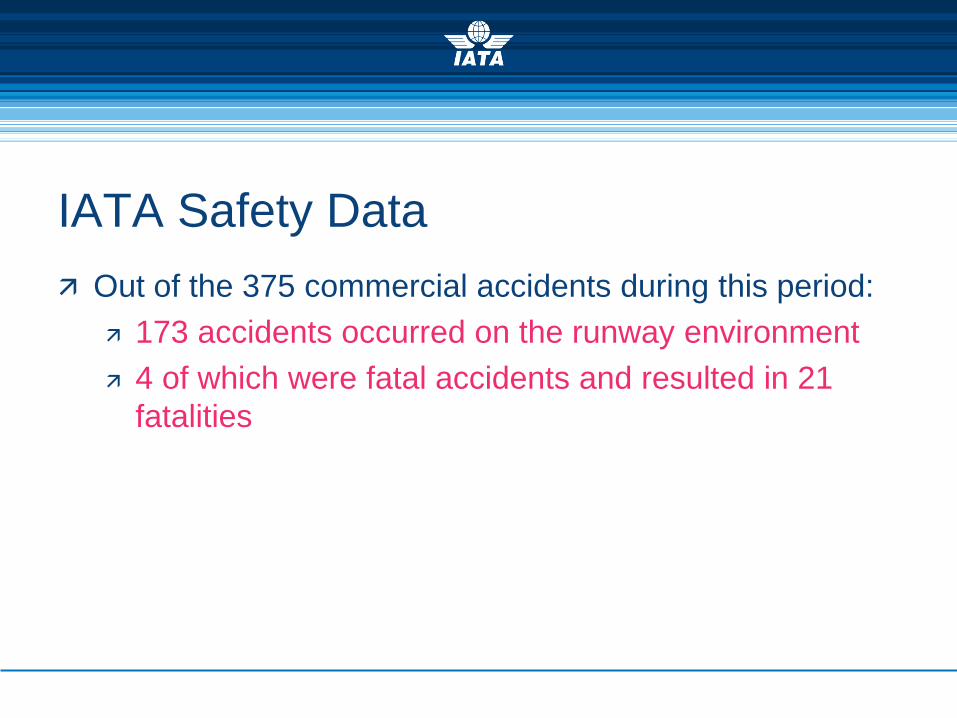
IATA Safety Data Out of the 375 commercial accidents during this period:
173 accidents occurred on the runway environment 4 of which were fatal accidents and resulted in 21
fatalities

Frequency of Accident Categories
The arrows indicate Runway Safety events

Accident Category Number of Accidents
Fatal Accidents
Number of Fatalities
Loss of Control In-flight (LOC-I) 30 27 949
Controlled Flight Into Terrain (CFIT) 19 16 259
Other End State 12 4 318
Inflight Damage 35 3 86
Runway / Taxiway Excursion 82 3 14
Undershoot 12 1 7
Top Fatal Accident Categories

Runway Safety Accident Count
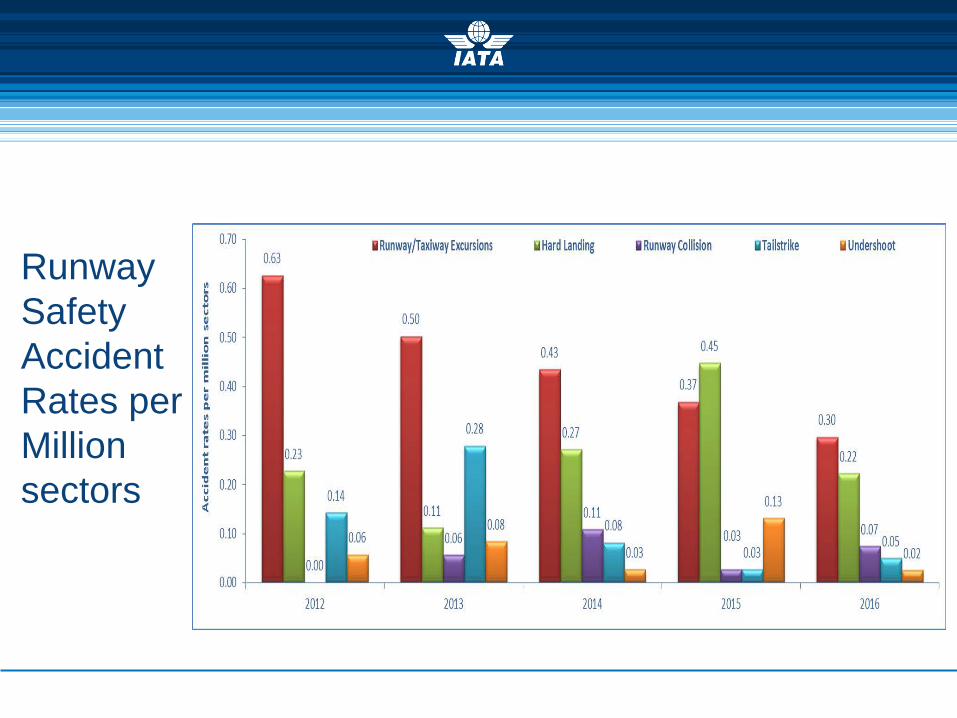
Runway Safety Accident Rates per Million sectors
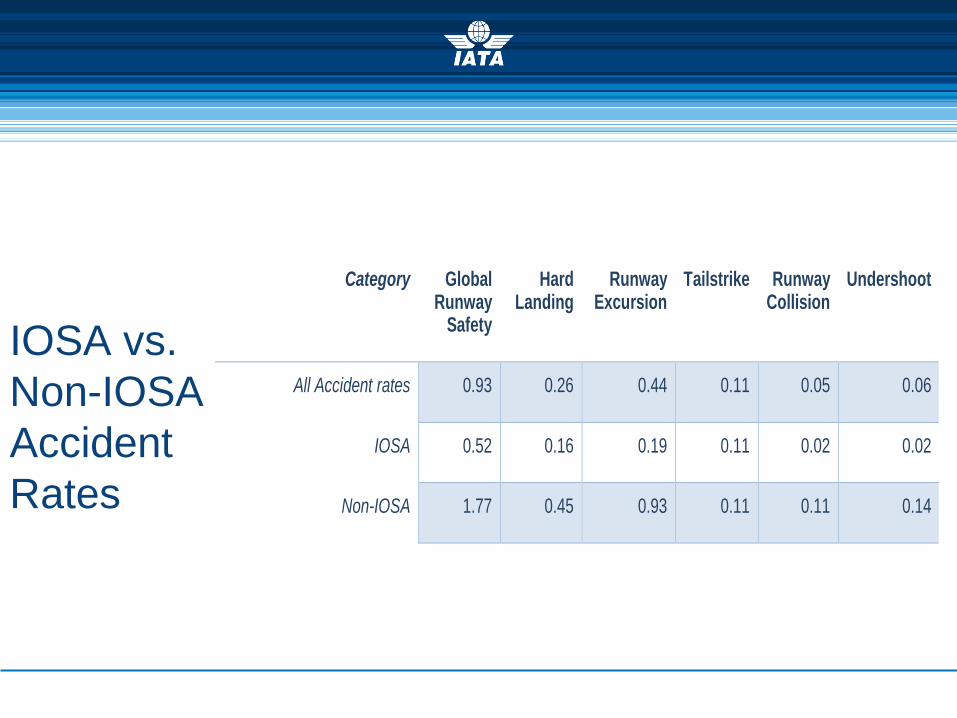
IOSA vs. Non-IOSA Accident Rates
Category Global Runway
Safety
Hard Landing
Runway Excursion
Tailstrike Runway Collision
Undershoot
All Accident rates 0.93 0.26 0.44 0.11 0.05 0.06
IOSA 0.52 0.16 0.19 0.11 0.02 0.02
Non-IOSA 1.77 0.45 0.93 0.11 0.11 0.14

Distribution of jet / turboprop runway safety accident rates

Jet and turboprop operations by runway safety accident category
Jet Turboprop
Runway / Taxiway Excursion 41 41
Hard Landing 31 17
Runway Collision 3 7
Tail strike 16 5
Undershoot 6 6
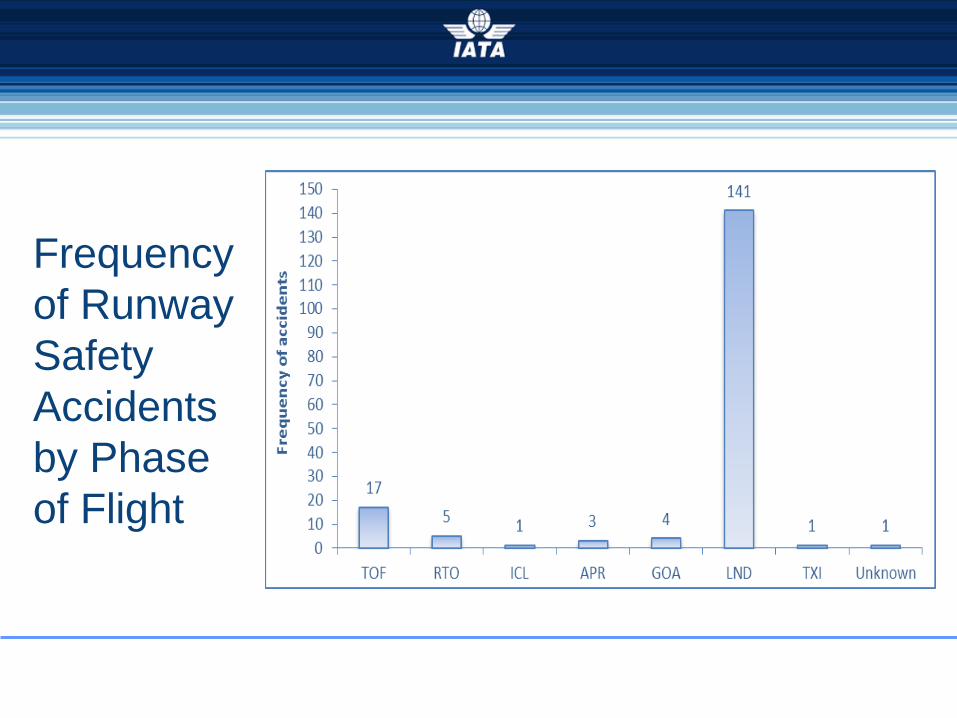
Frequency of Runway Safety Accidents by Phase of Flight

Runway Safety Accident Rates by IATA region of operator
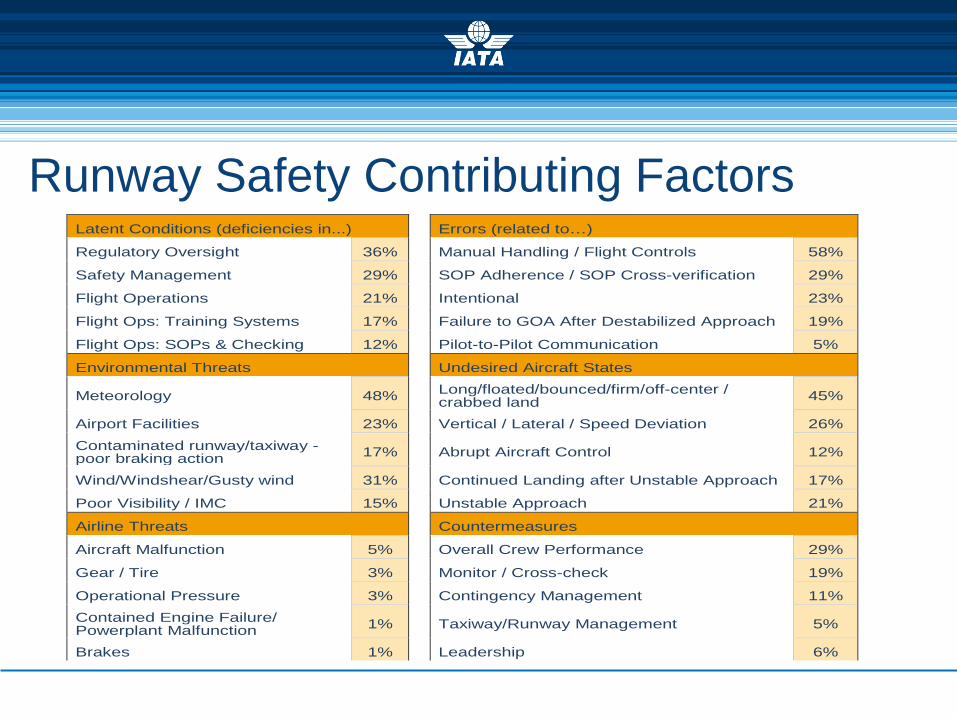
Runway Safety Contributing Factors
Latent Conditions (deficiencies in...) Errors (related to…)
Regulatory Oversight 36% Manual Handling / Flight Controls 58%
Safety Management 29% SOP Adherence / SOP Cross-verification 29%
Flight Operations 21% Intentional 23%
Flight Ops: Training Systems 17% Failure to GOA After Destabilized Approach 19%
Flight Ops: SOPs & Checking 12% Pilot-to-Pilot Communication 5%
Environmental Threats Undesired Aircraft States
Meteorology 48%
Long/floated/bounced/firm/off-center / crabbed land 45%
Airport Facilities 23% Vertical / Lateral / Speed Deviation 26% Contaminated runway/taxiway - poor braking action 17%
Abrupt Aircraft Control 12%
Wind/Windshear/Gusty wind 31% Continued Landing after Unstable Approach 17%
Poor Visibility / IMC 15% Unstable Approach 21%
Airline Threats Countermeasures
Aircraft Malfunction 5% Overall Crew Performance 29%
Gear / Tire 3% Monitor / Cross-check 19%
Operational Pressure 3% Contingency Management 11% Contained Engine Failure/ Powerplant Malfunction 1%
Taxiway/Runway Management 5%
Brakes 1% Leadership 6%
Runway Excursion Data Global Runway Safety Symposium
Lima, 20-22 November 2017
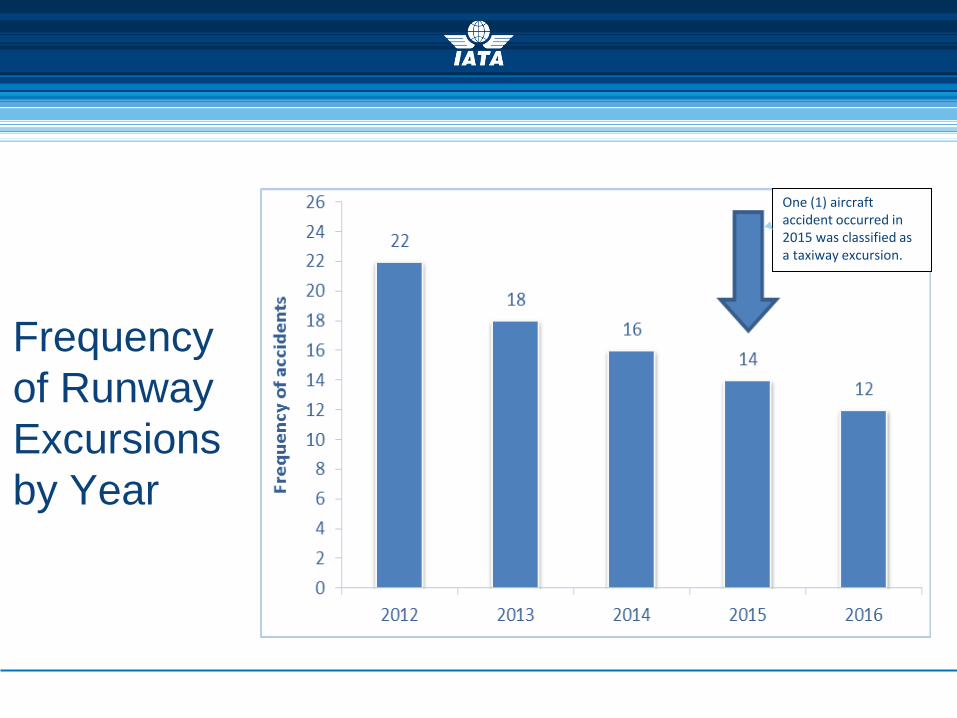
Frequency of Runway Excursions by Year
One (1) aircraft accident occurred in 2015 was classified as a taxiway excursion.
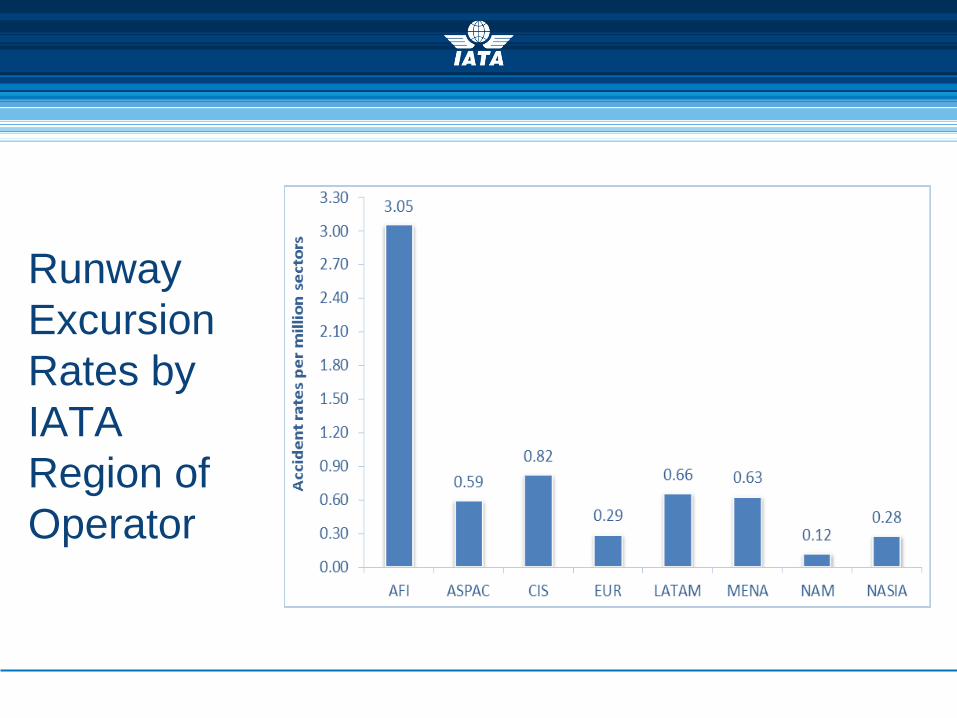
Runway Excursion Rates by IATA Region of Operator

Runway Excursion Accidents by severity
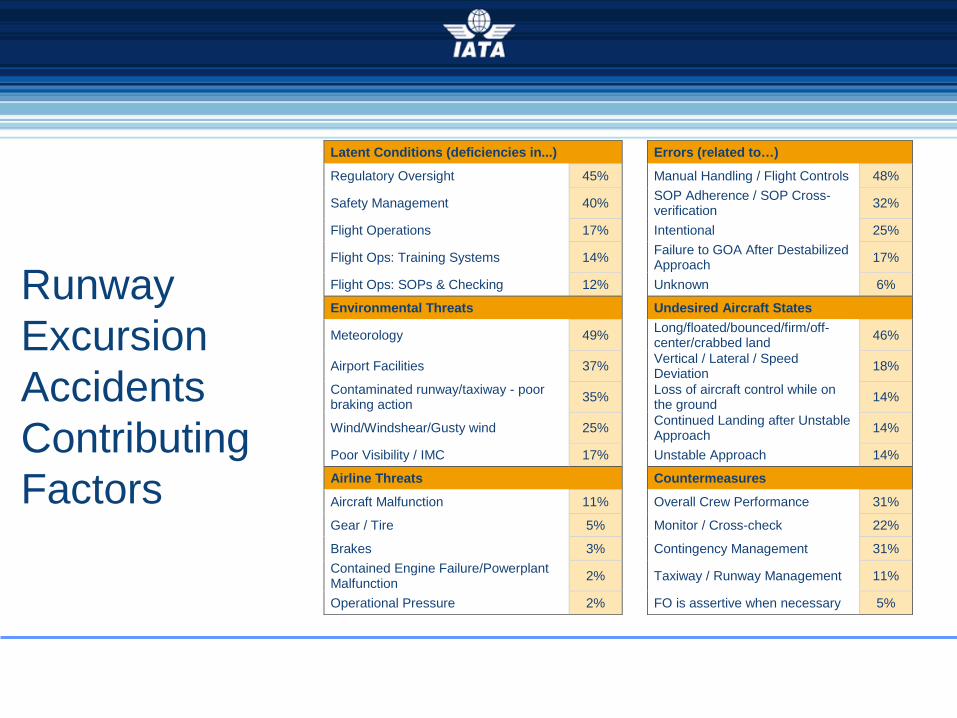
Runway Excursion Accidents Contributing Factors
Latent Conditions (deficiencies in...) Errors (related to…)
Regulatory Oversight 45% Manual Handling / Flight Controls 48%
Safety Management 40% SOP Adherence / SOP Cross-verification 32%
Flight Operations 17% Intentional 25%
Flight Ops: Training Systems 14%
Failure to GOA After Destabilized Approach 17%
Flight Ops: SOPs & Checking 12% Unknown 6%
Environmental Threats Undesired Aircraft States
Meteorology 49%
Long/floated/bounced/firm/off-center/crabbed land 46%
Airport Facilities 37%
Vertical / Lateral / Speed Deviation 18%
Contaminated runway/taxiway - poor braking action 35%
Loss of aircraft control while on the ground 14%
Wind/Windshear/Gusty wind 25%
Continued Landing after Unstable Approach 14%
Poor Visibility / IMC 17% Unstable Approach 14%
Airline Threats Countermeasures
Aircraft Malfunction 11% Overall Crew Performance 31%
Gear / Tire 5% Monitor / Cross-check 22%
Brakes 3% Contingency Management 31% Contained Engine Failure/Powerplant Malfunction 2%
Taxiway / Runway Management 11%
Operational Pressure 2% FO is assertive when necessary 5%

2016 Accidents 2012 Accidents 2014 Accidents 2015 Accidents 2013 Accidents
Runway Excursion Accidents
Runway Excursions
Runway excursions are known to have low fatality risk, but high frequency of occurrence. However, due to their high frequency of occurrence, they continue to receive attention. Further reduction in the occurrence of runway excursions, remains a top priority for IATA and the industry.
Runway Incursion Data
Global Runway Safety Symposium Lima, 20-22 November 2017

Runway incursion: 5 Years Rate
Total STEADES Database-RWY Incursion
(Q1 2012-Q4 2016)
Total STEADES Database
(Q1 2012-Q4 2016)
Number of reports 1,971 reports 952,031 reports
Rate* 0.038 reports per 1,000 flights
18 reports per 1,000 flights
Frequency 1 reports per 26,507 flights
1 reports per day 1 reports per 55 flights
522 reports per day
*Sectors are based on IATA SRS (Schedule Reference Service) Database. STEADES flights represent 36 percent of global SRS flights. The above rate represents the lower measure of the true number of such events that are occurring, due to the different reporting cultures of members, as such the true number of events occurring could be higher.
Copyright ©2017 International Air Transport Association. All rights reserved. Subject to restrictions and disclaimer on page 2. STEADES Analysis – Runway Incursion
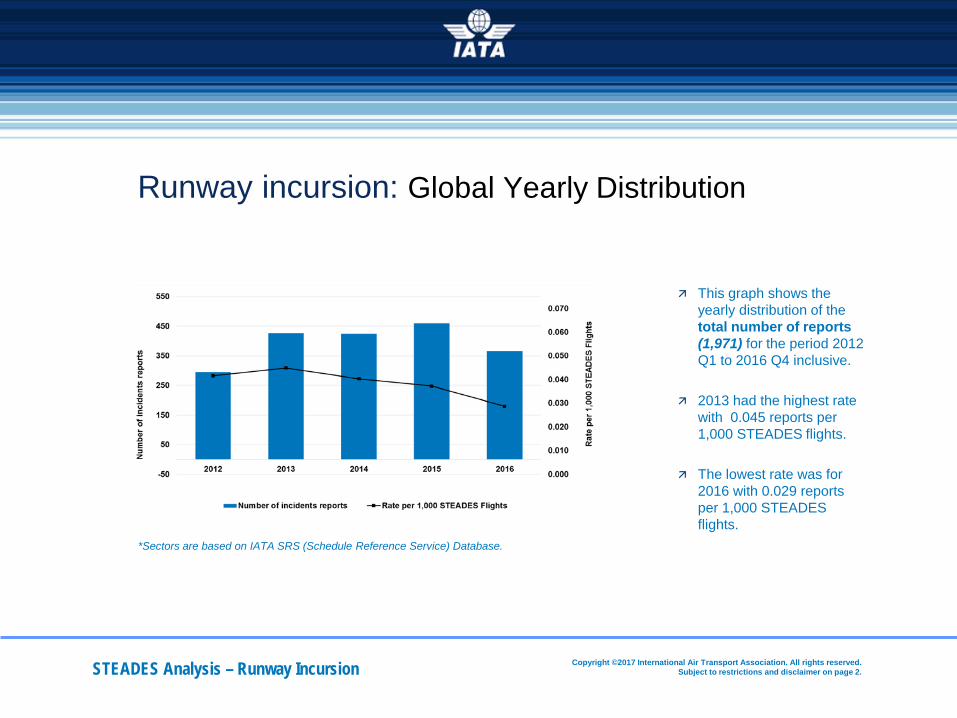
Runway incursion: Global Yearly Distribution
This graph shows the yearly distribution of the total number of reports (1,971) for the period 2012 Q1 to 2016 Q4 inclusive.
2013 had the highest rate with 0.045 reports per 1,000 STEADES flights.
The lowest rate was for
2016 with 0.029 reports per 1,000 STEADES flights.
STEADES Analysis – Runway Incursion Copyright ©2017 International Air Transport Association. All rights reserved. Subject to restrictions and disclaimer on page 2.
*Sectors are based on IATA SRS (Schedule Reference Service) Database.

Wildlife Strike Data Global Runway Safety Symposium
Lima, 20-22 November 2017

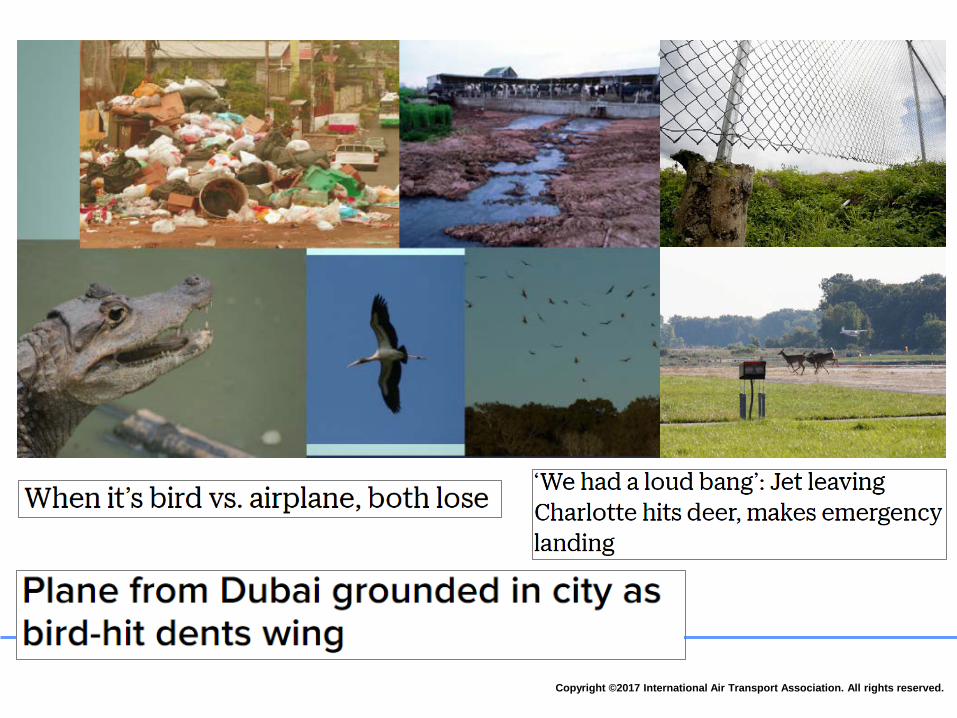
Hull Loss accident with Fatalities In September 2012, A Dornier Do-228, from Kathmandu to Nepal with 16 passengers and
3 crew, was on initial climb out of Kathmandu's when the crew reported a bird strike and engine failure.
The crew attempted to return but the plane crashed outside of the airport perimeter All occupants perished and the aircraft was destroyed. The bird was identified as a black
eagle.
Copyright ©2017 International Air Transport Association. All rights reserved.

Wildlife strike overview: 6 years rate
Copyright ©2017 International Air Transport Association. All rights reserved.
Total STEADES Database
(2011-2016)
IATA Accident Database Wildlife Strikes
(2011-2016)
IATA Accident Database All Accidents (2011-2016)
Number of incidents / Accidents
73,955 Incidents 17 Accidents* 471 accidents
Rate (based on JOS
flights)
1,091 incident per 1,000,000 flights
0.077 accident per 1,000,000
flights
2.15 accident per 1,000,000
Flights
Frequency 1 incident per 917
flights 34 incidents per day
1 accident per 13,014,175 flights
1 accident every 129 days
1 accident per 464,270 flights
1 accident every 5 days
• Two accidents classified as hull loss (one with fatalities), 15 classified as Substantial damage. • 12 Accidents were caused by bird strike, 5 by animal strikes.
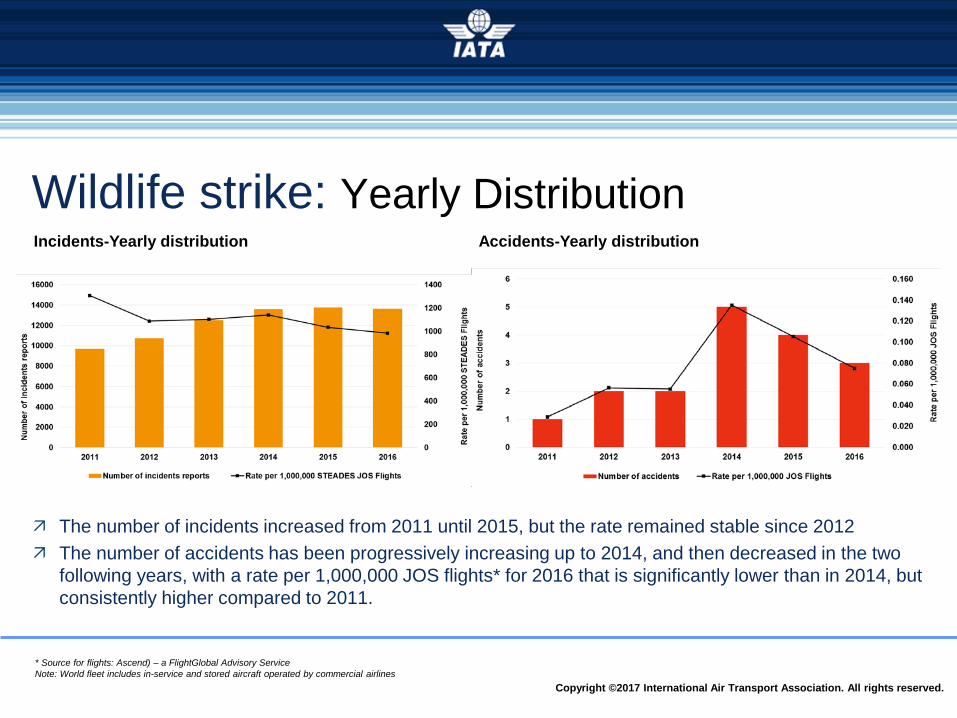
Wildlife strike: Yearly Distribution
Copyright ©2017 International Air Transport Association. All rights reserved.
The number of incidents increased from 2011 until 2015, but the rate remained stable since 2012 The number of accidents has been progressively increasing up to 2014, and then decreased in the two
following years, with a rate per 1,000,000 JOS flights* for 2016 that is significantly lower than in 2014, but consistently higher compared to 2011.
Accidents-Yearly distribution Incidents-Yearly distribution
* Source for flights: Ascend) – a FlightGlobal Advisory Service Note: World fleet includes in-service and stored aircraft operated by commercial airlines

Copyright ©2017 International Air Transport Association. All rights reserved.
Wildlife strike: Map Distribution Region of occurrence distribution
Incidents Accidents
Copyright ©2017 International Air Transport Association. All rights reserved.

Summary Wildlife strikes present a real threat to
aviation safety and represent 3.6 percent all aviation accidents.
With the right stakeholders in place an effective wildlife management plan can be effective.
It takes a real commitment from all the stakeholders especially those outside of the airport like local government to ensure all the hazards can be mitigated effectively.
