running head: importance of olap 1 - home | ijmrnd · this oltp system provides facility ......
TRANSCRIPT
Running Head: Importance Of OLAP 1
Importance of OLAP in Business Intelligence
Debashis Rout
The Institute of Technology Blanchardstown
Abstract The key element to success is the effective
decision making through accurate
information. The data is neither good nor
useful if it does not provide accurate
information. However, intelligent
information is always required for analyzing
data properly. Business intelligence is all
about decisions made effectively with
accurate information in timely manner. This
thesis will provide a brief on how OLAP has
importance in Business intelligence.
Keywords: Business Intelligence (BI), Data
Warehousing (DW), Extract-Transform-
Load (ETL), On-Line Analytical Processing
(OLAP), On-Line Transactional Processing
(OLTP)
Introduction
Data will not be good if we cannot get
intelligent information from the same. Hence
for proper analysis of data, intelligence is
required. Due to the innovation of technology
a new concept developed, named multi-
dimensional data. This data replaced
relational data through a conceptualizing
process which brings the flavor of online
analytical processing (OLAP). This OLAP
tool helps BI system to look data in a
different way rather than just summarizing
and aggregating data. In this competitive
world, day by day volume of transaction is
increasing in every organization. Earlier SQL
queries helped to generate various reports or
normal BI tool could help. But now in today’s
business world, when millions of records are
stored on daily basis into multiple databases
which has made the process time much
crucial factor.
Any organization will be benefited
from appropriate, accurate, and latest
information while making key decisions.
However, there arise many business
questions, for example:
How many new credit card customers
joined in our bank during last month?
What is the daily deposit in specific
region?
How many accounts closed during 2nd
quarter?
How many high risk customers closed
their account during last month?
How many personal Loan customers paid
their last instalment during last month?
What are the top five branches in term of
deposits, no. of account, safe box,
Personal loan and credit card earning?
For these simple questions, it is too
difficult to execute multiple complex queries
to get the results within few minutes. Hence,
a BI system, having powerful techniques for
processing, analyzing, and reporting on
organization data, is required. It is achievable
through historical data instead of real time
data.
In the recent years, the Business
Intelligence systems help people from
different segments for making more positive
business decisions to analyze information
that is accumulated through company’s huge
transaction data from day-to-day operations
(Gorbach, Berger and Melomed, 2009).
Today most of business organizations use an
online transaction processing (OLTP)
system. This OLTP system provides facility
to execute a large number of small
transactions and reliable access to data stored
in the result of the transactions. The volume
of the data stored and processed for a single
day by an OLTP system might be of several
gigabytes. This volume may increase, over
the time, up to the total volume of hundreds
of terabytes. It would be difficult to store
IMPORTANCE OF OLAP 2
such large data but this challenge cannot be
ignored as apart from being complex, the data
is valuable for organization at the same time.
This data can be very helpful to take any
successful strategic decisions, as well as
helpful to improve regular decision making.
Due to large volume, OLTP systems
are not suitable for analyzing such data. A
new concept which can provide more reliable
and speedy access for analyzing a very large
volume of data is called as online analytical
processing (OLAP). OLAP helps senior
management, executives, and data analysts
while providing deeper study of data using
fast, interactive, and consistent interfaces.
For example, with OLAP solution, we can
request information about company laptop
sales in India over a period of years, then drill
down to the sales in January, calculate year-
to-date sales or compare sales figures with
those for the same products sold in March,
and then see a comparison of laptop sales in
India in the same time period.
Online Analytical Processing
(OLAP) databases help interactive analysis
through a large volume of data as a part of
business-intelligence queries. OLAP is a
database technology that has been optimized
for querying and reporting, instead of
processing transactions (Support.office.com,
2016). The below diagram provide the
relation between OLTP and OLAP.
On-line Transaction Processing (OLTP)
OLTP (On-line Transaction
Processing) deals with operational data,
which is data involved in the operation of a
particular system and it is characterized by a
large number of short on-line transactions
like creation of new account, customer
information update, PIN assignment, ATM
transactions etc. The main emphasis of OLTP
systems is faster processing, maintaining data
integration in multi-access environments and
an effectiveness measured by number of
transactions per second. Also, in an OLTP
system; the data is frequently updated and
queried, to prevent data redundancy and
prevent update anomalies; the database tables
are normalized, which makes the writing of
operation in the database tables more
efficient.
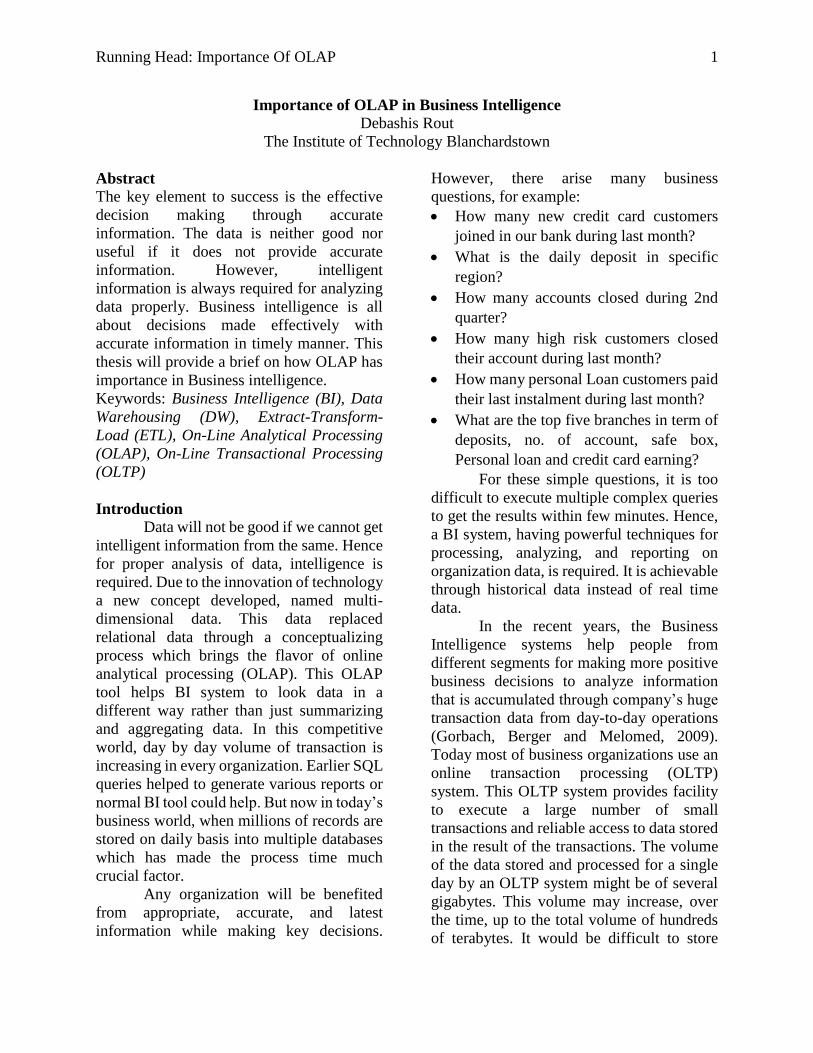
Example: In a banking system,
customer withdraw amount through an ATM,
online money transfer, online household bill
payment, Time deposit purchase etc. Then
account Number, ATM PIN Number,
Amount withdrawn/deposited by customer
are few example of operational data
attributes.
Figure 1-1: Online Transaction data –
OLTP
It is true, the data generated and
stored in OLTP systems is not easier to access
by end users. It doesn’t imply that OLTP
system has any errors but it indicates that the
OLTP systems are not for analysis purpose at
end user’s level. For making this possible, the
transaction data needs to be moved out of the
data warehouse and OLAP system should be
used for analysis (Kenan, 2015). Data in the
OLTP model is relational, and it is
normalized according to database
IMPORTANCE OF OLAP 3
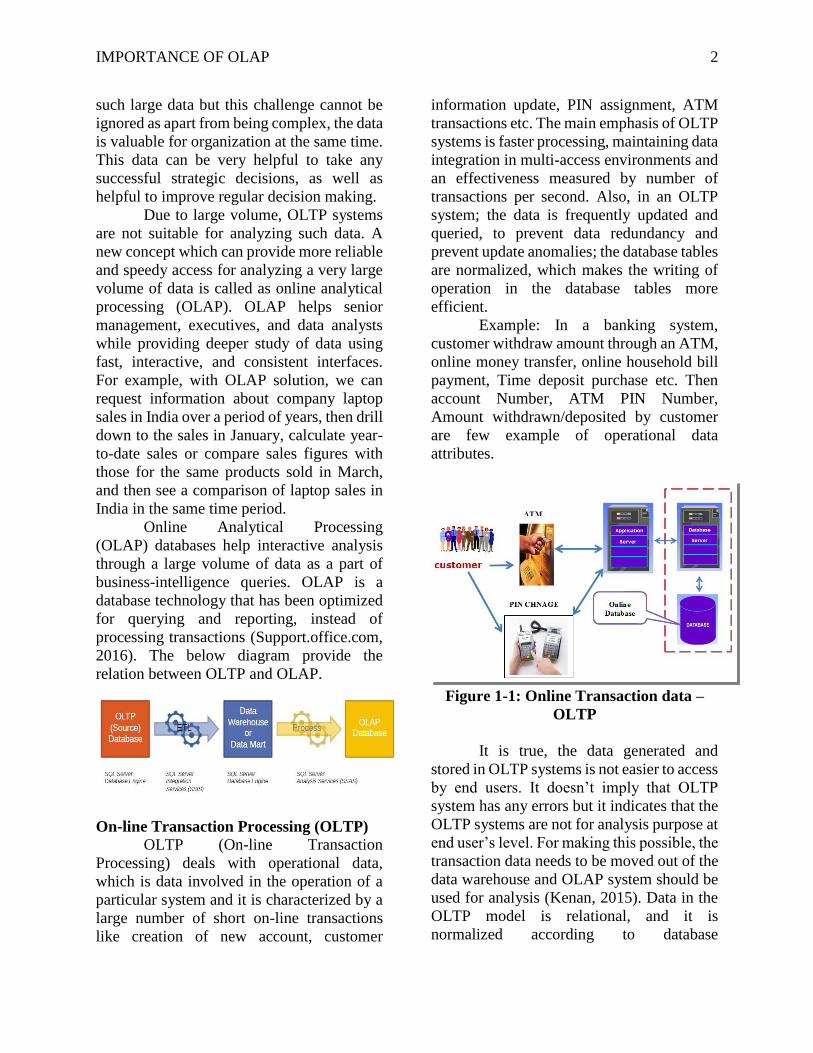
standards—such as the 3NF or 4NF. An
important factor in the OLTP model is that
data doesn't repeat in any fashion and hence
it is arranged into more than one table. In this
way, transactions involve fewer tables and
columns, thus increasing performance. There
are fewer indexes and more joins in this
model, and the tables will hold the key
information.
Figure 1-2 shows a basic OLTP system
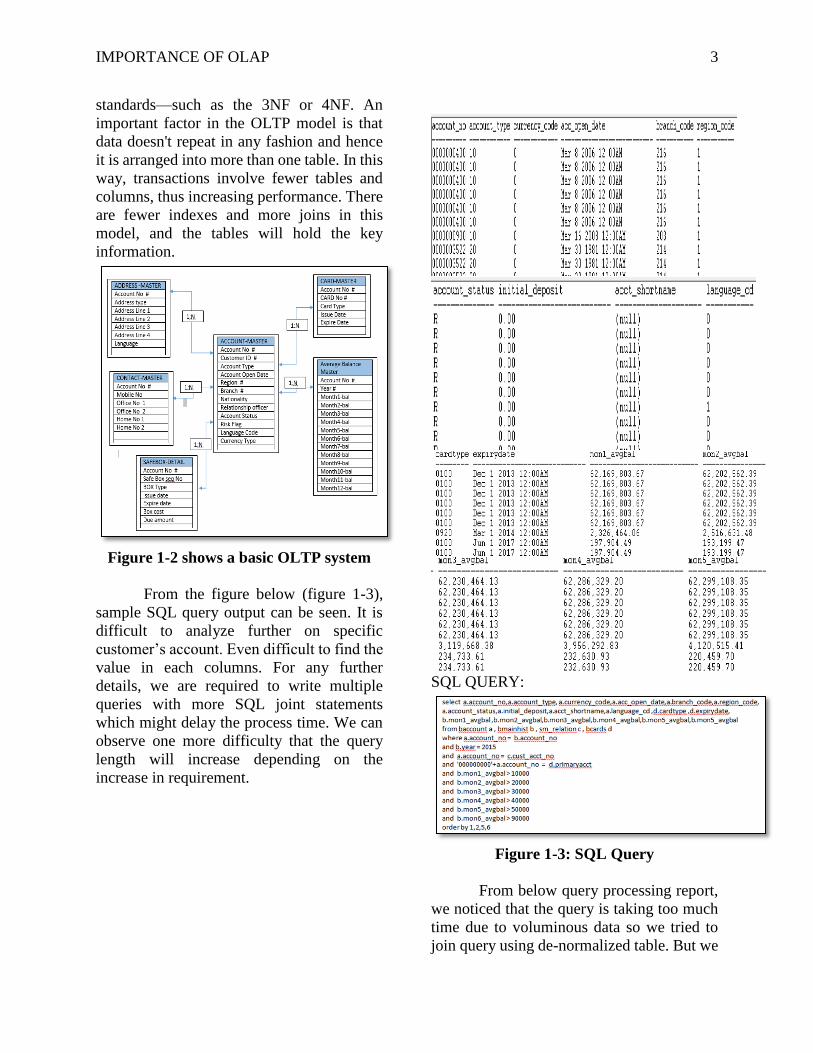
From the figure below (figure 1-3),
sample SQL query output can be seen. It is
difficult to analyze further on specific
customer’s account. Even difficult to find the
value in each columns. For any further
details, we are required to write multiple
queries with more SQL joint statements
which might delay the process time. We can
observe one more difficulty that the query
length will increase depending on the
increase in requirement.
SQL QUERY:
Figure 1-3: SQL Query
From below query processing report,
we noticed that the query is taking too much
time due to voluminous data so we tried to
join query using de-normalized table. But we
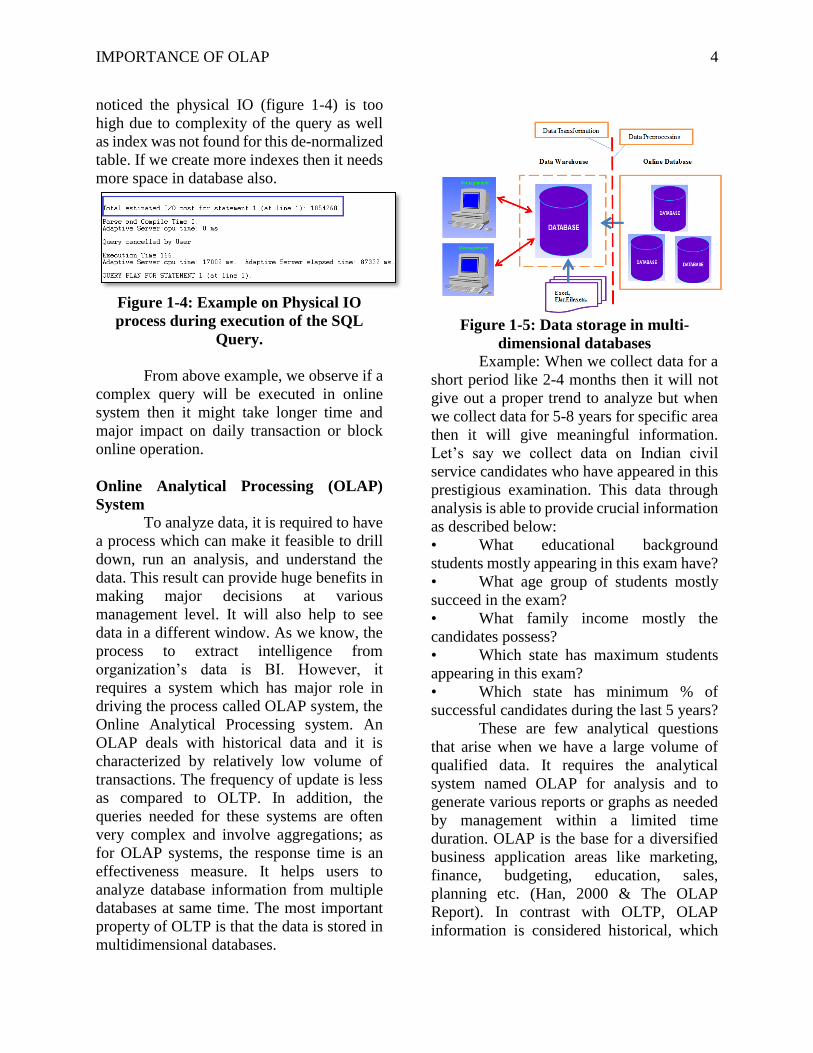
IMPORTANCE OF OLAP 4
noticed the physical IO (figure 1-4) is too
high due to complexity of the query as well
as index was not found for this de-normalized
table. If we create more indexes then it needs
more space in database also.
Figure 1-4: Example on Physical IO
process during execution of the SQL
Query.
From above example, we observe if a
complex query will be executed in online
system then it might take longer time and
major impact on daily transaction or block
online operation.
Online Analytical Processing (OLAP)
System
To analyze data, it is required to have
a process which can make it feasible to drill
down, run an analysis, and understand the
data. This result can provide huge benefits in
making major decisions at various
management level. It will also help to see
data in a different window. As we know, the
process to extract intelligence from
organization’s data is BI. However, it
requires a system which has major role in
driving the process called OLAP system, the
Online Analytical Processing system. An
OLAP deals with historical data and it is
characterized by relatively low volume of
transactions. The frequency of update is less
as compared to OLTP. In addition, the
queries needed for these systems are often
very complex and involve aggregations; as
for OLAP systems, the response time is an
effectiveness measure. It helps users to
analyze database information from multiple
databases at same time. The most important
property of OLTP is that the data is stored in
multidimensional databases.
Figure 1-5: Data storage in multi-
dimensional databases
Example: When we collect data for a
short period like 2-4 months then it will not
give out a proper trend to analyze but when
we collect data for 5-8 years for specific area
then it will give meaningful information.
Let’s say we collect data on Indian civil
service candidates who have appeared in this
prestigious examination. This data through
analysis is able to provide crucial information
as described below:
• What educational background
students mostly appearing in this exam have?
• What age group of students mostly
succeed in the exam?
• What family income mostly the
candidates possess?
• Which state has maximum students
appearing in this exam?
• Which state has minimum % of
successful candidates during the last 5 years?
These are few analytical questions
that arise when we have a large volume of
qualified data. It requires the analytical
system named OLAP for analysis and to
generate various reports or graphs as needed
by management within a limited time
duration. OLAP is the base for a diversified
business application areas like marketing,
finance, budgeting, education, sales,
planning etc. (Han, 2000 & The OLAP
Report). In contrast with OLTP, OLAP
information is considered historical, which
IMPORTANCE OF OLAP 5
means that though there may be batch
additions to the data, it is not considered up-
to-the-second data. Data is completely
isolated and is meant for performing various
tasks, such as drilldown and the like.
Information is stored in fewer tables and so
queries perform much faster since they
involve fewer joins (Han and Kamber, 2000).
OLAP Architecture
It describes the basic model, where
the OLAP server works as an interface
between the data warehouse and the reporting
tool. OLAP is a software technology which
helps managers to gain insight into data
through fast, accurate, interactive access to a
wide variety of possible views of information
that has been transferred from raw data to
reflect dimensionality of the organization as
accepted by the user (Gupta, 2012).
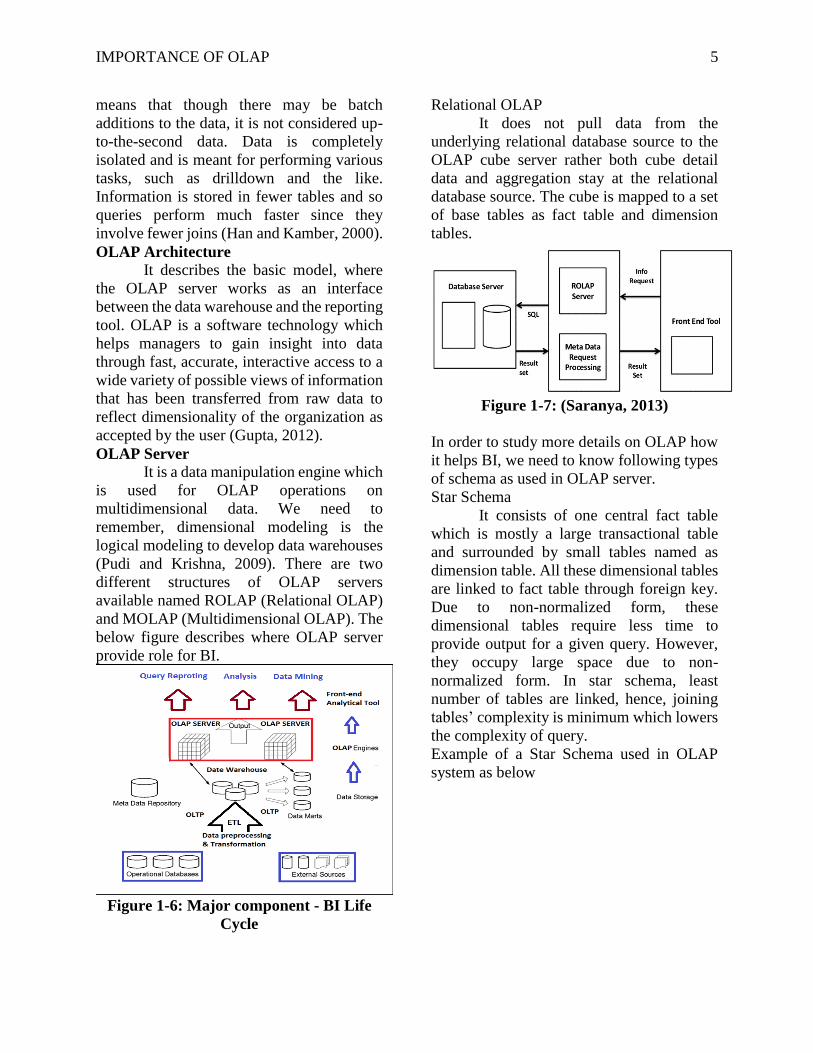
OLAP Server
It is a data manipulation engine which
is used for OLAP operations on
multidimensional data. We need to
remember, dimensional modeling is the
logical modeling to develop data warehouses
(Pudi and Krishna, 2009). There are two
different structures of OLAP servers
available named ROLAP (Relational OLAP)
and MOLAP (Multidimensional OLAP). The
below figure describes where OLAP server
provide role for BI.
Figure 1-6: Major component - BI Life
Cycle
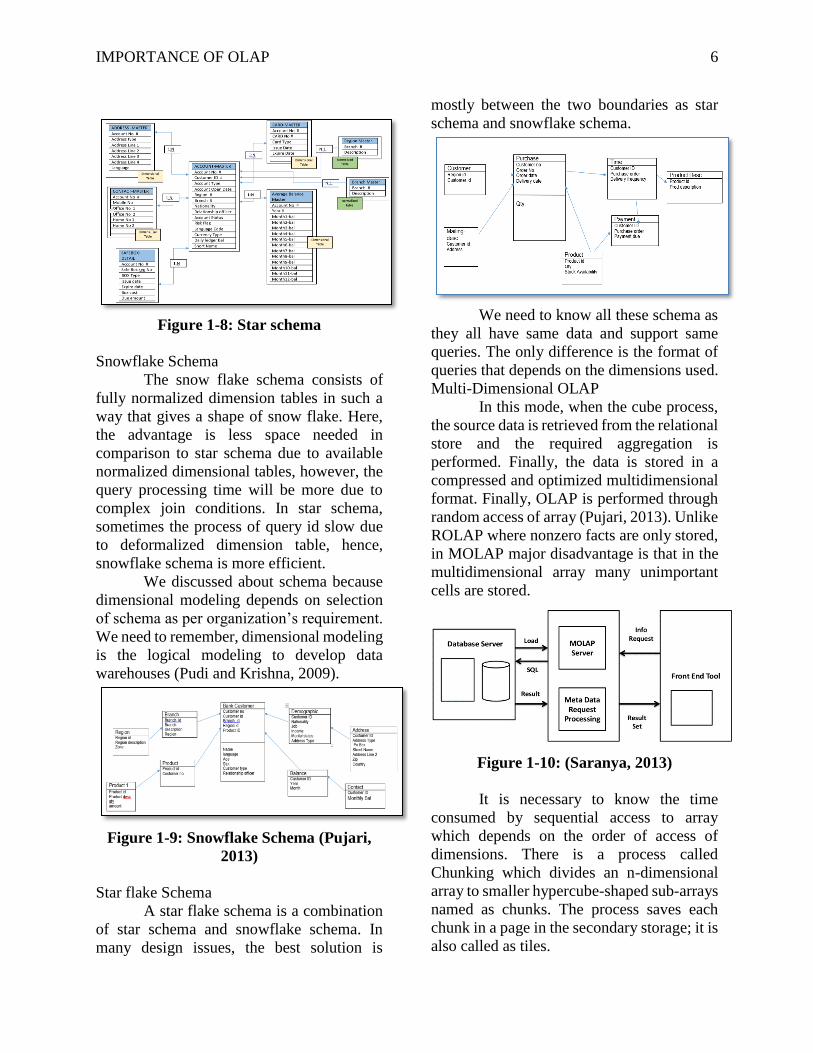
Relational OLAP
It does not pull data from the
underlying relational database source to the
OLAP cube server rather both cube detail
data and aggregation stay at the relational
database source. The cube is mapped to a set
of base tables as fact table and dimension
tables.
Figure 1-7: (Saranya, 2013)
In order to study more details on OLAP how
it helps BI, we need to know following types
of schema as used in OLAP server.
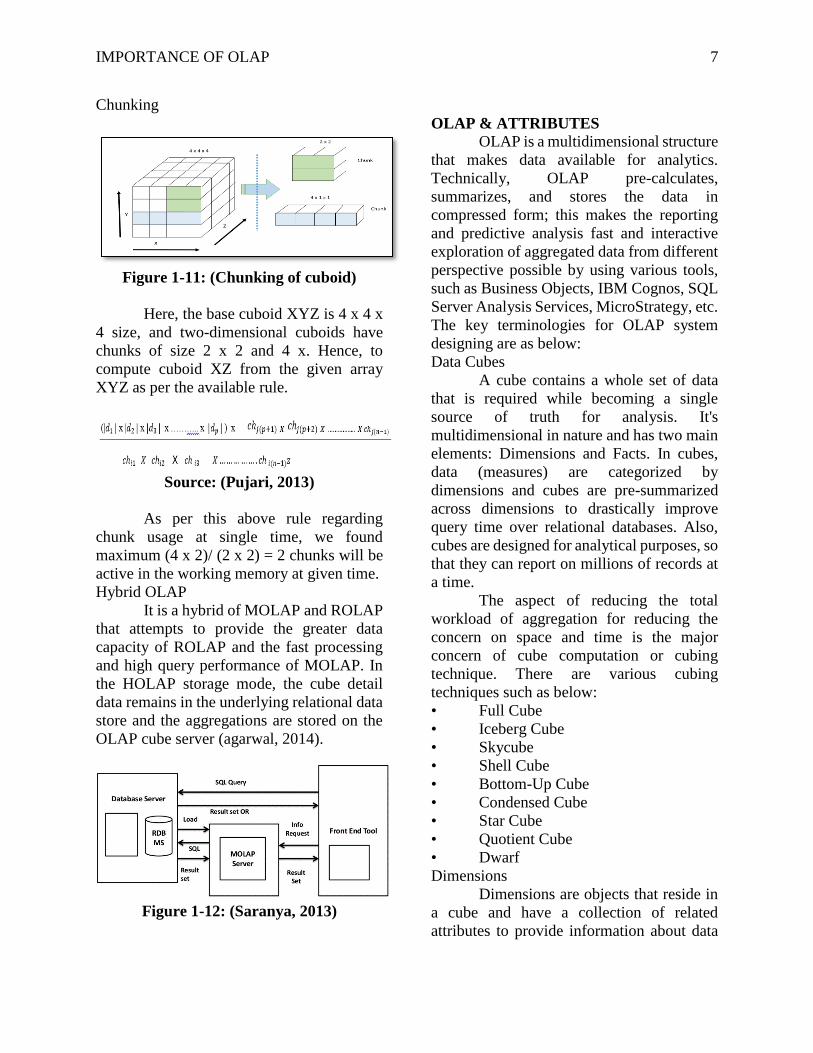
Star Schema
It consists of one central fact table
which is mostly a large transactional table
and surrounded by small tables named as
dimension table. All these dimensional tables
are linked to fact table through foreign key.
Due to non-normalized form, these
dimensional tables require less time to
provide output for a given query. However,
they occupy large space due to non-
normalized form. In star schema, least
number of tables are linked, hence, joining
tables’ complexity is minimum which lowers
the complexity of query.
Example of a Star Schema used in OLAP
system as below
IMPORTANCE OF OLAP 6
Figure 1-8: Star schema
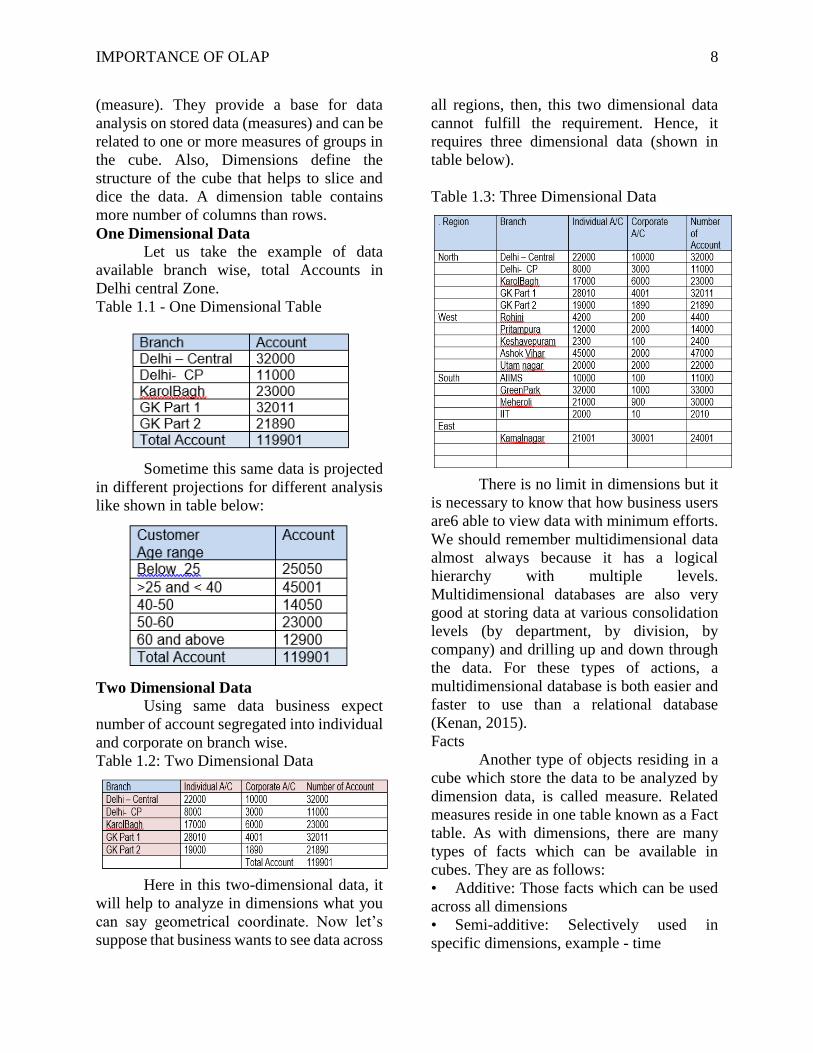
Snowflake Schema
The snow flake schema consists of
fully normalized dimension tables in such a
way that gives a shape of snow flake. Here,
the advantage is less space needed in
comparison to star schema due to available
normalized dimensional tables, however, the
query processing time will be more due to
complex join conditions. In star schema,
sometimes the process of query id slow due
to deformalized dimension table, hence,
snowflake schema is more efficient.
We discussed about schema because
dimensional modeling depends on selection
of schema as per organization’s requirement.
We need to remember, dimensional modeling
is the logical modeling to develop data
warehouses (Pudi and Krishna, 2009).
Figure 1-9: Snowflake Schema (Pujari,
2013)
Star flake Schema
A star flake schema is a combination
of star schema and snowflake schema. In
many design issues, the best solution is
mostly between the two boundaries as star
schema and snowflake schema.
We need to know all these schema as
they all have same data and support same
queries. The only difference is the format of
queries that depends on the dimensions used.
Multi-Dimensional OLAP
In this mode, when the cube process,
the source data is retrieved from the relational
store and the required aggregation is
performed. Finally, the data is stored in a
compressed and optimized multidimensional
format. Finally, OLAP is performed through
random access of array (Pujari, 2013). Unlike
ROLAP where nonzero facts are only stored,
in MOLAP major disadvantage is that in the
multidimensional array many unimportant
cells are stored.
Figure 1-10: (Saranya, 2013)
It is necessary to know the time
consumed by sequential access to array
which depends on the order of access of
dimensions. There is a process called
Chunking which divides an n-dimensional
array to smaller hypercube-shaped sub-arrays
named as chunks. The process saves each
chunk in a page in the secondary storage; it is
also called as tiles.
IMPORTANCE OF OLAP 7
Chunking
Figure 1-11: (Chunking of cuboid)
Here, the base cuboid XYZ is 4 x 4 x
4 size, and two-dimensional cuboids have
chunks of size 2 x 2 and 4 x. Hence, to
compute cuboid XZ from the given array
XYZ as per the available rule.
Source: (Pujari, 2013)
As per this above rule regarding
chunk usage at single time, we found
maximum (4 x 2)/ (2 x 2) = 2 chunks will be
active in the working memory at given time.
Hybrid OLAP
It is a hybrid of MOLAP and ROLAP
that attempts to provide the greater data
capacity of ROLAP and the fast processing
and high query performance of MOLAP. In
the HOLAP storage mode, the cube detail
data remains in the underlying relational data
store and the aggregations are stored on the
OLAP cube server (agarwal, 2014).
Figure 1-12: (Saranya, 2013)
OLAP & ATTRIBUTES
OLAP is a multidimensional structure
that makes data available for analytics.
Technically, OLAP pre-calculates,
summarizes, and stores the data in
compressed form; this makes the reporting
and predictive analysis fast and interactive
exploration of aggregated data from different
perspective possible by using various tools,
such as Business Objects, IBM Cognos, SQL
Server Analysis Services, MicroStrategy, etc.
The key terminologies for OLAP system
designing are as below:
Data Cubes
A cube contains a whole set of data
that is required while becoming a single
source of truth for analysis. It's
multidimensional in nature and has two main
elements: Dimensions and Facts. In cubes,
data (measures) are categorized by
dimensions and cubes are pre-summarized
across dimensions to drastically improve
query time over relational databases. Also,
cubes are designed for analytical purposes, so
that they can report on millions of records at
a time.
The aspect of reducing the total
workload of aggregation for reducing the
concern on space and time is the major
concern of cube computation or cubing
technique. There are various cubing
techniques such as below:
• Full Cube
• Iceberg Cube
• Skycube
• Shell Cube
• Bottom-Up Cube
• Condensed Cube
• Star Cube
• Quotient Cube
• Dwarf
Dimensions
Dimensions are objects that reside in
a cube and have a collection of related
attributes to provide information about data
IMPORTANCE OF OLAP 8
(measure). They provide a base for data
analysis on stored data (measures) and can be
related to one or more measures of groups in
the cube. Also, Dimensions define the
structure of the cube that helps to slice and
dice the data. A dimension table contains
more number of columns than rows.
One Dimensional Data
Let us take the example of data
available branch wise, total Accounts in
Delhi central Zone.
Table 1.1 - One Dimensional Table
Sometime this same data is projected
in different projections for different analysis
like shown in table below:
Two Dimensional Data
Using same data business expect
number of account segregated into individual
and corporate on branch wise.
Table 1.2: Two Dimensional Data
Here in this two-dimensional data, it
will help to analyze in dimensions what you
can say geometrical coordinate. Now let’s
suppose that business wants to see data across
all regions, then, this two dimensional data
cannot fulfill the requirement. Hence, it
requires three dimensional data (shown in
table below).
Table 1.3: Three Dimensional Data
There is no limit in dimensions but it
is necessary to know that how business users
are6 able to view data with minimum efforts.
We should remember multidimensional data
almost always because it has a logical
hierarchy with multiple levels.
Multidimensional databases are also very
good at storing data at various consolidation
levels (by department, by division, by
company) and drilling up and down through
the data. For these types of actions, a
multidimensional database is both easier and
faster to use than a relational database
(Kenan, 2015).
Facts
Another type of objects residing in a
cube which store the data to be analyzed by
dimension data, is called measure. Related
measures reside in one table known as a Fact
table. As with dimensions, there are many
types of facts which can be available in
cubes. They are as follows:
• Additive: Those facts which can be used
across all dimensions
• Semi-additive: Selectively used in
specific dimensions, example - time
IMPORTANCE OF OLAP 9
• Non-additive: The fact which cannot be
used in any dimension, example Unit price of
a product
Cube Storage
An OLAP system has three storage
approaches; we need to choose any one of the
storage strategies based on the data
availability and the need for successful
implementation of a BI system.
OLAP Operations
Let us discuss about OLAP
operations in multidimensional data. The
Multidimensional data model catered by fact
or dimension structure is suitable for
interactive analysis of large volume of data
for decision making. The list of OLAP
operations includes:
• Roll-up
• Drill-down
• Slice and dice
• Pivot (rotate)
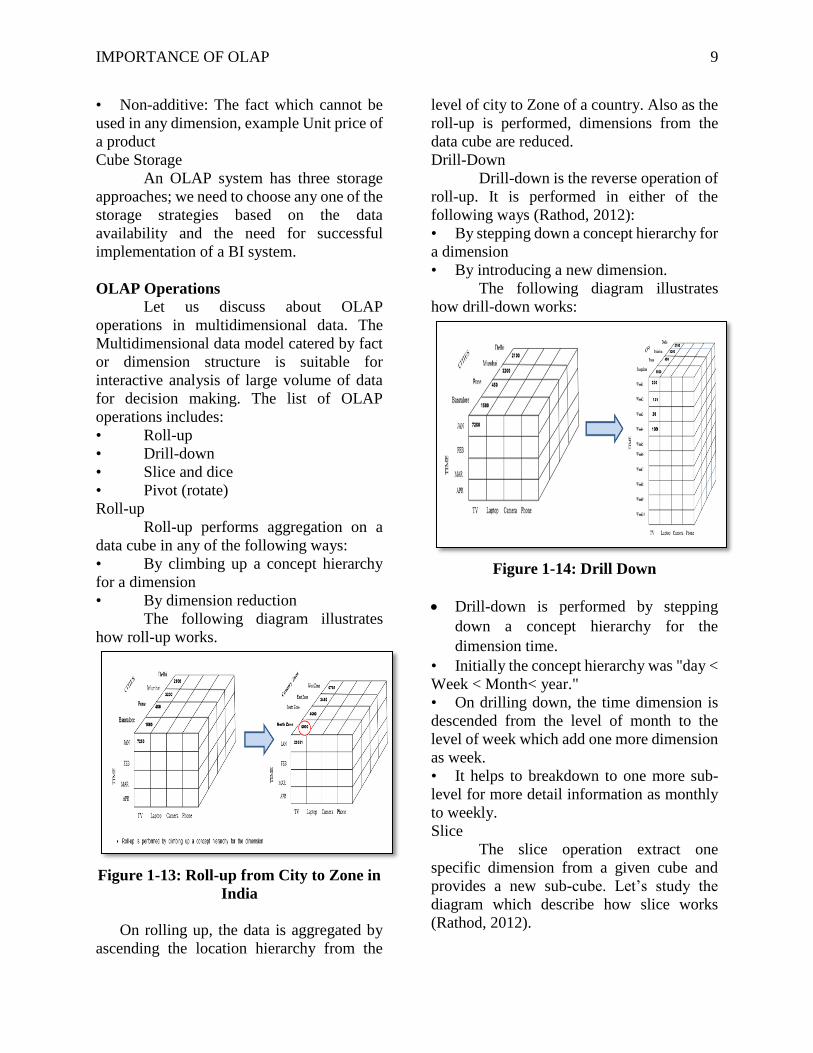
Roll-up
Roll-up performs aggregation on a
data cube in any of the following ways:
• By climbing up a concept hierarchy
for a dimension
• By dimension reduction
The following diagram illustrates
how roll-up works.
Figure 1-13: Roll-up from City to Zone in
India
On rolling up, the data is aggregated by
ascending the location hierarchy from the
level of city to Zone of a country. Also as the
roll-up is performed, dimensions from the
data cube are reduced.
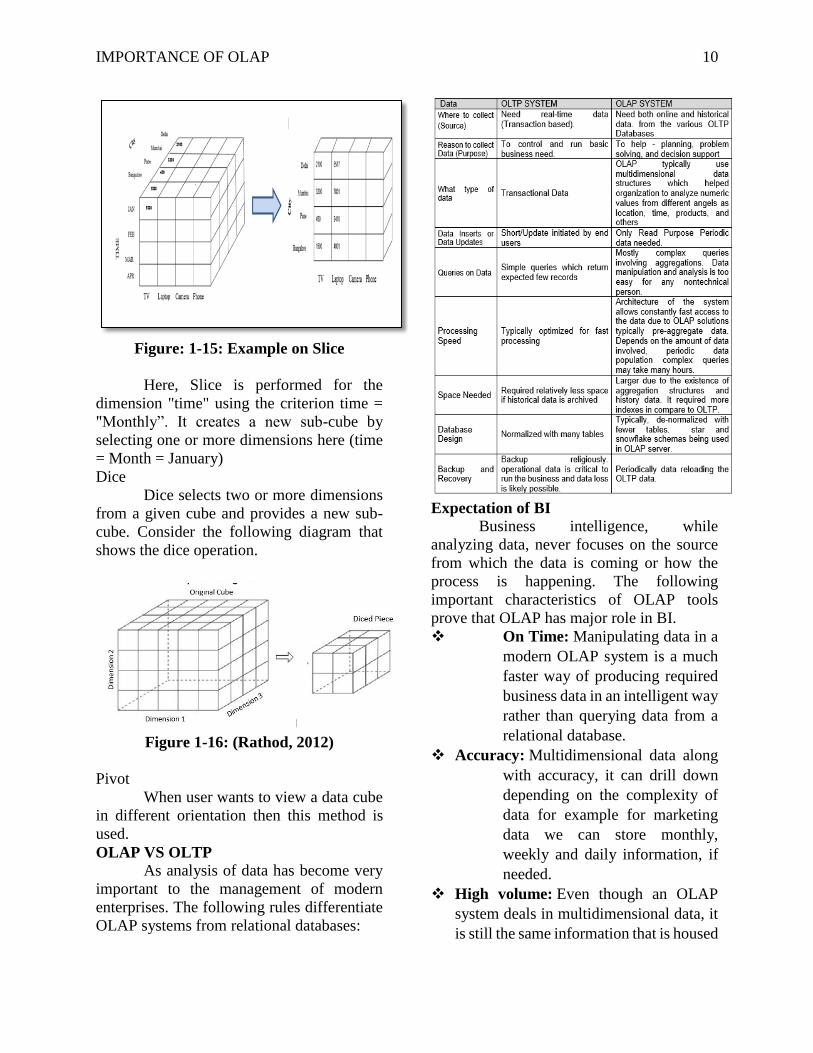
Drill-Down
Drill-down is the reverse operation of
roll-up. It is performed in either of the
following ways (Rathod, 2012):
• By stepping down a concept hierarchy for
a dimension
• By introducing a new dimension.
The following diagram illustrates
how drill-down works:
Figure 1-14: Drill Down
Drill-down is performed by stepping
down a concept hierarchy for the
dimension time.
• Initially the concept hierarchy was "day <
Week < Month< year."
• On drilling down, the time dimension is
descended from the level of month to the
level of week which add one more dimension
as week.
• It helps to breakdown to one more sub-
level for more detail information as monthly
to weekly.
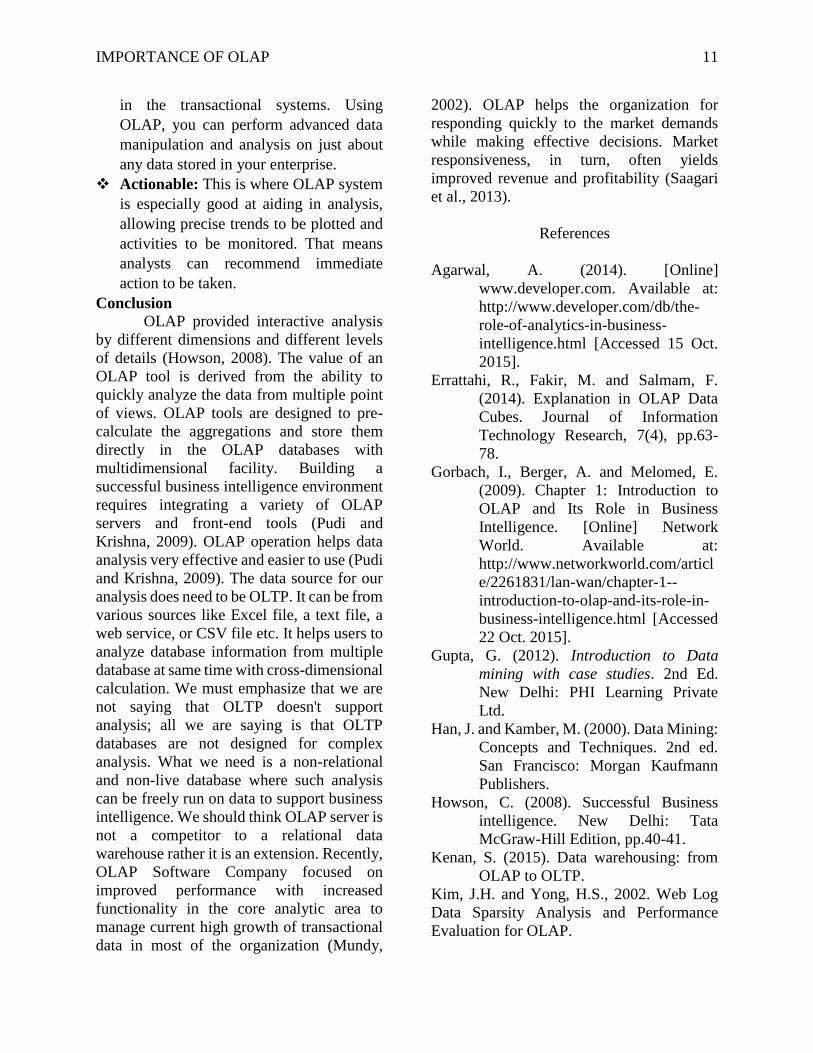
Slice
The slice operation extract one
specific dimension from a given cube and
provides a new sub-cube. Let’s study the
diagram which describe how slice works
(Rathod, 2012).
IMPORTANCE OF OLAP 10
Figure: 1-15: Example on Slice
Here, Slice is performed for the
dimension "time" using the criterion time =
"Monthly”. It creates a new sub-cube by
selecting one or more dimensions here (time
= Month = January)
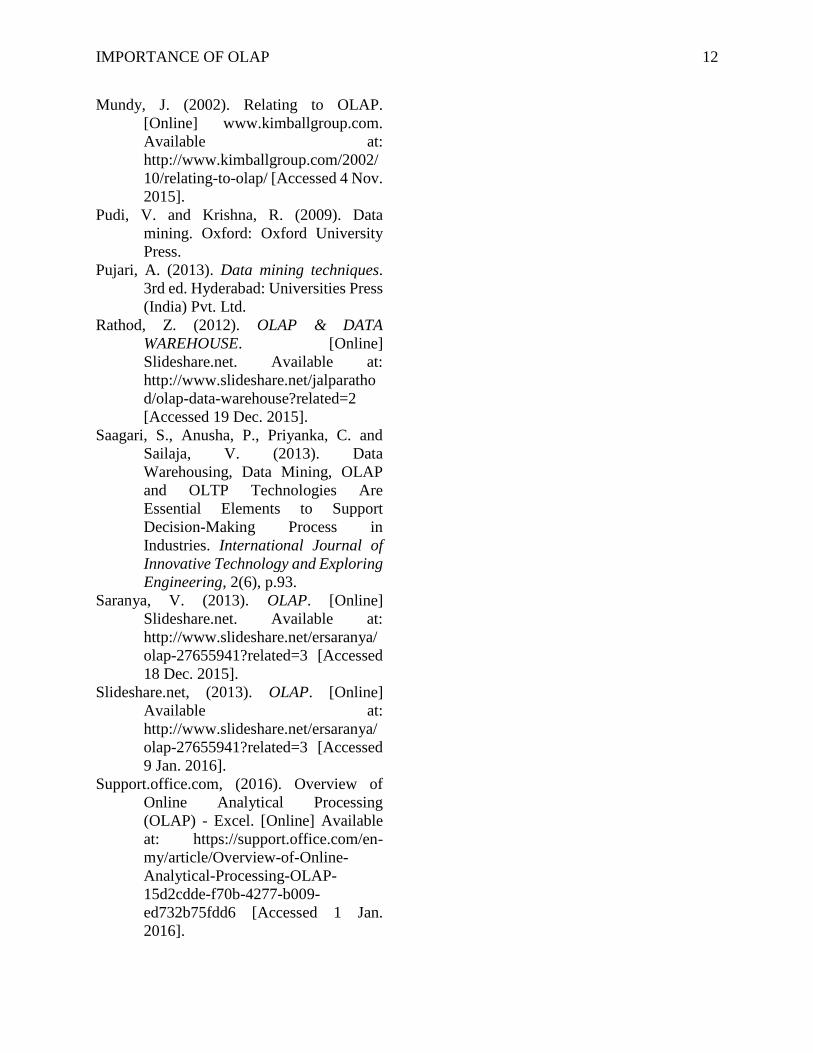
Dice
Dice selects two or more dimensions
from a given cube and provides a new sub-
cube. Consider the following diagram that
shows the dice operation.
Figure 1-16: (Rathod, 2012)
Pivot
When user wants to view a data cube
in different orientation then this method is
used.
OLAP VS OLTP
As analysis of data has become very
important to the management of modern
enterprises. The following rules differentiate
OLAP systems from relational databases:
Expectation of BI
Business intelligence, while
analyzing data, never focuses on the source
from which the data is coming or how the
process is happening. The following
important characteristics of OLAP tools
prove that OLAP has major role in BI.
On Time: Manipulating data in a
modern OLAP system is a much
faster way of producing required
business data in an intelligent way
rather than querying data from a
relational database.
Accuracy: Multidimensional data along
with accuracy, it can drill down
depending on the complexity of
data for example for marketing
data we can store monthly,
weekly and daily information, if
needed.
High volume: Even though an OLAP
system deals in multidimensional data, it
is still the same information that is housed
IMPORTANCE OF OLAP 11
in the transactional systems. Using
OLAP, you can perform advanced data
manipulation and analysis on just about
any data stored in your enterprise.
Actionable: This is where OLAP system
is especially good at aiding in analysis,
allowing precise trends to be plotted and
activities to be monitored. That means
analysts can recommend immediate
action to be taken.
Conclusion
OLAP provided interactive analysis
by different dimensions and different levels
of details (Howson, 2008). The value of an
OLAP tool is derived from the ability to
quickly analyze the data from multiple point
of views. OLAP tools are designed to pre-
calculate the aggregations and store them
directly in the OLAP databases with
multidimensional facility. Building a
successful business intelligence environment
requires integrating a variety of OLAP
servers and front-end tools (Pudi and
Krishna, 2009). OLAP operation helps data
analysis very effective and easier to use (Pudi
and Krishna, 2009). The data source for our
analysis does need to be OLTP. It can be from
various sources like Excel file, a text file, a
web service, or CSV file etc. It helps users to
analyze database information from multiple
database at same time with cross-dimensional
calculation. We must emphasize that we are
not saying that OLTP doesn't support
analysis; all we are saying is that OLTP
databases are not designed for complex
analysis. What we need is a non-relational
and non-live database where such analysis
can be freely run on data to support business
intelligence. We should think OLAP server is
not a competitor to a relational data
warehouse rather it is an extension. Recently,
OLAP Software Company focused on
improved performance with increased
functionality in the core analytic area to
manage current high growth of transactional
data in most of the organization (Mundy,
2002). OLAP helps the organization for
responding quickly to the market demands
while making effective decisions. Market
responsiveness, in turn, often yields
improved revenue and profitability (Saagari
et al., 2013).
References
Agarwal, A. (2014). [Online]
www.developer.com. Available at:
http://www.developer.com/db/the-
role-of-analytics-in-business-
intelligence.html [Accessed 15 Oct.
2015].
Errattahi, R., Fakir, M. and Salmam, F.
(2014). Explanation in OLAP Data
Cubes. Journal of Information
Technology Research, 7(4), pp.63-
78.
Gorbach, I., Berger, A. and Melomed, E.
(2009). Chapter 1: Introduction to
OLAP and Its Role in Business
Intelligence. [Online] Network
World. Available at:
http://www.networkworld.com/articl
e/2261831/lan-wan/chapter-1--
introduction-to-olap-and-its-role-in-
business-intelligence.html [Accessed
22 Oct. 2015].
Gupta, G. (2012). Introduction to Data
mining with case studies. 2nd Ed.
New Delhi: PHI Learning Private
Ltd.
Han, J. and Kamber, M. (2000). Data Mining:
Concepts and Techniques. 2nd ed.
San Francisco: Morgan Kaufmann
Publishers.
Howson, C. (2008). Successful Business
intelligence. New Delhi: Tata
McGraw-Hill Edition, pp.40-41.
Kenan, S. (2015). Data warehousing: from
OLAP to OLTP.
Kim, J.H. and Yong, H.S., 2002. Web Log
Data Sparsity Analysis and Performance
Evaluation for OLAP.
IMPORTANCE OF OLAP 12
Mundy, J. (2002). Relating to OLAP.
[Online] www.kimballgroup.com.
Available at:
http://www.kimballgroup.com/2002/
10/relating-to-olap/ [Accessed 4 Nov.
2015].
Pudi, V. and Krishna, R. (2009). Data
mining. Oxford: Oxford University
Press.
Pujari, A. (2013). Data mining techniques.
3rd ed. Hyderabad: Universities Press
(India) Pvt. Ltd.
Rathod, Z. (2012). OLAP & DATA
WAREHOUSE. [Online]
Slideshare.net. Available at:
http://www.slideshare.net/jalparatho
d/olap-data-warehouse?related=2
[Accessed 19 Dec. 2015].
Saagari, S., Anusha, P., Priyanka, C. and
Sailaja, V. (2013). Data
Warehousing, Data Mining, OLAP
and OLTP Technologies Are
Essential Elements to Support
Decision-Making Process in
Industries. International Journal of
Innovative Technology and Exploring
Engineering, 2(6), p.93.
Saranya, V. (2013). OLAP. [Online]
Slideshare.net. Available at:
http://www.slideshare.net/ersaranya/
olap-27655941?related=3 [Accessed
18 Dec. 2015].
Slideshare.net, (2013). OLAP. [Online]
Available at:
http://www.slideshare.net/ersaranya/
olap-27655941?related=3 [Accessed
9 Jan. 2016].
Support.office.com, (2016). Overview of
Online Analytical Processing
(OLAP) - Excel. [Online] Available
at: https://support.office.com/en-
my/article/Overview-of-Online-
Analytical-Processing-OLAP-
15d2cdde-f70b-4277-b009-
ed732b75fdd6 [Accessed 1 Jan.
2016].