rune busch · ii c rune busch 2012 disasters by design: a disaggregated study of the ethnic and...
TRANSCRIPT

Disasters by Design: A Disaggregated Study of the Ethnic and
Institutional Determinants of Natural Disaster Vulnerability
Rune Busch
Master’s Thesis
Department of Political Science
Faculty of Social Sciences
University of Oslo
May 2012

ii

Disasters by Design: A Disaggregated Study of the Ethnic and
Institutional Determinants of Natural Disaster Vulnerability
Rune Busch
May 15, 2012

ii
c©Rune Busch
2012
Disasters by Design: A Disaggregated Study of the Ethnic and Institutional Determinants of
Natural Disaster Vulnerability
Rune Busch
http://www.duo.uio.no
Printed by: Reprosentralen, Universitetet i Oslo

Abstract
Natural hazards are epistemically random events that can cause massive losses on human lives.
However, how natural disasters affect human lives is a matter of human resilience. Do institu-
tions provide mechanisms for people’s vulnerability in natural disasters, and are some institu-
tions more impairing than others? The growing literature on politically motivated disaster relief
has found that measures to ensure against and prepare for disastrous events to a large extent
are used as ‘porks’ to buy constituent support. However, there is as yet no global large-n study
that sufficiently captures how this affects politically excluded groups. This thesis develops a
novel approach, and examines these matters by studying all rapid onset natural disasters in the
world from 1980-2008. The contributions of this project are twofold. I disaggregate institu-
tions and study how specific institutional subcomponents affect natural disaster vulnerability.
Secondly, by using geography information systems (GIS) this thesis is able to make local level
inferences about which political groups that are more vulnerable, and under which conditions
natural disasters are more deadly. The empirical evidence of this project reveals core features
of the political dimension behind disaster vulnerability, which has not been empirically evident
until now. Estimates suggest that areas that are populated by politically excluded groups on
average experience twice as many casualties as areas that are not populated by excluded groups.
This finding yields support to a core rational choice argument: political representation in cen-
tral government affects the allocation of goods, and incumbents allocate goods favoring those
constituents that ensure them in power. I also find evidence that presidential institutions on av-
erage experience 50 casualties more than parliamentary institutions. This finding lends support
to the literature arguing that allocation of global goods in presidential regimes are characterized
by local distribution, short-term policy, and large transaction costs, which all hampers global
goods provisions.
iii

iv

Acknowledgements
Having completed the most enduring academic project ever experienced, the author is left with
a certain self-satisfaction. Albeit this project in times of hardship has felt solely my own,
many people have contributed to its making, and they deserve my unreserved appreciation.
First, I would like to thank my supervisor Halvard Buhaug for his continuous availability, and
always constructive efforts to pull me in the right direction. A special thanks goes to profes-
sor Havard Hegre who I have enjoyed working closely with throughout the master’s program.
Together with Carl Henrik Knutsen he gave me the opportunity to write this thesis in con-
junction with the project Conceptualization and Measurement of Democracy (RCN project
204454/V10, see http://www.sv.uio.no/isv/english/research/projects/conceptualization- and-
measurement/index.html). For that I am grateful. I would also like to thank my good friends
and family: My mother, father, and brothers for their always unrestrained support; Lars Petter
Berg for always being funny; Tarald Laudal Berge for his carefulness; Victor Lund Shammas for
reading my final draft; Stein Omar Gjendem for his lovely seriousness; Anders Ravik Jupskas
for his attentiveness; Sofie Hove Stene for her vigorousness in correcting my spelling mistakes;
Tore Wig for seeding the reseach idea; my technical support team, Jonas Nordkvelle, Espen
Geelmuyden Rød, and Bjørn Hoyland; and finally the Department of Political Science for being
a place of intellectual stimulus.
I alone am responsible for the content of this thesis.
Rune Busch
Wordcount: 35,775
v

vi

Contents
1 Introduction 1
1.1 Puzzle I . . . . . . . . . . . . . . . . . . . . . . . . . . . . . . . . . . . . . . . . . 2
1.2 Puzzle II . . . . . . . . . . . . . . . . . . . . . . . . . . . . . . . . . . . . . . . . . 2
1.3 Puzzle III . . . . . . . . . . . . . . . . . . . . . . . . . . . . . . . . . . . . . . . . 3
1.4 Research questions . . . . . . . . . . . . . . . . . . . . . . . . . . . . . . . . . . . 4
1.5 Defining concepts . . . . . . . . . . . . . . . . . . . . . . . . . . . . . . . . . . . . 4
1.5.1 Natural disasters . . . . . . . . . . . . . . . . . . . . . . . . . . . . . . . . 4
1.5.2 Political exclusion . . . . . . . . . . . . . . . . . . . . . . . . . . . . . . . 5
1.5.3 Institutional mechanisms . . . . . . . . . . . . . . . . . . . . . . . . . . . 6
1.6 Structure . . . . . . . . . . . . . . . . . . . . . . . . . . . . . . . . . . . . . . . . 7
1.7 Findings . . . . . . . . . . . . . . . . . . . . . . . . . . . . . . . . . . . . . . . . . 7
2 Literature review 9
2.1 Institutions and natural disasters . . . . . . . . . . . . . . . . . . . . . . . . . . . 9
2.2 Institutions and goods provisions . . . . . . . . . . . . . . . . . . . . . . . . . . . 12
2.2.1 The role of the executive . . . . . . . . . . . . . . . . . . . . . . . . . . . 12
2.2.2 Elections . . . . . . . . . . . . . . . . . . . . . . . . . . . . . . . . . . . . 13
2.2.3 Centralization . . . . . . . . . . . . . . . . . . . . . . . . . . . . . . . . . . 13
2.3 Political exclusion and natural disasters . . . . . . . . . . . . . . . . . . . . . . . 13
3 Theorizing natural disaster resilience 17
3.1 Incentives for disaster spending . . . . . . . . . . . . . . . . . . . . . . . . . . . . 18
3.2 Propositions . . . . . . . . . . . . . . . . . . . . . . . . . . . . . . . . . . . . . . . 19
3.2.1 Institutional mechanisms . . . . . . . . . . . . . . . . . . . . . . . . . . . 19
3.2.2 Political exclusion . . . . . . . . . . . . . . . . . . . . . . . . . . . . . . . 24
3.3 Interplay between institutions and exclusion . . . . . . . . . . . . . . . . . . . . . 25
4 Research design 27
4.1 Why a statistical analysis? . . . . . . . . . . . . . . . . . . . . . . . . . . . . . . . 27
4.2 Why disaggregate? . . . . . . . . . . . . . . . . . . . . . . . . . . . . . . . . . . . 28
4.2.1 PRIO-GRID . . . . . . . . . . . . . . . . . . . . . . . . . . . . . . . . . . 29
4.2.2 GIS procedure . . . . . . . . . . . . . . . . . . . . . . . . . . . . . . . . . 30
vii

viii CONTENTS
4.3 Data issues and selection bias . . . . . . . . . . . . . . . . . . . . . . . . . . . . . 30
4.4 From concept to indicator - making inferences . . . . . . . . . . . . . . . . . . . . 34
4.4.1 Baseline model . . . . . . . . . . . . . . . . . . . . . . . . . . . . . . . . . 34
4.5 Dataset and unit of analysis . . . . . . . . . . . . . . . . . . . . . . . . . . . . . . 34
4.6 Dependent variable . . . . . . . . . . . . . . . . . . . . . . . . . . . . . . . . . . . 35
4.7 Independent variables . . . . . . . . . . . . . . . . . . . . . . . . . . . . . . . . . 36
4.7.1 Political exclusion . . . . . . . . . . . . . . . . . . . . . . . . . . . . . . . 36
4.7.2 Institutional variables . . . . . . . . . . . . . . . . . . . . . . . . . . . . . 38
4.7.3 Operationalizing control variables . . . . . . . . . . . . . . . . . . . . . . . 40
4.7.4 Regression models . . . . . . . . . . . . . . . . . . . . . . . . . . . . . . . 43
4.8 Statistical model . . . . . . . . . . . . . . . . . . . . . . . . . . . . . . . . . . . . 43
4.8.1 The negative binomial regression model . . . . . . . . . . . . . . . . . . . 43
4.8.2 Model specifications . . . . . . . . . . . . . . . . . . . . . . . . . . . . . . 45
4.9 Missing data . . . . . . . . . . . . . . . . . . . . . . . . . . . . . . . . . . . . . . 46
4.9.1 Summary . . . . . . . . . . . . . . . . . . . . . . . . . . . . . . . . . . . . 47
4.10 Summary statistics . . . . . . . . . . . . . . . . . . . . . . . . . . . . . . . . . . . 47
4.11 Multicollinearity . . . . . . . . . . . . . . . . . . . . . . . . . . . . . . . . . . . . 48
5 Analysis 51
5.1 Country level analysis . . . . . . . . . . . . . . . . . . . . . . . . . . . . . . . . . 51
5.1.1 Regressions . . . . . . . . . . . . . . . . . . . . . . . . . . . . . . . . . . . 53
5.1.2 Institutions and exclusion . . . . . . . . . . . . . . . . . . . . . . . . . . . 56
5.1.3 Democratic institutions . . . . . . . . . . . . . . . . . . . . . . . . . . . . 59
5.1.4 Summary country level analysis . . . . . . . . . . . . . . . . . . . . . . . . 61
5.2 Disaggregated analysis . . . . . . . . . . . . . . . . . . . . . . . . . . . . . . . . . 61
5.3 Summary . . . . . . . . . . . . . . . . . . . . . . . . . . . . . . . . . . . . . . . . 65
6 Robustness and model fit 67
6.1 Disaggregated analysis . . . . . . . . . . . . . . . . . . . . . . . . . . . . . . . . . 67
6.2 Country level analysis . . . . . . . . . . . . . . . . . . . . . . . . . . . . . . . . . 69
6.3 Democracy . . . . . . . . . . . . . . . . . . . . . . . . . . . . . . . . . . . . . . . 69
6.4 Multilevel model . . . . . . . . . . . . . . . . . . . . . . . . . . . . . . . . . . . . 70
7 Conclusion 71
7.1 Hypotheses . . . . . . . . . . . . . . . . . . . . . . . . . . . . . . . . . . . . . . . 71
7.1.1 Summary . . . . . . . . . . . . . . . . . . . . . . . . . . . . . . . . . . . . 73
7.2 Policy implications and further research . . . . . . . . . . . . . . . . . . . . . . . 74
A Diagnostics and additional results. 77
B Relevant Stata codes and data 87

List of Figures
4.1 International borders and country assignment. The figure illustrates the border
between Thailand, Cambodia, and Laos (dashed line), with grayscale coloring in-
dicating the country to which each cell is assigned. The numbers in the cells refer
to the Gleditsch and Ward (1999) numeric code for the corresponding country
(800 is Thailand; 811 is Cambodia; 812 is Laos). Figure is taken from Tollefsen,
Strand and Buhaug (2012b, 368). . . . . . . . . . . . . . . . . . . . . . . . . . . . 29
4.2 The figure illustrates how a high-resolution raster (top) is represented in PRIO-
GRID (below). The string codes denote different land cover classes (Hansen
et al., 2000; 0.08◦ × 0.08◦ resolution); CR cropland, CS closed shrubland, DB
deciduous broadleaf forest, EB evergreen broadleaf forest, GR grassland, WO
woodland, WT water(Tollefsen, Strand and Buhaug, 2012b, 366). . . . . . . . . 30
4.3 Number and Magnitude of Disasters, 1970-2010. The figure is based on Figure 1
in Stromberg (2007, 202), but with my own data. . . . . . . . . . . . . . . . . . . 31
4.4 Distribution of the number killed, country level analysis. . . . . . . . . . . . . . . 44
4.5 Observed vs. predicted counts (PRM), poisson model and negative binomial
model (NBRM). Note: positive deviations shows underprediction. . . . . . . . . . 45
5.1 Democracy and disasters . . . . . . . . . . . . . . . . . . . . . . . . . . . . . . . . 55
5.2 Simulated marginal effect of presidentialism on various levels of democracy, with
political exclusion at its median value. Confidence intervals in grey shadings. . . 58
5.3 Simulated average difference in casualties for parliamentary and presidential in-
stitutions by region. Confidence intervals in grey shadings. . . . . . . . . . . . . . 60
5.4 Simulated average casualties in cells with and without exclusion. . . . . . . . . . 64
5.5 Simulated marginal effect of political exclusion for presidential systems over var-
ious levels of democracy. . . . . . . . . . . . . . . . . . . . . . . . . . . . . . . . . 65
6.1 Predicted number events from model 2 in table 5.9. . . . . . . . . . . . . . . . . . 68
6.2 Predicted number casualties from model 2. . . . . . . . . . . . . . . . . . . . . . 69
ix

x LIST OF FIGURES
List of Tables
4.1 Natural disasters events and casualties by disaster type, country level analysis. . 32
4.2 Natural disasters events and casualties by disaster type, grid-cell analysis. . . . 32
4.3 Regional number of disasters and casualties, country level analysis. . . . . . . . 33
4.4 Regional number of disasters and casualties, grid-cell analysis. . . . . . . . . . . 33
4.5 Sample of natural disaster events . . . . . . . . . . . . . . . . . . . . . . . . . . . 36
4.6 Summary statistics, country level analysis. . . . . . . . . . . . . . . . . . . . . . 47
4.7 Summery statistics, disaggregated analysis. . . . . . . . . . . . . . . . . . . . . . 48
4.8 Cross-correlation table of the hypothesized variables, and the interaction terms.
Disaggregated analysis. . . . . . . . . . . . . . . . . . . . . . . . . . . . . . . . . 49
5.1 Casualties by regime type . . . . . . . . . . . . . . . . . . . . . . . . . . . . . . . 51
5.2 Casualties by size of excluded groups . . . . . . . . . . . . . . . . . . . . . . . . 52
5.3 Casualties by institutional characteristics . . . . . . . . . . . . . . . . . . . . . . 52
5.4 Democracy and disasters, country level analysis . . . . . . . . . . . . . . . . . . . 54
5.5 Institutions, exclusion and natural disasters, country level analysis . . . . . . . . 57
5.6 Democratic institutions, and natural disasters, country level analysis . . . . . . . 59
5.7 Average casualties in grid-cells by institutions. . . . . . . . . . . . . . . . . . . . 62
5.8 Casualties for grid-cells with and without excluded groups. . . . . . . . . . . . . 62
5.9 Institutions, exclusion and natural disasters, disaggregated analysis. . . . . . . . 63
A.1 Possion vs Negative regression model. . . . . . . . . . . . . . . . . . . . . . . . . 78
A.2 Institutions, exclusion and natural disasters, disaggregated analysis. Hybrid in-
stitutions coded as belonging to majoritarian, predidential, and federal. . . . . . 79
A.3 Institutions, exclusion and natural disasters, disaggregated analyses. Including
all observations. . . . . . . . . . . . . . . . . . . . . . . . . . . . . . . . . . . . . . 80
A.4 Cross-correlation table of the hypothesized variables, and the interaction terms.
Country level analysis. High correlations are in bolded text. . . . . . . . . . . . . 81
A.5 Institutions, exclusion and natural disasters, country level analysis. Hybrid in-
stitutions coded as belonging to presidential, majoritarian, and federal. . . . . . . 82
A.6 Institutions and natural disasters, country level analysis. All observations are
included. . . . . . . . . . . . . . . . . . . . . . . . . . . . . . . . . . . . . . . . . . 83
xi

xii LIST OF TABLES
A.7 Exclusion and natural disasters, NBRM and OLS. Dependent variable is the
count of more than zero killed. This is transformed to its natural logarithm in
the OLS model. . . . . . . . . . . . . . . . . . . . . . . . . . . . . . . . . . . . . . 84
A.8 Exclusion and natural disasters, Logit models. Dependent variable in Model 1 is
1 if number killed is more than 0. Dependent variable in model 2 is 1 if number
killed is more than 50. . . . . . . . . . . . . . . . . . . . . . . . . . . . . . . . . . 85
A.9 Political exclusion and presidential institutions, estimated on earthquakes only. . 86

Chapter 1
Introduction
Natural hazards such as floods, earthquakes, tsunamis, and hurricanes, are exogenous and
epistemically random events that can cause massive losses of human lives. However, how natural
hazards affect human lives is a matter of human resilience and vulnerability. While natural
hazards may be beyond our control, natural disasters are not. How governments prepare for,
and respond to such low-probability high-consequence events, is a question of great importance
to political scientists. As anthropogenic climate change is expected to increase the frequency
of natural disasters worldwide (IPCC, 2012, 18-21), this issue should increase its hold on the
agendas of both the policy and research community.
My research motivation starts off with two important findings in the political science/po-
litical economy literature. To begin with, well functioning and democratic institutions are
associated with substantially lower death tolls from natural catastrophes (e.g. Sen, 1983; Besley
and Burgess, 2002; Kahn, 2005; Raschky, 2008; Flores and Smith, 2010; Plumper and Neu-
mayer, 2009). However, these studies commonly use highly aggregated measures of democracy,
which makes it hard to study the effects of specific institutional drivers of natural disaster re-
silience. By focusing on institutional subcomponents, this study attempts to identify some of
the underlying mechanisms linking institutions and natural disaster vulnerability.
Secondly, important contributions have been made that identify the political motivations
behind disaster management. A consistent finding is that incumbents often use disaster relief as
pork-barrel projects in electorally important areas (Garrett and Sobel, 2003; Albala-Bertrand,
1993; Healy and Malhotra, 2009). However, there is as yet no global large-n study that system-
atically examines how disaster relief is used as means to buy constituent support, and deprive
excluded groups from state power. My research project fills a gap in this literature by studying
how political status based on ethnicity affects natural disasters vulnerability.
Finally, a third and yet undiscovered component relating to the aforementioned puzzles, is
the interaction between these distinct processes. How do institutions provide mechanisms for
excluded groups; and are particular forms of government more impairing than others?
If my assumptions are correct; that members of politically excluded groups are more likely
to die in natural disasters; and that specific institutional subcomponents might provide mech-
anisms for increased natural disasters resilience, my research project reveals important aspects
1

2 CHAPTER 1. INTRODUCTION
of the relationship between natural disasters and the toll on human lives. In doing so I conduct
a large-n study covering all rapid onset natural disasters in the period 1980-2008, drawing on
theory related to the interplay between institutions and the provision of public goods. The
novelty of the analysis is twofold. (1) I disaggregate the unit of analysis down to the local level,
and examine disastrous events where they actually took place. This enables me to make local
level inferences about whom, and under which conditions, people are more vulnerable. (2) I
disaggregate institutions, and examine the effects of de jure political institutions on the toll on
human lives. Below, I present the three puzzles in more detail.
1.1 Puzzle I
What seems to be a robust finding in the political science/political economy literature is that
better institutions, that is, wealthy, stable, and democratic regimes with comprehensive political
rights and civil liberties, are significantly related to lower death tolls from natural catastrophes
(Kahn, 2005; Besley and Burgess, 2002; Sen, 1983; Toya and Skidmore, 2007; Raschky, 2008;
Flores and Smith, 2010; Plumper and Neumayer, 2009). But how do institutional arrangements
shape the outcomes of natural disasters? One proposed logic is that well functioning institutions
are more responsive and effective in securing the interests of its citizens through public goods
provisions; thus investing more in disaster related preparedness policies directed towards large
parts of the population.1 Although several studies have concluded that democracy mitigates
the severity of natural disasters, Stromberg (2007) does not find support for this hypothesis.
He argues instead that government effectiveness is the essential driving force behind disas-
ter resilience.2 Hence, this thesis provides a further examination of the relationship between
democratic institutions and natural disaster vulnerability. Secondly, the existing literature is
preoccupied with highly aggregated measures of democracy. This makes it hard to study specific
subcomponents of the institutions-disaster relationship. Gathering inspiration from other fields
of the political science/political economy literature, which examine constitutional features of in-
stitutional performance, I look at how institutional mechanisms might facilitate natural disaster
resilience. In this regard I examine how specific rules of the game, such as electoral rules, form
of government, and the level of centralization, influence natural disaster vulnerability. I form
hypotheses based on the theory related to the constitutional-institutional environment and the
provision of public goods.
1.2 Puzzle II
The second puzzle originates from the literature dealing with political motivations behind dis-
aster policies. In their study of the Federal Emergency Management Agency (FEMA) Garrett
and Sobel (2003) found that electorally important districts receive more disaster relief, and
1See Lake and Baum (2001); Bueno de Mesquita, Smith, Siverson and Morrow (2003) for theory of whydemocracies produce more public goods/services.
2Using a measure of quality of public services, infrastructure, and civil services.

1.3. PUZZLE III 3
they predicted that nearly half of all disaster relief was politically motivated. But what drive
incumbents to exploit disaster relief in return for constituent support? Healy and Malhotra
(2009) made corresponding inquiries, and found that electorates in the United States offer
scant incentives for public preparedness policies by rewarding incumbents for private disaster
relief. Albala-Bertrand (1993, 93) focused on the economic side of protective measures, and
found that economic support tends to be directed to politically aligned areas. In the study of
the 2001 flood in Rawalpindi, Pakistan, Mustafa (2003, 6) described several reports of relief
cheques being distributed to political supporters and family members. These findings illumi-
nate how natural disaster relief can be used as an effective tool to channel constituent support.
There are similar studies that show how racial and ethnic commonality increase natural disaster
vulnerability (e.i. Bates, Folgeman, Parenton, Pittman and Tracy, 1963; Peacock, Morrow and
Gladwin, 1997; de Silva, 2009). However, they focus only on a small number of cases, which
do not yield healthy grounds for generalizations. Cohen and Werker (2008, 805) provide the
only attempt to systematically examine this relationship on a global scale, and find that death
tolls are three times as high in countries with high levels of ethnic fractionalization compared
to more homogeneous countries. Although their empirical model confirms their hypothesis, it
relies on a crude measure of ethnic fractionalization, which does not incorporate the political
dimension of ethnic cleavages. Secondly, they operate with country-level data, which fails to
reveal relevant characteristics of whom that are more vulnerable in natural disasters.
However, the introduction of geographic information systems (GIS), and specifically geo-
referenced data on political status, allows me to examine how disasters affect different political
groups on the sub-national level, and lets me draw inferences about how political exclusion
affects natural disaster vulnerability more accurately. Building on the aforementioned studies
and the existing literature on the relationship between institutions and political exclusion, I
examine how political exclusion affects natural disaster vulnerability.
1.3 Puzzle III
The last puzzle relates to the specific interaction between institutional components and political
exclusion. Are particular institutions more conducive to political exclusion, and are politically
excluded groups more vulnerable in natural disasters in particular institutional environments?
This part of the thesis is explorative in its nature, and builds on related theory from other fields
of political science. Several studies show that particular institutional mechanisms are more
beneficial for universal policies (e.g. Crepaz, 1998; Persson and Tabellini, 2004), and that ethnic
fractionalization shrinks public services (e.g. Alesina, Baqir and Easterly, 1999). However,
the potential relationship between these factors remains unobserved. Building on the notion
that disaster policy is more likely to be directed towards politically important constituents,
and that particular institutional subcomponents are more sensitive to pork-barrels (Stromberg,
2003; Ashworth and Bueno de Mesquita, 2006), I examine the interaction between institutional
mechanisms and the vulnerability of politically excluded groups.

4 CHAPTER 1. INTRODUCTION
1.4 Research questions
Based on these separate, but related puzzles, my research project attempts to systematically
examine the relationship between institutions, political exclusion, and the severity of natural
disasters. I use data from the OFDA/CRED International Disaster Database (EM-DAT, 2012),
and conduct a large-n study covering all rapid onset natural disasters in the period 1980-2008.
By combining local level data on political exclusion and natural disasters (in GIS format), I
make use of a empirically novel approach enabling me to make local level inferences that are
closer to the actual observed event. Hence, I provide the first global study that examines
the effects of institutions and political status at specific disastrous locations. Three research
questions guide my thesis:
1. How does political exclusion affect natural disaster vulnerability?
2. How do institutional mechanisms affect natural disaster vulnerability?
3. How do institutional mechanisms affect the relationship between political exclusion and
natural disaster vulnerability?
As the reader will see, there are two questions that relates to the specific role of a set of
variables, and a third query that relates to the specific interplay between these variables. The
research questions will be formulated into distinct propositions, which will be tested in the
empirical analysis.
1.5 Defining concepts
In the proceeding section I clarify the key concepts examined in this thesis.
1.5.1 Natural disasters
Natural hazards are geophysical shocks that might lead to natural disasters. The hazard itself
cannot cause a natural disaster; it is dependent on affecting a specific socio-economic environ-
ment (Dilley, Chen, Deichmand, Lerner-Lam, Arnold, Buys, Kjekstad, Lyon and Yetman, 2005,
115). This does not mean that hazards cannot affect the magnitude of disasters, it only points
to the specific assumption that natural disasters involve the particular impact of the natural
environment on the human/economic environment (Alexander, 1993, 4). Hazards that occur
in unpopulated areas and therefore do not affect human lives are not disasters. In this regard
natural hazards work as stochastic shocks on the socio-economic environment, and can develop
into a natural disaster, depending on human resilience and vulnerability.3
Natural disaster resilience refers to all human activity that affects the ability to adapt
to and absorb natural hazards (Cannon, 1994, 19). Resilient societies have greater capacity
to absorb and adapt to natural hazards, and therefore suffer less. The corresponding term
vulnerability refers to how sensitive societies or individuals are to natural hazards. The two terms
should not be understood as having different implications; they simply refer to the capacity
3In a natural science perspective, natural hazards are of course not random events, although they can be hardto predict.

1.5. DEFINING CONCEPTS 5
to tackle hazardous events (Pelling, 2003, 5). There is a large literature that nuances these
terms, and discusses how they relate to human capacity to handle natural hazards (see Pelling,
2003; Alexander, 1993; Cannon, 1994; White, 1974; Wisner and Luce, 1993). However, what is
pertinent for this project is the distinction between the physical hazard per se and the ability
to affect the disasters that may follow (see Wisner and Luce, 1993, 127). A second and related
point, is that vulnerability to natural disasters is not simply a function of technological measures
directed at preparing and responding to a disastrous event, but also related to social and
environmental management in general (White, 1974, 13). An illustrative example of how decisive
the socio-economic environment can be is to compare the Loma Prieta earthquake striking San
Francisco in 1989, and the 2010 earthquake in Haiti. With similar strength, the Haiti earthquake
killed more than 220,000, while the San Francisco earthquake killed just over sixty. Obviously,
these massive different outcomes originated from different policies, institutional arrangements,
and socio-economic conditions.
In this project the focus is on the physical impact of natural disasters, and specifically look
at the number of casualties. Other aspects, such as economic and psychological consequences,
are not addressed here.
As mentioned, this study regards natural hazards as exogenous events. By this I mean that
natural hazards strike autonomously, independent of the human environment. As most of social
science research deals with highly endogenous phenomena, it is usually a tricky task to identify
the actual relationship between the variables, as the effects often go both ways. Although
natural disasters explicitly refer to the effect on the human environment – and in this project
the toll on human lives – the hazard is beyond our control and therefore contributes to exogenous
variation. It can of course be argued that even hazards are more or less anthropogenic, as human
impacts on climate change or famines are well documented.4 To minimize the endogeneity effect,
this study relies on data from rapid-onset natural disasters alone, that is; earthquakes, floods,
volcanic eruptions, storms, wildfires, extreme temperatures, and mass movements (dry and wet).
Details on specific measures and operationalizations are elaborated in the methods section.
1.5.2 Political exclusion
The second key concept in this thesis is political exclusion. Political exclusion builds on the
notion that groups experience unequal access to central state power, and the extent to which
groups are represented in central authorities makes them hold unequal political status. If an
ethnic group, say, whites in the United States in the 1950s, would occupy all governmental
positions, they enjoy high political status and have monopoly on state power. The assumption
is that access to central state power yields opportunities for political concessions, and that
excluded groups are less likely to enjoy the benefits as included groups do. Political exclusion
refers in this context to politically relevant ethnic groups and their access to central state power
(Cederman, Wimmer and Min, 2010, 98). Ethnicity is defined as any subjectively experienced
4See Sen (1983) for famines, and Parry, Canziani, Palutikof, van der Linden and Hanson (2007, IPCC) forclimate change.

6 CHAPTER 1. INTRODUCTION
sense of commonality based on the belief in common ancestry and shared culture (Ibid.). Such
markers can be language, phenotypical features, faith and so on.
Data on political exclusion is collected from the Ethnic Power Relations (EPR) dataset,
and the geo-referenced version, the GeoEPR dataset. The EPR data identifies all politically
relevant ethnic groups around the world, and measures how access to state power differs among
them in all years from 1946 until today (Cederman, Wimmer and Min, 2010, 98).
1.5.3 Institutional mechanisms
Institutional mechanisms are defined as subcomponents of a broader institutional system. It
refers to the specific rules of the game, such as, electoral rules, political centralization and
the role of the executive. These rules are often a part of a written contract, the constitution,
and act as the “primary mechanisms for disciplining officials” (Persson, Roland and Tabellini,
1997, 1). Although these mechanisms have been ignored by the literature dealing with natural
catastrophes, there is a large literature on their effects on economic performance (see Persson,
Roland and Tabellini, 1997; Persson and Tabellini, 2004; Crepaz, 1996; Knutsen, 2011), and
especially on their effects on public provisions. As this study in part examines how central
governmental features affect natural disaster resilience, which has many of the characteristics
of a public good, theory related to institutions and public goods provision provides the basic
theoretical tools. Data on institutions is collected from the Database of Political Institutions
(DPI) (Beck, Clarke, Groff, Keefer and Walsh, 2001), and the data collected by Schjølset (2008).
Central to the notion that institutions affect natural disasters is the activity of central
governments in two closely related but distinct areas: ex-ante disaster preparedness, and ex-
post disaster mitigation policies. This distinction is also drawn in the political science/political
economy literature on natural disasters (Skoufias, 2003; Healy and Malhotra, 2009; Anbarci,
Escaleras and Register, 2007; Cohen and Werker, 2008). Disaster preparedness includes all ex-
ante measures to insure against, and prepare for a disastrous event. Examples of such measures
are construction regulations to make buildings more robust to earthquakes, tsunami-warning
systems, dikes and terraces, and funding for governmental and non-governmental organizations
that will carry out the help-effort once a disaster has struck. Ex-post disaster response includes
all measures that are undertaken by governments after disaster has struck. Such measures
include the targeted channeling of funds, personnel and other resources to a particular disaster
mitigation operation, and/or special legislation targeted at dealing with a specific disaster.
Government preparedness and response spending provide the mechanisms for which insti-
tutions affect natural disasters resilience. However, as the literature conclude that ex-ante
preparedness spending is the foremost effective tool for natural disaster resilience (Healy and
Malhotra, 2009; Skoufias, 2003; Cohen and Werker, 2008), my theoretical discussion relates
to the allocation of ex-ante preparedness policies. I adopt a distinction from Ashworth and
Bueno de Mesquita (2006) on global public goods, and local goods. Global public goods are
goods that are directed to benefit all citizens, while local goods are directed to specific con-

1.6. STRUCTURE 7
stituents.5 Applying this distinction leads me to investigate how institutions shape the incen-
tives and the abilities of incumbents to provide global public preparedness measures instead of
local preparedness measures.
1.6 Structure
I proceed as follows: In Chapter 2 I review the relevant literature on institutions, political
exclusion and natural disasters. This provides the background for the theoretical framework,
and places my theoretical and empirical contribution in the scholarly literature. In Chapter 3
I narrow the scope, and present the theoretical arguments for which the effects of institutions
and political exclusion can be formulated into distinct propositions. In Chapter 4 I outline
my research design; addressing methodological and data issues. In Chapter 5 I present my
empirical tests, and the following results. In Chapter 6 I examine the robustness of the results,
and address how my model fits the data. Finally, I make some concluding remarks, before
addressing where to go forward.
1.7 Findings
The results provide clear rejections and confirmations of my propositions. The two major
findings are that (1) areas which are inhabited by politically excluded groups experience sys-
tematically higher death tolls in natural disasters, compared to areas which are not inhabited
by politically excluded groups. Estimates suggest that on average, areas with politically ex-
cluded groups suffer twice as many casualties in natural disasters. Secondly, (2) presidential
institutions are related to around 50 casualties more in natural disasters than parliamentary
institutions. This confirms my theoretical assumptions that political representation directly
affects ethnic groups’ vulnerability in disasters, and that incumbents favor those constituents
that ensure them in power. It also provides support to the hypothesis that institutional incen-
tives in presidential systems disrupt global goods provisions, and increase the vulnerability of
peoples. The empirical model rejects my hypotheses relating to electoral rules, while finding no
clear support for how level of centralization affects natural disaster vulnerability.
5Neither are perfect public or private goods. In this context the two terms must be understood as referring totwo distinct processes, and being placed on separate sides of a continuous scale, where perfect public and privategoods are at each end.

8 CHAPTER 1. INTRODUCTION

Chapter 2
Literature review
Amartya Sen is a scholar famous for many contributions to the field of political science. Still,
he is perhaps most famous for linking democratic governance to famine prevention. By stating
that “(...) starvation is the characteristic of some people not having enough food to eat. It
is not the characteristic of there being not enough food to eat” (Sen, 1983) he described what
has later been elaborated in many scholarly works; that human related disasters are precisely
that – human related. I center my theoretical starting point to human devised constraints, and
ask which incentives drive some institutions to produce many public goods, and what drives
some institutions to produce so few. The proceeding section goes through the most relevant
theoretical and empirical literature on natural disaster mitigation, and links institutions to
political exclusion and the allocation of public goods. In chapter 3 I construct a theory grounded
in this literature and form empirically testable predictions.
2.1 Institutions and natural disasters
A consistent finding in the literature on the determinants of natural disasters is that rich and
well-functioning institutions are associated with substantial lower death tolls from natural dis-
asters (Kahn, 2005; Besley and Burgess, 2002; Raschky, 2008; Flores and Smith, 2010; Plumper
and Neumayer, 2009). The logic is that democratic institutions are more responsive and effec-
tive in providing public goods, and hence invest more in natural disaster preparedness measures
that reduce peoples vulnerability when the hazard strikes. Together with tougher institutional
constraints and a free press, democracies are able to reduce incentives for under provisions in
ex-ante preparedness measures. Besley and Burgess (2002) find that flood impacts in India
are negatively correlated with newspaper distribution, and attribute this effect to the fact that
information circulation drives political accountability, which causes governments to be more
active in both preventing and responding to the impacts of disasters.
Skoufias (2003) as well as Cohen and Werker (2008) elaborated on the important differ-
ences between preparedness and response policies. Two important aspects were pointed out.
First, there are substantially different incentives driving preparedness and response policies.
Response spending is like any other spending; resources that are directed toward specific ac-
9

10 CHAPTER 2. LITERATURE REVIEW
tions. Preparedness spending, however, is characterized by profound uncertainty (Cohen and
Werker, 2008, 8-10). The government only knows with an estimated probability if a natural
hazard is going to strike, and in the trade-off between other government policies, this uncer-
tainty causes governments to undervalue ex-ante preparedness spending.1 The second aspect is
that preparedness spending excessively exceeds response spending in effectiveness when a nat-
ural disaster develops (Healy and Malhotra, 2009; Skoufias, 2003, 1097). Given that a natural
hazard strikes, each dollar invested in preparedness yields more resilience than each dollar in
response. Healy and Malhotra (2009, 396) found that in the US, the ratio between preparedness
and response was 15/1 in the favor of preparedness. As public goods in general are assumed to
have decreasing marginal returns, and that the United States is a highly developed country, it is
reasonable to think that the ratio between ex-ante preparedness spending and ex-post response
could be even higher in less developed countries where the marginal returns are higher.2
Flores and Smith (2010) and Plumper and Neumayer (2009) attach the capacities of insti-
tutions to the size of win-sets. Democracies are usually constructed on larger win-sets (large
coalitions of constituents). Thus, they have greater incentives to provide public provisions
directed toward large populations, and therefore are more resilient in natural disasters. Con-
versely, autocracies built on smaller win-sets (small coalitions) have incentives to provide their
winning coalition with private directed means, and therefore have a more unequal distribution
of disaster resilience, which again leads to larger catastrophes.
Another proposed reason for the effect of institutions on disasters is collective action prob-
lems caused by inefficiencies and transaction costs. Corruption may be one such cause of
inefficient bureaucracies (e.g. Besley and Burgess, 2002; Persson and Tabellini, 2003; Alesina,
Devleeschauwer, Easterly, Kurlat and Wacziarg, 2003). Anbarci, Escaleras and Register (2005,
2007) argue that institutionalized corruption leads to lack of enforcement of building codes, and
hence weaker infrastructure and housing. Stromberg (2007, 209) finds that the mitigating effect
of institutions indeed can be related to bureaucratic effectiveness. However, he provides the
only empirical rejection of the hypothesis that democratic institutions as such are related to
fewer disasters casualties – essentially contesting the large literature that have found evidence
for this. He recognizes that countries with extensive reporting procedures may be correlated
with democratic institutions, and acknowledges that the lack of effect may be due to overrepre-
sentation of countries with democratic institutions. Nevertheless, his finding provides the basis
of deeper look into the ‘democracy–disaster’ relationship.
A common belief is that democracies perform better because they experience fewer and less
powerful natural hazards. Although Dilley et al. (2005) find that the distribution of natural
hazards is biased to a few geographical areas, the risks associated with them are largely con-
tingent on country development and environmental quality (Peduzzi, Dao, Herold and Mouton,
2009). Stromberg (2007) finds that high-income areas in Europe, North America, and Japan,
1Uncertainty causes inefficiency in the ex-ante allocation of resources. Response spending excludes this un-certainty and allow governments to allocate resources under complete information.
2Assuming that less developed countries are at a lower level of the supply curve, where the slope is steeper,and hence the marginal revenue is higher.

2.1. INSTITUTIONS AND NATURAL DISASTERS 11
are in fact equally exposed to natural disasters, but that the magnitude is contingent on level of
development. Wealth is by far the most crucial determinant of natural disaster severity (Kahn,
2005; Anbarci, Escaleras and Register, 2005; Toya and Skidmore, 2007; Peduzzi et al., 2009).
Estimates suggested by Stromberg (2007) indicate that the number of fatalities are around 70
percent lower in high- than low-income countries. Wealth affects infrastructure and housing
through stronger and more durable materials, and wealthy governments can for example afford
more complex warning systems. Besley and Burgess (2002) argue that in addition to large suf-
ferings, poor countries are unable to counter the effect through fiscal policies. This constraints
reconstruction and causes a spiral of risk inducement.
In this brief review I have pointed out some of the most relevant theories and empirical
findings that link institutions to natural disaster vulnerability. Institutions have been argued to
have an effect through democratic institutions (Flores and Smith, 2010; Kahn, 2005; Stromberg,
2007); bureaucratic effectiveness and corruption (Anbarci, Escaleras and Register, 2005, 2007;
Stromberg, 2007); government stability and investment climate (Raschky, 2008; Toya and Skid-
more, 2007); and institutional quality (Kahn, 2005).3 The literature on determinants of natural
disasters has given institutions a great portion of explanatory power, and for this reason it
is puzzling that institutional subcomponents to such a large extent have been ignored. To
come closer to the institutional mechanisms that drive disaster resilience, my research project is
directed at a more detailed analysis of institutional constraints and the ability to provide protec-
tive measures. Sobel and Leesen (2006) and Gopalakrishnan and Okada (2007) provide the only
attempts to systematically argue how government institutions, that is, level of centralization,
can affect natural disaster mitigation. Sobel and Leesen (2006) argue that centralized systems
are characterized by collective action problems, transaction costs, and ineffectiveness, so that
institutions are incapable of reaching optimal provisions of disaster spending. However, they do
not test general predictions, but argue based on a study of Hurricane Katrina. Gopalakrishnan
and Okada (2007) on the other hand argue that decentralization creates unclear responsibilities
between the local and the federal government, and that the prospects of receiving federal aid
reduces the incentives for local disaster management. They also claim that local authorities
lack incentives to provide rigorous restrictions on land use, adopt national policies and rigid
regulations, which may lead to increased vulnerability (Ibid.).
As the theoretical and empirical literature on the effects of institutional mechanisms on
natural disasters are limited to the aforementioned contributions, I have looked for inspiration
from other fields of the political science/political economy literature, examining constitutional
features of institutional performance. In addition to level of centralization, I examine how
electoral rules, and the role of the executive influence natural disaster vulnerability. My specific
theoretical predictions will be elaborated in chapter 3.
3Protection against expropriation, regulatory quality, rule of law, control over corruption

12 CHAPTER 2. LITERATURE REVIEW
2.2 Institutions and goods provisions
Although institutional subcomponents to such a large extent have been missing in the literature
on natural disaster vulnerability, the literature on institutions’ effect on goods provisions is
substantial. Torsten Persson and Guido Tabellini (with co-authors) have researched a wide
range of constitutional/institutional factors in economic performance (Persson and Tabellini,
1996; Persson, Roland and Tabellini, 1997, 2000; Persson and Tabellini, 2003, 2004). Even
though these models were not developed with the intention to include institutions’ effect on
natural disasters, the models’ theoretical implications allow for further empirical testing (see
King, Keohane and Verba, 1994, 19-23). The reasons for choosing the institutional mechanisms
investigated, are both qualitative and quantitative; they are core features of the state, and they
have been issued considerable attention in the literature on institutional performance. The
proceeding section touches upon the most relevant theoretical and empirical literature on the
subject, in order to create a background for the theoretical discussion in the following chapter.
One of the distinctive differences between institutions is the incentives driving accountabil-
ity and representation (e.g. Powell, 2000; Przeworski, Stokes and Manin, 1999; Ashworth and
Bueno de Mesquita, 2006; Persson and Tabellini, 2004). On one hand accountability creates
incentives for good behavior through the risk of losing power. The logic is that the political
leaders produce good policies when they know that they can be kicked out of office. Account-
ability does not simply refer to voters punishing or rewarding politicians through re-election,
but also to the ability to elect the “right” candidate. Ashworth and Bueno de Mesquita (2006)
argue that this makes voters value candidate abilities over ideologies, and that public services
rise with skillful incumbents. On the other hand representation, meaning that the government
reflects the constituents, embodies the state with multiple interests, reflecting the potential
cleavages in society in general. This creates incentives for bargaining, coalition building, and in
turn; policies taking into account larger parts of society.
2.2.1 The role of the executive
Following this path, many argue that presidential systems are more accountable than parliamen-
tary systems, because of a simpler chain of delegation, and a more rigorous separation of power.
At the same time, accountability might lead governments to resort to short-term policies in fear
of being displaced, and consequently lower output of public goods. Persson and Tabellini (2004)
find evidence of such a rationale, and argue that coalition building in parliamentary regimes
leads to higher levels of government spending. On the flip side, parliamentarian systems are
linked to increased corruption (Persson and Tabellini, 2003), which again has been related to
large natural disasters (Anbarci, Escaleras and Register, 2007; Stromberg, 2003). However,
Persson, Roland and Tabellini (2007) find that across parliamentary systems, coalition govern-
ment significantly increases public spending, which indicate that broad based representation
increases public goods provisions.

2.3. POLITICAL EXCLUSION AND NATURAL DISASTERS 13
2.2.2 Elections
The ‘accountability-representation’ trade-off is also argued to function differently in electoral
systems. Proportional representation systems create larger coalitions, which lead to more spend-
ing and long term policies. On the other hand majority elections, or plurality rule, is argued
to be more accountable. Persson, Roland and Tabellini (1997) however, find that majoritarian
systems are associated with lower public spending (Persson, Roland and Tabellini, 1997). Just
as for the executive dimension, electoral rules also differ in incentives for corruption. Persson,
Roland and Tabellini (1997) find evidence of such a relationship, and link PR systems to higher
levels of corruption. Ashworth and Bueno de Mesquita (2006) argue that because legislators in
parliamentary systems do not hinge on independent executive, voters care more about policy
views than abilities, which they predict to lead to lower output of goods.
2.2.3 Centralization
Persson and Tabellini (1996) construct a model trying to tease out the general effect of cen-
tralization on country-level risk sharing.4 They predict that centralization causes inter-regional
coalitions to be built, which tilt public goods provision in favor of risk prone areas. On the
other hand decentralized systems are characterized by inter-regional conflicts, leading to under
provision of public goods. This approach contests the classic notion argued by Olson (1965),
who stated that the driving mechanism behind global goods provisions is how far people that
provide the good are to that particular good. In this context federal institutions, being closer
to the people providing the good, are more effective in securing public goods provisions.
2.3 Political exclusion and natural disasters
Studies of political motivation behind disaster relief, leaves government officials with a rather
gloomy portrayal. Garrett and Sobel (2003) found that politically important states in the
US received more disaster relief than non-decisive states. In their study of the allocation of
FEMA (Federal Emergency Management Agency) expenditures, the authors found that polit-
ically important states have a higher rate of presidential disaster declarations, and that states
having congressional members overseeing FEMA committees receive disproportional amount of
mitigation expenditures.
In a recent work, Healy and Malhotra (2009) make several important contributions to the
literature. They also use data from the United States, and find that preparedness spend-
ing excessively exceeds response spending, but that voters reward response spending, and not
preparedness spending. Citizens may weakly respond to preparedness projects because it is im-
possible for them to observe the counterfactual. Ex-post response, however, is easier to observe
and thus has greater media value. Relief expenditures are more easily attributed to current ad-
ministration, which creates incentives for short-term mitigation policies. The authors conclude
4The theoretical predictions are formulated to explain variations in labor market insurance, i.e. welfareprograms.

14 CHAPTER 2. LITERATURE REVIEW
that direct payments to individual groups lead to incumbent support (Healy and Malhotra,
2009, 401). This view is moderated by Chen (2008, 2009), who concluded that poor voters
are more responsive to pork-barrels, than wealthy voters (2008), and that Republican voters
respond more to direct aid than Democratic voters (2009). Achen and Bartles (2004) took a
swing at rational interpretations of voting behavior, and showed that voters regularly punish
governments for ‘the act of God’. Albala-Bertrand (1993, 93) has also contributed to this ris-
ing literature, and found evidence of how politically motivated disaster relief impair already
vulnerable areas.
What these studies show is that even though investments in long-term preparedness is more
efficient in reducing disaster risk, both voters and incumbents have strong incentives to neglect
efficient allocation of disaster mitigation policies, and instead value direct funding that increase
incumbents chance of reelection. Following this, one would expect that groups that are less
important for securing incumbent in office, receive less attention and less protective measures.
Cohen and Werker (2008) has made the only attempt to test this logic in a global large-n
study. They find that death tolls in countries with high levels of ethnic fractionalization are
three times as high as they are in more homogenous countries. However, they make use of
a simple model, which relies on a crude measure of ethnic fractionalization. The model does
not incorporate the political dimension of ethnic cleavages, and include only aggregate levels of
ethnic divisions. Secondly, they operate with country-level data, which do not tell us much about
who that are more likely to suffer in natural disasters. In his study of institutional determinant
of natural disasters, Kahn (2005) use ethnic fragmentation as a proxy for institutional quality.
However, his results are non-conclusive, and suffer from the same shortages relating to highly
aggregated country-level indices.
There are case studies that look at the role of ethnicity in natural disasters, but most of
them use data from the United States (see Fothergill, Maestas and Darlinton, 1999). Fothergill,
Maestas and Darlinton (1999) have collected and reviewed the empirical literature on the sub-
ject, and find that ethnicity is related to natural disaster vulnerability, and more specifically,
that blacks in the US are especially vulnerable. The explanation pulls in direction of housing
factors, such as unreinforced masonry (URM), and poorly built homes (Fothergill, Maestas
and Darlinton, 1999, 161). Peacock, Morrow and Gladwin (1997) make similar findings, and
conclude that ethnic minority communities are more vulnerable in natural disasters.
More generally, Alesina, Baqir and Easterly (1999) concluded in their work on the rela-
tionship between ethnic division and the provision of public goods that ethnic fractionalization
lowers public goods, and that ethnic polarization shrink public finances. The proposed mecha-
nisms indicate that when a majority group believes that another ethnic group consumes their
input of tax, they are not willing to keep providing the good. More generally ethnic fractional-
ization literature assumes that ethnic divisions are destabilizing to societies (e.g. Alesina et al.,
2003; Cederman and Girardin, 2007; Buhaug, Cederman and Rød, 2008; Cederman, Wimmer
and Min, 2010; Østby, 2011). The civil war literature has in later years provided a variety
of works on the effects of ethnic fractionalization and political exclusion, which has drawn the

2.3. POLITICAL EXCLUSION AND NATURAL DISASTERS 15
focus away from highly aggregated country level indices on fractionalization and towards indices
more explicitly measuring the political dimension of ethnic cleavages.

16 CHAPTER 2. LITERATURE REVIEW

Chapter 3
Theorizing natural disaster resilience
Even though the distinction between ex-ante and ex-post mitigation has received much atten-
tion, my model only views incentives driving government actions ex-ante disaster. Since pre-
paredness spending is the crucial determinant of natural disaster resilience, I develop a model
that looks at institutional incentives for effective allocation of ex-ante disaster preparedness
measures. If institutions are driven by rational expectations, and institutions evaluate the risk
concerning the losses in natural disasters to be high, and therefore invest in preparedness, it
is likely that those institutions would just as likely value response in the face of a disaster.
The cost of committing to ex-ante allocation is high (Cohen and Werker, 2008), but when risk
averse institutions accept this cost, it is just not very likely that they would not valuate the
costs ex-post also to be acceptable. Hence, this model assumes that what characterizes insti-
tutions is the incentives driving ex-ante allocation goods. Institutions can provide two sorts of
goods: global goods and local goods. Global public goods are goods that are directed to benefit
all citizens, while local goods are directed to specific constituents.1(Ashworth and Bueno de
Mesquita, 2006, 168) The relationship between institutions and preparedness spending is mod-
eled as a regional conflict of interests, where allocation of resources is contingent on the political
status of a particular region. When I make inferences about why some institutions are better
than others, it is important to note that I do not observe and measure the actual difference in
government spending allocation. I assume that when preparedness policies are allocated glob-
ally, that is, distributed universally covering all segments of society, countries are more resilient
to natural disasters. Such activities may include construction regulation, housing regulation,
public infrastructure, and other measures to insure against and prepare for disastrous events.
The political system in which political actors operate consists of constitutional and/or in-
stitutional structures that yield opportunities and put limitations for how incumbents act.
Institutions consist of both formal and informal rules that lay constraints on human interac-
tions, thus providing the incentive structure for feasible government policy (North, 1991, 1).
In the theoretical discussion I use provisions of global goods and local goods as a theoretical
framework to capture the logic behind preparedness policies that affect globally, or locally. I
1Neither are perfect public or private goods. In this context the two terms must be understood as referring totwo distinct processes, and being placed on separate sides of a continuous scale, where perfect public and privategoods are at each end.
17

18 CHAPTER 3. THEORIZING NATURAL DISASTER RESILIENCE
assume that where global spending is the highest, there will be fewer casualties from natural
disasters. Such an assumption might not capture the details of natural disaster resilience, but
nevertheless should provide a fruitful logic to institutional and political incentives for ex-ante
policies. What policies governments prefer is a complicated matter, and consists of manyfolded
and dynamic processes. The object in this theoretical discussion is an attempt to outline some
general effects of institutional mechanisms, and tidy up what in the real world would be hard
to generalize.
The point of departure is that the political system consists of a government and a number of
contenders seeking to maximize access to power (e.g. Tilly, 1978). Political leaders are assumed
to be rational actors, who ultimately want to hold office. Governments spend resources on two
types of goods: local goods and global goods. They provide and utilize the most appropriate
spending that maximizes their goal of holding office (see Downs, 1957; Bueno de Mesquita et al.,
2003). I assume that institutions shape the abilities and incentives of policy output. Partly,
the theoretical framework builds on “a political model of disasters” (Cohen and Werker, 2008),
which assumes a basic consumer model. I do not adopt the model precisely as it was intended,
and replace the distinction between ex-ante and ex-post with local and global public goods (see
e.g. Ashworth and Bueno de Mesquita, 2006).2
3.1 Incentives for disaster spending
The model has a simple structure. Governments can prepare for disastrous events ex-ante by
spending on global public preparedness, or they can direct goods at the local level, distributing
unequally based on the highest political payoff. I assume that the geographical risk is unequally
distributed. The impact of a disaster on human lives is a function on the total spending on
disaster preparedness, which consists of both global and local measures.
The government’s utility is a function of the welfare of the population (natural disaster
resilience); and its access to power. I assume that regions are heterogenous and that government
has unequal interests in regions, depending on the populous size; their value in swinging elections
or securing the leader in office; and political organization. In ethnically polarized countries,
government interest in regions might vary considerably (Cohen and Werker, 2008, 799). It is
easier for constituents to observe local spending than global public spending, which increases
incentives for local goods and mitigation policies. However, as governments also care about the
welfare of its citizens, it must evaluate the local goods to more efficient global public goods.3 It
can be argued that local goods may be more effective than global goods if they are distributed
to particularly vulnerable regions. However, because locally directed goods are driven by the
returning effect it has on incumbents’ access to power, local goods are directed according to the
political status of these regions. Global provisions, however, are more effective in securing the
needs of the most vulnerable citizens, since incumbents cannot exclude the vulnerable and the
2Please note that I do not share their predictions.3The model is not a general equilibrium model as it does not take into account supply-side responses to
government actions.

3.2. PROPOSITIONS 19
low-status groups from consuming the good.
The key logic is that governments provide the goods that optimize allocation between local
and global goods. However, the incentives driving this allocation are determined by the institu-
tional structure. When institutional mechanisms provide incentives for short-term pork barrels,
the optimal allocation between local and global goods is pushed toward local and short-term
provisions. This sort of allocation is characterized by inequality and misallocation, as the social
optimum would be higher if incumbents would allocate according to the welfare needs and not
incumbent’s access to power. Assuming this would mean that:
Assumption 1: The more the government derives utility from local goods and pork barrels,
the more vulnerable people will be in natural disasters, ceteris paribus.
3.2 Propositions
Below, I formulate three sets of hypotheses that build on Assumption 1. The first set deals
with the effects of institutional mechanisms, the second with political exclusion, and the last
takes into consideration the interplay between institutions and political exclusion.
3.2.1 Institutional mechanisms
Constitutions are the foundation in which institutions operate (Persson and Tabellini, 2004,
76). They provide the ’rules of the game’ and work as disciplining mechanisms for government
policy. I formulate three hypotheses based on the effect of institutional mechanisms on natural
disaster vulnerability. The hypotheses build on the assumption that there are some core institu-
tional features that provide incentives for either global goods or local goods provisions. While
I do not model the actual legislative bargaining that determines the resources provided, my
model is consistent with the notion that members of the leading coalition will be more able to
pork-barrel than non-incumbents. It should be noted that my focus is on three specific consti-
tutional features, which leaves other potential important aspects, such as judicial institutions;
subnational institutions; vertical arrangements; and other institutions untouched.
The electoral dimension
Electoral rules are core features of any political system, often regarded as the foremost indicator
of democratic rule (e.g. Przeworski, Alvarez, Cheibub and Limongi, 2000). However, rules for
elections differ among democratic as well as autocratic polities. Even though the role of elections
in autocracies is questionable, and have been issued a great deal of attention (Przeworski et al.,
2000; Bueno de Mesquita et al., 2003; Geddes, 2006; Rød, 2012), they can potentially function
as disciplining mechanisms, especially when viewing the democracy-autocracy dimension along
a continuous scale. A suggested mechanism is that autocratic leaders set up democratic institu-
tions to grant contesting elite members concessions so that they will have more to lose in a coup
(Geddes, 2006). Thus, the extent to which governments provide natural disaster policies can be

20 CHAPTER 3. THEORIZING NATURAL DISASTER RESILIENCE
contingent on electoral rules. I separate between proportional representation (PR) systems and
majoritarian systems. Given the dazzling variation of pros and cons concerning electoral rules,
the task of finding a clear cut rationale behind theoretical expectations is not easy. When I
make such predictions, I do not suggest that the mechanisms proposed capture the exact process
of policy output, but that given my assumptions the rationale tilts the output in the proposed
way.
I follow the definition by Gabel and Hix (2005, 4-5), which states that:
“[I]n their purest form, in PR systems voters choose between list of candidates
presented by parties in multi-member districts and seats are allocated in proportion
to the share of votes its received. In majoritarian systems, in contrast, voters choose
between individual politicians in single-member districts and the winning candidate
in each district is the one who receives the most votes in a district”.
There are also intermediate systems, or semi-systems if you will, that produce a mix of the two
mentioned (Knutsen, 2011). However, as a simple solution, I limit myself to consider only PR
and majority elections.
In single districts and plurality vote, as most majority elections are, the competition over
voters is inherently more sensitive to the abilities of each candidate (Ashworth and Bueno de
Mesquita, 2006), as small shifts in the allocation of voters might completely change the outcome
of the votes. This creates incentives for candidates to focus more on pork-barrels and local goods,
instead of global public goods. Local goods are more easily observed among the constituents,
and constituents, at least in regions with balanced competition, know that their vote, compared
to a PR-systems, are more likely to affect the electoral outcome. Thus, voters in majority
systems have incentives to focus more on the abilities of each candidate’s bid for votes, and
candidates correspondingly derives more utility from goods directed at particular constituents.
Persson and Tabellini (2004, 85) write that
“[S]ingle districts and plurality vote both tend to pull in the direction of narrowly
targeted programs benefiting small geographic constituencies and swing states. Con-
versely, multimember districts and proportional representation both pull in the di-
rection of programs targeting broad groups”.
Elections in multimember/proportional representation systems do not have the ‘winner takes
it all’ logic, which creates incentives for constituents to care more about their actual policy
preferences instead of the abilities and the ‘porks’ of each candidate. Additionally, multimember
districts have stronger incentives to seek support from broad coalitions, which create incentives
for broad redistributive provisions.
Majority systems are characterized by a stronger declaration of accountability (Persson and
Tabellini, 2004). This may create incentives for good behavior. However, because accountability
also makes incumbents more sensitive to the media and the opposition, it may also contribute to
more politically directed and local provisions, and underinvestment in global goods. Stromberg
(2003) shows that majoritarian electoral systems imply a much more lopsided distribution of

3.2. PROPOSITIONS 21
goods across states. Spending is focused on states where a relatively small number of votes
might tip the entire state.
Even though PR-systems are often viewed as less accountable, PR-systems have lower bar-
riers to enter and exit the political space, and build larger coalitions and therefore have fewer
incentives to allocate goods based on the political status of groups. Knutsen (2011, 1) ar-
gues that proportional representation systems, by their ”propensity to generate broad-interest
policies” produce relatively larger quantities of public services. Political parties mitigate the
incentive problems from non-recoverable costs. As long as parties internalize entry costs, they
permit individuals to compete for office without risking the full costs in each election. Hence,
parties reduce costs of entering and exiting the political space (Lake and Baum, 2001, 9). In
parliamentary systems, which are strongly related to multipartyism, the costs of entering and
exiting the political space are lower than in one- or two-party systems. As low costs of entering
and exiting the political arena decreases the risk of being excluded, it follows that multiparty
systems will have a more complete representation of constituents, which yield incentives for
bargaining across parties and political cleavages.
However, it has been argued that PR-systems are more inefficient in allocation of goods, and
that they produce higher levels of global goods than they can afford. As this might produce
inefficient economic systems and higher deficits, the negative effect on disaster resilience is not
clear. PR-systems are also correlated with higher levels of corruption, which can be attributed
to higher intraparty competition, and lower interparty competition. As indicated in section 2.1,
levels of corruption are related to higher death tolls in natural disasters. Nevertheless, I argue
that the negative effects of corruption and inefficiency in PR-systems are countervailed by their
positive effects of redistribution and provision of public goods. I assume that plurality/majority
systems lead to suboptimal allocation between local and global public goods, which again lead
to higher death tolls in natural disasters. Correspondingly, PR-systems are less sensitive to
pork barrels, and hence produce more global goods, and are more robust in natural disasters.
Proposition 1: PR-systems experience fewer casualties from natural disasters than ma-
joritarian systems, ceteris paribus.
The executive dimension
The second institutional distinction is between parliamentarian and presidential systems. In
parliamentary systems “the executive (...) is chosen by and to an elective body (the legislator),
thus creating a single locus of sovereignty” (Gerring and Moreno, 2010, 337). In presidential
systems “policy-making power is divided between two separately elected bodies: the legisla-
tor and the president” (Gerring and Moreno, 2010, 337). Although there are many variations
within these ideal forms, including semi-systems (Cheibub, 2007), presidential systems are in-
stitutionally more fragmented (Knutsen, 2011, 3). Many argue that presidential democracies
have tougher checks and balances (Olson, 1993), thus being more accountable (Benhabib and

22 CHAPTER 3. THEORIZING NATURAL DISASTER RESILIENCE
Przeworski, 2005). As policy in parliamentary systems are fully determined by the legislator,
the policy outcome in presidential systems builds on bargains between the president and the
legislators cabinet (Ashworth and Bueno de Mesquita, 2006). Although this might indicate that
legislation is pushed toward the median, separation of power under presidentialism may also
enhance rigidity (Linz, 1990) as well as contribute to more market asymmetries (Olson, 1982).
Rigidity may decrease heavy redistributive programs (Linz, 1990, 66). Secondly, constituents
know that presidents only in part affect national policy, which lead voters to concern more
about candidate abilities instead of policy preferences. This create incentives for candidates to
bid for votes in pork-barrels, and forces them to focus on local policy projects, instead of global
goods provisions.
Presidential systems are more sensitive to electoral contestation and strategic voting (Stromberg,
2003). There are examples that few districts, even as few as one, has altered the election in
favor of one candidate instead of another. This is exacerbated by strategic voting, which might
lead candidates elected in one round to be voted out in the next round. The logic is similar
to the electoral dimension. Candidate selection in presidential systems is distinctively more
dependent on individual charisma and abilities, compared to parliamentary systems (Ashworth
and Bueno de Mesquita, 2006, 169). In parliamentary systems voters to a larger extent choose
leaders among the party leaders, which have been chosen by members of parties and not by
the general public. In all likelihood members of parties are more occupied with policy prefer-
ences than the general public. Intra party discipline is a mechanism that drives the functioning
of parliamentary systems, as opposed to presidential systems. Because parliamentary systems
elect their executive by and to their legislator, government would not function without parties
holding at least some of their promises. In presidential systems policy-making is divided, which
make preferences less vital for policy output.
As for PR-systems, parliamentary democracies are related to more corruption (Persson,
Roland and Tabellini, 2000). Studies have shown that bureaucratic corruption is related to
higher death tolls (Anbarci, Escaleras and Register, 2005), which might drive the effect of par-
liamentary systems toward inefficient allocation of goods. Nevertheless, my assumption is that
presidential systems extract more utility from direct payments and local goods provisions, and
therefore should increase the tolls on human lives in natural disasters.
Proposition 2: Parliamentary systems experience fewer casualties in natural disasters than
presidential systems, ceteris paribus.
The centralization dimension
The last institutional mechanism is the level of centralization. Because polities are divided in
geographical areas, and constituents and therefore political cleavages are unevenly dispersed
throughout geographical areas, the level of centralization might affect how natural disaster
policies are distributed across regions.
My approach builds on a model from Persson and Tabellini (1996) on social insurance and

3.2. PROPOSITIONS 23
risk sharing. The model assumes that there is a trade-off between regional risk sharing and
redistribution. Although the concept of risk did not refer to natural disasters in their model,
the observable implications are applicable also here. Essentially, their model predicts that when
there are geographically based cleavages, centralized provision leads to higher levels of global
goods provision, while decentralized provisions lead to under provisions of global goods.
The model assumes that regions are exposed to a risk. The distribution of risk between
individuals is unequal, and are concentrated to a minority of the population. There are two
levels of government; the local and the federal. The local government chooses to allocate public
goods between the vulnerable and the robust part of the population. In decentralized systems
there are no aggregation of individual risk to the country level. This limits interregional transfers
to only reach the robust population. The logic is that because risk is distributed unequally, there
is a conflict over the allocation of resources. In decentralized systems, the bargaining power
depends on the regional welfare under autarky (self-sufficiency), and because the most robust
regions are better off with no interregional transfers, no aggregate coalition of constituents
is formed. The bargaining between regions will accordingly be tilted in the favor of the low
risk regions, leading the high risk regions to be underprovided (Persson and Tabellini, 1996,
996-1005).
For centralized federal insurance, the case is different. A centralized system redistributes
by collecting more income tax in the robust region than in the vulnerable region. In such a
system, the bargaining power is no longer only at the regional level, but also between individuals
(aggregation of risk). This means that risk prone individuals create coalitions across regions to
form a aggregated demand for global disaster mitigation policies. So what intuitively captures
the difference between decentralized and centralized systems is the bargaining situation. De-
centralized systems are characterized by pure regional conflicts of interests, while centralized
systems are characterized by regional conflicts and individual conflicts, which create aggregate
risk and coalitions across regions (Persson and Tabellini, 1996, 999). This ultimately leads to
broad global redistributive programs instead of local underinsurance (Persson and Tabellini,
1996, 998).
Federal highway spending in the US can illustrate this conflict of interest. In the Federal
Highway Aid Program a large proportion of funds were earmarked by legislators to specific
projects and districts. Additionally, even though funding was supposed to be distributed ac-
cording to some fixed standards, this was manipulated, targeting favored states (Besley and
Coate, 2003, 2612).
The relationship between centralization and public goods has also been connected to mecha-
nisms such as uncertainty and misallocation. This approach builds on the classic notion argued
by Olson (1965), which states that the further away people are from the good provided, the
fewer incentives they have to pay for that particular good. The rationale is that each district is
not sure if they will receive the same share of the good as the share they provide. This again
creates incentives to shrink. Besley and Coate (2003) argue that centralized provisions lead to
conflict between representatives of heterogenous regions, which will play out in the legislator.

24 CHAPTER 3. THEORIZING NATURAL DISASTER RESILIENCE
Secondly, they argue that as districts become more heterogenous, allocation in centralized sys-
tems worsen. Nevertheless, I argue that cost sharing in centralized systems causes allocation
to be more directed at global public goods, instead of local goods. However, If I find that
centralized systems increase the likelihood of casualties, the mechanism of aggregate risk most
likely is outdone by interregional conflict.
Proposition 3: Centralized governments experience fewer casualties than federal govern-
ments, ceteris paribus.
3.2.2 Political exclusion
I view the state as comprised of institutions that to different extents include representativeness
of particular ethnic/political communities (see Cederman, Wimmer and Min, 2010). Politi-
cal officeholders thus have institutional incentives to distribute goods, favoring those political
or ethnic groups that ensure them in power (Bueno de Mesquita et al., 2003). However, as
incentives for holding office and maximizing access to power constitute strategic motivations
for public policy, institutional arrangements might discipline leaders to unequal distribution of
goods. Hence, institutional rules that increase cooperation and coalitions across ethnic cleav-
ages should provide disciplining mechanisms for impairing the conditions for politically excluded
groups.
The strong and robust effect of wealth on disaster vulnerability indicates that the effects of
natural hazards are functions of the human environment. Since ethnic minorities and politically
excluded groups often constitute a substantial part of the poor community in developing coun-
tries, ethnicity is regarded as important for understanding vulnerability (Peacock, Morrow and
Gladwin, 1997). Excluded groups can also be less informed and are therefore less likely to par-
ticipate, either in elections or through other forms of political participation (Besley and Coate,
2003). My theory postulates that leaders and candidates have unequal interest in regions and
political groupings, and prefer to enrich their own coalition. When political groups lack access
to central authorities, and therefore are impaired of political power as well as to communicate
their needs, one would expect that politically excluded groups receive fewer government actions
targeting risk reduction in natural disasters.
Fearon and Laitin (2003) argue that not only incentives affect how central government relates
to peripheral groups, but the fact that material capabilities, that is, the ability to effectively
control territory, makes it harder and less feasible for the central state to give concessions to
peripheral groups. Buhaug, Cederman and Rød (2008) and Cederman, Girardin and Gleditsch
(2009) argue in the same direction, but focus on how soft power also contributes to making
peripheral groups more excluded. This leads me to think that politically excluded groups are
less likely to receive effective disaster help. Excluded groups also want to maximize their access
to power, and therefore pose a threat to incumbent leaders. Hence, incumbents not only have
the incentive to prefer its own coalition, it has the incentive to impair excluded groups. It

3.3. INTERPLAY BETWEEN INSTITUTIONS AND EXCLUSION 25
follows that:
Proposition 4: Politically excluded groups experience more deaths in natural disasters than
politically included groups.
3.3 Interplay between institutions and exclusion
Drawing on the abovementioned theoretical framework, the interplay between institutions and
political exclusion should be clear. PR-elections are more inclusive, provide mechanisms for
larger coalitions, and are less sensitive to pork-barrels compared to majoritarian elections, which
leads to larger global goods provisions. Even though we can argue that parliamentary regimes
are less accountable, they have fewer incentives for direct and local payments, they build larger
coalitions, and constituents are more occupied with policy preferences than abilities, which leads
to higher output of global public goods. Lastly, because risk is unequally dispersed at the local
level, individuals in centralized countries are forced to build coalitions across regional bound-
aries, which make allocation of goods in favor of risk prone individuals. In decentralized systems,
the bargaining between regions only reflects regional and not individual cleavages, which makes
resilient regions alter the provisions to their advantage, and hence reduce the output of global
goods. Since local goods are driven by the returning effect the good has on incumbents’ ability
to stay in power, institutions that are driven by local goods allocate goods based on the con-
stituents’ political status. Hence, such institutions are more impairing to politically excluded
groups than institutions that allocate goods globally.
Proposition 5: Excluded groups experience more casualties in majority systems than in
PR-systems.
Proposition 6: Excluded groups experience more casualties in presidential systems than
in parliamentary systems.
Proposition 7: Excluded groups experience more casualties in federal systems than in
centralized systems.

26 CHAPTER 3. THEORIZING NATURAL DISASTER RESILIENCE

Chapter 4
Research design
4.1 Why a statistical analysis?
When confronted with a problem, researchers must choose how to investigate that particular
problem, and think hard about the reason for investigating the problem in that particular way.
The research method yields grounds for inferences about a particular issue, and is at the core
of scientific research (King, Keohane and Verba, 1994, 3-9). Scientific methods may sometimes
be more complicated than everyday practices to resolve problems, but are essentially nothing
more than what ‘everyman’ does, but in a more systematic way.
Often, there is a trade-off between making general inferences about a particular problem,
say, what factors make societies in general more robust to natural disasters, and why so many
people died in the 2004 Indian Ocean tsunami. If you want to say something general about a
social phenomenon, it is not sufficient to study only one or a few incidences. Correspondingly,
if you want to make causal inferences about what made the Indian Ocean tsunami so deadly, it
is not sufficient to study natural disasters in general, without looking deep into that particular
case.
A problem with studying a large number of cases, is that the inferences you make are founded
upon many, and sometimes crude assumptions about the observations at hand. For example,
that the underlying story is stable throughout the population. This means that it makes sense to
compare different sorts of natural disasters and geographical regions, even though we know that
some catastrophes are more deadly, and that some regions more prone to natural hazards than
others. Another problem is that the phenomenon we are interested in saying something about,
and the data at hand, do not fit perfectly together. The indicators used are often not precise
or all-encompassing measurements of the concept we are trying to measure. This creates a
distance between what we want to say something about, and what we really say. Although such
assumptions moderate the extent to which inferences about particular social phenomena can be
generalized to the universe of events, statistical tools help researchers to handle complexities and
limited cognitive abilities; so that we at least are able to say something about the relationship
between phenomenon.
Apart from validity issues and other related problems, the reason for a large-n statistical
27

28 CHAPTER 4. RESEARCH DESIGN
analysis should be clear: statistical models allow us to draw systematic and precise inferences
about a large number of cases. A large number of cases are closer to the universe of cases, which
lowers the danger of selection bias.
Lastly, statistical tools are useful for analyzing input-output relationships. Since it is dif-
ficult to observe the actual decision-making process that affects natural disaster vulnerability,
the analysis builds on the relationship between countervailing effects of the input of individual
indicators on one hand, and the aggregate output on the other. The variables enter as indi-
vidual effects, while the output is the overall benefit that produces this effect Wig (2011, 48).
Given the dazzling variations of the pros and cons concerning the effects of institutions, my
theoretical assumptions build on mathematical expected utility models, that calculate certain
parameter values and looks at the aggregate output given a combination of these values. As
these parameter values can be very difficult to measure, a second best choice is to assume the
theoretical relationship with the limits that follows, and focus on the aggregate output esti-
mation. A further discussion on methodological and statistical issues will be elaborated under
Section 4.3.
4.2 Why disaggregate?
Contemporary research on the effects of institutions and ethnicity have based many of their
analyses on country level indices.1 This often leads to inferences built on significant discrep-
ancy between theories and the empirical analysis (see Buhaug and Lujala, 2005; Buhaug and
Rød, 2006; Buhaug, Cederman and Rød, 2008). However, research on determinants of natural
disasters demand smaller units (e.g. Dilley et al., 2005; Peduzzi et al., 2009). Smaller units give
more precise measurements of local conditions, which is essential when modeling relationship
between geographically confined factors and human related events. Secondly, aggregate coun-
try level indices do not allow for within country variation, which results in large parts of the
variation being unobserved. This may potentially lead to wrong conclusions. By narrowing
my analysis to the local level and select 0.5 decimal degree grid-cells as the main observational
unit, I adhere to such problems. A disaggregated approach makes more sense when empirically
evaluating actor-centered theories, and yields more valid inferences about whom, and under
which conditions natural disasters are more deadly.
Another reason for choosing grid-cells as observational unit, is that they are not socially
determined, meaning that they are exogenous to the political and social environment. As
grid-cells are not affected by changes over time and place, this makes them more stable as
observational units compared to countries (Tollefsen, Strand and Buhaug, 2012b, 4).

4.2. WHY DISAGGREGATE? 29
Figure 4.1: International borders and country assignment. The figure illustrates the borderbetween Thailand, Cambodia, and Laos (dashed line), with grayscale coloring indicating thecountry to which each cell is assigned. The numbers in the cells refer to the Gleditsch and Ward(1999) numeric code for the corresponding country (800 is Thailand; 811 is Cambodia; 812 isLaos). Figure is taken from Tollefsen, Strand and Buhaug (2012b, 368).
4.2.1 PRIO-GRID
Grid-level data is provided by the PRIO-GRID dataset (Tollefsen, Strand and Buhaug, 2012a).
A grid is a quadratic cell on the two-dimensional terrestrial plane. The PRIO-GRID is con-
structed using vector shape-files where each cell is represented by a square polygon vector
feature (Tollefsen, Strand and Buhaug, 2012b, 6). The grid is based on the dominant geo-
graphical coordinate system, the World Geodesic System (WGS84). The grids are defined as
0.5 decimal degrees intervals latitude and longitude. The global matrix consists of 360 × 720
columns, which yields 259, 200 cells in total. Most of the cells have little relevance as they
cover water or unpopulated areas. The 0.5 decimal degree (long/lat) corresponds to roughly
50 × 50 km at the equator. This means that even small countries are represented by multiple
grid-cells, which makes it possible for within country variation. All grid-cell control variables
in the disaggregated analysis are taken from the PRIO-GRID dataset. The dependent variable
was imported into the PRIO-GRID using ESRI’s ArcMaps Geography Information Systems
(GIS). Figure 4.1 shows how the grids look like, and exemplifies how each cell is assigned to
the country that covers the largest share of the cell area (Tollefsen, Strand and Buhaug, 2012b,
368).

30 CHAPTER 4. RESEARCH DESIGN
Figure 4.2: The figure illustrates how a high-resolution raster (top) is represented in PRIO-GRID (below). The string codes denote different land cover classes (Hansen et al., 2000;0.08◦ × 0.08◦ resolution); CR cropland, CS closed shrubland, DB deciduous broadleaf forest,EB evergreen broadleaf forest, GR grassland, WO woodland, WT water(Tollefsen, Strandand Buhaug, 2012b, 366).
4.2.2 GIS procedure
Data on natural disasters were merged with the PRIO-GRID using GIS tools. The data merges
as layers using a spatial joint command. This is done by constructing each variable onto a
geographical map as a layer using shape-files (with spatial longitude-latitude coordinates). Each
layer is merged together by placing them on top of each other, and finally, spatially joining them
together. Now all observations consists of information on the natural disaster and is ready for
regular modeling using Stata 12. Figure 4.2 illustrated how high-resolution data are aggregated
into smaller set of observations in the vector-based grids (Taken from Tollefsen, Strand and
Buhaug, 2012b, 366). It also illustrated how the data is constructed as layers, and spatially
joint together by placing them on top of each other.
4.3 Data issues and selection bias
Many of the concerns in the analysis are due to the nature of the data and statistical analyses.
Figure 4.3 shows the yearly number of disasters, together with total and average number killed.
Even as the number of reported disasters has increased the last 40 years, the number of killed
in each disaster has decreased. The total number of deaths has been fairly stable. A reasonable
explanation is that improved economic conditions have impacted the effects of natural disasters
1E.g. literature explaining public goods distribution, natural disasters, conflict, and regime stability.

4.3. DATA ISSUES AND SELECTION BIAS 31
Figure 4.3: Number and Magnitude of Disasters, 1970-2010. The figure is based on Figure 1 inStromberg (2007, 202), but with my own data.
on a global scale. However, there might also be unbalanced reporting over time. As there are
more small disasters in later years, this may indicate that there has been an increase in disaster
events, or that there is a development towards more complete disaster reporting. This likely
bias is inherent in the data. Keeping such problems in mind, the EM-DAT database is the most
comprehensive database on natural disasters available. It is better to evaluate these questions
with caution than not evaluating them at all.
Another concern is that rich democracies are systematically overrepresented in the data.
Stromberg (2007, 201) made this concern, and as a example showed that China, with the
change of head of state, systematically reported different numbers of disasters in the period
1960 to 1979, compared to the period after. However, as there are no obvious ways of cor-
recting for this, I resort to a second best choice, and complement my disaggregated approach
with a country level analysis. The country-level approach tries to limit selection bias that orig-
inates from listwise deletions in the disaggregated dataset. Since the disaggregated approach
on grid-cell level require data with spatial longitude-latitude information, a large part of the
data is lost due lack of geographical data. The sample is reduced to around 730 observations,
from the original 6580, and it is likely that there are some sort of selection mechanisms at play.
Highly developed countries and regions with better reporting procedures are likely to be over-
represented, which would mean that the effects of institutional quality and political exclusion,
being inherent in the democracy indicator, would be underestimated in the analysis. The mean
democracy score (Polity IV index) rise to 5.8 in the disaggregated analysis, an increase with 1.6,
indicating the such selection mechanisms are at play, and increases the notion that democracies

32 CHAPTER 4. RESEARCH DESIGN
are overrepresented.2 However, if the results indicate that such factors are present, the effect
may be even greater in the real world.
Table 4.1: Natural disasters events and casualties by disaster type, country level analysis.
Disaster type Number Percent of type Number killed Percent killed
Earthquake 654 9.93921 575802 48.6958Flood 2687 40.83587 182991 15.47562Mass movement (wet) 383 5.820669 20414 1.72642Storm 2092 31.79331 281317 23.79109Volcano 131 1.990881 24975 2.112145Mass movement (dry) 36 .5471125 2197 .1858011Extreme temperature 313 4.756839 93062 7.870289Wildfire 284 4.316109 1689 .1428394Total 6580 100 1182447 100
Source: EM-DAT (2012).3
Secondly, some natural disasters are more easily geographically placed than others. Since
the geo-coding of natural disasters rely on shape-files with a centered point, it is easier to geo-
reference volcanic eruptions or earthquake, than for example floods or storms. Comparing table
4.1 and 4.2 we can see that this has resulted in an overrepresentation of earthquakes compared
to other disaster categories, in the disaggregated sample. Earthquakes are by far the deadliest
in both analysis. Especially storms are underrepresented in the disaggregated analysis. Again, I
remind the reader to keep in mind these biases, as it might affect the outcome of the regressions.
Table 4.2: Natural disasters events and casualties by disaster type, grid-cell analysis.
Disaster type Number Percent of type Number killed Percent killed
Earthquake 354 48.49315 171689 92.17261Flood 285 39.0411 9746 5.232218Mass movement (wet) 6 .8219178 253 .1358251Storm 40 5.479452 3677 1.974027Volcano 45 6.164384 904 .4853196Total 730 100 186269 100
Source: EM-DAT (2012)
The same problem accounts for regions. Table 4.3 and 4.4 show disaster statistics by regions,
country level and grid-cell level, respectively. Asia is the region which is the most prone to
disasters and the number of killed in both samples. However, there are discrepancies between
the two datasets. Asia is to some degree overrepresented in the disaggregated data, which might
lead to biased results. Americas is also overrepresented, however only in number events. This
should be kept in mind when analyzing the data.
2There is also a small increase in GDP per capita with 465 US dollars.

4.3. DATA ISSUES AND SELECTION BIAS 33
Table 4.3: Regional number of disasters and casualties, country level analysis.
Region Number of disasters Percent of disasters Number killed Percent killed
Americas 1734 26.352 133313 11.274Europe 999 15.182 86099 7.281Asia 2819 42.841 933192 78.920Africa 764 11.610 26112 2.208Oceania 264 4.012 3731 .315Total 6580 100 1182447 100
Source: EM-DAT (2012)
Table 4.4: Regional number of disasters and casualties, grid-cell analysis.
Region Number of disasters Percent of disasters Number killed Percent killed
Americas 220 30.136 21532 11.559Europe 88 12.054 2973 1.596Asia 299 40.958 153763 82.548Africa 84 11.506 5477 2.940Oceania 39 5.342 2524 1.355Total 730 100 186269 100
Source: EM-DAT (2012)
Another reason to include a country level analysis is that the institutional variables should
have country level effects when looking at the number killed in general. A more pragmatic reason
is that the theoretical effects of institutional mechanisms exhibit a large variation of costs and
benefits concerning public goods distribution. This may create rather small and demanding
effects, empirically. Since the listwise deletion in the disaggregated approach reduces the data
with 5850 observations, it should be easier to tease out the effects of institutions on a larger
dataset.
The two approaches should be evaluated discretionary. Since the country level analysis
does not really say much about which groups that are more vulnerable in a natural disaster,
the country level analysis should function as a preliminary test of the hypotheses relating to
political exclusion. Correspondingly, the effect of the institutional variables should play out
in the country level analysis. Both analyses should be interpreted as complementary, and as
robustness tests, although the specific variables are more valid in one of the models than in the
other.
Lastly, although democratic constitutions rarely change, and that a potential endogenous
relationship between political output and constitutions is unlikely, cross-country variation in in-
stitutions is strongly correlated with stable country characteristics (Persson and Tabellini, 2004,
77). Presidential regimes are mostly concentrated in Latin America, former British colonies tend
to have adopted british electoral rules, and continental Europe is predominantly ruled by parlia-
mentary systems with proportional representation elections (Persson and Tabellini, 2004, 77).
This may result in that the effects of institutions are driven by unobserved country characteris-
tics. Such self-selection mechanisms is clearly nonrandom and most likely correlated with other

34 CHAPTER 4. RESEARCH DESIGN
unobserved variables that also influence a country’s policy outcomes. Acknowledging this, Pers-
son and Tabellini (2004) estimated the effects using matching models, that is, models that take
into the account what would happen if institutions did not inhibit these stable characteristics.
The results showed that institutions still produced the same effects, which indicate that there
might be a causal relationship between institutions and policies.
4.4 From concept to indicator - making inferences
Measurement validity is concerned with whether operationalization and the scoring of cases
adequately reflect the concept the researcher seeks to measure (Adcock and Collier, 2001, 529).
Measurement is valid when the scores derived from a given indicator can meaningfully be inter-
preted in terms of the systematized concept that the indicator seeks to operationalize (Adcock
and Collier, 2001, 531). As I do not perform validation procedures, the operationalization of
the variables should be validated discretionary, based on the theoretical linkage between the
concept and the indicator.
4.4.1 Baseline model
I follow Mileti (1999); Stromberg (2007); IPCC (2012) who argue that a model of natural
disasters must include at least three components to sufficiently control for spurious effects:
vulnerability, exposure, and the natural disaster event. I start by operationalizing and describing
the dependent variable, before moving on to the independent variables. Finally, I go through
the control variables.
4.5 Dataset and unit of analysis
Data on natural disasters stem from the Emergency Events Database (EM-DAT, 2012, CRED).
A natural disaster is classified when; ten or more people where killed; 100 or more people where
affected or injured; a declaration of state emergency was made; or if a call for international
assistance was made.4 The analysis deals with specific natural disasters, that is, rapid-onset
natural disasters. This include earthquakes, floods, volcanic eruptions, wildfires, hurricanes,
tsunamis, storms and mass movement (dry and wet). Slow-onset disasters such as drought are
excluded from the analysis. The rationale is that rapid onset disasters are more exogenous to
institutions and the socio-economic environment than for example droughts, and hence reduce
endogeneity problems. Secondly, since slow-onset disasters evolve over longer time-periods,
government actions ex-ante and ex-post are more difficult to separate. Rapid onset events are
therefore theoretically more relevant as I hypothesize about the institutional constraints ex-ante
catastrophe. Natural disasters are defined as a rather common event in the EM-DAT dataset,
which yields a large variation in my dependent variable. The EM-DAT database is the only
publicly available data on such a large scale, and is by far the most commonly used data source.
4For more information on the extensiveness of the reporting and entry procedures please visit the webpage:http://www.emdat.be/.

4.6. DEPENDENT VARIABLE 35
The dataset includes all rapid-onset disasters in the world from 1980-2008.5 The time period
was chosen because the data prior to 1980 is not as homogenous as after 1980 (Peduzzi et al.,
2009, 1150). The decision to end the time series in 2008 is due shortcomings in available data
on institutions and socio-economic variables.
The observations in the raw dataset are in the form of ‘natural disaster event’ in country-
year, thus being a unbalanced panel. As one of the contributions of this project is to illustrate
the empirical benefits of a disaggregated approach at the grid-cell level, the analysis deals with
both country level and grid-cell level observations. In the country level approach the unit
of analysis is natural disaster event in country year. In the disaggregated approach the unit
of analysis is natural disaster event in grid-cell year. I have chosen to include observations as
events instead of adding the events together to make up ‘annual death count’. There are studies
that operationalize the dependent variables as annual death counts, (e.g. Kahn, 2005; Raschky,
2008; Cohen and Werker, 2008), however, this limits the possibility to control for disaster type
characteristics (earthquakes are different from storms etc.). The ability to control for such
characteristics is essential when modeling natural events, and limits the danger that conclusion
are drawn on spurious relationships. Secondly, operationalizing the dependent variable as annual
counts would treat countries that are more risk prone the same as countries which suffers few
events over the time period. As my model cannot control for ‘risk’, keeping the observations as
single events does incorporate some of the natural ‘risk’ component. In the country level data,
only 896 of the 6580 disasters were single event years. 30 percent of the countries suffered at
least 10 events in each disaster year. This trend is not apparent in the disaggregated analysis
as the unit is much smaller. However, there were grid-cells that had multiple disasters in a
single grid-cell year. Following the aforementioned rationale for controlling for disaster type
characteristics, I chose to include only the largest disaster, measured as the number killed, in a
grid-cell year.6
4.6 Dependent variable
The dependent variable is operationalized as the count of number killed in a natural disaster.
Damage from natural disasters can however be both economic, human, or cultural. The EM-
DAT database provides information on the number of killed, injured, affected, made homeless,
and economic damage measured in US dollars. However, the number killed is by far the most
reliable source (Peduzzi et al., 2009, 1150), and is therefore used. Because the EM-DAT data
registers disasters accordingly to areas that are affected, the same disaster can be counted
several times.7
The number of killed reach from 0 to 165,708 in the country level analysis, and 0 to 73,338
in the disaggregated analysis. Table 4.5 shows a randomized sample from 30 natural disaster
5The dataset can be provided by request.6The geo-coded disaster data had originally 123 duplicate grid-cell year observations that were excluded.7This means that a disaster that hit five different countries is coded as five different disasters.

36 CHAPTER 4. RESEARCH DESIGN
events from the disaggregated analysis.8 It shows the number of casualties, together with the
grid-cell identifier from the PRIO-GRID, and the geografical coordinates that identifies this
cell. More details concerning the dependent variable are addressed in section 4.10 Summary
statistics.
Table 4.5: Sample of natural disaster events
Grid-cell id. Latitude Lonigtude State Year Disaster type Number killed
116124 -78.25 -9.25 Peru 1983 Earthquake 10186259 69.25 39.2 Tajikistan 2007 Flood 1136290 -75.25 4.75 Colombia 2007 Flood 24217415 167.25 60.7 Soviet Union 1991 Earthquake 097474 -43.25 -22.0 Brazil 2008 Flood 9152807 -96.75 16.2 Mexico 1999 Earthquake 31145233 76.25 10.7 India 2006 Flood 32137365 102.25 5.25 Malaysia 2006 Flood 097472 -44.25 -22.0 Brazil 2007 Flood 59177021 130.25 32.7 Japan 1984 Earthquake 0189091 45.25 41.2 Armenia 1997 Earthquake 0199839 19.25 48.7 Slovakia 2006 Flood 1171854 66.75 29.2 Pakistan 1992 Earthquake 4133038 98.75 2.25 Indonesia 1987 Earthquake 2169740 89.75 27.7 India 2008 Flood 14285935 -52.75 -30.0 Brazil 2007 Flood 4186203 41.25 39.2 Turkey 2005 Earthquake 0194058 8.75 44.75 Italy 2003 Earthquake 0151648 43.75 15.25 Yemen 2007 Flood 7190525 42.25 42.25 Soviet Union 1991 Earthquake 270125208 143.75 -3.25 Papua New Guinea 1990 Earthquake 0156751 75.25 18.75 India 2006 Flood 41130216 127.75 0.25 Indonesia 1998 Earthquake 33204677 -81.75 52.25 Canada 2008 Flood 0135926 102.75 4.25 Malaysia 2006 Flood 0183313 36.25 37.25 Turkey 2001 Earthquake 0185400 -0.25 38.75 Spain 2007 Flood 3146771 125.25 11.7 Philippines 2008 Flood 63129474 116.75 -0.25 Indonesia 2007 Flood 4150362 120.75 14.2 Philippines 1992 Volcano 0
Source: EM-DAT (2012); Tollefsen, Strand and Buhaug (2012b, PRIO-GRID)
4.7 Independent variables
4.7.1 Political exclusion
The independent variable on political exclusion is taken from the ETH Ethnic Power Relations
dataset (EPR-ETH),9 (Cederman, Wimmer and Min, 2010) and the geo-coded version, the
8It was done using the ‘sample’ command in Stata 12.9Eldgenossische Technische Hogschule Zurich.

4.7. INDEPENDENT VARIABLES 37
GeoEPR dataset (Wucherpfennig, Weidmann, Girardin, Cederman and Wimmer, 2011).
The GeoEPR dataset is a geo-referenced extension of the EPR-ETH dataset, which identifies
all politically relevant ethnic groups around the world and measures how far access to state
power differs among ethnic groups from 1946 to 2005 (Min, Cederman and Wimmer, 2010).
The country-years are extended to 2009 in the EPR-ETH 2.0 dataset. The data was collected
using online expert survey that included all relevant ethnic groups in all 156 sovereign states
with a population of at least one million, and a surface area of at least 50,000 square kilometers
as of 2009 (Wucherpfennig et al., 2011, 426).
The EPR-ETH dataset defines ethnicity as any subjectively experienced sense of commonal-
ity based on a belief in common ancestry and shared culture.10 Different markers may be used
to indicate such shared commonality: language, phenotypical features etc. An ethnic group is
politically relevant if at least one significant political actor claims to represent its interest in the
national political arena, or if members are systematically discriminated against in public poli-
tics. This can be some sort of political organization, but not necessarily a party. Discrimination
is defined as political exclusion directly targeting an ethnic community (Cederman, Wimmer
and Min, 2010, 98-99). The strength with a dynamic dataset, such as the EPR/GeoEPR, is
that it provides separate coding for sub-periods and changes in political status.
Political status is coded in relation to executive power only, which depends on a given coun-
try’s power constellations. Executive power amounts to control over the presidency, the cabinet,
and senior posts in the administration, including the army. Groups were categorized according
to whether (1) those who represented a group’s interest held full control over the executive
branch with no meaningful participation, whether (2) they divided power with members of
other groups, or (3) if they where excluded from decision-making in central power (Cederman,
Wimmer and Min, 2010, 99-100). Within these three categories eight different levels of political
status where coded.
Absolute power
The categories that represent the highest level of political status were coded as monopoly power,
or dominance. Monopoly power means that elite members hold monopoly power in the exec-
utive, excluding other ethnic groups. Dominance means that elite members of the group hold
dominant power in the executive but that there is some limited inclusion of other groups (Ce-
derman, Wimmer and Min, 2010, 100).
Power-sharing
In power-sharing regimes relevant ethnic groups can be defined as senior partner or junior
partner. These categories represent formal or informal power-sharing, depending on the extent
of this power-sharing (Cederman, Wimmer and Min, 2010, 100).
10Drawn from Weber (1978, 385-398).

38 CHAPTER 4. RESEARCH DESIGN
Excluded groups
The remaining groups are defined as excluded from state power. The two bottom groups
are categorized as powerless or discriminated. The former case refers to elite members that
have no power either at central or regional level, and the latter to members that are subject
to formal or informal discrimination, with the intention to exclude them from central power
(Cederman, Wimmer and Min, 2010, 100-101). Since my theoretical predictions mostly refer to
the two bottom groups, powerless and discriminated, I have coded only these as being politically
excluded. However, in the original data, there are also two hybrid cases, regional autonomy and
separatist autonomy. The former refers to members that have no access to state power, but that
have some influence at the regional level. The latter is a related case, but refers to a distinct
category where members have excluded themselves from central office (Cederman, Wimmer
and Min, 2010, 100-101). The reasons for not including them in the ‘excluded groups’ is that
they suffer some local level autonomy, and I want to single out the groups that most likely are
subjected to underprovisions of goods.
In the country level analysis, political exclusion measures the proportion of politically ex-
cluded groups in a country-year event. In the grid-cell analysis, political exclusion is coded as a
dummy variable, where 0 indicates that a grid-cell is not inhabited by any politically excluded
groups, and 1 if there is at least one excluded group in a grid-cell. Groups that are coded as
being excluded are either ‘powerless’ or ‘discriminated’.
4.7.2 Institutional variables
The institutional variables are collected from two different data sources. The variables con-
cerning the electoral and the executive dimension are collected from the Database of Political
Institutions (DPI) (Beck et al., 2001, World Bank),11 and the data on the centralization di-
mension is collected from the Schjølset (2008) dataset. Even though the DPI data provides
indicators of the centralized dimension, I chose to use the Schjølset (2008) dataset as she op-
erates with more aggregate categories, which is more relevant for my project. I remind the
reader that if autocracies are registered as for example having parliamentary institutions, or
proportional elections, they enter the analysis. A further discussion on the problematic side of
this, and how I deal with it, is given in section 4.7.3.
Executive dimension
Data on the executive dimension stem from the DPI dataset (Beck et al., 2001). It provides in-
formation on how executive institutions are organized covering all disaster years in my dataset.
The indicator has initially four categories, one for non-fitting regimes, such as military regimes,
regimes in transition, and regimes with no central state. As these categories are not relevant
for my hypotheses, they were excluded from the analysis. The three relevant categories cover
presidential institutions, parliamentary institutions, and a third hybrid category, identifying
11The DPI dataset is constructed based on two sources: Political Handbook of the World and Europa WorldYearbook).

4.7. INDEPENDENT VARIABLES 39
assembly-elected presidents. As I want to single out pure presidential institutions, the main
analysis deals with assembly-elected presidents as belonging to parliamentary institutions. Of
the 5,285 ‘parl-pres’ event-years, 380 are hybrids.12 However, to validate my findings I esti-
mate all relevant models when assembly-elected presidents are coded in the other category,
e.i. presidential (see table A.2 in appendix). The variable ends up as a dichotomous indicator
labeled Presidential, where 0 indicates parliamentary institutions, and 1 indicates presidential
institutions.
Electoral dimension
The DPI dataset (Beck et al., 2001) also provide the data on electoral rules. The advantage
with the DPI datset is not only that it provide the most extensive time-series, covering all
the disaster years, it also provide dichotomous coding that separate between majoritarian and
proportional electoral rules. The advantage with not having hybrid categories included as a
separate choice is that the coders themselves are the ones that evaluate which category that
is the most fitting. This is less arbitrary than if I should have done it myself. Nevertheless,
hybrid cases are identified as having both majoritarian and proportional characteristics. Of
the 5,285 disaster years that enter the country level analysis, 1,897 event-year institutions are
registered as having both proportional and majoritarian institutions. In the main analysis I have
chosen to estimate the effects of majoritarian institutions when the hybrid cases are coded as
belonging to proportional elections. The reason is that I explicitly want to distinguish the pure
majoritarian institutions from other types of institutions. Secondly, a more pragmatic reason is
that since there is an overweight of events in countries with majoritarian institutions, operating
with hybrid categories as proportional makes the data a little more balanced. However, because
there are many hybrid institutions, this may affect the results considerably. To validate my
findings, all relevant models are estimated when hybrid institutions are coded differently, that
is as belong to majoritarian institutions (see A.2 in appendix). All countries that are coded
as not having electoral systems are excluded from the analysis. This include military regimes,
regimes in transition, and regimes with no central state. The indicator used in the analysis is
coded as a dichotomy, labeled Majoritarian, where 0 indicates proportional institutions, and 1
indicates majoritarian institutions.
Centralization dimension
Data on the centralization of the state is collected from the Schjølset (2008) dataset. Countries
are coded as having federal, central or hybrid institutions. To be consistent with my aforemen-
tioned logic, the main analysis treats hybrid institutions as belonging to centralized institutions.
Again, to validate my findings I estimate all regressions where hybrid institutions are coded as
belonging to federal institutions (A.2 in appendix A). The indicator is coded as a dichotomy,
where 0 indicates centralized governments, and 1 federal governments. What should explicitly
be noted is that the Schjølset dataset only provides data up to 2002. As institutional change is
12For a nice discussion on hybrid cases and coding see Persson and Tabellini (2003, 97-98).

40 CHAPTER 4. RESEARCH DESIGN
uncommon, and changes in the level centralization are even more rare, I have extrapolated the
values up to 2008. According to the DPI data, there was no constitutional changes that would
have affected this indicator between 2004 and 2006. Although this does not cover the complete
time period which have been extrapolated, it shows that it is highly unlikely that there were
many changes in the period 2002 to 2008, and even less likely that any of these changes would
affect the results. The are no institutional changes in the observations that enters the disag-
gregated dataset. In the country level data there are four relevant changes.13 Regimes that
did not fit to either of the categories were excluded from the analysis. This included military
regimes, regimes in transition and regimes with no central state.14 Of the 5,285 disaster years
that enter the regression analysis, 3,348 countries are coded as having centralized government
institutions. The variable is coded as a dichotomy, labeled Federal, where 0 indicate centralized
government, and 1 indicate federal/decentralized institutions.
4.7.3 Operationalizing control variables
In order to control for spurious relationships I include control variables. I have selected controls
that the literature on natural disasters consistently has found to pose significant effect on natural
disaster magnitude. These variables should cover the three basic categories that determine
the magnitude of natural disasters: vulnerability; exposure; and the natural event. As my
model does not incorporate many important factors concerning the natural event itself, such
as earthquake’s richter scale, or the Saffir-Simpson hurricane scale, potential findings should be
put through more extensive empirical testing. However, if my hypotheses are falsified, which
should be the goal according to the Popperian tradition,15 then more extensive empirical models
would most likely not provide us with any different conclusions.
Vulnerability
The major determinant of natural disaster severity is level of development. To control for this
I include a measure of (log) Gross Domestic Product (GDP) per capita, and (log) Gross Cell
Product (GCP) per capita. GDP is collected from World Development Indicators provided by
the World Bank.16. In order to calculate the per capita GDP I divided the GDP with total
population in each year. As I do not believe that GDP per capita has linear effects, the variable
is transformed to its natural logarithm. The variable is labeled GDP per capita (log).
13Belgium went from being coded as semi-federal in 1992 to federal in 1993; Ethiopia went through a transitionfaze in the period 1991-1994 and was coded as unitary in 1990 and federal in 1995; South Africa also went in atransition faze in the period 1992-1993, and was coded as unitary in 1991 and hybrid in 1994; Sudan went frombeing coded as hybrid in 1997 to federal 1998.
14These are coded according to the Polity IV data (Marshall and Jagger, 2002).15See Popper (1964).16The exact indicator is the ny.gdp.mktp.pp.kd PPP GDP is gross domestic product converted to international
dollars using purchasing power parity rates. An international dollar has the same purchasing power over GDPas the U.S. dollar has in the United States. GDP is the sum of gross value added by all resident producersin the economy plus any product taxes and minus any subsidies not included in the value of the products. Itis calculated without making deductions for depreciation of fabricated assets or for depletion and degradationof natural resources. Data are in constant 2005 international dollars (World Bank International ComparisonProgram database).

4.7. INDEPENDENT VARIABLES 41
In the disaggregated model I include both country-level (log) GDP per capita and Gross Cell
Product (GCP) per capita. The reason for including both grid-cell and country level data is
twofold. First, countries allocate resources from the country level to the local level, making areas
more robust. This is something I want to capture in the model. Secondly, the nature of the geo-
coded disaster data is such that a single disaster event can only be attributed to one particular
grid-cell. However, natural disasters are not bound to the borders of grid-cells, and often affect
large areas. This is something that my model does not capture.17 To account for this, I include
the country level GDP in order to capture some of the aggregate level of development. The
GCP is the same as the gross domestic products, but at the grid cell level (Nordhaus, Azam,
Corderi, Hood, Victor, Mohammed, Miltner and Weiss, N.d.). It is calculated by taking the
population in each grid cell and multiplied by the per capita GCP in each cell. It is worth
noting that the per capita GDP in each cell is estimated using a mathematical algorithm. This
is done differently for each country depending on the level of available data. These data are
provided by the G-Econ database but ready to use in the PRIO-GRID dataset.18 The variable
is transformed to its natural logarithm. As the G-Econ data are in the format of 1 degree times
1 degree long-lat scale, they are not completely overlapping with the 0.5 times 0.5 PRIO-GRID
polygons. A reason for more concern is that GCP is provided only for the year 1990. This
means that my empirical model does not capture local development over time. However, as
G-Econ is the only extensive data that covers every grid cell in the world, it provides a second
best solution. Further information on GCP data and methods can be found at Nordhaus (2006);
Tollefsen, Strand and Buhaug (2012b). The variable is labeled GCP per capita (log).
In order to control for for good governance I use the Polity IV index (Marshall and Jagger,
2002). The measure combines an autocracy and a democracy scale that reach from 0 to 10,
which aggregates to a complete autocracy-democracy scale reaching from -10 to 10, where 10
indicates full democracy. The variable is labeled Polity IV.
As the three hypothesized institutions in different degree relate to democratic governance,
I choose to construct a interaction term between Polity IV and each institution. Because I
want to include all countries that are coded along the three institutional dimensions, this goes
at the expense of a meaningful interpretation of institutions’ effect across regimes. Can we
expect that the effect of presidential democracies is the same as for presidential autocracies?
This question is similarly relevant for the electoral dimension. However, I argue that there are
theoretically different mechanisms separating presidential and parliamentary institutions, even
among the autocracies. Nevertheless, to control for potential absurdities, an interaction term
between institutions and the Polity IV scale is constructed. The terms are labeled Pres*Polity,
Maj*Polity, and Fed*Polity.
17This is however not something that cannot be modeled. It is possible to geographically model each disasterimpact varying how large areas it affected. As this is particularly time consuming, and methodological difficult,it is far beyond the task of this project.
18The exact variable is labeled gcppc90 in the PRIO-GRID.

42 CHAPTER 4. RESEARCH DESIGN
Exposure
Following Stromberg (2007) I have included regional dummy variables to control for regional
characteristics and natural hazard risk.
In order to control for population exposure, a measure of population is included. In the
country level analysis this measures the total population in a country in a given year.19 The
variable is transformed to its natural logarithm. In the disaggregated analysis I also include a
measure of the total population in each grid cell. Grid population is taken from the Gridded
Population of the World (CIESIN, 2005), however it is ready to use in the PRIO-GRID dataset.
The variable is transformed to its natural logarithm. Since the data only provides information
on population in the years 1990, 1995, 2000 and 2005, the values were interpolated in between
these years, and extrapolated back to 1980; and up to 2008. As these are the only available
data, this estimation procedure must be understood as a imperfect but acceptable solution. A
obvious problem with this estimation procedure is that it does not take into account the fact
that a particular grid cell can have suffered many casualties in a natural disaster, which would
have affected the number of people living there. This should be kept in mind when analyzing the
data. However, the variable only functions as a control, meaning that the parameter estimate
itself is not particularly important.
In the disaggregated model, I include both country level and grid-cell population. There are
several reasons for this. First, grid-cell population obviously capture the local conditions more
precisely. However, because of the nature of the data, the grid-cell data may have its limitations.
One reason is that population on grid level only include that particular cell. Because natural
disasters may not be limited to single cells in the real world, this might lead to absurd episodes.
For example, a earthquake hitting Peru in 2007 is registered as causing 593 casualties. However,
as it unfolded on a large area,20 the grid-cell population data, showing that only 7 people lived
in that particular area, captures the risk on human lives poorly. This example is an particular
outlier, and the only observation in my data that actually had more casualties than inhabitants.
Nevertheless, the country level measure tries to account for some of these potential fallacies.
The two population indicators are labeled, Grid population (log) and Population (log).
I also included a variable measuring disaster ratio. This variable was suggested by Anbarci,
Escaleras and Register (2005, 2007), and measures the ratio between the number of events in a
country and the total period, that is, the years between 1980 and 2008. If a country suffered 200
disaster is the 28 years, I simply divide 200 with 28. The logic is that societies that frequently
are exposed to natural disasters learn more past experiences and become more robust. The
variables is supposed to capture this logic. The variable is labeled Disaster ratio.
Natural event
To control for factors relating to the natural hazard, I have included a dummy variable indicating
which kind of natural hazard that triggered the natural disaster. I section 4.3 I showed that
19The specific indicator is labeled sp.pop.totl (World Bank)20The areas of: Pisco, Ica, Chincha, Canete, Lima, Paracas, San Vicente de Canete.

4.8. STATISTICAL MODEL 43
the number of casualties in natural disasters vary considerably. Earthquakes are by far the
most deadly, while floods, constituting 40 percent of the total reported events, only contribute
to around 15 percent of the total casualties. However, this should provide enough evidence of
including this control variable. This project is not intended to predict the number of casualties,
but to assess how a political and institutional dimension affect the outcome of natural disasters.
Thus, the vast amount of natural and environmental factors contributing to the outcome in a
natural disaster is not as theoretically relevant for this project. However, there are considerable
options when estimating regression models that can correct for some of the clear uncertainties
and violations in my models. I address these model specifications in section 4.8.2.
4.7.4 Regression models
In order to determine the relationship between institutions, political exclusion, and the death
tolls in natural disasters, the following regression models are derived. For the country level
analysis:
Y (Numberkilled) = β0 + β1(Exclusion) + β2(Institution) + β3(Excl × Insitution)
+β4(Polity × Pres) + β5(PolityIV ) + β6(Disasterratio) + β7Ln(GDPpc)
+β8Ln(Population) + β9(Region) + β10(Disastertype) + ε (4.1)
For the disaggregated analysis:
Y (Numberkilled) = β0 + β1(Exclusion) + β2(Institutions) + β3(Excl × Insitution)
+β4(Polity × Pres) + β5(PolityIV ) + β6(Disasterratio) + β7Ln(GDPpc)
+β8Ln(GCPpc) + β9Ln(Population) + β10Ln(Cellpopulation)
β11(Region) + β12(Disastertype) + ε (4.2)
4.8 Statistical model
To evaluate the relationship between the explanandum and the explanans I employ statistical
regression models. As the dependent variable is in the form of counts, I estimate count models,
and more specifically, negative binomial regression models.
4.8.1 The negative binomial regression model
When observations are in the form of counts, the linearity assumption in regular linear regression
models, as the ordinary least square (OLS) model, can lead to inefficient, inconsistent and
biased estimates (Long and Freese, 2006, 349). Thus, it is safer and more relevant to estimate
models that account for the specific count distribution, that is, the poisson distribution. The

44 CHAPTER 4. RESEARCH DESIGN
Figure 4.4: Distribution of the number killed, country level analysis.
most intuitive way of understanding count outcomes is that we assume that the likelihood of
a given outcome decreases as the number rises. Thus, the distribution is skewed to the right,
with higher probabilities of one’s and two’s, whereas the probability of the proceeding values
decrease. Figure 4.4 shows the distribution of the dependent variable – number killed. It clearly
would have broken the normal distribution assumption in the OLS-model, and shows how the
observed values of the dependent variable are highly skewed toward low counts. The values from
0 to 30 of the dependent variable constitute 75 percent of the total number of cases (country
level model).
However, the normal poisson regression model (PRM) rarely fits due to overdispersion (Long
and Freese, 2006, 372). This means that there is discrepancy between the observed and the pre-
dicted values, and that the estimation procedure underpredicts zero values. Figure 4.4 shows
that zero counts make up most of the data (28 percent), indicating that the basic poisson model
would lead to underprediction. The negative binomial regression model (NBRM) accounts for
this by adding a parameter, α, that reflects unobserved heterogeneity among the observations.
The negative binomial distribution is:
Pr(y | x) = Γ(y+α−1)y!Γ(a−1)
( α−1
a−1+µ)α
−1( µα−1+µ
)y
where Γ() is a gamma function.
We can test for overdispersion by comparing the poisson model and the negative binomial
model. If the assumptions are correct the PRM produces large z-values, and spuriously small
p-values (Long and Freese, 2006, 372). The comparison shows that our initial assumption is
correct, and the poisson model produced large z-values and small p-values (see A.1 in appendix).

4.8. STATISTICAL MODEL 45
Figure 4.5: Observed vs. predicted counts (PRM), poisson model and negative binomial model(NBRM). Note: positive deviations shows underprediction.
We can further check this by testing for overdispersion with a Likelihood-ratio (LR) test. I
estimated the baseline control model with the PRM and the NBRM, and there is significant
evidence of overdispersion (G2 = 7.8e + 06, p>.01). Figure 4.5 shows the difference between
the observed and the predicted counts for the poisson model and the negative binomial model.
The figure clearly shows that the poisson underpredicts zero values (positive deviations indicate
underpredictions), and that the negative binomial regression model is a better fit. Thus, the
negative binomial is preferred.
4.8.2 Model specifications
In order to reduce some of the problems concerning violations to the assumptions in the model,
and the fact that not all observations are independent from each other, all models are estimated
with robust standard errors,21 and clustered by country. The robust option is a procedure
that corrects for violations to the assumptions in the model, by producing more accurate and
conservative standard errors (Long and Freese, 2006, 86). The clustering option tries to account
for the assumption that all observations are independent from each other. This means that the
effect of one disaster is not driven by the effect of another disaster. However, as geographic and
other environmental factors obviously are not independent from each other, I cluster all events
by country. To account for differences in exposure over time and place I use the exposure option
in the negative binomial regression model.22
21Also known as the sandwich standard errors.22This is done using the exposure option in the nbreg (negative binomial regression) command. The formal
equation is: µiti = {exp(β0 + β1x1 + β2x2 + ...)}× ti, where ti is the amount of time that observation i is at risk.If the rate (number of events over one time period) of that observation is µi, then we expect that tiµi to be theexpected count over a period of length ti.

46 CHAPTER 4. RESEARCH DESIGN
4.9 Missing data
In this section I briefly address some of the concerns relating to missing data. Both in the
country level and disaggregated analysis I estimate my regressions including only observations
that do not have missing values on any of the variables. The reason is to exclude the possibility
that differences in the estimation parameters is caused by different samples. However, as there
are quite a number of observations that are not complete, and that missing data most likely is
not at random, this may affect the outcome of the models.
In the country level analysis, 2,139 of the 7,372 observations where excluded from the analysis
due to at least on missing value. The variable that contributes to the most missing values is
electoral system. Asia constituted 60 percent of the excluded data, while only having 41 percent
of the total events. The four countries that had the most missing was Afghanistan, China, Iran
and Vietnam. They constituted 40 percent of the missing data. The mean number killed was
228 in the missing data, almost 50 more than in the sample that enters the regressions. The
mean Polity IV score was -4 in the excluded observations, 8 units less than the average in the
analyzed sample.
In the disaggregated analysis two selection mechanisms are at play. I have already addressed
some of the concerns relating to the differences between the country level analysis and the dis-
aggregated analysis that originates from the lack of geo-coding. Here, I address the missing
observations resulting from at least one missing on either of the other variables. Again, the
variable that contributes to the most missing values is electoral system. The countries that had
the most missing were Iran, Afghanistan, China, Vietnam, Indonesia, and Vanuatu.23 These
counties constituted 61 percent of the missing data, while China constituted 30 percent of the
missing data by it own. The rest of the missing datapoints was more evenly distributed around
the world. Generally also small Caribbean islands had at least one missing data point.24 The
mean killed was 601 for the excluded observations, considerably higher than in the regressed
sample. 5 percent of the observations that was excluded from the regressions had more than
1000 killed, compared to 2.5 percent in the regressed sample. The mean Polity IV score was -3,
substantially lower than in the sample that enters the regressions. There was no particular dis-
crepancies between the mean GDP per capita, which was 3294 US dollar (log=8.1). Concerning
my hypotheses, the executive dimension was fairly evenly distributed among the excluded ob-
servations. The same accounted for the majoritarian dimension. However, for the centralization
dimension, 91 percent of the excluded observations where centralized governments, compared
to 71 percent in the regressed sample. Asia constituted 73 percent of the missing data, while
only making up 41 percent of the regressed sample.
23Iran had 51 missing, Afghanistan 27 missing, China 112 missing, Vietnam 14 missing, Indonesia 16 missing,Vanuatu 9 missing.
24Micronesia, Polynesia, Caribbean, Melanesia, Bahamas, Barbados, Bermuda, Fiji, Guam, Haiti

4.10. SUMMARY STATISTICS 47
4.9.1 Summary
There are substantial amounts of missing values in my data that may cause discrepancies be-
tween the results in the estimated sample and the universe. To validate my findings I therefore
estimate all relevant models on a sample including observations that have missing on at least
one of the variables. These results are shown in table A.3 appendix. Still, I am not able to
include all observations because of the listwise deletion in the regression command removes
incomplete observations. One possible solution to account for missing data is to impute data.
However, I do not judge it as appropriate in this analysis as many of the missing values relates
to the lack of information on institutions. Nevertheless, the problems relating to missing data
should moderate how I generalize my results to the universe. It is however not a problem for
running the regressions, as I have enough data to at least say something about the relationship
between my variables. Thus, I conclude that it is acceptable, but nevertheless recommend the
reader to keep such issues in mind.
4.10 Summary statistics
Table 4.6: Summary statistics, country level analysis.
Variable Number Mean Median Standard dev. Min Max
Number killed 6580 179.703 7 3208.9 0 165708Excluded size 6580 .112 .0429 .159 0 .915Parl-Pres 6424 .517 1 .499 0 1PR-Maj 5254 .375 0 .484 0 1Cental-Federal 6530 .298 0 .457 0 1Polity IV 6580 4.211 8 6.558 -10 10Disaster ratio 6580 6.979 3.821 7.191 0 21.357Population (log) 6580 17.854 17.913 1.815 12.149 21.005GDP per capita (log) 6580 8.577 8.614 1.266 5.630 11.056
Source: EM-DAT, PRIO-GRID, DPI, Schjølset dataset, WDI, Polity IV project
Table 4.6 shows the summary statistics for the main variables that enter the country level
analysis. Number killed is the count of number killed in a natural disaster event. Excluded size
is the proportion of politically excluded groups in a country-year. The institutional variables are
coded as dichotomous variables, 1 indicating presidential, majoritarian, and federal institutions.
Disaster ratio is the number of events in a single country in the time series, divided by the
number of years in the time series (i.e. 28 years). Polity IV is a democracy scale from -10
to 10, where 10 indicates full democracy (Marshall and Jagger, 2002). Population (log) is the
natural logarithm of the total population in a country year. GDP per capita (log) in the natural
logarithm of GDP per capita. Please note that since I have excluded all observations that had
at least one missing data point, many autocracies do not enter the baseline model, which might

48 CHAPTER 4. RESEARCH DESIGN
Table 4.7: Summery statistics, disaggregated analysis.
Variables Number Median Mean Standard dev. Min Max
Number killed 730 255.163 4 2948.4 0 73338Political exclusion 730 .349 0 .477 0 1Parl-Pres 730 .560 1 .496 0 1PR-Maj 730 .282 0 .450 0 1Central-Federal 730 .290 0 .454 0 1Population (log) 730 17.693 17.926 1.579 12.506 20.854Cell population (log) 730 11.676 12.007 2.142 0 16.655GDP per capita (log) 730 8.661 8.680 1.110 5.849 10.673GCP per capita (log) 730 8.307 8.228 1.185 5.774 11.058Polity IV 730 5.819 8 4.885 -9 10Disaster ratio 730 5.312 3.142 5.210 .071 21.357
Source: EM-DAT, PRIO-GRID, DPI, Schjølset dataset, WDI, Polity IV project
lead me to draw different conclusions that would otherwise appear with full data coverage.25
Table 4.7 shows the summary statistics from the disaggregated dataset. The mean number
killed is higher than in the county level approach. This is due to the fact that earthquakes
make up most of the data. Political exclusion is now a dichotomous variable, 1 indicating
that a particular grid cell in inhabited by at least one excluded group, and zero if not. The
institutional variables are still dichotomies, where 1 identifies presidential, majoritarian, and
federal institutions.26 The mean score on the Polity IV index has risen to 5.8, an increase with
1.6, indicating that there are a higher proportion of democracies in this sample. This increases
the suspicion that democracies are overrepresented.
4.11 Multicollinearity
Multicollinearity can pose a problem if one of the independent variables is highly correlated
with another independent variable. When this is the case, it is difficult to identify the indi-
vidual effects of each independent variable on the dependent variable, as the effects of each
appears simultaneously (Skog, 2004, 286-288). This may result in inflated standard errors and
correspondingly not significant relationships. Since each of my models include two interaction
terms, this may create multicollinearty, and difficulties in distangeling the effects from one an-
other. One way to check for high collinearity between the variables is to calculate the Variance
Inflation Factor (VIF). The conventional procedure is to be particularly concerned with VIF
scores above 10.
The collinearity diagnostics showed that multicollinearity is not a substantial problem, with
the highest VIF score of 5.9. Table 4.8 shows the bivariate correlations between the variables
that are included in the interaction terms, together with each interaction term, for the disaggre-
25The mean Polity IV score is 3 decimals lower if all data points where included in the regressions.26Reference category is parliamentary, proportional and central. Hybrid institutions are still coded as belonging
to the reference category.

4.11. MULTICOLLINEARITY 49
Table 4.8: Cross-correlation table of the hypothesized variables, and the interaction terms.Disaggregated analysis.
Variables Exclusion Presidential Excl*Pres Polity*Pres Polity IV
Exclusion 1.0000Presidential 0.1281 1.0000Excl*Pres 0.7376 0.4787 1.0000Polity*Pres 0.0362 0.6162 0.2463 1.0000Polity IV -0.0658 -0.0746 -0.0799 0.5165 1.0000
Variables Exclusion Majoritarian Excl*Maj Polity*Maj Polity IV
Exclusion 1.0000Majoritarian 0.1152 1.0000Excl*Maj 0.5118 0.5981 1.0000Polity*Maj 0.1290 0.5767 0.4357 1.0000Polity IV -0.0658 -0.1700 -0.0365 0.3815 1.0000
Variables Exclusion Federal Excl*Fed Polity*Fed Polity IV
Exclusion 1.0000Federal 0.1516 1.0000Excl*Fed 0.5374 0.6155 1.0000Polity*Fed 0.1026 0.8153 0.4726 1.0000Polity IV -0.0658 0.1232 0.0533 0.3589 1.0000
Source: EM-DAT (2012), DPI, Polity IV Project, EPR-ETH, Schjølset (2008)
gated model. The only two episodes of variables that have a higher correlation than 0.7 are in
bolded text. This causes a 40 increase in the standard error for the correlation between Exclu-
sion and Excl*Pres, and 60 percent increase in the standard errors for the correlation between
Federal and Polity*Fed (Skog, 2004, 288). In terms of the control variables, the correlation
between GDP per capita and GCP per capita in the disaggregated analysis were the only once
that showed a particular high correlation (0.856).
For the country level model the VIF test shows no score higher than 5. The correlation
matrix showed that there were two cases where the correlations exceeded 0.7. The correlation
between Exclusion size and Excl*Pres was 0.85, and between Federal and Polity*Fed was 0.86.
This increases the standard error with approximately 67 percent (Skog, 2004, 288). These
variables should be interpreted with care. The correlation matrix for the country level analysis
is reported in A.4 the appendix.

50 CHAPTER 4. RESEARCH DESIGN

Chapter 5
Analysis
5.1 Country level analysis
The introductory logic in this thesis was that democratic institutions are associated with lower
death tolls in natural catastrophes. Although this relationship was one of the basic motivations
behind this thesis, and not a necessary condition for it, the analysis will address this claim.
There are two reasons for this. First, the latest empirical study that addresses this relationship
(Stromberg, 2007, i.e) has questioned its empirical validity. Secondly, since the ‘democracy-
disaster’ relationship serves as a motivational aspect in this project, and a democracy indicator
(Polity IV) enters the baseline control model, assessing this relationship also provides a ped-
agogical introduction to the main analysis. After presenting some simple descriptive scores
that show how my hypothesized variables relate to natural disaster casualties, I run regression
models as the main analytical tool.1
Table 5.1: Casualties by regime type
Polity Mean Median Standard deviation N
Autocracies 221.3 11 3599.8 2743Democracies 173.4 4 3407.6 4478Total 191.6 6 3481.7 7221
Source: EM-DAT 1980-2008, Cheibub, Gandhi and Vreeland (2009)
Table 5.1 shows the mean and median number killed in autocratic and democratic regimes.2
The reported number killed show a substantial difference between the polities. Democratic
regimes suffer on average around 48 fewer casualties in natural disasters. However, what is hid-
den in simple summary statistics is other important factors that may explain why democracies
have fewer casualties.
1As the descriptive statistics only functions as preliminary analyses I chose to incorporate all observations.This means that the total number of observations will vary between the description tables, i.e. 5.1, 5.2 and 5.3.
2Polities are defined according to Cheibub, Gandhi and Vreeland (2009) dichotomous classification scheme;coding countries as either autocratic or democratic. This classification scheme was introduced by Alvarez,Cheibub, Limongi and Przeworski (1996) and Przeworski et al. (2000). For more information on the theoreticaland empirical rationale behind, I refer to the abovementioned authors.
51

52 CHAPTER 5. ANALYSIS
Table 5.2 shows the mean and median number killed in a natural disaster for countries
with more and less than median size of politically excluded groups (0.027 is the median size of
political exclusion in disaster years). The median value is chosen as the least of many arbitrary
points of reference. Even though I cannot say that there is a significant relationship between
political exclusion and the number of casualties in a natural disaster, the summary statistics
point to a substantial difference. Countries with more than 2.7 percent politically excluded
groups suffer on average 24 more casualties, compared to countries below this threshold. The
median value doubles from 4 to 8, moving from the low-exclusion countries to the high-exclusion
countries.
Table 5.2: Casualties by size of excluded groups
Proportion of political exclusion Mean Median Standard deviation N
<0.027 177 4 3271 3680>0.027 201 8 3616 3692Total 189 6 3448 7372
Source: EM-DAT database 1980-2008, GeoEPR data.
Table 5.3 shows the mean number of casualties in a natural disaster for specific institutional
characteristics. The overall view is not as clear as for political exclusion. The largest difference is
for the executive dimension. Presidential regimes suffer on average 205 casualties per disaster,
while parliamentary regimes suffer 184 casualties. For the electoral and the centralization
dimension, the summary statistics does not correspond well to my predictions. PR-systems
suffer on average 174 casualties, 20 casualties more than majoritarian systems. Federal systems
have on average 155 casualties, 65 fewer than centralized systems. In all, these preliminary
statistics give my propositions limited support. Nonetheless, it provides more confidence relating
to political exclusion and presidentialism than for the electoral and centralized dimension.
Table 5.3: Casualties by institutional characteristics
Institutions Mean Standard Deviation N
Parliamentary 184.0 3325.3 3454Presidential 204.5 3713.1 3583
Proportional 174.3 3095.3 3383Majoritarian 152.3 3377.0 2209
Central 220.2 4068.1 4811Federal 155.3 1972.8 2050
Source: EM-DAT database 1980-2008, Schjølset (2008); Beck et al. (2001).

5.1. COUNTRY LEVEL ANALYSIS 53
5.1.1 Regressions
I begin by presenting the baseline regression model that tests the empirical relationship between
democracy and natural disaster casualties. As this assessment is foremost a clarification of the
previous literature, I compare my model with two widely cited studies that I have replicated
(e.i. Kahn, 2005; Stromberg, 2007). These studies are chosen not only for having opposing
conclusions, but because they represent an empirical test that is close to mine. Kahn (2005,
283) concluded that democracy is related to fewer casualties, while Stromberg (2007, 209) did
not find this relationship. The reason for comparing my model with the replicated models is to
limit the possibility that conflicting conclusions origin from different samples.3
Table 5.4 shows four regression models, each a different test of the ‘democracy–disaster’ re-
lationship. The results indicate that at least as a general statement, democracy is not robustly
related to fewer casualties. Model 1 and 3 are estimated with a negative binomial regression.
The dependent variable in model 1 is the number killed in a natural disaster event, and the
dependent variable in model 3 is annual killed. Model 1 is the baseline model for my later
regressions. In model 2 and model 4 I have replicated Stromberg (2007) and Kahn (2005),
respectively, with my extended time-series. Model 2 is estimated with an ordinary least square
(OLS) regression, where the dependent variable is the natural logarithm of the number killed.
Stromberg (2007) concluded in his empirical assessment that democracy is not related to dis-
aster casualties. I find support for this conclusion, both in the replication model, and in my
own model assessments (Model 2 and 1, respectively). Model 4 is a replication of the much
cited article by Kahn (2005), who concluded that democracies are related to decreased natural
disaster casualties. This model is estimated with a zero inflated negative binomial model.4 My
replication model does find the same relationship as Kahn (only .016 difference between the
parameters). However, the model is at best very sensitive to model adjustments. The only
specification that gave Polity IV a significant negative effect on the number of casualties was
when the dependent variable was operationalized as: annual death counts in a country year, and
when a control variable for ethnic fractionalization was included.5 First of all, operationalizing
the dependent variable as ‘annual deaths’ is to my understanding not a good idea, as it excludes
the ability to control for disaster type characteristics (earthquakes are different from wildfires as
shown in section 4.3). When empirically assessing natural events, such controls are essential in
limiting the danger for spurious relationships. Secondly, the model is highly sensitive for other
specifications. When ethnic fractionalization was excluded from the analysis, the significant
estimate for democracy vanishes. This also goes for model 3, which is estimated without any
3Please note that I do not replicate the models with their replication data, as I failed to get in contact with theothers themselves. I try to specify the models to look as close to theirs as possible, with my extended time-series.The estimates in the replicated models are almost identical to the estimates in the tables presented in Kahn(2005); Stromberg (2007). Thus, it is likely that they are a good representation.
4In short, what this model does is that it estimates the effects in two separate equations, one for zero countsand one for positive counts, implying that not all disasters should be expected to result in casualties (Long andFreese, 2006, 394-397).
5This result was consistent when estimating the exact zero inflated negative binomial on the period 1980-2002,which is the sample-period in Kahn (2005)

54 CHAPTER 5. ANALYSIS
Table 5.4: Democracy and disasters, country level analysis(1) (2) (3) (4)
Number killed Number killed (log) Annual killed Annual killed
mainPolity IV -0.00364 0.0138 -0.0547∗ -0.0518∗
(0.0125) (0.0131) (0.0259) (0.0257)
Disaster ratio -0.101∗∗∗
(0.0297)
Ethnic frac. -0.611 -0.605(0.492) (0.495)
Count of disasters in country-year 0.0645 0.0624(0.0607) (0.0596)
GDP per capita (log) -0.655∗∗∗ -0.343∗∗∗ -0.371∗ -0.338∗
(0.103) (0.0720) (0.166) (0.169)
Population (log) 0.490∗∗∗ 0.179∗∗∗ 0.699∗∗∗ 0.646∗∗∗
(0.0970) (0.0466) (0.0988) (0.111)
Constant -3.048 1.197 -9.999∗∗∗ -9.362∗∗∗
(1.715) (0.756) (2.172) (2.390)
lnalphaConstant 1.585∗∗∗ 1.461∗∗∗ 1.361∗∗∗
(0.0568) (0.0619) (0.0779)
inflateGDP per capita (log) 0.824
(0.769)
Population (log) -0.443∗∗
(0.143)
Count of disasters in country-year -18.19∗∗∗
(3.174)
Constant 16.08(9.313)
Observations 6580 6580 1762 1762ll -26885.5 -12745.1 -9181.4 -9155.1
Standard errors, clustered by country, in parentheses
Dependent variable in model 1: count of number killed. Dependent variable model 2: log number killed
Dependent variable in model 3 and 4: annual death counts.
Model 1 and 2 include disaster type and regional dummy variables. Model 3 and 4 have only regional dummy variables
All models account for time varying factors. The exposure option for 1,3 and 4. And decade dummies in model 2.
Model 2 is estimated with an OLS reg. Model 4 is a zero inflated negative binomial
Model 4 is inflated on GDP, Population, and Dem.
Model 3 is a negative binomal reg. without inflated variables.∗ p < 0.05, ∗∗ p < 0.01, ∗∗∗ p < 0.001

5.1. COUNTRY LEVEL ANALYSIS 55
inflated variables. Model 3 shows that an inflated model does not provide particular improve-
ments (only a small increase in the log likelihood). One can argue that the effect of democracy
is in fact dependent on ethnic fragmentation, however, Kahn (2005) fails to address such a con-
cern with explicit theoretical propositions. Ethnic fragmentation, indicated earlier, has been
proposed to be bad for public goods distribution (e.g. Alesina, Baqir and Easterly, 1999), and
therefore bad for disaster resilience (Cohen and Werker, 2008). However, the estimate itself is
not significant (and negative).6 It ends up looking like a miss-specified model, which fails to
explicitly address the theoretical and empirical relationship between the variables.7 Democracy
is either not significantly related to lower death tolls, and in cases it is – the results are highly
sensitive.
Figure 5.1: Democracy and disasters
02
46
810
Lin
ear
pre
dic
tion
-10 -9 -8 -7 -6 -5 -4 -3 -2 -1 0 1 2 3 4 5 6 7 8 9 10
Figure 5.1 shows the linear predicted relationship between the baseline model and the num-
ber killed. The box plots show that even though there are large variations within each category,
the results are not driven by particular outliers.8 The figure illustrates that there is no clear
6This finding supports my earlier argument that fractionalization as such, is not a good measure of the politicaldimension of disaster mitigation policies. Secondly, it supports my argument that country level indices do notcapture the essence of what it tries to explain. Thirdly, it falsifies Cohen and Werker (2008, 805), which claimsthat less fragmented societies significantly reduce casualties in natural disasters.
7See Achen (2005) for a good discussion on garbage-can regressions.8Removing outliers does not affect the estimates. Negative binomial regressions (model 1 from table 5.4)
were estimated excluding major disaster with more than 10,000; 1,000; 100; and 50 causalities. All results wereconsistent with the baseline model, positive effect of population; negative effect of GDP per capita and disasterratio, and no significant effect of democracy. I have also tested whether the effect of democracy is not on themagnitude of disasters, but on within country variation. The estimates show that democracy is significantlyrelated to reduced disaster variance, however the effect is small. One increase in polity score is associated witha reduction in the variance of casualties with 1.

56 CHAPTER 5. ANALYSIS
tendency between democracy and the number of casualties in natural disasters. It shows how-
ever that full democracies, that is, democracies that score 10 on Polity IV, on average do better
than other. This is probably due to the fact that many of the full democracies have high lev-
els of GDP per capita. Nevertheless, the empirical assessment moderates earlier conclusions –
democratic institutions do not seem to be related to the severity of disasters. As pointed out,
the reason that my model fails to find this relationship seems to be related to a more stringent
model specification. First, I estimate the effects on disastrous events and not annual casual-
ties. Secondly, I include disaster type fixed effects. Thirdly, I exclude the measure of ethnic
fractionalization.9
5.1.2 Institutions and exclusion
Although the relationship between democracy and natural disaster magnitude was the moti-
vation behind my hypotheses and not a necessary condition for them, I proceed and test my
predictions; that countries with presidential systems, majoritarian elections, and decentralized
authority, experience higher casualties in natural disasters. I include the hypotheses postulating
that excluded groups are more vulnerable, although, these hypotheses are not as important in
the country level analysis as it is in the disaggregated analysis.
Table 5.5 shows four negative binomial regression models, with robust standard errors, clus-
tered by country. The models include disaster type and regional fixed effects, and take into
account trends over time. The baseline model was estimated on 6580 disasters, but because
there are unbalanced data coverage concerning the institutional variables, I chose to exclude
all observations that had at least one missing data point on any of the independent variables.
As discussed in the methods section, this allows me to estimate on the exact sample in each
regression, excluding the possibility that changes in the estimates will be due to changes in
the samples.10 The reference category for the institutional variables is parliamentarian, pro-
portional, and centralized institutions, respectively. The estimated effect should be interpreted
as the effect of a particular variable compared to the reference category. However, since each
regression include interaction terms, the effects cannot be interpreted as constitutive effects of
one variable on the dependent variable, but the effect of one variable on the dependent variable
conditional on a third, or in my case also a fourth variable (Brambor, Clark and Golder, 2006,
72). Models 2 to 4 in table 5.6, show the estimated effect of each variable when the interaction
terms are zero, that is, when exclusion and Polity IV is zero. As multiple interaction terms can
make the substantive interpretation of the variables rather messy, I use the stata code written
by Brambor, Clark and Golder (2006) and the software program Clarify, developed by King,
Tomz and Wittenberg (2000) to simulate the marginal effects of more meaningful values. This
makes the interpretations of the variables easier.11
9Ethnic fractionalization does not produce a significant estimate for policy in the baseline model (model 1) in5.4
10I have estimated each regression not doing this. The overall picture does not change. See table A.6 in theappendix.
11I simulate 1000 parameters in each simulation procedure.

5.1. COUNTRY LEVEL ANALYSIS 57
Table 5.5: Institutions, exclusion and natural disasters, country level analysis(1) (2) (3) (4)
Number killed Number killed Number killed Number killed
Number killedPolitical exclusion 0.276 1.039+ 0.140 0.860
(0.37) (1.86) (0.14) (1.36)
Presidential 0.996∗
(2.50)
Excl*Pres -1.810(-1.39)
Pres*Polity IV -0.0490(-1.29)
Majoritarian 0.0275(0.07)
Excl*Maj 0.812(0.61)
Maj*Polity IV -0.0300(-0.69)
Federal 0.419(0.79)
Excl*Fed -2.644+
(-1.90)
Fed*Polity IV -0.0427(-1.03)
Disaster ratio -0.118∗∗∗ -0.112∗∗∗ -0.117∗∗ -0.0885∗∗
(-3.53) (-3.54) (-3.06) (-2.86)
GDP per capita (log) -0.746∗∗∗ -0.715∗∗∗ -0.754∗∗∗ -0.711∗∗∗
(-6.59) (-8.26) (-6.59) (-6.14)
Population (log) 0.544∗∗∗ 0.580∗∗∗ 0.542∗∗∗ 0.520∗∗∗
(5.19) (5.09) (5.07) (5.37)
Polity IV 0.0192 0.0468∗ 0.0324 0.0208(0.67) (1.96) (0.82) (0.65)
Constant -3.261+ -4.848∗ -3.255+ -3.272+
(-1.73) (-2.29) (-1.75) (-1.81)
lnalphaConstant 1.590∗∗∗ 1.581∗∗∗ 1.589∗∗∗ 1.587∗∗∗
(24.23) (24.89) (24.50) (24.25)
Observations 5285 5285 5285 5285ll -20729.2 -20702.0 -20725.4 -20719.1
t statistics in parentheses
Robust standard errors, clustered by country+ p < 0.10, ∗ p < 0.05, ∗∗ p < 0.01, ∗∗∗ p < 0.001

58 CHAPTER 5. ANALYSIS
However, I begin by interpreting the overall effects; looking at the direction of the estimates,
significance and magnitude. The overall view leaves my hypotheses only limited support.12
There seems to be no significant effect of the size of excluded groups in a country on disaster
vulnerability, although it is positive and borderline significant in model 2. More specifically,
there is no significant effect of political exclusion for parliamentary institutions (presidential=0)
when Polity IV is zero, holding all other variables constant. The only significant effect that
corresponds well with my hypotheses is that of presidential institutions. The estimate reports
that presidential institutions increase the expected count of casualties with a factor of 0.996,
compared with parliamentary institutions, when political exclusion and Polity IV is zero.13 On
average this amounts to 50 casualties more. Figure 5.2 shows the marginal effect of presidential
institutions for different levels of the Polity IV index, when political exclusion is at its median
value. The figure shows that the effect of presidential institutions decreases when democracy
increases. The effect of presidential institutions loses significance when passing around 14 in the
figure (equivalent to 4 on the Polity IV indicator). This may be associated with the interaction
effect of democracy and presidentialism, which is not significant. Before I investigate this
and estimate the effects of institutions on democracies only, I briefly comment on the control
variables.
Figure 5.2: Simulated marginal effect of presidentialism on various levels of democracy, withpolitical exclusion at its median value. Confidence intervals in grey shadings.
12Hybrid institutions are coded as belonging to parliamentary, proportional, and central institutions, respec-tively. The results are mostly the same when coding them as belonging to presidential, majoritarian, and federalinstitutions. See table A.5 in appendix.
13I remind the reader that the correlation between Political exclusion and Excl*Pres was high, indicatingcollinearity and inflated standard errors. This may cause the effects to appear less significant than what theyreally are.

5.1. COUNTRY LEVEL ANALYSIS 59
All control variables play out as expected. Disaster ratio is negative and significant through-
out the models, indicating that countries that experience many disasters suffer on average less
than countries that experience few, when exclusion and democracy is zero. A marginal increase
in disaster ratio is associated with reduced number of killed by 6. Another interpretation is that
countries that experience many disasters have a lower threshold of reporting small disasters,
and thus display more resilience. GDP per capita (log), and Population (log) are significant,
and in the proposed direction. A marginal increase in GDP per capita reduces the count of
casualties by 34. Correspondingly, a marginal increase in population (log) increases the number
of casualties by 28.14
5.1.3 Democratic institutions
Table 5.6: Democratic institutions, and natural disasters, country level analysis
(1) (2) (3)Number killed Number killed Number killed
Number killedPresidential 1.000∗
(0.470)
Majoritarian -0.0426(0.268)
Federal 0.288(0.550)
Disaster ratio -0.131∗∗ -0.115∗∗ -0.119∗∗
(0.0419) (0.0431) (0.0409)
GDP per capita (log) -0.812∗∗∗ -0.889∗∗∗ -0.895∗∗∗
(0.0748) (0.119) (0.117)
Population (log) 0.649∗∗∗ 0.576∗∗∗ 0.543∗∗∗
(0.132) (0.135) (0.120)
Constant -0.354 1.754 2.048(1.678) (1.469) (1.347)
lnalphaConstant 1.585∗∗∗ 1.601∗∗∗ 1.599∗∗∗
(0.0763) (0.0771) (0.0744)
Observations 4101 4101 4101ll -15908.0 -15940.7 -15938.1
Standard errors in parentheses
Include only countries that are coded as democratic according to Cheibub et al.(2009).+ p < 0.10, ∗ p < 0.05, ∗∗ p < 0.01, ∗∗∗ p < 0.001
In Table 5.6 I have estimated the effect of institutions on countries that are coded as demo-
14Again, both refer to countries that score 0 on polity, with zero political exclusion.
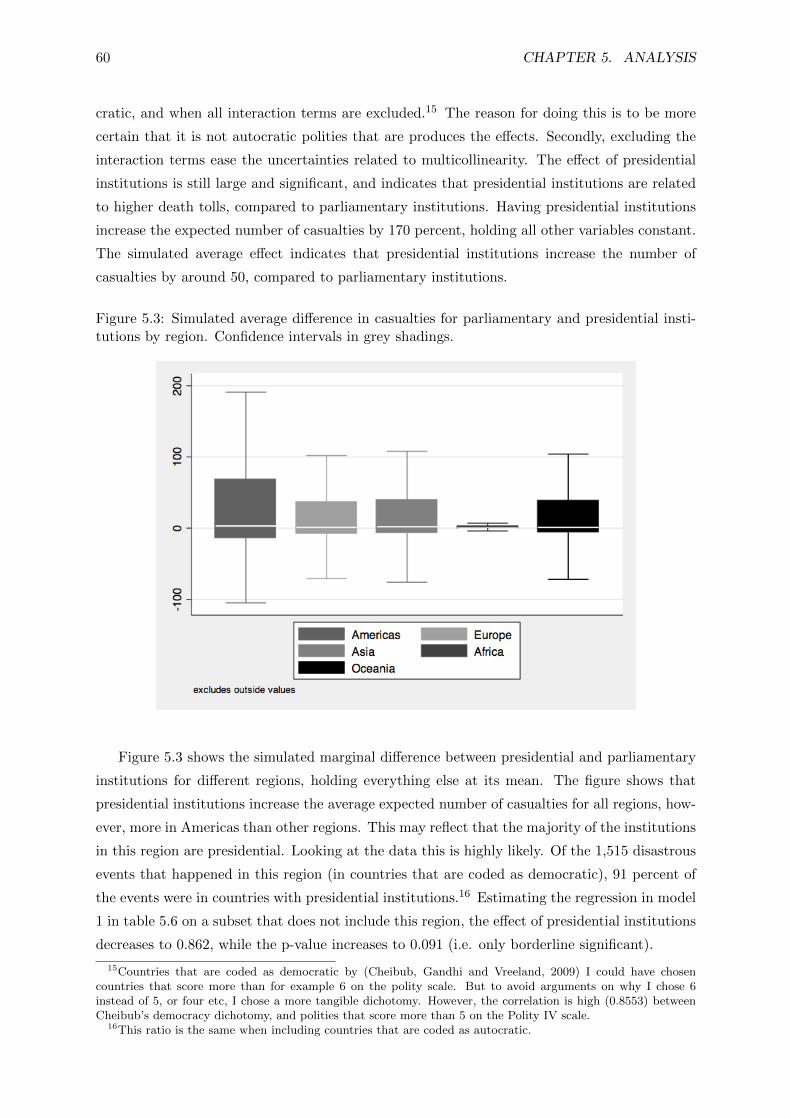
60 CHAPTER 5. ANALYSIS
cratic, and when all interaction terms are excluded.15 The reason for doing this is to be more
certain that it is not autocratic polities that are produces the effects. Secondly, excluding the
interaction terms ease the uncertainties related to multicollinearity. The effect of presidential
institutions is still large and significant, and indicates that presidential institutions are related
to higher death tolls, compared to parliamentary institutions. Having presidential institutions
increase the expected number of casualties by 170 percent, holding all other variables constant.
The simulated average effect indicates that presidential institutions increase the number of
casualties by around 50, compared to parliamentary institutions.
Figure 5.3: Simulated average difference in casualties for parliamentary and presidential insti-tutions by region. Confidence intervals in grey shadings.
Figure 5.3 shows the simulated marginal difference between presidential and parliamentary
institutions for different regions, holding everything else at its mean. The figure shows that
presidential institutions increase the average expected number of casualties for all regions, how-
ever, more in Americas than other regions. This may reflect that the majority of the institutions
in this region are presidential. Looking at the data this is highly likely. Of the 1,515 disastrous
events that happened in this region (in countries that are coded as democratic), 91 percent of
the events were in countries with presidential institutions.16 Estimating the regression in model
1 in table 5.6 on a subset that does not include this region, the effect of presidential institutions
decreases to 0.862, while the p-value increases to 0.091 (i.e. only borderline significant).
15Countries that are coded as democratic by (Cheibub, Gandhi and Vreeland, 2009) I could have chosencountries that score more than for example 6 on the polity scale. But to avoid arguments on why I chose 6instead of 5, or four etc, I chose a more tangible dichotomy. However, the correlation is high (0.8553) betweenCheibub’s democracy dichotomy, and polities that score more than 5 on the Polity IV scale.
16This ratio is the same when including countries that are coded as autocratic.
5.2. DISAGGREGATED ANALYSIS 61
5.1.4 Summary country level analysis
From the country level analysis we have learned two basic things. First, that democracy, as
measured by the Polity IV score is not systematically related to lower death tolls in natural
disasters. This finding is robust to other model specifications, operationalization, and different
samples, and lends little support to the notion that democratic institutions as such reduce the
human losses in natural disasters.
Secondly, even though my hypotheses receive limited support, presidential institutions are
consistently related to an increased number of casualties in natural disasters. This provides
evidence to my initial proposition, that presidential institutions impede global goods provisions
targeted at all citizens. If my assumptions are correct, institutional incentives characterized
by local payments, short-term policies, and ‘porks’, increase people’s vulnerability in natural
disasters.
As expected, country level measures of political exclusion did not produce significant effects
on natural disaster magnitude. The hypotheses concerning the electoral and centralization di-
mension did not receive any support in any of the models. Nor did the hypotheses concerning
the interaction between institutions and political exclusion (however, borderline significant for
Excl*Fed). As argued earlier, country level analyses are not always the best choice when eval-
uating actor-centered theories, nor are they sufficient when trying to understand what happens
at the local level. Hence, I proceed to the disaggregated analysis, and evaluate my hypotheses
on the local level.
5.2 Disaggregated analysis
Table 5.7 reports the mean and median killed in grid-cells by institutions. The initial picture
corresponds well with my hypotheses. The mean and median killed is higher under presidential
institutions compared to parliamentary institutions. For majoritarian and federal institutions,
the reported numbers correspond much better to my initial hypotheses than the country level
analysis did. However, as majoritarian and federal institutions did not produce any significant
effects in hypothesized direction in the country level analysis, these estimates should be inter-
preted with caution. Nevertheless, the overall view is consistent with the initial propositions.

62 CHAPTER 5. ANALYSIS
Table 5.7: Average casualties in grid-cells by institutions.
Institutions Mean Median Standard dev. Number
Parliamentary 219.0 2 1600.4 321Presidential 283.4 6 3677.2 409
Proportional 196.0 4.5 1364.9 524Majoritarian 405.6 4 5111.7 206
Centralized 196.0 4.5 1364.9 524Federal 405.6 4 5111.7 206
Source: EM-DAT 1980-2008, Schjølset 2008, Data on Political Institutions, World Bank 2010
Table 5.8 reports the mean and median casualties in grid-cells with and without political
excluded groups. Cells that have at least one excluded group experience much higher number
of casualties in natural disasters. However, the median value moderates this, and reports the
reverse relationship. This apparent discrepancy between the mean and median value is likely
due to the Pakistan earthquake in 2005, which affected an area that was populated be politically
excluded groups. It is the largest disaster that enters the disaggregated sample, and is registered
as causing 73,338 casualties. Thus, table 5.8 shows no clear tendency of how political status
affects natural disaster vulnerability. The following section provides a more rigorous test.
Table 5.8: Casualties for grid-cells with and without excluded groups.
Political status Mean Median Standard dev. Number
Included groups 191.0 5 1411.2 475Excluded groups 374.6 4 4605.7 255Total 255.1 4 2948.4 730
Source: EM-DAT 1980-2008, GeoEPR.
Table 5.9 shows the regressions in the disaggregated analysis. Model 1 tests the hypoth-
esis relating to political exclusion, while model 2-4 test the institutional hypotheses and the
hypotheses concerning the interplay between institutions and exclusion. The unit of analysis
is natural disaster event in grid-year. All models include gross cell product (GCP) per capita
(log), and GDP per capita (log). They also include grid population (log) and country population
(log).
The estimate of political exclusion in model 1 is positive and significant, indicating that
grid cells that are populated by politically excluded groups are related to higher number of
casualties in natural disasters, compared to grid-cells that are not populated by politically
excluded groups. Figure 5.4 shows the simulated average number killed in casualties in cells
with and without political exclusion. Cells with excluded groups suffer on average approximately
50 casualties more, that is, around twice an many casualties. Even though there is a clear
difference, the simulated confidence intervals are overlapping, indicating that my model cannot

5.2. DISAGGREGATED ANALYSIS 63
Table 5.9: Institutions, exclusion and natural disasters, disaggregated analysis.(1) (2) (3) (4)
Number of killed Number of killed Number of killed Number of killed
Number of killedPolitical exclusion 0.737∗∗ -0.443 0.559 0.999∗∗
(0.273) (0.318) (0.411) (0.334)
Presidential -0.109(0.368)
Excl*Pres 1.661∗∗∗
(0.424)
Pres*Polity IV 0.0394(0.0538)
Majoritarian -0.319(0.548)
Excl*Maj 0.569(0.553)
Maj*Polity IV -0.0327(0.0892)
Federal 2.037∗∗
(0.759)
Excl*Fed -1.829∗∗
(0.678)
Fed*Polity IV -0.389∗∗∗
(0.0796)
Grid population 0.169∗∗ 0.208∗∗∗ 0.161∗∗ 0.0872+
(0.0580) (0.0585) (0.0580) (0.0509)
Population (log) 0.637∗∗∗ 0.693∗∗∗ 0.604∗∗∗ 0.739∗∗∗
(0.148) (0.133) (0.154) (0.119)
Disaster ratio -0.108∗ -0.146∗∗∗ -0.0945+ 0.0160(0.0434) (0.0433) (0.0507) (0.0348)
GCP per capita 1990 (log) 0.578 0.495 0.560 0.871∗
(0.359) (0.338) (0.345) (0.379)
GDP per capita (log) -1.147∗∗ -0.992∗∗ -1.133∗∗ -1.271∗∗
(0.377) (0.338) (0.365) (0.393)
Polity IV -0.0265 -0.0372 -0.0196 0.0375+
(0.0311) (0.0357) (0.0413) (0.0224)
Constant -10.11∗∗ -12.31∗∗∗ -9.420∗∗ -13.38∗∗∗
(3.133) (2.730) (3.170) (2.171)
lnalphaConstant 1.590∗∗∗ 1.566∗∗∗ 1.587∗∗∗ 1.534∗∗∗
(0.0733) (0.0712) (0.0740) (0.0820)
Observations 730 730 730 730ll -2900.3 -2890.3 -2898.8 -2876.9
Standard errors in parentheses
Political exclusion is a dummy variable, where 1 indicates that grid-cell is populated by politically excluded groups.
Reference categories: Parl., PR. and Centalized+ p < 0.10, ∗ p < 0.05, ∗∗ p < 0.01, ∗∗∗ p < 0.001

64 CHAPTER 5. ANALYSIS
Figure 5.4: Simulated average casualties in cells with and without exclusion.
predict anything more than average differences.
Model 2 to 4 provides further tests of my hypotheses. In Model 2 political exclusion no
longer has a significant effect by its own, but plays out through presidential institutions, when
democracy is zero, all variables held constant. Please note that the initial correlation matrix in
section 4.11 indicated collinearity between Political exclusion and Excl*Pres. This may cause
the standard errors for these variables to be inflated. Figure 5.5 shows the simulated marginal
effect of political exclusion for presidential institutions over various level of democracy. The
effect of political exclusion in presidential regimes increases as polity increases, and becomes
significant after 5 on the figure (equivalent to -5 on the Polity IV scale). As there are only 45
event observations that have less than -5 on the Polity IV score, this is not surprising.
Model 3 does not find evidence of electoral institutions being significantly related to an
increase in disaster magnitude. Political exclusion is no longer significant, however this is
probably due collinearity between the variables (see table 4.8 in section 4.9). When the inflated
standard errors are corrected, political exclusion is borderline significant. The last model in table
5.9 shows that federal institutions are related to an increased death count in the disaggregated
sample. However, this effect is contingent on both political exclusion and level of democracy.
The estimates shows that centralized institutions are worse in cells with political exclusion,
and for high levels of democracy. Put differently, federal institutions reduce the number killed
for cells with political exclusion, with high levels of democracy, but increase the number of
casualties for included groups when democracy is low. What to make out of this is not clear,
as federal institutions did not produce any significant results in the country level analysis.

5.3. SUMMARY 65
Figure 5.5: Simulated marginal effect of political exclusion for presidential systems over variouslevels of democracy.
However, the proposed interaction term is significant and in the opposite direction, a finding
that was evident also in the country level analysis. This finding lends little support to my
initial hypothesis, and point to a complete reversed relationship. Besley and Coate (2003)
argued contrary to my predictions that the effect of centralized institutions on public goods
distribution is negative when the bargaining in the legislator is characterized by conflict. In
such a state representatives from heterogeneous regions have less incentives to contribute to
establishing public goods because they value the costs of committing to the good be too high.
If countries with high levels of political exclusion are characterized by conflict in the legislator,
and hence produce low levels of public goods, this logic may provide a more sound explanation
of the empirical results.
5.3 Summary
Although the analysis does find evidence for a few of my hypotheses, the results are not clear-cut.
As anticipated, political exclusion did not play out in the country level analysis, substantiating
the rationale behind the disaggregated approach. In the disaggregated analysis the overall re-
sults indicate that grid-cells that have at least one politically excluded group are significantly
related to an increase in the number of casualties in natural disasters, compared to grid-cells
that are not inhabited by excluded groups. The result corresponds well to the predicted rela-
tionship – politically excluded groups are more vulnerable in natural disasters than politically
included groups. Albeit case studies have shown that politically marginalized groups experience

66 CHAPTER 5. ANALYSIS
disproportional losses in natural disasters, as a general statement, this has not been empirically
evident until now. This yields support to a rational explanation of goods allocation: goods are
distributed unevenly based on the recipient’s political status, and being impaired from central
state institutions affect people’s vulnerability in natural disasters.
This view is modified by institutional characteristics. The positive effect of exclusion seems
to be related with presidential institutions, providing evidence for one of my interaction hy-
pothesis. This result lends support to the assumption that presidential institutions are driven
by incentives characterized by local goods allocation and direct payments to high-status con-
stituents. Being marginalized in presidential institutions increases excluded group’s vulnerabil-
ity in natural disasters.
The electoral dimension does not produce any significant relationships in either direction,
and therefore does not receive any support in my models. The hypotheses that address this
dimension are falsified at this point. As proportional and majoritarian elections have distinctly
different incentive stucture, PR-systems being charaterized by ‘representation’ and majoritarian
being characterized by ‘accountability’, this may indicate that the pros and cons relating to each
of them do not result in systematically different outcomes in natural disasters.
For the federal dimension, the results are a little ambiguous. I do not find any support that
federal institutions are related to higher death tolls in the country level analysis. However, on the
local level, federal institutions have conditioned effect on natural disaster magnitude. Federal
institutions are related to increased number of casualties for included groups when democracy
is low, but are related to fewer casualties in cells with excluded groups when democracy is high.
One should be careful to make too much out of these results as they do not correspond well with
my initial theory. However, as already pointed out, Besley and Coate (2003) argue that the
effect of federal institutions is contingent on the legislative bargaining. If the assumption is true
that countries with excluded groups are characterized by conflict in the legislator, and hence
have low levels of global goods distribution, then this may provide a more sound explanation
of the empirical results. Thus, the effect of centralized authority on goods provisions may after
all be explained by the classic notion argued by Olson (1965): when people fear the costs of
committing to the establishment of global public goods, the goods will not be underprovided.
Finally, the analysis supports the notion that rich countries are related to lower death
tolls, and that large populations increase the toll on human lives. A more novel indicator that
produced large and significant effects throughout the models was disaster ratio. The estimates
show that countries with a higher disaster ratio of natural disasters are more robust. This
supports the belief that natural disasters are a function of the political and socio-economic
environment, and that countries can learn from and prepare for such events.

Chapter 6
Robustness and model fit
In the main analysis I have tried to be as straightforward as possible. I have included all
disasters, stuck to my baseline control model, and estimated all regressions with a negative
binomial regression model. In this section I will comment on how different operationalizations,
samples, and estimations affect the results. Lastly, I address how my model fits the data, and
the ability to predict future events.
6.1 Disaggregated analysis
As my dependent variable have a large standard deviation, several missing data points, and
many zero values, I have tried to estimate the regression models on different subsets. When
estimating the effects excluding all disasters that did not have any casualties, the disaggregated
model showed that excluded groups still are positively related to disaster casualties, however
only significant in an OLS regression (see A.7 in appendix). Logit estimations of 0 and more
than 0 casualties, or less than 50 or more than 50 casualties, showed no significant effect of
political exclusion (see table A.8 appendix). When estimating the effect of political exclusion
on earthquakes only, the parameter rises from 0.737 (Model 1 in table 5.9) to 1.711 (See table
A.9 in appendix). When removing large disasters, political exclusion is significant until around
600 casualties (results not shown). Lastly, when estimating on all observations, not taking
into account missing data on some of the institutional variables, political exclusion was still
significant at the 5 percent level (see table A.3 in appendix). All in all, political exclusion seems
to be related to an increase in death tolls, however the results do point in the direction that
large disasters, i.e. disasters with more than 600 casualties drive significance of the parameter
estimate.
For the hypothesis concerning presidentialism, I estimated the effect of presidential institu-
tions on earthquakes only. The effect was still significant, however, now not for the interaction
with exclusion, but for presidential by its own (See table A.9 in appendix). For the other insti-
tutional dimensions the estimates looked like those in table 5.9 (results not shown). Presidential
institutions were still significantly related to higher casualties when not estimating on the exact
same sample (see A.3). The results were the same for the electoral dimension and the central-
67

68 CHAPTER 6. ROBUSTNESS AND MODEL FIT
ization dimension as in table 5.9 (see A.3). To sum up, presidential institutions were related
to higher number of casualties under most operationalizations, supporting the assumption that
presidential institutions weakens global goods provisions. Elections and centralization did not
produce the proposed effect.
Figure 6.1: Predicted number events from model 2 in table 5.9.
Figure 6.1 shows the predicted number of events from model 2 in table 5.9. It shows that my
model fails to predict large disasters. For better predictions my model should incorporate more
information on the natural hazard event, together with other environmental factors. However,
even more complex models are not able to predict disaster casualties, and focus on predicting
country level and grid-cell risks instead (see Peduzzi et al., 2009). Even though my model is
unable to predict large disasters, the zero inflated negative binomial regression does not provide
improvements that are worth talking about. Figure 6.2 shows the differences between the
observed and the predicted values from the negative binomial regression model (NBRM) and
the zero inflated negative binomial (ZINB). A perfect model would follow Y=0. Both models
clearly overpredicts zero values (positive deviations show underpredictions), but the differences
in the two models are hardly visible. One possible reason that the zero inflated model does not
provide improvements to the regular negative binomial is that there are no grid-cells that have
more than one event in a single year, and as much as 85 percent of the data was registered as
having only one event. This may explain why the model is unable to distinguish between the
always zero group, and the not always zero group.

6.2. COUNTRY LEVEL ANALYSIS 69
Figure 6.2: Predicted number casualties from model 2.
6.2 Country level analysis
In the country level analyses the only finding that corresponded well with my hypotheses was
the estimate for presidential institutions. This finding was consistent when estimating on the
three most frequent disasters, floods, earthquakes, and storms.1 Presidential institutions were
significantly related to higher number of casualties when excluding all disasters with zero counts.
However, presidential institutions were not significant when estimating only on disasters with
less than 100 casualties. This may indicate that there are a few extreme events that unfolded
in countries with presidential institutions, and that this pulls the estimate in the proposed
direction. When including observations that did have missing data on one of the other variables,
presidential institutions were still significantly related to an increase in the expected number of
casualties. The results for the other institutional dimensions were the same.
6.3 Democracy
I will briefly go through the most relevant robustness test concerning the non-significant effect of
democracy. A core problem with these estimations is that democracies might be over represented
in the dataset, and that the corresponding effect of the democracy indicator is underestimated.
There is no obvious way of controlling for this concern, but one way is to increase the threshold
for disasters, including only disasters that caused more than 50 casualties. Doing this might limit
1Positive but not significant for storms.

70 CHAPTER 6. ROBUSTNESS AND MODEL FIT
overreporting of small disasters, which could explain the non-significant effect of democracy. The
results, however, do not change. Polity IV actually became positively related to higher death
tolls when doing this. I estimated logit regressions with a dichotomous dependent variable,
where 1 is more than 1, 50 or 100 killed, and 0 is less. Still, democracy was not systematically
related to fewer casualties. Lastly, to handle differences between different disasters, I have
estimated the baseline model on each subset of the most frequent disasters (i.e. storms, floods
and earthquakes). For earthquakes and storms, the estimates were consistent with the previous
models. However, for floods, democracies are on average significantly related to fewer casualties.
What to make out of this is not clear, but one possible explanation is that floods are more
easily foreseeable and develop over larger time periods, and that democratic institutions in this
context are more efficient in disaster mitigation. This should provide reasons to examine how
specific institutions relate to specific natural disasters, and develop testable predictions of a
more detailed relationship.
6.4 Multilevel model
As my data has a multilevel structure, this could help explain why several of my hypotheses
did not receive support. However, a simple test of intraclass correlation did not provide reasons
for modeling two-level models. The rule of thumb is to estimate multilevel models when the
intraclass correlation (ICC) is more then 0.06. None of my hypothesized variables had more
than 0.008 ICC score, which made such an analysis not worth exploring.

Chapter 7
Conclusion
The empirical analysis has tested 7 distinct hypotheses concerning how institutions and political
status affect natural disaster vulnerability. This chapter ends the empirical discussion, and goes
through the hypotheses, one by one, before concluding on the major findings. I will also address
some of the policy implications of my findings, and where the research community should go
from here.
7.1 Hypotheses
I will briefly go through the hypotheses, and comment on how the analysis corresponded to
each of them.
Proposition 1: PR-systems experience fewer casualties in natural disasters than majori-
tarian systems, ceteris paribus.
Proposition 1 did not receive any support in the empirical assessment. The estimates were
not significant, nor were they consistent in the hypothesized direction. The proposition is falsi-
fied at this point. The implications of this may indicate that albeit electoral institutions having
distinctly different incentive structure, the output side of this incentive structure does not di-
rectly affect the allocation of goods in the extent that countries with majoritarian elections
systematically suffer more in natural disasters. Put differently, the countervailing pros and cons
balance each other off.
Proposition 2: Parliamentary systems experience fewer casualties in natural disaster than
presidential systems, ceteris paribus.
In most of the presented models, and in the majority of the robustness checks, parliamen-
tary systems were significantly related to fewer casualties in natural disasters. The results do
indicate that there are regional variations, but that the main story is consistent under most con-
ditions. The hypothesis is confirmed at this point. This result lends support to the assumption
71

72 CHAPTER 7. CONCLUSION
that presidential institutions are driven by incentives characterized by local goods allocation
and direct payments to high-status constituents. The incentives driving goods allocation in par-
liamentary and presidential institutions systematically result in different outcomes in natural
disasters, and indicate that the countervailing effects do not balance up. Political representation
and coalition building in parliamentary institutions directly affect people’s vulnerability through
global public goods targeting all citizens. Again, this substantiates the notion that protective
measures targeting globally are more effective in securing the robustness of the peoples than
policy measures directed locally.
Proposition 3: Centralized governments experience fewer casualties than federal govern-
ments, ceteris paribus.
The result for the federal dimension is rather ambiguous. The country level analysis did not
find any significant difference between centralized and federal governments. However, in the
disaggregated analysis, federal governments were related to higher death tolls. A likely reason
for this discrepancy is that the disaggregated sample has a lot fewer observations, and that the
sample is biased. Thus, the proposition is tentatively rejected. As the results do not point to
a clear tendency in any direction, I conclude that the mechanisms behind centralized authority
do not exceed the countervailing mechanisms behind federal authority. However, the results
relating to proposition 7 leaves the level of centralization with a conditioned effect.
Proposition 4: Politically excluded groups experience more deaths in natural disasters than
politically included groups.
For the hypothesis relating to political exclusion, the analysis has two basic findings. First,
there are substantial differences between the country level approach, and the grid-cell approach.
The country level analysis did not find support for the hypothesized effect of political exclu-
sion, while the effect on the local level is large and consistent. Grid-cells that are inhabited by
politically excluded groups experience approximately twice as many killed in a natural disaster.
This leads me to conclude that country level indices do not sufficiently capture what goes on
the local level, and that empirical testing of local events should try to narrow the unit closer to
each particular case. The analysis confirms this proposition.
Proposition 5: Excluded groups experience more casualties in majority systems than PR-
systems.
I do not find systematic evidence of proposition 5, which indicates that there is no significant
difference between vulnerability of excluded groups under different electoral institutions. The
results suggest that the ‘accountability–representation’ trade-off concerning different electoral
rules does not have a systematic effect on politically excluded groups’ vulnerability in natural

7.1. HYPOTHESES 73
disasters. Proposition 5 is rejected.
Proposition 6: Excluded groups experience more casualties in presidential systems than
parliamentary systems.
Proposition 6 receives support in the disaggregated analysis, but not in the country level
analysis. However, as the disaggregated model captures the theoretical linkage between insti-
tutions and exclusion more explicitly, this implies that there is such a relationship. As there
are substantial concerns relating to biases in the disaggregated sample, I conclude that it re-
ceives partial support. Nevertheless, there seems to be tendencies pointing in the direction that
presidential institutions are more impairing than parliamentary institutions, and that the effect
of being excluded from central state institutions is worse in presidential than in parliamentary
institutions.
Proposition 7: Excluded groups in federal governments experience more casualties than
excluded groups in centralized governments.
The disaggregated model finds a strong and significant relationship of the opposite direc-
tion, indicating that excluded groups experience fewer casualties under federal than centralized
institutions. This effect is also borderline significant in the country level analysis. I therefore
reject my last hypothesis, and conclude that the proposed theoretical linkage does not capture
the essence of how centralization affects politically excluded groups in natural disasters. As
discussed in section 5.3 Besley and Coate (2003) argue that the effect of federal institutions is
contingent on the legislative bargaining. If the assumption is true that countries with excluded
groups are characterized by conflict in the legislator, and hence produce low levels of global
goods, then this may provide a more sound explanation of the observed relationship. Thus, the
effect of centralized authority on goods provisions may be explained by the classic notion argued
by Olson (1965): when people fear the costs of committing to the establishment of global public
goods, the goods will not be underprovided. This finding is present under most conditions,
which implies that further research should be directed at studying how centralized institutions
may be impairing to goods allocation when heterogeneous regions fight over the allocation of
goods.
7.1.1 Summary
The overall view leaves my hypotheses partial support. The two major empirical findings
reveal core features of the political dimension behind disaster vulnerability, which has not
been empirically evident until now. Politically excluded groups are more vulnerable in natural
disasters than politically included groups, and estimates suggest that areas that are populated
by excluded groups on average experience twice as many casualties. This finding yields support
to a core rational choice argument: political representation in central government affects the

74 CHAPTER 7. CONCLUSION
allocation of goods, and incumbents allocate goods favoring those constituents that ensure
them in power. Secondly, the empirically novel approach developed in this thesis demonstrates
that supplementing country level data with grid-cell data allows researchers to more accurately
observe what goes on at the local level, and lets researchers make more precise inferences about
how political status affects group’s vulnerability in natural disasters.
Regarding political institutions, I find evidence that presidential institutions on average ex-
perience 50 casualties more than parliamentary institutions in natural disasters. This finding
lends support to large parts of the literature arguing that allocation of global goods in presi-
dential regimes are characterized by local distribution, short-term policy, and large transaction
costs, which all hamper global goods provisions. Secondly, it leaves me reason to believe that
the proposed theoretical framework, separating between ex-ante local and global goods, can
function as a helpful theoretical distinction when arguing how goods affect the outcome in
natural disasters.
7.2 Policy implications and further research
The empirical evidence of this project reveals important features of how natural disasters are
a function of the political environment. In all, disasters can at least partially be explained by
different institutional arrangements. The most important policy implication stemming from this
project is that political representation directly affects how goods are distributed. Being excluded
from central state institutions makes groups more vulnerable in natural disasters. Thus, securing
ethnic groups’ representation in central government institutions is vital for making politically
marginalized groups more robust.
This project has also revealed that democratic institutions are not necessarily related to
increased robustness. This implies that de jure institutions cannot act as excuse in exchange
for de facto political and civil liberties.
This project has by and large tested hypotheses that have never before been tested. Thus,
further research should be directed at developing concrete theory on how institutions are linked
to public goods distribution, and how they affect the vulnerability of politically excluded groups.
This should provide the basis of more solid tests of how institutions and political status affect
people’s vulnerability in natural disasters. Secondly, the analytical approach developed in this
thesis shows that only by complementing country level data with disaggregated data, researchers
are able to observe and understand what goes on at the local level. Therefore, this thesis
substantiates the empirical benefits of grid-cell data, and encourages the research community
to employ a similar approach when studying local level events. Thirdly, estimates suggest
that the effects of institutions may be contingent on the nature of the disastrous event. Thus,
further research should investigate how specific institutions are able to reduce the severity of
specific types of disasters. Are democratic institutions better at combating natural disasters that
develop over time, such as climate change, or are 4 or 5-year terms insufficient for democratic
governments to act on such challenges? Lastly, the quality of the inferences made here, is at least

7.2. POLICY IMPLICATIONS AND FURTHER RESEARCH 75
partly a function of the data available. As discussed in detail, the disaggregated analysis suffers
from data shortages stemming from missing values. Improving the quality and availability of
the data therefore is paramount to developing our understanding of how natural disasters affect
human lives. CRED, being a World Health Organization (WHO) Collaborating Center, receives
its funding from the policy community. Thus, the policy community should be able to facilitate
improvements in the data.

76 CHAPTER 7. CONCLUSION

Appendix A
Diagnostics and additional results.
Table A.1 shows overdispresion in poisson model, which leads to large z-values and small p-
values. Tabel A.2 shows the disaggregated analysis when hybrid institutions are coded as
belonging to majoritarian, presidential, and federal. Table A.3 shows the disaggregated analysis
when all observations are included. Table A.5 shows hybrids coded as belonging to presidential,
majoritarian, and federal. Tabel A.6 shows the country level analysis when all observations are
included. Table A.7 shows a NBRM and an OLS-regression including disasters with more than
1 killed. The dependent variable in the OLS is transformed to its natural logarithm. Table A.8
shows two logit models. Table A.9 shows NBRM on earthquakes only.
77

78 APPENDIX A. DIAGNOSTICS AND ADDITIONAL RESULTS.
Table A.1: Possion vs Negative regression model.
(1) (2)Number killed Number killed
Number killedDisaster ratio -0.109∗∗∗ -0.099∗∗∗
(-328.58) (-12.48)
GDP per capita (log) -0.414∗∗∗ -0.663∗∗∗
(-368.64) (-18.80)
Population (log) 0.441∗∗∗ 0.477∗∗∗
(345.36) (14.77)
Polity IV 0.024∗∗∗ -0.002(147.54) (-0.34)
1b.d type 0.000 0.000(.) (.)
2.d type -2.549∗∗∗ -2.649∗∗∗
(-936.62) (-25.75)
3.d type -3.057∗∗∗ -2.499∗∗∗
(-428.76) (-16.59)
4.d type -1.747∗∗∗ -2.207∗∗∗
(-742.63) (-19.89)
5.d type -1.369∗∗∗ -1.474∗∗∗
(-211.06) (-6.66)
6.d type -2.595∗∗∗ -2.270∗∗∗
(-121.36) (-5.93)
7.d type -1.141∗∗∗ 1.029∗∗∗
(-323.75) (5.90)
8.d type -4.437∗∗∗ -3.448∗∗∗
(-181.89) (-19.81)
1b.regional 0.000 0.000(.) (.)
2.regional -0.046∗∗∗ -1.597∗∗∗
(-10.56) (-14.53)
3.regional 0.497∗∗∗ -0.569∗∗∗
(143.80) (-5.68)
4.regional -1.454∗∗∗ -1.867∗∗∗
(-203.01) (-15.98)
5.regional -1.495∗∗∗ -1.765∗∗∗
(-89.50) (-10.96)
Constant 5.665∗∗∗ 8.120∗∗∗
(350.40) (17.08)
alpha 4.907N 6605.000 6605.000
t statistics in parentheses∗ p < 0.05, ∗∗ p < 0.01, ∗∗∗ p < 0.001

79
Table A.2: Institutions, exclusion and natural disasters, disaggregated analysis. Hybrid insti-tutions coded as belonging to majoritarian, predidential, and federal.
(1) (2) (3)Number of killed Number of killed Number of killed
Number of killedexcl -0.547 0.878+ 0.999∗∗
(0.336) (0.500) (0.334)
pres -0.907∗
(0.385)
Excl*Pres 1.701∗∗∗
(0.435)
maj 0.440(0.437)
Excl*Maj -0.382(0.555)
Maj*Polity IV -0.0932+
(0.0480)
fed2 2.037∗∗
(0.759)
Excl*Fed -1.829∗∗
(0.678)
Fed*Polity IV -0.389∗∗∗
(0.0796)
Pres*Polity IV 0.0836+
(0.0450)
Grid population 0.191∗∗∗ 0.170∗∗ 0.0872+
(0.0539) (0.0559) (0.0509)
Population (log) 0.641∗∗∗ 0.621∗∗∗ 0.739∗∗∗
(0.119) (0.143) (0.119)
GCP per capita 1990 (log) 0.475 0.598+ 0.871∗
(0.340) (0.357) (0.379)
Disaster ratio -0.123∗∗ -0.0771+ 0.0160(0.0402) (0.0454) (0.0348)
GDP per capita (log) -0.993∗∗ -1.139∗∗ -1.271∗∗
(0.350) (0.392) (0.393)
Polity IV -0.0939∗ 0.0259 0.0375+
(0.0374) (0.0306) (0.0224)
Constant -10.25∗∗∗ -10.54∗∗∗ -13.38∗∗∗
(2.248) (2.740) (2.171)
lnalphaConstant 1.570∗∗∗ 1.583∗∗∗ 1.534∗∗∗
(0.0714) (0.0735) (0.0820)
Observations 730 730 730ll -2891.9 -2897.3 -2876.9
Standard errors in parentheses
Political exclusion is a dummy variable, where 1 indicates that grid-cell is populated by politically excluded groups.
Reference categories: Parl., PR. and Centalized+ p < 0.10, ∗ p < 0.05, ∗∗ p < 0.01, ∗∗∗ p < 0.001

80 APPENDIX A. DIAGNOSTICS AND ADDITIONAL RESULTS.
Table A.3: Institutions, exclusion and natural disasters, disaggregated analyses. Including allobservations.
(1) (2) (3) (4)Number of killed Number of killed Number of killed Number of killed
Number of killedexcl 1.126∗ 1.314 0.553 1.364∗
(0.572) (1.370) (0.411) (0.635)
pres2 0.861+
(0.485)
Excl*Pres -0.363(1.230)
Pres*Polity IV -0.0218(0.0668)
maj2 -0.234(0.529)
Excl*Maj 0.488(0.543)
Maj*Polity IV -0.0439(0.0854)
fed2 1.251∗∗
(0.452)
Excl*Fed -1.448∗∗
(0.538)
Fed*Polity IV -0.207∗∗
(0.0803)
Grid population 0.174∗ 0.182∗ 0.161∗∗ 0.110(0.0840) (0.0722) (0.0574) (0.0882)
Population (log) 0.685∗∗∗ 0.716∗∗∗ 0.585∗∗∗ 0.710∗∗∗
(0.170) (0.181) (0.150) (0.149)
GCP per capita 1990 (log) -0.0952 -0.142 0.557 0.229(0.393) (0.350) (0.340) (0.534)
Disaster ratio -0.172∗ -0.160∗∗ -0.0861+ -0.109(0.0711) (0.0604) (0.0474) (0.0885)
GDP per capita (log) -0.0472 -0.0593 -1.124∗∗ -0.215(0.531) (0.383) (0.359) (0.674)
Polity IV -0.0176 0.000650 -0.0210 0.0128(0.0276) (0.0476) (0.0423) (0.0260)
Constant -14.64∗∗ -15.55∗∗∗ -9.159∗∗ -16.26∗∗∗
(4.611) (4.282) (3.118) (3.763)
lnalphaConstant 1.704∗∗∗ 1.708∗∗∗ 1.582∗∗∗ 1.689∗∗∗
(0.0820) (0.0776) (0.0735) (0.0869)
Observations 959 942 737 954ll -3981.2 -3867.4 -2943.4 -3951.8
Standard errors in parentheses
Reference categories: Parl., PR. and Centalized+ p < 0.10, ∗ p < 0.05, ∗∗ p < 0.01, ∗∗∗ p < 0.001

81
Table A.4: Cross-correlation table of the hypothesized variables, and the interaction terms.Country level analysis. High correlations are in bolded text.
Variables Political exclusion Presidential Excl*Pres Pres*Polity IV Polity IV
Political exclusion 1.000Presidential 0.359 1.000Excl*Pres 0.851 0.562 1.000Pres*Polity IV 0.229 0.681 0.367 1.000Polity IV -0.141 -0.105 -0.075 0.461 1.000
Variables Political exclusion Majoritarian Excl*Maj Maj*Polity IV Polity IV
Political exclusion 1.000Majoritarian 0.248 1.000Excl*Maj 0.638 0.633 1.000Maj*Polity IV 0.174 0.692 0.442 1.000Polity IV -0.141 -0.075 -0.044 0.441 1.000
Variables Political exclusion Federal Excl*Fed Fed*Polity IV Polity IV
Political exclusion 1.000Federal 0.155 1.000Excl*Fed 0.614 0.574 1.000Fed*Polity IV 0.121 0.864 0.480 1.000Polity IV -0.141 0.186 0.091 0.400 1.000
Source: EM-DAT (2012),DPI, Polity IV Project, EPR-ETH, Schjølset (2008)

82 APPENDIX A. DIAGNOSTICS AND ADDITIONAL RESULTS.
Table A.5: Institutions, exclusion and natural disasters, country level analysis. Hybrid institu-tions coded as belonging to presidential, majoritarian, and federal.
(1) (2) (3) (4)Number killed Number killed Number killed Number killed
Number killedPolitical exclusion 0.163 0.636 0.704 0.668
(0.24) (1.36) (0.61) (1.16)
Presidential 0.967∗
(2.07)
Excl*Pres -0.478(-0.54)
Pres*Polity IV -0.0339(-0.91)
Majoritarian 0.106(0.18)
Excl*Maj -0.903(-0.71)
Maj*Polity IV -0.0837(-1.29)
Federal 0.0581(0.13)
Excl*Fed -1.786(-1.19)
Fed*Polity IV 0.0230(0.61)
Polity IV -0.000986 0.0490 0.0508 -0.00771(-0.04) (1.44) (0.75) (-0.28)
Disaster ratio -0.113∗∗∗ -0.121∗∗∗ -0.0949∗∗ -0.105∗∗
(-3.42) (-3.55) (-3.16) (-3.10)
GDP per capita (log) -0.693∗∗∗ -0.685∗∗∗ -0.683∗∗∗ -0.690∗∗∗
(-6.41) (-7.83) (-6.95) (-6.25)
Population (log) 0.524∗∗∗ 0.555∗∗∗ 0.539∗∗∗ 0.511∗∗∗
(5.24) (5.15) (5.39) (5.30)
Constant -3.191+ -4.922∗ -3.964∗ -2.989+
(-1.76) (-2.40) (-2.20) (-1.80)
lnalphaConstant 1.603∗∗∗ 1.595∗∗∗ 1.595∗∗∗ 1.600∗∗∗
(24.67) (25.23) (25.41) (25.00)
Observations 5511 5511 5511 5511ll -21740.1 -21715.1 -21715.4 -21731.3
t statistics in parentheses+ p < 0.10, ∗ p < 0.05, ∗∗ p < 0.01, ∗∗∗ p < 0.001

83
Table A.6: Institutions and natural disasters, country level analysis. All observations are in-cluded.
(1) (2) (3)Number killed Number killed Number killed
Number killedPolitical exclusion 0.669 0.180 0.573
(0.496) (0.958) (0.466)
Presidential 0.824∗∗
(0.299)
Excl*Pres -1.578+
(0.880)
Pres*Polity IV -0.0326(0.0310)
Majoritarian 0.0371(0.408)
Excl*Maj 0.734(1.306)
Maj*Polity IV -0.0345(0.0438)
Federal 0.170(0.426)
Excl*Fed -2.141+
(1.182)
Fed*Polity IV -0.0121(0.0310)
Disaster ratio -0.0858∗∗ -0.113∗∗ -0.0867∗∗∗
(0.0290) (0.0380) (0.0250)
GDP per capita (log) -0.661∗∗∗ -0.743∗∗∗ -0.641∗∗∗
(0.0853) (0.114) (0.110)
Population (log) 0.524∗∗∗ 0.531∗∗∗ 0.488∗∗∗
(0.101) (0.107) (0.0841)
Polity IV 0.0107 0.0290 0.00188(0.0214) (0.0413) (0.0140)
Constant -4.188∗ -3.155+ -3.195∗
(1.843) (1.852) (1.527)
lnalphaConstant 1.586∗∗∗ 1.590∗∗∗ 1.576∗∗∗
(0.0549) (0.0645) (0.0561)
Observations 6501 5331 6609ll -26327.1 -20919.9 -27008.3
Standard errors in parentheses+ p < 0.10, ∗ p < 0.05, ∗∗ p < 0.01, ∗∗∗ p < 0.001

84 APPENDIX A. DIAGNOSTICS AND ADDITIONAL RESULTS.
Table A.7: Exclusion and natural disasters, NBRM and OLS. Dependent variable is the countof more than zero killed. This is transformed to its natural logarithm in the OLS model.
(1) (2)Number of killed log no killed
mainPolitical exclusion 0.737 0.346∗
(0.522) (0.160)
Grid population 0.147+ 0.108∗
(0.0886) (0.0499)
Population (log) 0.210 0.0840(0.166) (0.0795)
GCP per capita 1990 (log) 0.224 0.0159(0.299) (0.114)
GDP per capita (log) -0.413 -0.300∗
(0.367) (0.127)
Polity IV -0.0164 0.00766(0.0410) (0.0184)
Constant -5.880 2.269(3.641) (1.508)
lnalphaConstant 1.228∗∗∗
(0.0777)
Observations 712 712ll -3659.0 -1403.7
Standard errors in parentheses+ p < 0.10, ∗ p < 0.05, ∗∗ p < 0.01, ∗∗∗ p < 0.001

85
Table A.8: Exclusion and natural disasters, Logit models. Dependent variable in Model 1 is 1if number killed is more than 0. Dependent variable in model 2 is 1 if number killed is morethan 50.
(1) (2)killed1 killed50
mainPolitical exclusion 0.0749 0.0532
(0.174) (0.196)
Grid population 0.169∗∗∗ 0.143∗
(0.0502) (0.0622)
Population (log) 0.0311 0.0645(0.0730) (0.0995)
GCP per capita 1990 (log) -0.0993 0.0221(0.117) (0.177)
GDP per capita (log) -0.121 -0.458∗
(0.138) (0.184)
Polity IV 0.00277 0.0141(0.0131) (0.0230)
year80 89 -0.0745 0.303(0.187) (0.370)
year90 99 0.0714 0.677∗
(0.237) (0.329)
Constant 0.466 -1.217(1.304) (1.754)
Observations 952 959ll -489.4 -389.8
Standard errors in parentheses+ p < 0.10, ∗ p < 0.05, ∗∗ p < 0.01, ∗∗∗ p < 0.001

86 APPENDIX A. DIAGNOSTICS AND ADDITIONAL RESULTS.
Table A.9: Political exclusion and presidential institutions, estimated on earthquakes only.
(1) (2)Number of killed Number of killed
Number of killedPolitical exclusion 1.713∗ 1.819
(0.743) (1.575)
Presidential 1.696∗
(0.787)
Excl*Pres -0.185(1.724)
Pres*Polity IV -0.0497(0.144)
Grid population 0.150 0.185+
(0.108) (0.104)
Population (log) 0.468+ 0.622∗∗
(0.257) (0.224)
GCP per capita 1990 (log) 0.692∗ 0.511(0.351) (0.513)
GDP per capita (log) -0.147 -0.139(0.677) (0.562)
Polity IV -0.0259 0.0229(0.0718) (0.0931)
1b.region 0 0(.) (.)
2.region -2.225∗ -1.768∗
(0.923) (0.810)
3.region 1.416∗ 1.721∗∗
(0.698) (0.567)
4.region 0.744 0.633(1.415) (1.098)
5.region 2.912∗∗ 4.348∗∗∗
(0.924) (1.085)(.) (.)
Constant -17.84∗∗ -20.94∗∗∗
(6.101) (5.806)
lnalphaConstant 2.089∗∗∗ 2.053∗∗∗
(0.0820) (0.0788)
Observations 515 515ll -2102.6 -2091.6
Standard errors in parentheses+ p < 0.10, ∗ p < 0.05, ∗∗ p < 0.01, ∗∗∗ p < 0.001

Appendix B
Relevant Stata codes and data
All relevant do-files and data are on the accompanying CD, or can be provided upon request
(contact: [email protected]).
87

88 APPENDIX B. RELEVANT STATA CODES AND DATA

Bibliography
Achen, Christopher H. 2005. “Let’s Put Garbage-Can Regressions and Garbage-Can ProbitsWhere They Belong.” Conflict Management and Peace Science (22):237–339.
Achen, Christopher H. and Larry M. Bartles. 2004. “Blind retrospection electoral responses todrought, flu, and shark attacks.” Mimeo, Princeton University, Princeton NJ .
Adcock, Robert and David Collier. 2001. “Measurement Validity: A Shared Standard forQualitative and Quantitative Research.” American Political Science Review 95(3):529–544.
Albala-Bertrand, J. M. 1993. Political economy of large natural disasters. Oxford, UK: Claren-don.
Alesina, Alberto, Arnaud Devleeschauwer, William Easterly, Sergio Kurlat and RomainWacziarg. 2003. “Fractionalization.” Journal of Economic Growth 8(June):155–194.
Alesina, Alberto, Reza Baqir and William Easterly. 1999. “Public Goods and Ethnic Divisions.”The Quarterly Journal of Economics pp. 1243–1284.
Alexander, David E. 1993. Natural Disasters. London: University College London Press Limited.
Alvarez, M., J. A. Cheibub, F. Limongi and A. Przeworski. 1996. “Classifying political regimes.”Studies in Comparative International Development 31(2):3–38.
Anbarci, Nejat, Monica Escaleras and Charles Register. 2005. “Earthquake fatalities: the inter-action of nature and Earthquake fatalities: the interaction of nature and political economy.”Journal of Public Economics 89:1907–1933.
Anbarci, Nejat, Monica Escaleras and Charles Register. 2007. “Public sector corruption andmajor earthquakes: A potentially deadly interaction Publiv sector corruption and majorearthquakes: A potential deadly interaction.” Public Choice 132:209–230.
Ashworth, Scott and Ethan Bueno de Mesquita. 2006. “Delivering the Goods: Legislative Partic-ularism in Different Electoral and Institutional Settings.” The Journal of Politics 68(1):168–179.
Bates, F. L., C. Folgeman, V. Parenton, R. Pittman and G. Tracy. 1963. The Social andPsychological Consequences of a Natural Disaster: A Longitudunal Study of Hurrican Audrey.Washington: National Research Council.
Beck, Thorsten, George Clarke, Alberto Groff, Philip Keefer and Patrick Walsh. 2001. “Newtools in comparative political economy: The Database of Political Institutions.” World BankEconomic Review 15(1):165–176.
Benhabib, J. and A. Przeworski. 2005. “Economic Growth Under Political Accountability.”Workingpaper . New York University.
89

90 BIBLIOGRAPHY
Besley, Timothy and Robin Burgess. 2002. “The Political Economy of Government Responsive-ness: Theory and Evidence from India.” The Quarterly Journal of Economics 117(4):1415–1451.
Besley, Timothy and Stephen Coate. 2003. “Centralized versus decentralized provision of localpubliv goods: a political economy approach.” Journal of Public Economics 87:2611–2637.
Brambor, Thomas, William Roberts Clark and Matt Golder. 2006. “Understanding InteractionModels: Improving Empirical Analysis.” Political Analysis 14:63–82.
Bueno de Mesquita, Bruce, Alastair Smith, Randolph M. Siverson and James D. Morrow. 2003.The Logic of Political Survival. Cambridge, Massachusetts: The MIT Press.
Buhaug, Halvard and Jan Ketil Rød. 2006. “Local Determinants of African civil wars, 1970-2001.” Political Geograpy 25(3):315–335.
Buhaug, Halvard, Lars-Erik Cederman and Jan Ketil Rød. 2008. “Disaggregating Ethno-Nationalist Civil Wars: A Dyadic Test of Exclusion Theory.” International Organization(63):531–51.
Buhaug, Halvard and Paivi Lujala. 2005. “Accounting for scale: Measuring geography in quan-titative studies of civil war.” Political Geograpy 24(4):399–418.
Cannon, Terry. 1994. Disasters, Development and Environment. John Wiley & Sons Ltdchapter 2.
Cederman, Lars-Erik, Andreas Wimmer and Brian Min. 2010. “Why do Ethnic Groups Rebel?New Data and Analysis.” World Politics 62(1):87–119.
Cederman, Lars-Erik and Luc Girardin. 2007. “Beyond fractionalization: Mapping ethnicityonto nationalist insurgencies.” American Political Science Review 101(1):173–185.
Cederman, Lars-Erik, Luc Girardin and Kristian Skrede Gleditsch. 2009. “EthnonationalistTriads: Assessing the Influence of Kin Groups on Civil Wars.” World Politics 61:403–437.
Cheibub, J.A. 2007. Presidentialism, Parliamentarism and Democracy. Cambridge: CambridgeUniversity Press.
Cheibub, Jose Antonio, Jennifer Gandhi and James Raymond Vreeland. 2009. “Democracy anddictatorship revisited.” Public Choice .
Chen, Jowei. 2008. Are Poor Voters Easier to Buy Off with Money? A Natural Experimentfrom the 2004 Florida Hurricane Season. University of Michigan, Ann Arbor: Miemo.
Chen, Jowei. 2009. When Do Government Benefits Influence Voters’ Behavior? The Effectof FEMA Disaster Awards on US Presidential Votes. University of Michigan, Ann Arbor:Miemo.
CIESIN. 2005. Gridded Population of the World Version 3: Population Grids. Technical reportCenter for International Earth Science Information Network and Centro Internacional deAgricultura Tropical and Socioeconomic Data and Application Centrer, Columbia UniversityPalisades, NY: .URL: http://sedac.ciesin.columbia.edu/gpw/
Cohen, Charles and Erik D. Werker. 2008. “The Political Economy of ”Natural” Disasters.”Journal of Conflict Resolution 52:795–819.

BIBLIOGRAPHY 91
Crepaz, Markus M. L. 1996. “Consensus Versus Majoritarian Democracy: Political Institutionsand their Impact on Macroeconomic Preformance and Industrial Disputes.” ComparativePolitical Studies 29:4–26.
Crepaz, Markus M. L. 1998. “Inclusion versus Exclusion: Political Institutions and WelfareExpenditures.” Comparative Politics 31(61-80).
de Silva, M.W. Amarasiri. 2009. “Ethnicity, politics and inequality: post- tsunami humanitarianaid delivery in Ethnicity, politics and inequality: post- tsunami humanitarian aid deliveryin Ethnicity, politics and inequality: post-tsunami humanitarian aid delivering in AmparaDistrict, Sri Lanka.” Disasters 33(2):253–273.
Dilley, Maxx, Robert S. Chen, Uwe Deichmand, Arthur L. Lerner-Lam, Margaret Arnold,Jonathan Agwe Piet Buys, Oddvar Kjekstad, Bradfield Lyon and Gregory Yetman. 2005.Natural Disaster Hotspots. A Global Risk Analysis. Disaster Risk Managemnet Series 5 WorldBank Hazard Management Unit Washington D.C.: .
Downs, Anthony. 1957. An Economic Theory of Democracy. New York: Harper.
EM-DAT. 2012.URL: www.emdat.be
Fearon, James D and David D. Laitin. 2003. “Ethnicity, Insurgency, and Civil War.” AmericanPolitical Science Review 97(1):75–90.
Flores, Alejandro Quiroz and Alastair Smith. 2010. “Surviving Disasters.” Unpublished.
Fothergill, Alice, Enriqie G.M. Maestas and JoAnne DeRouen Darlinton. 1999. “Race, Ethnicity,and Disasters in the United States: A Review of the Literature.” Disasters 23(2):156–173.
Gabel, Mathew and Simon Hix. 2005. “Reconsidering the economic effects of constitutions.”Paper.
Garrett, Thomas A. and Russel S. Sobel. 2003. “The Political Economy of FEMA DisasterPayments.” Economic Inquiry 41:496–509.
Geddes, Barbara. 2006. “Why Parties and Elections in Authoritarian Regimes?” Revisedversion of a paper prepared for presentation at the annual meeting of the American PoliticalScience Association.
Gerring, John and S.C. Moreno. 2010. “Are parliamental systems better?” Comparative PoliticalStudies 42(3):327–353.
Gopalakrishnan, Channat and Norio Okada. 2007. “Designing new institutions for implement-ing integrated disasters risk manegement: key elements and future directions.” Disasters31(4):353–372.
Healy, Andrew and Neil Malhotra. 2009. “Myopic Voters and Natural Disaster Policy.” Amer-ican Political Science Review 103(3):387–406.
IPCC. 2012. Summary for Policymakers. In Intergovernmental Panel on Climate Change SpecialReport on Managing the Risks of Extreme Events and Disasters to Advance Climate ChangeAdaptation, ed. C. B. Field, V. Barros, T.F. Stocker, D. Qin, D. Dokken, K. L. Ebi, M. D.Mastrandrea, K. J. Mach, G.-K. Plattner, S. Allen, M. Tignor and P. M. Midgley. Cambridge,UK and New York, USA: Cambridge University Press.
Kahn, Mathew E. 2005. “The Death Toll From Natural Disasters: The Role of Income, Geog-raphy, and Institutions.” The Review of Economics and Statistics 87(2):271–284.

92 BIBLIOGRAPHY
King, Gary, Michael Tomz and Jason Wittenberg. 2000. “Makeing the Most of StatisticalAnalyses: Improving Interpretation and Presentation.” American Journal of Political Science44(2):247–261.
King, Gary, Robert O. Keohane and Sidney Verba. 1994. Designing Social Inquiry. Princeton:Princeton University Press.
Knutsen, Carl Henrik. 2011. “Which democracies prosper? Electoral rules, form of governmentand economic growth.” Electoral Studies 30:83–90.
Lake, David A. and Matthew A. Baum. 2001. “The Invisible Hand of Democracy : PoliticalControl and the Provision of Public Services.” Comparative Political Studies 34:587–621.
Linz, J.J. 1990. “The perils of presidentialism.” Journal of Democracy 1(1):51–69.
Long, J. Scott and Jeremy Freese. 2006. Regression Models for Categorical Dependent VariablesUsing Stata. 2 ed. Texas: Stata Press.
Marshall, Monty G. and Keith Jagger. 2002. Polity IV Project. Center for systemic peace.
Mileti, Dennis S. 1999. Disasters by Design: A Reassesment of Natural Disasters in the UnitedStates. Washington D.C.: Joseph Henry Press.
Min, Brian, Lars-Erik Cederman and Andreas Wimmer. 2010. “Ethnic exclusion, economicgrowth, and civil war.” Typescript.
Mustafa, Daanish. 2003. “Reinforcing Vulnerability? Disaster Relief, Recovery, and Responseto the 2001 Flood in Rawalpindi, Pakistan.” Environmental Hazards 5:71–82.
Nordhaus, William D. 2006. “G-Econ database.”.URL: gecon.yale.edu
Nordhaus, William D., Qazi Azam, David Corderi, Kyle Hood, Nadejda Makarova Victor,Mukhtar Mohammed, Alexandra Miltner and Jyldyz Weiss. N.d. “The G-Econ Database onGridded Output: Methods and Data.” Typescript, Yale University.
North, Douglass C. 1991. “Institutions.” Journal of Economic Perspectives 5(1):97–112.
Olson, Mancur. 1965. The Logic of Collective Action. MA: Harvard University Press.
Olson, Mancur. 1982. The Rise and Decline of Nations. Economic Growth, Staflation and SocialRigities. New Haven: Yeal University Press.
Olson, Mancur. 1993. “Dictatorship, democracy and development.” The American PoliticalScience Review 83(3):567–576.
Østby, Gudrun. 2011. Horizontal Inequalities and Political Violence PhD thesis University ofOslo.
Parry, M.L., O.F. Canziani, J.P. Palutikof, P.J. van der Linden and C.E. Hanson. 2007. Sum-mary for Policymakers. Technical report Intergovernmental Panel on Climate Change.URL: http://www.ipcc.ch/pdf/assessment-report/ar4/wg2/ar4-wg2-spm.pdf
Peacock, W.P., B.H. Morrow and H. Gladwin. 1997. Hurrican Andrew: Ethnicity, Gender, andthe Sociology of Disasters. New York: Routledge.
Peduzzi, Pascal, H. Dao, C. Herold and F. Mouton. 2009. “Assessing global exposure andvulnerability towards natural hazards: the Disaster Risk Index.” Natural Hazards and EarthSystem Science (9):1149–1159.

BIBLIOGRAPHY 93
Pelling, Mark. 2003. The Vulnerabilities of Cities: natural disasters and social resilience. Lon-don, UK: Earthscan Publications Ltd.
Persson, Torsten, Gerard Roland and Guido Tabellini. 1997. “Separation of Powers and PoliticalAccountability.” The Quarterly Journal of Economics p. 1163.
Persson, Torsten, Gerard Roland and Guido Tabellini. 2000. “Comparative politics and publicfinance.” Journal of Political Economy 108(6):1121–1161.
Persson, Torsten, Gerard Roland and Guido Tabellini. 2007. “Electoral Rules and GovernmentSpending in Parliamentary Democracies.” Quarterly Journal of Political Science 20:1–34.
Persson, Torsten and Guido Tabellini. 1996. “Federal Fiscal Constitutions: Risk Sharing andRedistribution.” Journal of Political Economy 104(5):979–1009.
Persson, Torsten and Guido Tabellini. 2003. The Economic Effect of Constitutions. Cambridge,Massachusetts: MIT Press.
Persson, Torsten and Guido Tabellini. 2004. “Constitutions and Economic Policy.” The Journalof Economic Perspectives 18(1):75–98.
Plumper, Thomas and Eric Neumayer. 2009. “Famine mortality, rational political inactivity,and international food aid.” World Development .
Popper, Karl. 1964. The Logic of Scientific Discovery. New York: Harper and Row.
Powell, G. Bingham. 2000. Elections and Instruments of Democracy - Majoritarian and Pro-portional Visions. New Haven: Yale University Press.
Przeworski, Adam, Michael E. Alvarez, Jose Antonio Cheibub and Fernando Limongi. 2000.Democracy and Development. Political Institutions and Well-Being in the World, 1950–1990.Cambridge: Cambridge University Press.
Przeworski, Adam, Susan Stokes and Bernard Manin. 1999. Democracy, Accountability andRepresentation. Cambridge: Cambridge University Press.
Raschky, P. A. 2008. “Institutions and the losses from natural disasters.” Natural Hazards andEarth System Science 8:627–634.
Rød, Espen Geelmuyden. 2012. Institutions Under Authoritarianism and Coups: 1950-2008.Master’s thesis University of Oslo Oslo: .
Schjølset, Anita. 2008. Institutional Variance of the Democratic Peace, 1816-2002: Electoral,Executive, and Federal Systems in Time and Space PhD thesis University of Southern Cali-fornia.
Sen, Amartya. 1983. Poverty and Famines: An essay on entitlement and deprevation. Oxford,UK: Oxford University Press.
Skog, Ole-Jørgen. 2004. A forklare sosial fenomener: En regresjonsbasert tilnærming. Oslo:Gyldendal.
Skoufias, Emmanuel. 2003. “Economic Crisis and Natural Disasters: Coping Strategies andPolicy Implications.” World Development 31(7):1087–1102.
Sobel, Russel S. and Peter T. Leesen. 2006. “Governments respons to Hurricane Katrina: Apublic choice analysis.” Public Choice 127:55–73.

94 BIBLIOGRAPHY
Stromberg, David. 2003. “Optimal Campaigning in Presidential Elections: The Probability ofBeing Florida.” Institute for International Economic Studies .
Stromberg, David. 2007. “Natural Disasters, Economic development and, Human Aid.” Journalof Economic Perspectives 21(3):199–222.
Tilly, Charles. 1978. From Mobilization to Revolution. New York: McGraw-Hill.
Tollefsen, Andreas Forø, Havard Strand and Halvard Buhaug. 2012a. “PRIO-GRID.”.URL: http://www.prio.no/CSCW/Datasets/PRIO-Grid/
Tollefsen, Andreas Forø, Havard Strand and Halvard Buhaug. 2012b. “PRIO-GRID: A unifiedspatial data structure.” Peace Reseach Institute Oslo.
Toya, Hideki and Mark Skidmore. 2007. “Economic Development and the Impacts of NaturalDisasters.” Economic Letters 94(1):20–25.
Weber, Max. 1978. Economy and Society: An Outline of Interpretative Sociology. Berkeley,CA: University of California Press.
White, G. F. 1974. Natural Hazards: Local, National, Gloabl. New York: Oxford UniversityPress.
Wig, Tore. 2011. The Correlates of Subordination: Transaction costs and the Design of MilitaryAlliances, 1815-2003. Master’s thesis University of Oslo.
Wisner, Ben and Henry R. Luce. 1993. “Disaster Vulnerability: Scale, Power and Daily Life.”GeoJournal 30(2):127–140.
Wucherpfennig, Julius, Nils B. Weidmann, Luc Girardin, Lars-Erik Cederman and AndreasWimmer. 2011. “Politically Relevant Ethnic Groups across Space and Time: Introducing theGeoEPR Dataset.” Conflict Management and Peace Science (28):423.