rum jungle resources ltd annual report 2015 …2015/09/29 · rum jungle resources ltd annual...
TRANSCRIPT

RUM JUNGLE RESOURCES LTD
RUM JUNGLE RESOURCES LTD Annual Report 2015
For
per
sona
l use
onl
y

RUM JUNGLE RESOURCES LTD
CORPORATE DIRECTORY
Directors: Mr David Muller Chairman and Non-Executive Director
Mr Jeff Landels Non-Executive Director
Mr Chris Tziolis Managing Director
Company Secretary: Mr Bruce Arnold Chief Financial Officer
Rum Jungle Resources Ltd ABN: 33 122 131 622
Notice of Annual General Meeting: Annual General Meeting of Rum Jungle Resources Ltd
Held at: Level 26
181 William Street,
Melbourne, Vic 3000
Time: 11.00 am
Date: Friday 20th
November 2015
Head Office: Unit 20 Post
90 Frances Bay Drive GPO Box 775
Stuart Park, Northern Territory, 0820 Darwin NT 0801
Telephone: + 61 8 8942 0385
Facsimile: + 61 8 8942 0318
Registered Office: Unit 20
90 Frances Bay Drive
Stuart Park, Northern Territory, 0820
Share Registry: Computershare Investor Services Pty Limited
Yarra Falls
452 Johnston Street
Abbotsford, Victoria 3067
Telephone: 1300 850 505 (within Australia)
+61 3 9415 4000 (outside Australia)
Facsimile: + 61 3 9473 2570
Auditor: KPMG
Chartered Accountants
18 Smith Street
Darwin, Northern Territory, 0800
Stock Exchange Listing: ASX Limited
Securities Code RUM: Shares
E-mail: [email protected]
Website Address: www.rumjungleresources.com.au
For
per
sona
l use
onl
y

RUM JUNGLE RESOURCES LTD
MISSION STATEMENT
Rum Jungle Resources Ltd’s (RUM) strategic intent is to create shareholder value through the discovery,
development and operation of fertiliser and industrial mineral projects, located in close proximity to existing
transport infrastructure, with a primary focus on the Northern Territory of Australia.
Rum Jungle Resources Ltd’s portfolio of projects includes the global scale Ammaroo Phosphate Project, a portfolio
of Sulphate of Potash projects and the Dingo Hill Silica Project. The Ammaroo Phosphate project is a potential
large scale, higher capital, global scale industrial project that with the participation of a fertiliser industry partner,
could be realised in the medium term. The Karinga Lakes Sulphate of Potash Project and potentially the Dingo Hole
Silica Project offer opportunities to potentially develop small scale, low capital start-up operations that could
enable operating cash flows for the company over the nearer term.
ANNUAL REPORT – 30 JUNE 2015
Contents Page
Operations Review 3
Resource Register 27
Directors’ Report 29
Remuneration Report (forming part of directors’ report) 34
Corporate Governance 41
Auditor’s Independence Declaration 42
Annual Financial Report – 30 June 2015 43
Tenement Schedule 75
Additional Shareholder Information 76
For
per
sona
l use
onl
y

RUM JUNGLE RESOURCES LTD
Page 2
CHAIRMAN’S LETTER
Transforming an idea into an industrial reality is always an extraordinary journey for those involved. The consolidation of the phosphate resource at Ammaroo in the Northern Territory and completion of a PFS is now a reality; the international recognition of this world-class resource is firmly established.
Many have joined us on this journey over the last year. Whether you are a shareholder, future customer, supplier, financier, or a part of our local community, we look forward to continuing this journey with you over the coming years.
Over shadowed by the many turbulent issues surrounding us today there is one positive and consistent political and social theme that emerges. That is the recognition for the growing need for food and effective fertilisers.
Whilst most phosphate raw materials for fertilisers are finite resources in many countries, not many such countries offer the stability of Australia. With that said, at this point in time, there are challenges in attracting capital to Australia to underpin the development of large green-field projects. International concerns about Australia’s industry costs, over-reach with environmental regulation and land access challenges are recurring themes. However, in reality, a significant drop in the Australian dollar, real reductions in industry costs as the mining boom winds down may make the next few years the best time in Australia’s recent history to develop the next generation of projects. Furthermore, most of the world’s phosphate supply comes out of Northern Africa and the Middle East where certainty of supply remains questionable under a number of realistic scenarios. I am confident that the broader global community will realise, in due course, the potential of Australia’s undeveloped phosphate resources which could make the Ammaroo Phosphate project a reality. The Prefeasibility study completed by WorleyParsons at Ammaroo clearly demonstrates that a major project could be feasible. The challenge is to find willing partners prepared to take risk at this time. To this end we have been closely working with Melbourne based advisors, Flagstaff Partners.
The growing use of fertilisers translates into an outlook for strong continued growth in demand into the foreseeable future. We will continue to market our project into an international field, which sooner or later must look favorably upon Australia.
During the year we also gained considerable international experience in the Sulphate of Potash (SOP) business, highlighted by the completion of a scoping study by the giant government Chinese group, CICCC targeting SOP production at our Karinga Lakes project in the Northern Territory. The positive aspects of this study have led us to acquire for further evaluation, the biggest tenement portfolio of salt lakes with SOP potential in Australia.
A frequent bonus in conducting mineral exploration, exploring for one commodity often leads to the discovery of another. Such was the case at the Ammaroo phosphate project where our attention was diverted to a large, white outcrop of chalcedony which, on further investigation, is a form of silica that may be convertible to high purity quartz, which can be of extreme value. Experts in Germany are currently conducting processing test-work on a small bulk sample to ascertain whether or not high purity quartz can be produced.
Whilst there is current doom and gloom in the Australian mining industry, the current pricing and outlook for fertilser minerals remains positive. We will continue to move forward with the development of a small scale start-up in either sulphate of potash or silica (if viable) in order to provide operating cash flows to the company over the nearer term. Furthermore, we will continue to engage the global and regional fertilizer industry with a view of establishing an industry joint venture to advance the global scale Ammaroo phosphate project toward development. We will continue to create the opportunity for shareholder value by achieving our development milestones and work within our budgets as determined by the capital you have provided us.
Finally, I would like to thank all staff and the new CEO, Chris Tziolis, for progressing the company through several milestones in this difficult time.
David Muller Chairman
For
per
sona
l use
onl
y

RUM JUNGLE RESOURCES LTD
OPERATIONS REVIEW
Page 3
HIGHLIGHTS AND ACHIEVEMENTS
Health, Safety, Environment and Community
Over 5,210 hours of field work were conducted throughout the year. There were no Lost Time Injuries (LTIs)
reported and no reportable environmental incidents throughout the year
Two community consultations were conducted with the Traditional Owners of the land associated with the
Ammaroo Phosphate Project and another community consultation was conducted with the Traditional Owners
of the land associated with the Karinga Lakes Project
Corporate
Completed a leadership transition with the appointment of Mr Chris Tziolis as Managing Director and the
transition of Mr David Muller to the role of Non-Executive Chairman
Appointed Flagstaff Partners, a leading independent corporate advisory firm, as advisors to coordinate a formal
process to introduce key fertiliser industry players and financial investors, who understand the longer term
strategic value in Rum Jungle Resources’ portfolio of projects, with a view of attracting a cornerstone industry
investor to one or both of the main projects. This process remains ongoing and a number of fertiliser industry
participants have signed confidentiality agreements and reviewed the company’s data room
Senior management participated in the Australian Federal Government led trade delegation to India in January
2015
Investor and company presentations were made at the Mining the NT conference in August 2014, the
Melbourne Microcap Investment Seminar in October 2014, the Minerals Council of Australia – NT Minerals
Summit in December 2014
Conducted international roadshows to India, China, the Middle East and North America and participated in the
CRU Global Phosphates conference in March 2015
Received a Research and Development Incentive Receipt of $922,000 in February 2015
An internal reorganisation of the Group’s assets has been completed such that the wholly owned subsidiary
Territory Phosphate holds all the phosphate tenements. Approval has also been obtained to restructure potash
tenements so they can be held by a wholly owned subsidiary (Newco Territory Potash) forming project
companies. This is to more readily facilitate future investment at the specific asset or project level
Heads of Agreement with the Port of Darwin, originally signed in November 2013, extended until 31 December
2017
Robert Annells retired from being a Director with effect 30 June 2015
For
per
sona
l use
onl
y

RUM JUNGLE RESOURCES LTD
OPERATIONS REVIEW
Page 4
Sulphate of Potash
The Karinga Lakes Scoping Study, conducted by China International Consulting Corporation (CICCC), was
completed and results announced to the ASX on 22 December 2014 supporting the potential for production
of either sulphate of potash or potassium magnesium sulphate fertiliser
A maiden resource of 13 million tonnes K2SO4 was announced for the Lake Mackay South Joint Venture, with
Toro Energy, of which RUM has 51% of the potash rights
A maiden resource of 4.5 million tonnes of K2SO4 was announced for Lake Hopkins
Titles were granted by the South Australian Government over Lake Frome and a portion of Lake Torrens
which both have sulphate of potash potential. Access to these tenements will be determined by future
discussions with Traditional owners. Titles were issued over Lake Macdonald by the WA Government and an
application made to the NT Government over the NT portion
The NT Government granted a right to negotiate for both the Lake Amadeus and the NT portion of Lake
Macdonald projects which are both on Aboriginal Land where the Aboriginal Land Rights Act applies
Phosphate
The Ammaroo Phosphate Project preliminary feasibility study was completed and released to the ASX 29
September 2014. The WorleyParsons managed study supports the economic potential of the project to be
developed as a rock export operation or for downstream phosphate fertiliser production using proven
technologies. The project valuations were updated in September 2015 due to the significant weakening of the
Australian dollar and lower capital and operating costs in the Australian context
A resource upgrade to the Ammaroo Phopshate Resource was announced on 9 December 2014 and has not
changed since. Estimated JORC resources total 1.145 billion tonnes P2O5 at an average grade of 14% P2O5 using
a 10% P2O5 cut-off or 348 million tonnes at an average of 18% P2O5 using a 15% P2O5 cut-off
A significant rehabilitation program was completed on the Ammaroo tenements freeing up cash currently held
as rehabilitation security
Silica (High Purity Quartz)
The Dingo Hole Silica deposit was discovered during the conduct of phosphate exploration activities in the
Ammaroo Project area. Separation of the silica tenements from the phosphate tenements is underway
Promising assay results of initial rock chips were announced to the ASX on 20 July 2015. A phase of testwork
to determine if silica can be processed to a High Purity Quartz standard is currently being conducted by
Dorfner Anzaplan, based in Germany
For
per
sona
l use
onl
y
RUM JUNGLE RESOURCES LTD
OPERATIONS REVIEW
Page 5
WORK HEALTH, SAFETY, ENVIRONMENT AND COMMUNITY
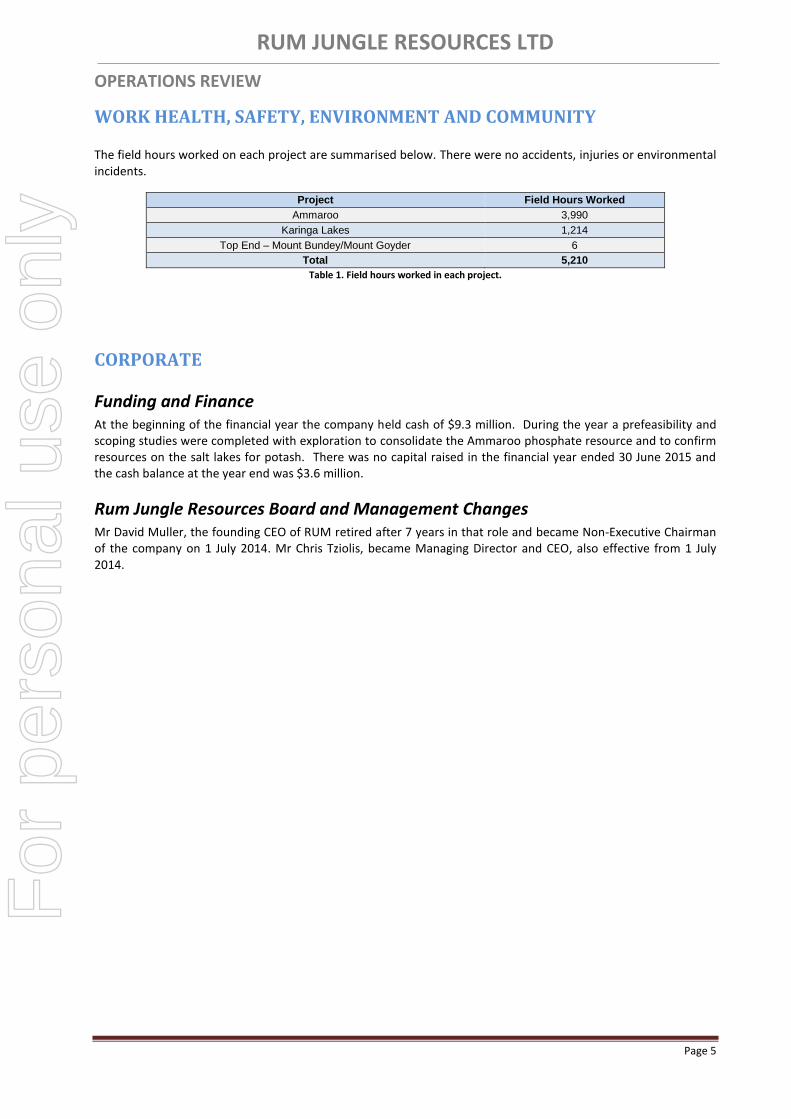
The field hours worked on each project are summarised below. There were no accidents, injuries or environmental incidents.
Project Field Hours Worked
Ammaroo 3,990
Karinga Lakes 1,214
Top End – Mount Bundey/Mount Goyder 6
Total 5,210
Table 1. Field hours worked in each project.
CORPORATE
Funding and Finance At the beginning of the financial year the company held cash of $9.3 million. During the year a prefeasibility and scoping studies were completed with exploration to consolidate the Ammaroo phosphate resource and to confirm resources on the salt lakes for potash. There was no capital raised in the financial year ended 30 June 2015 and the cash balance at the year end was $3.6 million.
Rum Jungle Resources Board and Management Changes Mr David Muller, the founding CEO of RUM retired after 7 years in that role and became Non-Executive Chairman of the company on 1 July 2014. Mr Chris Tziolis, became Managing Director and CEO, also effective from 1 July 2014.
For
per
sona
l use
onl
y
RUM JUNGLE RESOURCES LTD
OPERATIONS REVIEW
Page 6
PHOSPHATE PROJECTS
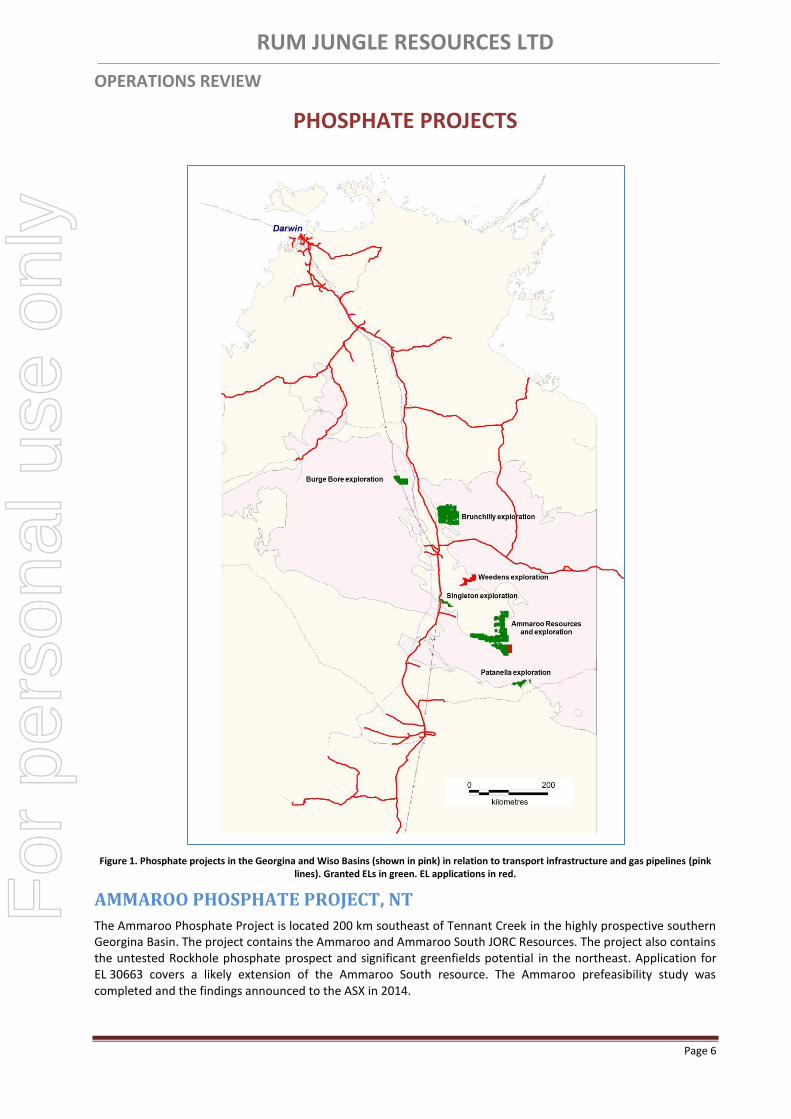
Figure 1. Phosphate projects in the Georgina and Wiso Basins (shown in pink) in relation to transport infrastructure and gas pipelines (pink lines). Granted ELs in green. EL applications in red.
AMMAROO PHOSPHATE PROJECT, NT
The Ammaroo Phosphate Project is located 200 km southeast of Tennant Creek in the highly prospective southern Georgina Basin. The project contains the Ammaroo and Ammaroo South JORC Resources. The project also contains the untested Rockhole phosphate prospect and significant greenfields potential in the northeast. Application for EL 30663 covers a likely extension of the Ammaroo South resource. The Ammaroo prefeasibility study was completed and the findings announced to the ASX in 2014.
For
per
sona
l use
onl
y
RUM JUNGLE RESOURCES LTD
OPERATIONS REVIEW
Page 7
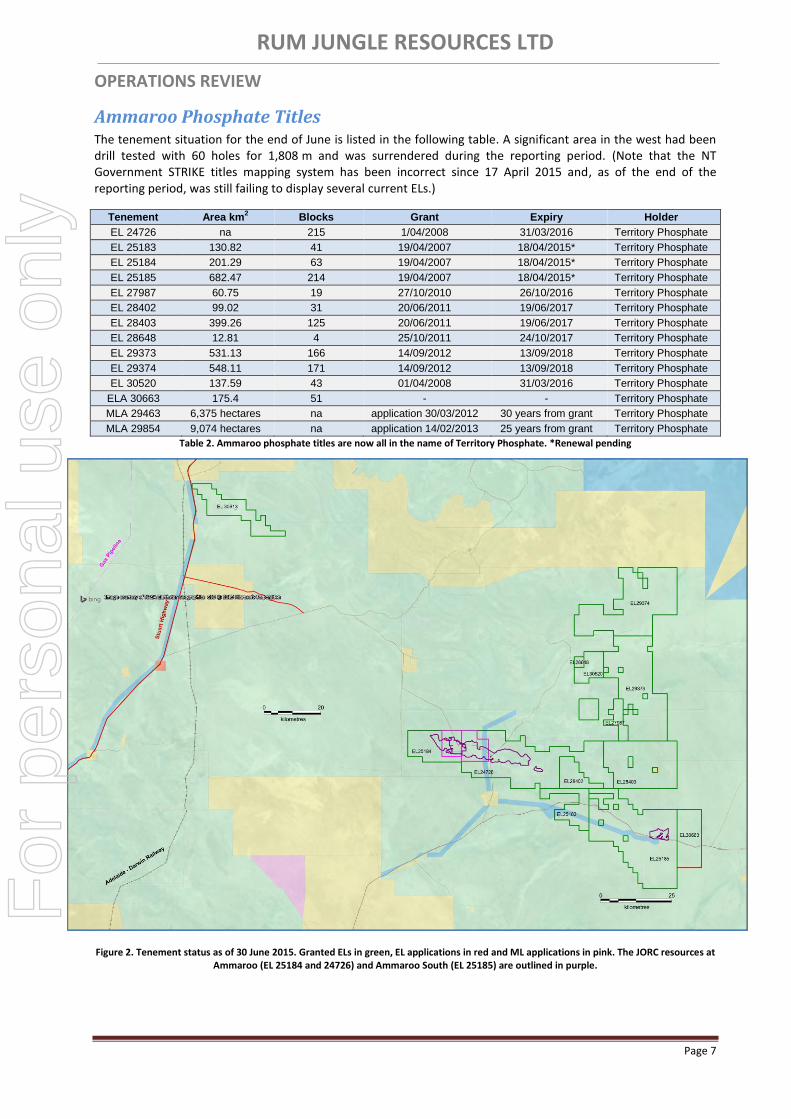
Ammaroo Phosphate Titles The tenement situation for the end of June is listed in the following table. A significant area in the west had been drill tested with 60 holes for 1,808 m and was surrendered during the reporting period. (Note that the NT Government STRIKE titles mapping system has been incorrect since 17 April 2015 and, as of the end of the reporting period, was still failing to display several current ELs.)
Tenement Area km2 Blocks Grant Expiry Holder
EL 24726 na 215 1/04/2008 31/03/2016 Territory Phosphate
EL 25183 130.82 41 19/04/2007 18/04/2015* Territory Phosphate
EL 25184 201.29 63 19/04/2007 18/04/2015* Territory Phosphate
EL 25185 682.47 214 19/04/2007 18/04/2015* Territory Phosphate
EL 27987 60.75 19 27/10/2010 26/10/2016 Territory Phosphate
EL 28402 99.02 31 20/06/2011 19/06/2017 Territory Phosphate
EL 28403 399.26 125 20/06/2011 19/06/2017 Territory Phosphate
EL 28648 12.81 4 25/10/2011 24/10/2017 Territory Phosphate
EL 29373 531.13 166 14/09/2012 13/09/2018 Territory Phosphate
EL 29374 548.11 171 14/09/2012 13/09/2018 Territory Phosphate
EL 30520 137.59 43 01/04/2008 31/03/2016 Territory Phosphate
ELA 30663 175.4 51 - - Territory Phosphate
MLA 29463 6,375 hectares na application 30/03/2012 30 years from grant Territory Phosphate
MLA 29854 9,074 hectares na application 14/02/2013 25 years from grant Territory Phosphate
Table 2. Ammaroo phosphate titles are now all in the name of Territory Phosphate. *Renewal pending
Figure 2. Tenement status as of 30 June 2015. Granted ELs in green, EL applications in red and ML applications in pink. The JORC resources at Ammaroo (EL 25184 and 24726) and Ammaroo South (EL 25185) are outlined in purple.
For
per
sona
l use
onl
y
RUM JUNGLE RESOURCES LTD
OPERATIONS REVIEW
Page 8
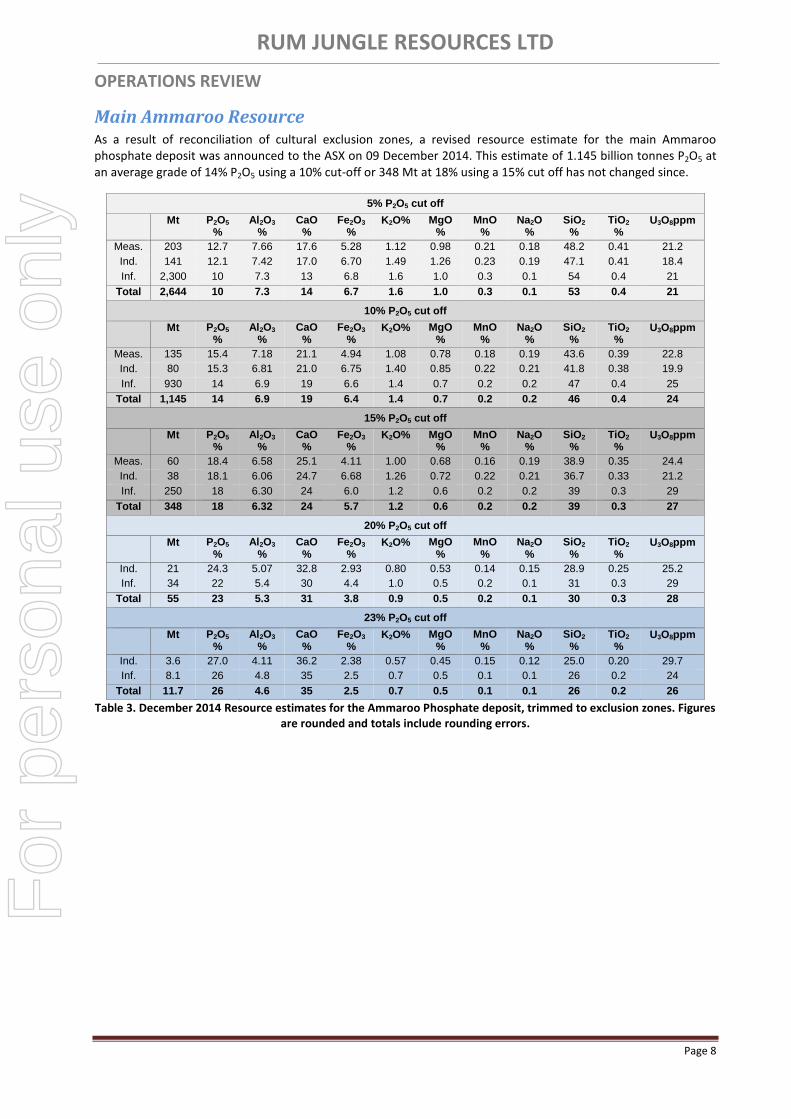
Main Ammaroo Resource As a result of reconciliation of cultural exclusion zones, a revised resource estimate for the main Ammaroo phosphate deposit was announced to the ASX on 09 December 2014. This estimate of 1.145 billion tonnes P2O5 at an average grade of 14% P2O5 using a 10% cut-off or 348 Mt at 18% using a 15% cut off has not changed since.
5% P2O5 cut off
Mt P2O5
% Al2O3
% CaO
% Fe2O3
% K2O% MgO
% MnO
% Na2O
% SiO2
% TiO2
% U3O8ppm
Meas. 203 12.7 7.66 17.6 5.28 1.12 0.98 0.21 0.18 48.2 0.41 21.2
Ind. 141 12.1 7.42 17.0 6.70 1.49 1.26 0.23 0.19 47.1 0.41 18.4
Inf. 2,300 10 7.3 13 6.8 1.6 1.0 0.3 0.1 54 0.4 21
Total 2,644 10 7.3 14 6.7 1.6 1.0 0.3 0.1 53 0.4 21
10% P2O5 cut off
Mt P2O5
% Al2O3
% CaO
% Fe2O3
% K2O% MgO
% MnO
% Na2O
% SiO2
% TiO2
% U3O8ppm
Meas. 135 15.4 7.18 21.1 4.94 1.08 0.78 0.18 0.19 43.6 0.39 22.8
Ind. 80 15.3 6.81 21.0 6.75 1.40 0.85 0.22 0.21 41.8 0.38 19.9
Inf. 930 14 6.9 19 6.6 1.4 0.7 0.2 0.2 47 0.4 25
Total 1,145 14 6.9 19 6.4 1.4 0.7 0.2 0.2 46 0.4 24
15% P2O5 cut off
Mt P2O5
% Al2O3
% CaO
% Fe2O3
% K2O% MgO
% MnO
% Na2O
% SiO2
% TiO2
% U3O8ppm
Meas. 60 18.4 6.58 25.1 4.11 1.00 0.68 0.16 0.19 38.9 0.35 24.4
Ind. 38 18.1 6.06 24.7 6.68 1.26 0.72 0.22 0.21 36.7 0.33 21.2
Inf. 250 18 6.30 24 6.0 1.2 0.6 0.2 0.2 39 0.3 29
Total 348 18 6.32 24 5.7 1.2 0.6 0.2 0.2 39 0.3 27
20% P2O5 cut off
Mt P2O5
% Al2O3
% CaO
% Fe2O3
% K2O% MgO
% MnO
% Na2O
% SiO2
% TiO2
% U3O8ppm
Ind. 21 24.3 5.07 32.8 2.93 0.80 0.53 0.14 0.15 28.9 0.25 25.2
Inf. 34 22 5.4 30 4.4 1.0 0.5 0.2 0.1 31 0.3 29
Total 55 23 5.3 31 3.8 0.9 0.5 0.2 0.1 30 0.3 28
23% P2O5 cut off
Mt P2O5
% Al2O3
% CaO
% Fe2O3
% K2O% MgO
% MnO
% Na2O
% SiO2
% TiO2
% U3O8ppm
Ind. 3.6 27.0 4.11 36.2 2.38 0.57 0.45 0.15 0.12 25.0 0.20 29.7
Inf. 8.1 26 4.8 35 2.5 0.7 0.5 0.1 0.1 26 0.2 24
Total 11.7 26 4.6 35 2.5 0.7 0.5 0.1 0.1 26 0.2 26
Table 3. December 2014 Resource estimates for the Ammaroo Phosphate deposit, trimmed to exclusion zones. Figures are rounded and totals include rounding errors.
For
per
sona
l use
onl
y

RUM JUNGLE RESOURCES LTD
OPERATIONS REVIEW
Page 9
Figure 3. Mineralised domains, drill holes and cultural exclusion zones. The blue arrows indicate where mineralisation is open laterally at 10%. The resources quoted have been trimmed to exclude the cultural exclusion zones shown above.
The Limestone Bore area includes approximately 4 km of potential mineralised strike tested by a single traverse of 200 m to 400 m spaced RC holes as shown in blue in Figure 3. This area has insufficient drilling for estimation of Mineral Resources. Broadly spaced drilling in this area suggests the presence of an Exploration Target of around 50 Mt to 100 Mt at 8% to 10% P2O5 at a cut off grade of 5% P2O5, and 10 to 20 Mt at 12% to 15% P2O5 at a cut off of 10% P2O5. These estimates are based on broad spaced drilling. The potential quantities and grades are conceptual in nature. There has been insufficient exploration to estimate a Mineral Resource and it is uncertain that future exploration will result in estimation of a Mineral Resource.
Ammaroo South Resource On 12 June 2014, a JORC 2012 Inferred phosphate resource, estimated at 70 Mt at 13% P2O5 using a 10% cut-off, was announced for Ammaroo South on EL 25185. This has not changed since.
Cut Off P2O5%
Mt P2O5% Al2O3% CaO% Fe2O3% K2O% MgO% MnO2% Na2O% SiO2% TiO2% U3O8 ppm
5 170 9.5 5.0 13 1.8 0.6 0.3 0.09 0.07 66 0.3 21
10 70 13 3.8 18 1.4 0.4 0.3 0.06 0.06 59 0.2 26
15 13 17 2.8 25 1.1 0.3 0.2 0.05 0.06 50 0.2 33
Table 4. Ammaroo South Inferred Resource.
In addition to the above, there are two areas of exploration potential adjacent to Ammaroo South, where broadly spaced drilling suggests the presence of an Exploration Target of around 200 Mt to 400 Mt at 7% to 10% P2O5 at a cut off grade of 5% P2O5, and 50 to 100 Mt at 12% to 15% P2O5 at a cut off of 10% P2O5. This was reported to the market previously and in the previous annual report. The estimate has not changed since.
For
per
sona
l use
onl
y

RUM JUNGLE RESOURCES LTD
OPERATIONS REVIEW
Page 10
Ammaroo Prefeasibility Study The initial Ammaroo Prefeasibility Study was completed and announced in September 2014. Completion of the preliminary feasibility study supported the economic and technical potential of the project to be developed as a phosphate rock concentrate export operation or for the production of phosphoric acid or the production of downstream ammonium phosphate fertilisers using proven technologies.
A reassessment and update of the Ammaroo preliminary feasibility study baseline economic evaluation was announced on 09 September 2015. The base case economic evaluations were reassessed to take into account long term forecasts of the Australian dollar’s value that are considerably lower than previous forecasts, potential labour and other cost reductions in the Australian capital project and resource industry environment, reductions to forecast costs of diesel and gas associated with significant reductions in global prices for oil going forward and a reassessment of phosphate commodity pricing assumptions based on recent price evolution.
This revaluation has led to a significant uplift in the potential value of the Ammaroo Phosphate Project.
Case A – 2 Million tonnes
per annum Phosphate Rock concentrate
Case B – 500,000 tonnes per annum Phosphoric
Acid (100% P2O5)
Case C – 1,020,000 tonnes per annum
Ammonium Phosphate Fertilisers
Indicative 50% Geared Post Tax NPV @ 8%
A$M 790 1,280 2,250
Geared Post Tax IRR % 31 26 27
Indicative NPVs are after tax project NPVs and do not include corporate overheads A$M: Millions of nominal Australian dollars
Table 5. August 2015 project valuation summary for Ammaroo Phosphate Project.
The Ammaroo phosphate project remains a global-scale, very long life resource, positioned in proximity to existing transport and gas infrastructure and located in a stable OECD country. Currently the majority of the world’s seaborne traded phosphate originates from the Middle East and Northern Africa whereby the long term security of supply remains uncertain under a number of realistic scenarios. Australia currently imports approximately 80% of its phosphate requirements from countries such as Morocco, China, Saudi Arabia and the USA.
Moreover, the production of phosphoric acid and the conversion of that acid to ammonium phosphate fertilisers to supply the southern Australian, Indian and regional Asian markets, could be positioned in the first quartile of the global cost curve for delivery to these markets. The low cost position is underpinned by very low costs of mining and processing as the ore is shallow and free digging and easily converted into a rock concentrate suitable as a local phosphoric acid plant feedstock, relatively low costs of gas for ammonia production and proximity to markets in Asia through Darwin and in southern Australian markets that are located in proximity to the southern terminus of the Central Australian Railway.
Rehabilitation A significant rehabilitation program was completed during the reporting period which will enable release of $430,000 guarantee for the environmental security bond held by the NT Department of Mines and Energy.
SINGLETON PHOSPHATE PROJECT, NT
EL 30613, close to the railway as shown in Figure 2. (previously), was granted this year. It covers potentially prospective rocks which were intersected in waterbores. Rum Jungle Resources undertook a detailed study of all available information on 14 waterbores and gamma logs in and near Singleton EL 30613. This led to the conclusion that the southeastern half of the title is the most prospective for Cambrian phosphate. Access is good and the area could be drill tested with only a few holes.
Tenement Area km2 Blocks Grant Expiry Holder
EL 30613 179.86 56 15/06/2015 14/06/2021 Territory Phosphate
Table 6. Singleton EL.
For
per
sona
l use
onl
y

RUM JUNGLE RESOURCES LTD
OPERATIONS REVIEW
Page 11
PATANELLA PHOSPHATE PROJECT, NT
This project, formerly called Lucy Creek, on the southern margin of the Georgina Basin contains the Patanella Prospect of approximately 50 Mt and 100 Mt at 10% to 17% P2O5 at a cut-off grade of 5% P2O5 or approximately 20 Mt to 50 Mt at 15% to 20% P2O5 at a cut-off grade of 10% P2O5. This was announced to the market on 24 June 2014 and has not changed since. Patanella is 265 km northeast of Alice Springs, 155 km southwest of the Ammaroo Resource and 100 km south-southeast of Ammaroo South. There was no on-ground work this year.
Tenement Area km2 Blocks Grant Expiry Holder
EL 24716 234.62 74 01/12/2005 30/11/2015 Territory Phosphate
EL 24724 50.74 16 02/12/2005 01/12/2015 Territory Phosphate
Table 7. Patanella Project ELs.
Figure 4. Patanella Prospect Exploration Target in pink, existing drillholes as blue dots and the prospective interval in grey. This extrapolation is based on encouraging rock chip and soil sampling conducted by Central Australian Phosphate and previously announced by them.
TENNANT EAST PHOSPHATE PROJECT, NT
Three contiguous phosphate ELs covering 1,640 km2 40-100 km east of Tennant Creek were surrendered as a result
of an in-house waterbore study and assessment of prospectivity which indicated that any phosphate present is likely to be below the standing water level, at least over the most prospective part of the tenement package.
For
per
sona
l use
onl
y

RUM JUNGLE RESOURCES LTD
OPERATIONS REVIEW
Page 12
BRUNCHILLY PHOSPHATE PROJECT, NT
The Brunchilly Project consists of three contiguous phosphate ELs near Tennant Creek. Depth to basement geophysical modelling, waterbores, soil sampling, and previous phosphate drilling all indicate prospectivity. There has only been wide-spaced drilling by Vale over part of the area. Group reporting has been approved and a proposed drilling program of ca 50 holes and budget has been prepared. There was no on-ground this year but areas known to contain culturally-sensitive sites have been relinquished.
Tenement Area km2 Blocks Grant Date Expiry Holder
EL 30222 768.25 236 15/10/2014 14/10/2020 Territory Phosphate
EL 30223 767.24 236 15/10/2014 14/10/2020- Territory Phosphate
EL 30224 789.94 243 15/10/2014 14/10/2020 Territory Phosphate
Table 8. Brunchilly phosphate titles.
Figure 5. Brunchilly Project area showing waterbores rated as highly prospective for phosphate by CSIRO/Vale shown in red. Minemakers’ soil sampling in pink. Previous wide-spaced drilling by Vale is shown as black dots. The north of the tenement package is the most
prospective and has never been drilled for phosphate.
For
per
sona
l use
onl
y

RUM JUNGLE RESOURCES LTD
OPERATIONS REVIEW
Page 13
BURGE BORE PHOSPHATE PROJECT, NT
This is a single EL that straddles the Central Australian Railway. Waterbore intercepts of phosphate indicate prospectivity and depth to basement modelling indicates a favourable setting straddling a basement ridge. The grant of Rum Jungle Resources’ application was delayed for over 12 months while NT Department of Mines and Energy sought advice from the Department of Land Resources Management regarding the Lake Woods Conservation Covenant which makes Lake Woods and the surrounds a Site of Conservation Significance. This only impinges on the east of the EL. An in-house waterbore study confirmed that any phosphate present is likely to be above the watertable over a significant part of the EL.
Tenement Area km2 Blocks Grant Date Expiry Holder
EL 30225 532.55 163 15/05/2015 14/05/2021 Territory Phosphate
Table 9. Burge Bore phosphate title.
Figure 6. Burge Bore EL 30225 showing waterbores used in the recent in-house study as blue dots. The previous widely-spaced Vale holes are labelled black dots. Note the proximity to the railway and gas pipeline (purple). The maximum extent of inundation of Lake Woods is much
larger than shown on this topo/satellite image, extending to Burge Bore itself.
AREA THIRTEEN PHOSPHATE, NT
The Area 13 Phosphate Project comprised EL 30221 and ELA 30661 which straddled the Central Australian Railway. Rum Jungle Resources undertook a comprehensive study of the transcripts of 56 waterbores in the area and found that the prospective Cambrian section is absent over much of the area. Furthermore, and most importantly, any Cambrian phosphate that might be present would be in, or below, the watertable and, in many cases, tens of metres below the standing water level. EL 30221 was surrendered and ELA 30661 was dropped.
For
per
sona
l use
onl
y

RUM JUNGLE RESOURCES LTD
OPERATIONS REVIEW
Page 14
WEEDENS PHOSPHATE, NT
This application is based on previous exploration in the mid 1990s for under-cover Tennant Creek IOCG which showed that the Cambrian section is at least 60 m thick. The ground has only been held once previously for phosphate exploration, by Vale from 2010 to 2012. They drilled only three holes to 59 m max, 5 km apart, all south of this application. Vale was side-tracked by iron in the south of their former tenement package and suddenly withdrew NT-wide without testing the area now applied for.
Tenement Area km2 Blocks Application Date Holder
ELA 30672 447.96 139 20/11/2014 Territory Phosphate
Table 10. Weedens phosphate title.
Figure 7. Previous work in the area of application (pink). Green dots are percussion holes targeted on basement IOCG. They intersected prospective Cambrian stratigraphy but were not tested for phosphate. Red dots are Vale holes, 5 km apart. Pink triangles are Vale rock chip
samples. The pink outcrops labelled Cmg are the few outcrops of target formation, which is otherwise under shallow surficial cover, superimposed on the topographic map. Pg is unprospective granite basement.
For
per
sona
l use
onl
y

RUM JUNGLE RESOURCES LTD
OPERATIONS REVIEW
Page 15
SULPHATE OF POTASH PROJECTS
Figure 8. Rum Jungle Resources’ potash projects and Lake Mackay JV.
For
per
sona
l use
onl
y

RUM JUNGLE RESOURCES LTD
OPERATIONS REVIEW
Page 16
KARINGA LAKES POTASH PROJECT, NT
The Karinga Lakes Potash project is located along the Lasseter Highway between Alice Springs and Uluru. The project contains a chain of dozens of dry salt lakes. The lake sediments and the underlying rocks contain potassium-rich brines, some of which are being fed from the Central Australian Groundwater Discharge Zone. The brines can be processed through solar evaporation and flotation to produce potash fertiliser minerals.
Two additional ELs were granted in the northwest and several reductions and relinquishments were made during the reporting period. The current tenement situation is shown below.
Tenement Area km2 Blocks Grant Expiry Holder
EL 24987 335.2 108 10/10/2006 09/10/2016 RUM
EL 25080 699 225 09/10/2006 08/10/2016 RUM
EL 28272 164.61 53 14/04/2011 13/04/2017 RUM
EL 28205 59.04 19 09/03/2011 08/03/2017 RUM
EL 28872 65.21 21 06/03/2012 05/03/2018 RUM
EL 30381 479.18 154 16/03/2015 15/03/2021 RUM
EL 30382 330.14 114 16/03/2015 15/03/2021 RUM
Table 11. Karinga Lakes potash titles.
Figure 9. Karinga Lakes Project titles as of 30 June 2015 with the JORC resource outlined in pink. The lake between the two parts of EL 25080 is a cultural exclusion zone.
Karinga Lakes Resource A JORC 2012 Resource upgrade was released to the market on 20 Feb 2014 and has not changed since.
Resource Category Potassium (tonnes)
K2SO4 (tonnes)
Schoenite (tonnes) Measured 2,600,000 5,800,000 13,000,000
Indicated 210,000 460,000 1,100,000
Inferred 950,000 2,100,000 4,900,000
Total 3,800,000 8,400,000 19,000,000
Table 12. Karinga Lakes Brine Resource (entries have been rounded).
The sulphate of potash (K2SO4) tonnage represents the in-situ brine with no recovery factor applied. It will not be possible to extract all of the contained brine by pumping of trenches; the amount which can be extracted depends on many factors including the permeability of the sediments, the drainable porosity, and the recharge dynamics of the aquifers.
For
per
sona
l use
onl
y

RUM JUNGLE RESOURCES LTD
OPERATIONS REVIEW
Page 17
Karinga Lakes Scoping Study The Karinga Scoping Study was completed and announced in December 2014. The scoping study supports the potential for future development of the Karinga Lakes potash project to produce either a sulphate of potash fertiliser or an intermediate product, a potassium magnesium sulphate fertiliser.
Two development scenarios were studied to a scoping study level of accuracy (+/- 40% capital and operating costs):
Scenario 1 - 125,000 tonnes per annum of sulphate of potash (SOP) for a minimum of 10 years of production Scenario 2 - 100,000 tonnes per annum of potassium magnesium sulphate (schoenite) for a minimum of 15 years
of production. Schoenite is an intermediate product of the sulphate of potash process. Compared to SOP, schoenite contains approximately half the amount of K2O and is therefore a lower value product than SOP. It does however contain magnesium which potentially represents a certain level of value. Scenario 2 is approximately one fifth the size of scenario 1 and represents the potential to develop a small scale start up, using a smaller number of lakes thus decreasing the environmental footprint and significantly lower energy usage due to lower volumes of brines being pumped smaller distances and avoiding the need to create steam that is used to convert schoenite to SOP. However, the market for schoenite as a fertiliser is less well defined than the market for SOP.
For scenario 1, 75% of the in-situ potash brine resource is in the Measured and Indicated JORC (2012) categories. Brine for scenario 1 is to be sourced from 25 salt lakes with a total in-situ brine resource of 8.36 million tonnes K2SO4. This resource is JORC (2012) compliant and was released to the ASX on 20 February 2014 and has not changed since. This resource incorporates only in-situ potash brines and does not include any potential deeper, ground water sources of potash brines that may exist and recharge that may be present in the system.
For scenario 2, 93% of the in-situ potash brine resource is in the Measured and Indicated JORC (2012) resource categories. Brine for Scenario 2 is to be sourced from 14 salt lakes with a total brine potash resource of 4.5 million tonnes K2SO4.
It should be noted that brine recovery rates are determined by the drainable porosity of the system; that is the rate at which brines can be extracted as determined by their ability to flow through the rock structures. This determines how much of the resource can be extracted over a given period of time. This limits the amount of the in-situ resource that can theoretically be extracted. However, this recovery factor could be influenced by ground water recharge, as it is believed the lakes are controlled by fracture zones, as well as rainfall recharge that could significantly increase the amount of recoverable K2O to underpin the project and perhaps even provide volume upside. Recharge rates remain uncertain.
In the case of scenario 1, without reasonable ground water and rainwater recharge, it may be difficult to extract sufficient brines from the system to achieve 125,000 tonnes per annum of SOP production for a minimum of 10 years. Another method of mitigating risk around resource recovery rates is through further exploration and the identification of deeper brine aquifers under the lakes that can be added to the resource and increase the recovery rates of the brines. If these deeper brine aquifers are present, a larger scale SOP production facility may be possible and bring to bear better economies of scale. For scenario 2, it is considered that there are sufficient recoverable brines in the known in-situ resource and without recharge to support the 15 year operation envisaged.
The following table summarises the scoping study level economic assumptions for the project:
Unit Scenario 1 Scenario 2
SOP Sold tpa 125,000 -
Schoenite Sold tpa - 100,000
Minimum Life years 10 15
Estimated wholesale market price $A/t $700-$800 $400-$450
Estimated operating costs including transport $A/t $300-$370 $140-$160
Estimated Total Capex $AM 340 93
Contingency included in Total Capex $AM 50 14
Notes tpa – tonnes per annum $A/t – Australian dollars per tonne $AM- millions of Australian dollars
Table 13. Summary results of the Karinga Lakes Scoping Study.
For
per
sona
l use
onl
y

RUM JUNGLE RESOURCES LTD
OPERATIONS REVIEW
Page 18
The Opex range in the table above depends on the gas supply scenario. The upper range is when gas is delivered by CNG from Alice Springs and the lower range assumes gas via pipeline from emerging regional production.
Rehabilitation A significant effort was put into rehabilitation during the reporting year and the NT Department of Mines and Energy should release part of the environmental guarantee security bond.
On-Going and Proposed Work Rain gauges and water level monitoring equipment were installed on Karinga Lakes to evaluate changes in water level after rain events. This data can be used to estimate yearly lake recharge due to rainfall events.
A work plan for deeper drilling at Karinga lakes has been submitted to the NT Department of Mines and Energy and is awaiting approval.
LAKE AMADEUS POTASH PROJECT, NT
Six contiguous ELs applications cover all of Lake Amadeus in the NT. The applications include 1,010 km2 of lake
area along a 130 km length. In the 1980s, a spring discharge just off the southern edge of the lake was analysed by the Bureau of Mineral Resources and found to contain 6,100 (mg/l = ppm K). This may suggest that shallow subsurface aquifers will be prospective for potassic brine. The eastern boundary of the project area is contiguous with the Karinga Lakes Project and corresponds to the ALRA/pastoral boundary. All the Lake Amadeus applications are on ALRA land. A work program has been sent to the Central Land Council and a meeting is planned for October 2015.
Tenement Area km2 Blocks Application Date Holder
ELA 30194 218.00 70 05/12/2013- RUM
ELA 30195 622.88 200 05/12/2013 RUM
ELA 30196 446.18 143 05/12/2013 RUM
ELA 30197 633.44 203 05/12/2013 RUM
ELA 30389 527.1 186 09/05/2014 RUM
ELA 30650 190.5 61 04/11/2014 RUM
Table 14. Lake Amadeus potash titles.
Figure 10. Six contiguous potash applications over Lake Amadeus. The red catchments are rated by GA as most prospective for potassium, followed by yellow and green.
For
per
sona
l use
onl
y

RUM JUNGLE RESOURCES LTD
OPERATIONS REVIEW
Page 19
LAKE HOPKINS POTASH, WA
This project consists of three contiguous granted titles and has a JORC brine resource with scope to significantly increase it.
Tenement Area km2 Blocks Grant Expiry Holder
E69/2814 153.5 49 06/07/2011 05/07/2016 RUM
E69/3144 256.8 82 11/11/2013 10/11/2018 RUM
E69/3307 150.5 48 09/03/2015 08/03/2020 RUM
Table 15. Lake Hopkins potash titles and commitments.
Figure 11. All three titles over Lake Hopkins are now granted.
Resource and Exploration Target The maiden Inferred JORC brine potash resource is 4.5 million tonnes K2SO4 on E69/2814, which was announced 12 September 2014 and has not changed since. A brine exploration target for the immediate surrounding tenement E69/3144 has been estimated at 2.5 to 3.8 million tonnes K2SO4. It has not been extrapolated onto E69/3307.
Area
(m2)
Average Thickness
(m)
Bulk Volume
(m3)
Porosity estimate
%
Brine Volume
(m3)
Average Dissolved Potassium
Concentration (kg/m3)
Potassium Tonnage
(million tonnes)1
K2SO4
Tonnage
(million tonnes)1
85,910,000 18.7 1,606,438,647
0.40 (upper) 642,575,459
3.849
2.5 5.6
0.33 (middle)
530,124,754 2.0 4.5
0.26 (lower) 417,674,048 1.6 3.6
Note
1) Tonnage rounded to two significant figures
Table 16. JORC brine resource for Lake Hopkins.
For
per
sona
l use
onl
y

RUM JUNGLE RESOURCES LTD
OPERATIONS REVIEW
Page 20
LAKE MACKAY SOUTH POTASH JV, WA
The JV gives Rum Jungle Resources potash exploration rights to the southern part of Lake Mackay as held by a Toro Energy subsidiary. This includes all of E80/3486 and parts of E80/3484, 3485 and 3519. Rum Jungle Resources has now spent sufficient to earn 51% of the potash rights in the JV.
Tenement Blocks in JV Grant Expiry Holder
E80/3484 35 16/05/2008 15/05/2017 Nova/Toro Energy Ltd
E80/3485 17 16/05/2008 15/05/2017 Nova/Toro Energy Ltd
E80/3486 69 16/05/2008 15/05/2017 Nova/Toro Energy Ltd
E80/3519 12 16/05/2008 15/05/2017 Nova/Toro Energy Ltd
Table 17. Lake Mackay JV titles.
Figure 12. Lake Mackay JV area. The red catchments are rated as most prospective for potassium, followed by yellow and green.
Resource A maiden JORC brine potash resource of 13 million tonnes K2SO4 was announced for the Lake Mackay South Potash Project on 09/09/2014 and has not changed since.
For
per
sona
l use
onl
y

RUM JUNGLE RESOURCES LTD
OPERATIONS REVIEW
Page 21
LAKE MACDONALD POTASH, WA and NT
Three titles across WA and NT cover all of Lake MacDonald which straddles the border. The titles are less than 100 km from the producing Surprise petroleum field. Both WA titles are now granted. An NT work program for ELA 30478 was submitted to the Central Land Council this Quarter and an on-country meeting with Traditional Owners and the Central Land Council to discuss land access for exploration activities was held after the reporting period on July 15.
Discussions on an Exploration Agreement over the two Western Australian tenements with the Central Desert Native Title Services is ongoing.
Tenement Area km2 Blocks Grant Expiry Holder
WA E69/3290 311.9 99 09/03/2015 08/03/2020 RUM
WA E80/4896 226.8 72 08/06/2015 07/06/2020 RUM
NT ELA 30478 122.9 39 - - RUM
Table 18. Lake MacDonald titles.
Figure 13. Lake MacDonald titles straddling the WA/NT border on satellite image background.
For
per
sona
l use
onl
y

RUM JUNGLE RESOURCES LTD
OPERATIONS REVIEW
Page 22
LAKE TORRENS POTASH, SA
Rum Jungle Resources has four granted titles that cover a significant portion of Lake Torrens in South Australia. A reconnaissance work program has been submitted to SA Government departments and Native Title notification documents have also been submitted to the relevant parties.
Tenement Area km2 Grant Date Expiry Holder
EL 5544 880 05/01/2015 04/01/2017 RUM
EL 5545 505 05/01/2015 04/01/2017 RUM
EL 5549 736 05/01/2015 04/01/2017 RUM
EL 5550 617 05/01/2015 04/01/2017 RUM
Table 19. Lake Torrens titles.
Figure 14. Lake Torrens titles. The catchments shown with a red tint are rated by GA as most prospective for potassium. Historic drillholes are shown as red dots. Note that there has been almost no drilling on the lake itself.
For
per
sona
l use
onl
y

RUM JUNGLE RESOURCES LTD
OPERATIONS REVIEW
Page 23
LAKE FROME POTASH, SA
A series of titles of 2,718 km2
cover the entire of Lake Frome in SA. There is very little data on the potash prospectivity, but GA rated the southwest as the most prospective. The lake has previously been explored for alkali evaporites and a single hole was drilled targeting lithium. A reconnaissance work program and Native Title notification documents have been submitted to the required SA Government departments.
Tenement Area km2 Grant Date Expiry Holder
EL 5546 949 05/01/2015 04/01/2017 RUM
EL 5547 995 05/01/2015 04/01/2017 RUM
EL 5548 774 05/01/2015 04/01/2017 RUM
Table 20. Lake Frome titles.
Figure 15. Lake Frome titles. The catchments shown with a red tint are rated by GA as most prospective for potassium. Historic drillholes are shown as red dots. There has been very little drilling on the lake itself.
For
per
sona
l use
onl
y

RUM JUNGLE RESOURCES LTD
OPERATIONS REVIEW
Page 24
OTHER TARGET COMMODITIES
DINGO HOLE SILICA
This project is targeting potentially high-purity silica quartz rock. The titles are contiguous with and north of the Ammaroo phosphate project. A process of title rationalisation and consolidation continued during the reporting period.
Tenement Area km2 Blocks Grant Date Expiry Holder
EL 30659 22.37 7 29/06/2015 28/06/2021 RUM
ELA 30792 3.20 1 App 13/03/2015 - RUM
EL 30819 9.59 3 01/04/2008 31/03/2016 RUM
Table 21. Dingo Hole titles.
Encouraging first-pass chemical analysis results of Dingo Hole Silica were announced to the market on 20 July 2015, after the end of the reporting period. These results were based on of visually-selected rock chip samples and indicate that the Dingo Hole Silica Project could be a viable source of High Purity Quartz.
Figure 16. Typical silica outcrop at Dingo Hole.
Figure 17. Visually-selected Dingo Hole Silica from outcrop.
For
per
sona
l use
onl
y

RUM JUNGLE RESOURCES LTD
OPERATIONS REVIEW
Page 25
Figure 18. Map of Dingo Hole Silica titles with high resolution satellite imagery over the most prospective portion showing the rock-chip surface sample locations. The first round of sampling is shown as green dots and the second round as red dots.
On-Going and Proposed Work Rum Jungle Resources intends to engage with the pastoralist and to put in place the appropriate cultural heritage and government approvals to further investigate the potential resource to better understand its chemical composition and size, including in the subsurface.
The company has engaged Dorfner Anzaplan in Germany to undertake basic process development testing of a Dingo Hole Silica sample for high purity applications. High purity quartz requires several specific processing steps in order to evaluate the full market potential and most suitable applications. This test work will take a number of months to complete and will include:
Characterisation of mineral phases and inclusions
Processing and mineral dressing to produce glass sand and powder fractions
Physical treatment including attritioning, magnetic separation and flotation/high tension separation
Chemical and thermal processing including hot chlorination
Laboratory melting tests
Testing for EMC (Epoxy Moulded Compound) Filler Applications
Final reporting will provide advice on potential applications which may include:
Semiconductor applications
High temperature lamp tubing
Telecommunication
Optics
Microelectric applications
Solar silicon applications
For
per
sona
l use
onl
y
RUM JUNGLE RESOURCES LTD
OPERATIONS REVIEW
Page 26
Moreover, a future second stage of investigations on a larger sample of material, will aim to produce a high purity commercial sample which could form a basis for engaging with High Purity Quartz offtake partners from Japan, Korea, China, Europe or the US.
TOP END PROJECT – MT BUNDEY / MT GOYDER, NT
The Top End Project is in an established polymetallic province within 20 km of the Toms Gully gold mine. Rum Jungle Resources has withdrawn from all but an inactive joint venture with Crocodile Gold (now Primary Minerals) over exploration tenements surrounding the Tom’s Gully Gold Mine. Rehabilitation of all work by Rum Jungle Resources has been completed and the security bond released by the Department of Mines and Energy.
ROSS RIVER / ALICE SPRINGS PROJECT, NT
EL 24917 and EL 28156 were explored for Cu-Ni-Cr-PGE and IOCG without success and both titles have been surrendered and the environmental bond refunded.
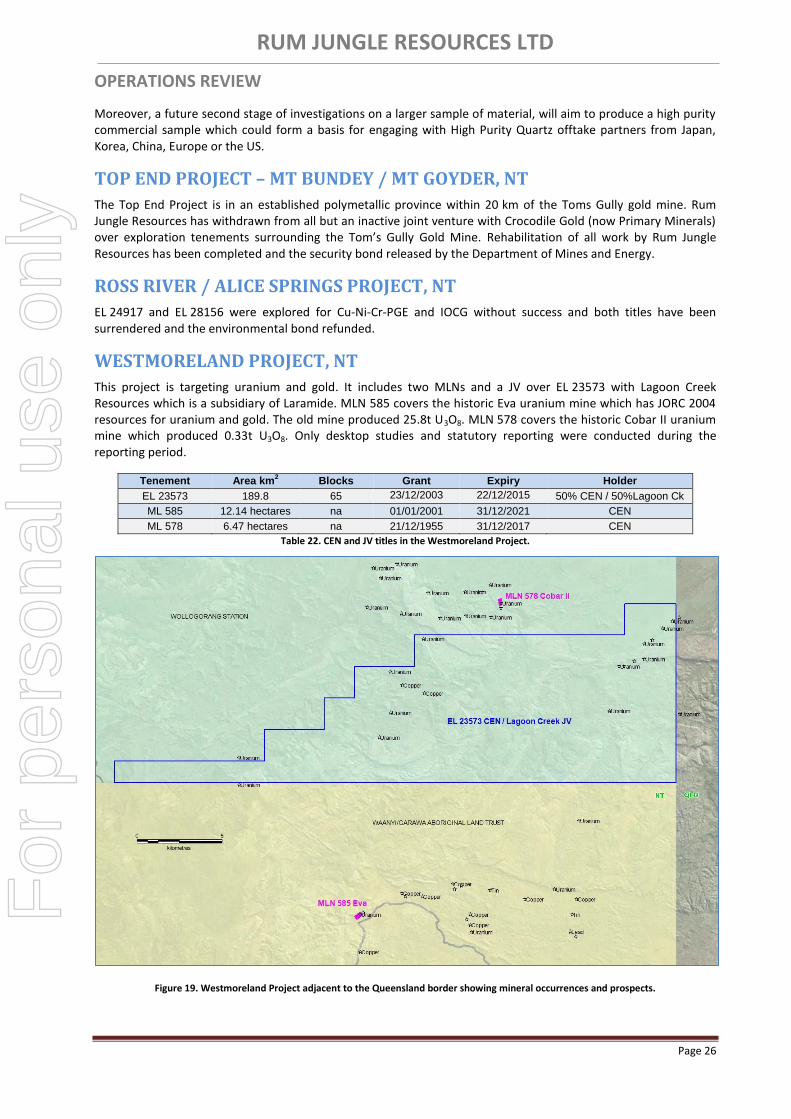
WESTMORELAND PROJECT, NT
This project is targeting uranium and gold. It includes two MLNs and a JV over EL 23573 with Lagoon Creek Resources which is a subsidiary of Laramide. MLN 585 covers the historic Eva uranium mine which has JORC 2004 resources for uranium and gold. The old mine produced 25.8t U3O8. MLN 578 covers the historic Cobar II uranium mine which produced 0.33t U3O8. Only desktop studies and statutory reporting were conducted during the reporting period.
Tenement Area km2 Blocks Grant Expiry Holder
EL 23573 189.8 65 23/12/2003 22/12/2015 50% CEN / 50%Lagoon Ck
ML 585 12.14 hectares na 01/01/2001 31/12/2021 CEN
ML 578 6.47 hectares na 21/12/1955 31/12/2017 CEN
Table 22. CEN and JV titles in the Westmoreland Project.
Figure 19. Westmoreland Project adjacent to the Queensland border showing mineral occurrences and prospects.
For
per
sona
l use
onl
y

RUM JUNGLE RESOURCES LTD
OPERATIONS REVIEW
Page 27
RESOURCE REGISTER as of 30 June 2015 Commodity Project Ownership Resource
Category Mt P2O5 Grade
P2O5% Cut-Off P2O5%
JORC Announced Status
Phosphate
Ammaroo, NT
Territory Phosphate
Measured 135 15.4
10 2012 Rum Jungle Resources
09 December 2014
pre-feasibility completed
Indicated 80 15.3
Inferred 930 14
Total 1,145 14
Ammaroo South, NT
Territory Phosphate
Inferred 70 13 10 2012 Rum Jungle Resources
12 June 2014 exploration
Commodity Project Ownership Resource Category
Mt K2SO4 Grade mg/L K
Cut-Off mg/L K
JORC Announced Status
Potash
Karinga Lakes, NT
Rum Jungle Resources
Measured 5.8 -
3,000 2012 Rum Jungle Resources
20 February 2014 scoping study
completed Indicated 0.46 -
Inferred 2.1 -
Total 8.4 av 4,760
Lake Mackay South JV,
WA
51% of potash rights Rum
Jungle Resources, 49% Toro
Energy Limited
Inferred (mid
estimate using 0.33%
porosity)
13 av 3,758 none
applied, but
above 3,000 mg/L
used at Karinga Lakes
2012 Rum Jungle Resources
09 September 2014 exploration
Lake Hopkins, WA
Rum Jungle Resources
Inferred (mid
estimate using 0.33%
porosity)
4.5 av 3,849 2012 Rum Jungle Resources
12 September 2014 exploration
Commodity Project Ownership Resource Category
Tonnes Grade Au g/t
Cut-Off g/t
Au Oz JORC Announced Status
Gold Eva*, NT Central
Australian Phosphate
Inferred 14,000 3.07 1.2
1,400 2004
NuPower (CEN) 4 March 2011
no activity since
acquisition Indicated 87,600 3.88 10,900
Total 101,600 3.77 12,300
Commodity Project Ownership Resource Category
Tonnes Grade U3O8%
Cut-Off U3O8%
U3O8 Tonnes
JORC Announced Status
Uranium Eva*, NT Central
Australian Phosphate
Inferred 105,300 0.05 0.02
60 2004
NuPower (CEN) 4 March 2011
no activity since
acquisition Indicated 430,500 0.14 590
Total 535,800 0.12 650
Notes Territory Phosphate Pty Ltd and Central Australian Phosphate Pty Ltd (formerly NuPower Limited) are wholly-owned subsidiaries of Rum Jungle Resources Ltd. All resources are listed as of the time of the ASX announcement given above and have not changed since. Totals may include rounding. *Rum Jungle Resources has not undertaken any work to independently verify the Eva project resources prepared by Mining Associates Pty Ltd and announced by NuPower. This information was prepared and first disclosed under the JORC Code 2004. It has not been updated since to comply with the JORC Code 2012 on the basis that the information has not materially changed since it was last reported. Further work and evaluation may be required to independently verify the JORC 2004 compliant resource and/or make it compliant with JORC 2012. F
or p
erso
nal u
se o
nly

RUM JUNGLE RESOURCES LTD
OPERATIONS REVIEW
Page 28
DISCLAIMER
This Annual Report has been prepared by Rum Jungle Resources Ltd (Rum Jungle Resources) and is available to shareholders (Recipients) for use in considering their interests in Rum Jungle Resources’ assets.
The Annual Report has been prepared to assist Recipients in making their own evaluation of Rum Jungle Resources and does not purport to contain all of the information that a shareholder or prospective acquirer may require. None of Rum Jungle Resources, its shareholders, its related bodies corporate and advisers, and each of those parties' officers, employees, agents and associates (each a Relevant Person) is, or may be taken to be, under any obligation to correct, update or revise the report or any written or oral communications given to the Recipient in the course of its evaluation of Rum Jungle Resources. In all cases, Recipients must (a) conduct their own independent investigations and analysis of Rum Jungle Resources and the information set out in the report, (b) rely entirely on such investigations and analysis and not in this report in relation to their assessment Rum Jungle Resources and (c) form their own opinion as to whether or nor not to seek to invest in Rum Jungle Resources’ assets.
Any forward looking statements (including forecasts) included in this report are not representations as to future matters and should not be relied upon by Recipients. The statements are based on a large number of assumptions about future events and are subject to significant uncertainties and contingencies, many of which are outside the control of Rum Jungle Resources. No representation is made that any forecast or future event will be achieved. Actual results may vary significantly from the forecasts. Each Recipient should make its own enquiries and investigations regarding the assumptions, uncertainties and contingencies which may affect Rum Jungle Resources’ assets.
No Relevant Person makes any representation or warranty (express or implied) as to the accuracy, reasonableness or completeness of the information, statements and opinions expressed in this report (Information). To the maximum extent permitted by law, all liability in respect of the Information is expressly excluded, including any liability arising from fault or negligence, for any direct, indirect or consequential loss or damage arising from the use of the Information or otherwise. No responsibility is accepted by any Relevant Person, for any of the Information, any omission from this report, any written or oral communications given to the Recipient in the course of its evaluation of Rum Jungle Resources or for any action taken by the Recipient or any other person on the basis of the Information.
Chris Tziolis BSc, MA, MBA, MAICD Managing Director
FURTHER TECHNICAL INFORMATION
For further information regarding any of Rum Jungle Resources’ projects:
Website www.rumjungleresources.com.au
Phone 08 8942 0385 (Int.) +61 8 8942 0385
E-mail [email protected]
For
per
sona
l use
onl
y
RUM JUNGLE RESOURCES LTD
DIRECTORS’ REPORT
Page 29
The directors present their report together with the consolidated financial statements of the Group comprising Rum Jungle Resources Ltd (the Company) and its subsidiaries for the year ended 30 June 2015 and the auditor’s report thereon.
DIRECTORS
The directors of the Company at any time during or since the end of the financial year and up to the date of this report:
Mr David Muller Non-Executive Chairman
Mr Robert Annells Non-Executive Director (resigned 30th
June 2015)
Mr Jeff Landels Non-Executive Director
Mr Chris Tziolis Managing Director
COMPANY SECRETARY
Mr Bruce Arnold BAgEc, CA was appointed Company Secretary on 31 July 2013 and has held the role of Company Secretary and Chief Financial Officer for a number of public companies.
PRINCIPAL ACTIVITIES
The principal activities of the Group during the course of the financial year were the exploration and evaluation of fertiliser minerals (in particular phosphate and potash) and exploration for other minerals in northern and central Australia.
DIVIDENDS
The Directors recommend that no dividend be paid or declared at this point in time. No amounts have been paid or declared by way of dividends during the year.
OPERATING AND FINANCIAL REVIEW
Review of Operations
A detailed operations review and highlights discussion is included in front section of this annual report.
Operating Results
The consolidated entity recorded a loss after tax of $1,922,469 after impairment and write downs of $785,879 in exploration costs (2014 loss $7,317,965). The impairment reflects the assessment of future potential made in relation to areas of interest that that have been deemed non-prospective and where no further testing is anticipated. In this situation costs associated with the tenements are impaired and written off in the profit or loss and other comprehensive income statement. Corporate costs of $2,281,968 (2014 $4,295,503) decreased during the year reflecting reduced resources and staff. In addition there were less advisory costs compared to the prior year when finalising the takeover for Central Australian Phosphate Limited. Exploration and evaluation expenditure (including scoping studies) for the year was $4,065,288 (2014 $7,937,455).
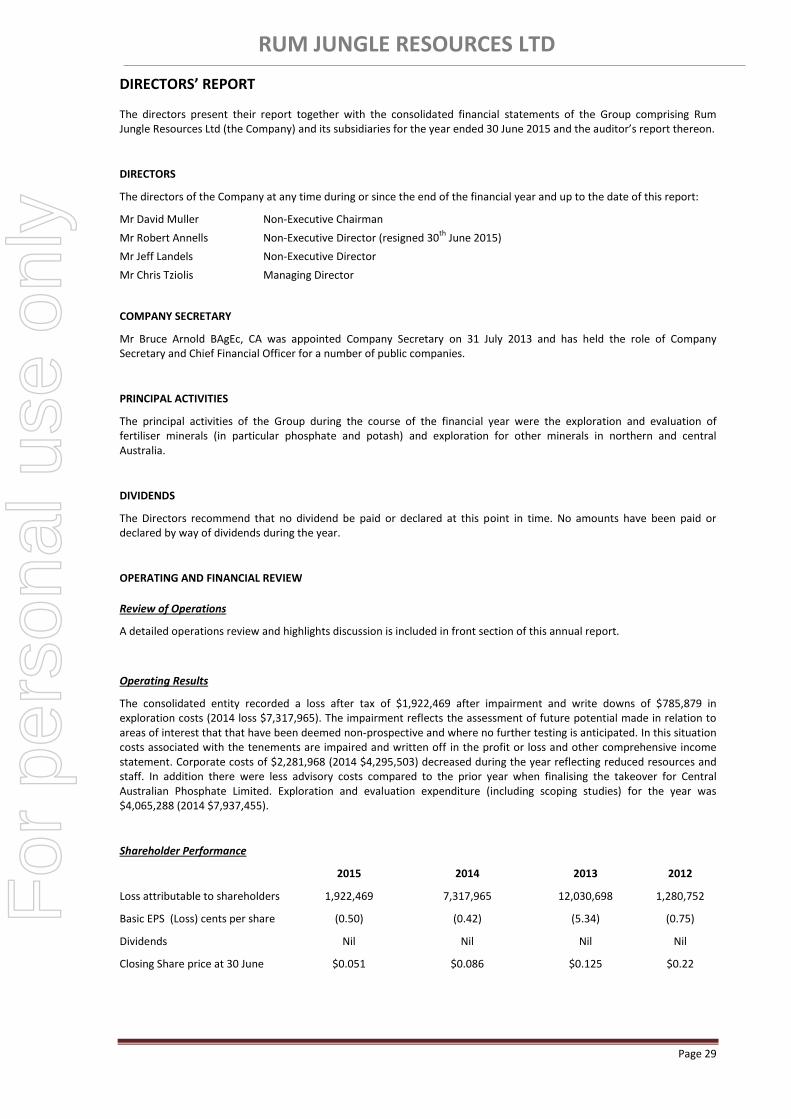
Shareholder Performance
2015 2014 2013 2012
Loss attributable to shareholders 1,922,469 7,317,965 12,030,698 1,280,752
Basic EPS (Loss) cents per share (0.50) (0.42) (5.34) (0.75)
Dividends Nil Nil Nil Nil
Closing Share price at 30 June $0.051 $0.086 $0.125 $0.22
For
per
sona
l use
onl
y

RUM JUNGLE RESOURCES LTD
DIRECTORS’ REPORT
Page 30
Review of Financial Position
The Group’s net assets decreased by 3.5% compared to the prior year reflecting the loss from operations for the year. The cash balance was $3,623,749 at 30 June 2015.
Future Developments, Business Strategies and Prospects
The Group strategy is to actively continue its exploration, evaluation and project development activities in Northern Australia. The principal focus in the short to medium term will be both the Ammaroo phosphate and Karinga Lakes potash projects having completed prefeasibility studies to seeking funding and start up options for definitive Bankable studies. Other prospects considered to have potential (including Silica) will have work programmes developed in order to maintain the tenements and enable assessment of the areas of interest in the medium term.
The overarching objective is to progress both projects down the development path with a long term strategy of developing a phosphate and potash fertiliser mineral production businesses in due course.
Business Risks
Economic Factors Share market conditions may affect the value of the Company’s quoted securities regardless of operating performance. Share market conditions are affected by many factors such as economic outlook; interest and inflation rates; currency exchange rates; investor sentiment; demand and supply of capital; terrorism or other hostilities and fiscal, monetary and regulatory policies.
Market Conditions The market price of the shares in the Company can rise and fall and may be subject to unpredictable influences on the market and exploration stocks in particular. The future performance or return on investment cannot be warranted. A key risk for a minerals development company to manage is the need to maintain access to capital markets in order to source equity from new and existing shareholders to fund exploration evaluation in project studies and progress towards project development.
Tenement Title Each tenement is for a specific term with annual expenditure and reporting obligations as well as conditions requiring compliance. Consequently the Company could lose tenements if conditions are not met or if insufficient funds are available to meet expenditure commitments as and when they arise. The inability to meet tenement conditions may affect the operations, financial position and /or performance of the Company.
Native Title Areas of interest are potentially subject to native title claims and identification of areas of cultural significance which may affect future operations or performance if relevant agreements cannot be established.
Political, Commodity Price and Exchange Rate Risks The potential to establish the timing and investment in projects and operations will depend on, expected revenues that will be exposed to commodity price and exchange rate risk which are impacted by volatility in international markets and political factors including approvals to operate.
Upgrading Resources to Reserves Resource and reserve estimates are judgments based on knowledge, experience and industry practice. By their nature resource estimates are imprecise and depend on interpretations which can lead to variations through an ore body.
SIGNIFICANT CHANGES IN THE STATE OF AFFAIRS
As an exploration company the regular access to capital markets and ongoing support from shareholders is necessary to support exploration programmes. No equity funding was raised in the past financial year and as a result the cash balance reduced by $5,604,924.
Other than as noted above or otherwise disclosed in this report, there were no other significant changes in the nature of activities that occurred during the course of the financial year under review.
For
per
sona
l use
onl
y
RUM JUNGLE RESOURCES LTD
DIRECTORS’ REPORT
Page 31
EVENTS SUBSEQUENT TO REPORTING DATE
No matter or circumstance has arisen since the end of the financial year that has significantly affected, or may significantly affect the Group’s operations, the results of those operations or the Group’s state of affairs, in subsequent financial years.
LIKELY DEVELOPMENTS AND EXPECTED RESULTS OF OPERATIONS
The Group proposes to continue its exploration programmes and project development activities. Specifically, the company aims to continue phosphate evaluation activities on the Ammaroo project. The pre-feasibility study will form the basis for potential future decisions to commence a bankable feasibility study and to actively pursue project financing activities. The implementation of off-take agreements and the attraction of development and financing partnerships will be critical in moving the project beyond the pre-feasibility stage. Neither of these is currently in place. For the Karinga Lakes potash project the scoping study has been completed and assessment continues to evaluate the potential for a small scale start up opportunity.
ENVIRONMENTAL REGULATION
The Group has a policy of complying with its environmental performance obligations in accordance with regulations determined by statute and regional entities in the areas in which it undertakes its exploration activities. The directors of the Group are not aware of any breach of environmental legislation or any matter which requires disclosure with respect to any significant environmental regulation associated with its operating activities.
INFORMATION ON DIRECTORS
David Muller
Chairman – Non-Executive Qualifications BSc, MSc, MBA, FAusIMM
Experience and Expertise
Appointed to Rum Jungle Resources Ltd board in October 2006 Mr Muller is a geologist with 45 years’ experience in the Australian mining and exploration industries. He graduated in 1965 with a BSc in geology from the University of Melbourne and commenced as a geologist with Electrolytic Zinc Co of A’asia Ltd. He was the project leader in the discovery of the Beltana Zinc deposit in South Australia from 1967 to 1969 and was awarded a Master of Science degree by the University of Melbourne for work on this project. During this period EZ was also involved with Geopeko in the discovery of the Ranger Uranium deposit in the Northern Territory. Mr Muller was a senior geologist with EZ in charge of the Western Australian operation when he left the company in 1972 to undertake the Master of Business Administration course at the University of Melbourne from 1972 to 1974. During this period he worked as a mining adviser to share brokers May and Mellor.
Whilst with May and Mellor he was involved in financing and mergers of listed junior mining companies. He worked closely with the Pancontinental Mining Ltd Board and assisted the company to restructure in the early days of the Jabiluka uranium discovery.
In 1975 Mr Muller returned to Perth and spent four years in private exploration and eventually listed his endeavours as Samantha Mines NL of which he was chairman. He then listed associated companies Samson Exploration NL and Cape Range Oil NL. These companies were involved in successful gold exploration and development of mining operations. Cape Range Oil was the original partner in the discovery of the Tubridgi Gas Field at Onslow, WA. He lost control of these companies in a take-over battle in 1985.
In 1985 Mr Muller once again set out on his own and created Julia Mines NL (“Julia”) in the same year. Julia went on to develop wholly owned gold operations at Goongarrie, Menzies and Kambalda (Paris Gold Mine). He held the position of Executive Chairman and subsequently Managing Director. He was with Julia Mines for 18 years prior to retiring in 2003 when he embarked upon private exploration in the Northern Territory, where he established financial relations with six listed mining companies. Subsequent to that he selected and acquired all the areas that formed the basis of the Rum Jungle Resources Ltd Prospectus and acted as Managing Director until 30 June 2014.
For
per
sona
l use
onl
y
RUM JUNGLE RESOURCES LTD
DIRECTORS’ REPORT
Page 32
INFORMATION ON DIRECTORS (continued)
Robert Annells
Non-Executive Director Qualifications CPA, F Fin
Experience and Expertise
Appointed to Rum Jungle Resources Ltd board in October 2006. - Retired 30 June 2015. Mr. Annells is a former member of the Australian Stock Exchange with over forty years’ experience in the securities industry and is a qualified accountant. His experience includes provision of corporate and investment advice to the business and resources industries. He has served on the Rum Jungle Resources Ltd Board since 2006. During the past four years Mr. Annells has also served on the Boards of ASX listed Minotaur Exploration Limited, Greenearth Energy Limited and Lakes Oil N.L and the London based company Xtract Energy PLC. Mr. Annells served as the Chairman of Minotaur Exploration Limited from its listing in February 2005 until his retirement from the Board in February 2010. He is currently Chairman of Lakes Oil N.L and was appointed Chairman of Greenearth Energy Limited in July 2010.
Mr Jeff Landels
Non-Executive Director Qualifications BSc (Hons)
Experience and Expertise
Appointed to Rum Jungle Resources Ltd board in October 2012. Mr Landels was the General Manager of (then) Western Mining Corporation's Fertilizer Operations at Phosphate Hill, Mt Isa and Townsville from 2002 to 2006. Prior to this he spent over 30 years in the pulp and paper industry in both Australia and New Zealand. He was the Group General Manager for PaperlinX at its Gippsland operations and General Manager at AMCOR's Maryvale operations.
Mr Chris Tziolis
Managing Director Qualifications BSc, MA, MBA, MAICD
Experience and Expertise
Appointed to Rum Jungle Resources Ltd board in June 2013. Mr Tziolis was appointed to Rum Jungle Resources as Director of Development Projects in October 2012. On 30 June 2014 he was appointed as Managing Director. Prior to this he held senior management roles at Rio Tinto, most recently as the Chief Development Officer of Energy Resources of Australia Ltd. He was also the Manager of Business Development and Manager of Rail and Port Infrastructure with Rio Tinto Coal Australia. Prior to Rio Tinto, he was a consultant with McKinsey and Company primarily engaged on strategy development and operational performance improvement for global mining companies. Mr Tziolis commenced his career as an operations officer in the Royal Australian Navy which included command of a patrol vessel. He is a Member of the Australian Institute of Company Directors and has an MBA, MA in International Relations and a BSc in Chemistry.
For
per
sona
l use
onl
y

RUM JUNGLE RESOURCES LTD
DIRECTORS’ REPORT
Page 33
MEETINGS OF DIRECTORS
The number of Board meetings held during the year for each director who held office during the financial year and the numbers of meetings attended by each director is as follows:
Board Meetings of Directors Audit Committee
Number eligible
to attend
Meetings
attended
Number eligible
to attend
Meetings
attended
David Muller 7 7 *- -
Robert Annells 7 7 2 2
Jeff Landels 7 7 2 2
Chris Tziolis 7 7 *- -
* Participated by invitation
DIRECTORS’ INTERESTS
The relevant interests of the directors (and related parties) in securities of the Company at the date of this report are as follows:
Ordinary shares Options over ordinary shares
David Muller 9,400,522 5,000,000
Jeff Landels - 2,000,000
Chris Tziolis 650,010 6,500,000
SHARES UNDER OPTIONS
Unissued ordinary shares of Rum Jungle Resources Ltd under option at the date of this report are as follows:
Grant date Vesting date Expiry date Exercise price Number of
options
19/12/2012 15/10/2013 15/10/15 $0.43 1,500,000
19/12/2012 19/12/2012 19/12/15 $0.49 9,000,000
01/07/2014 01/07/2014 01/07/2018 $0.1671 4,550,000
01/07/2014 01/07/2015 01/07/2019 $0.2171 3,550,000
18,600,000
No option holder has any right under the options to participate in any other share issue of the Company or any other entity.
Shares issued on the exercise of options
During the year ended 30 June and to the date of this report there were no shares have issued on the exercise of options.
For
per
sona
l use
onl
y

RUM JUNGLE RESOURCES LTD
DIRECTORS’ REPORT
Page 34
REMUNERATION REPORT – AUDITED
(a) Policy for determining the nature and amount of key management personnel remuneration
The Board of Rum Jungle Resources Ltd is responsible for determining and reviewing compensation arrangements for the directors, chief executive officer and the executive team. The Board’s remuneration policy is to ensure that the remuneration package properly reflects the person’s duties and responsibilities, with the overall objective of ensuring maximum stakeholder benefit from the retention of a high quality Board and executive team. Such officers can be given the opportunity to receive their base emolument in a variety of forms. It is intended that the manner of payment chosen will be optimal for the recipient without creating undue cost to the Group.
In accordance with best practice corporate governance, the structure of non-executive director and executive remuneration is separate and distinct.
(i) Non-Executive Director Remuneration
Objective
The Board seeks to set aggregate remuneration at a level which provides the Company with the ability to attract and retain directors of the highest calibre, whilst incurring a cost which is acceptable to shareholders.
Structure
Remuneration of non-executive directors is determined by the Board, within the maximum amount approved by the shareholders from time to time (currently set at an aggregate of $250,000 per annum). The Board intends to undertake an annual review of its performance and the performance of the Board committees against goals set at the start of the year.
The amount of aggregate remuneration sought to be approved by shareholders and the manner in which it is apportioned amongst the directors is reviewed annually. The Board may consider advice from external consultants as well as the fees paid to non-executive directors of comparable companies when undertaking its annual review.
Each director receives a fee for being a director of the Company. Directors who are called upon to perform extra services beyond the director’s ordinary duties may be paid for those services on a rate commercial basis. Options may also be issued to directors with the approval of shareholders.
(ii) Senior Executive Remuneration (including executive directors)
Objective
The Company aims to reward executives with a level and mix of remuneration commensurate with their position and responsibilities within the Company and to:
Reward executives for company, business unit and individual performance against targets set by reference to appropriate benchmarks;
Align the interest of executives with those of shareholders;
Link reward with the strategic goals and performance of the Company; and
Ensure total remuneration is competitive by market standards.
Structure
In determining the level and make-up of executive remuneration, the Board may obtain independent advice from external consultants on market levels of remuneration for comparable executive roles. It is the Board’s policy that employment contracts are entered into with all senior executives.
(iii) Variable remuneration – Short and Long Term Incentives (executives and executive directors)
Objective
The objectives of incentives are to:
Recognize the ability and efforts of the employees of the Company who have contributed to the success of the Company and to provide them with rewards where deemed appropriate;
Provide an incentive to the employees to achieve the long term objectives of the Company and improve the performance of the Company; and
Attract persons of experience and ability to employment with the Company and foster and promote
loyalty between the Company and its employees. For
per
sona
l use
onl
y

RUM JUNGLE RESOURCES LTD
DIRECTORS’ REPORT
Page 35
REMUNERATION REPORT – AUDITED (continued)
Structure
Long term incentives granted to senior executives are options issued in accordance with an Employee Share Option Plan, which has been subject to shareholders’ approval. At the commencement of each financial year, the Company and each senior executive will agree upon a set of financial and non-financial objectives related to the senior executive’s job responsibilities and targeted to the business and financial performance. There is currently no short term incentive scheme and no bonuses are paid while the company in exploration phase.
(b) Remuneration, Company performance and shareholder wealth.
The development of remuneration policies and structure are considered in relation to the effect on Company performance and shareholder wealth. They are designed by the Board to align Director and executive behaviour with improving Company performance and, ultimately shareholder wealth.
The Board considers at this stage in the Company’s development, that share price growth itself is an adequate measure of total shareholder return.
Executives are currently remunerated based on a base pay and options. The options granted are considered by the Board to provide an alignment between the employees’ and shareholders’ interests.
(c) Key management personnel
Unless otherwise stated, the following persons were key management personnel of Rum Jungle Resources Ltd during the financial year under review: Name Date appointed Date resigned Position held
David Muller 13 October 2006 Chairman (Retired as Managing Director 30 June 2014)
Robert Annells 10 October 2006 30 June 2015 Non-executive Director
Jeff Landels 18 October 2012 Non-executive Director
Chris Tziolis 15 October 2012 Managing Director (Appointed 1 July 2014)
Bruce Arnold 31 July 2013 Company Secretary/Chief Financial Officer
Nigel Doyle 1 February 2008 Exploration Manager
(d) Details of remuneration Compensation paid, or payable by the Company to key management personnel is set out below. Key management personnel include all directors of the Company and executives who, in the opinion of the Board have authority and responsibility for planning, directing and controlling the Group directly or indirectly.
2015 Short-term benefits
Post-
employment
Share-based
payments
Proportion of
remuneration
share based
Salary and
fees
Non Cash Superannuation Options Total
$ $ $ $ $ %
Non-executive directors
David Muller
Robert Annells
Jeff Landels
*75,000
50,000
*50,000
-
-
-
7,125
-
4,750
-
-
-
82,125
50,000
54,750
-
-
-
Total non-executive directors 175,000 - 11,875 - 186,875 -
Executive directors
Chris Tziolis
David Muller – Termination Payment
*420,000
262,500
-
-
30,000
-
120,800
-
570,800
262,500
21.1
-
Total executive directors 682,500 - 30,000 120,800 833,300 -
Other key management personnel
Bruce Arnold
Nigel Doyle
200,000
200,000
24,717
-
19,000
19,000
19,440
36,450
263,157
255,450
7.3
14.3
Total other key management
personnel 400,000 24,717 38,000 55,890 518,607 -
Total directors’ and executive
remuneration 1,257,500 24,717 79,875 176,690 1,538,782 -
Termination payment of $262,500 was paid to David Muller in July 2014 in recognition of 7 years of services to the company on retirement as Chief Executive Officer. This amount was recorded as a liability as at 30 June 2014 * Note that directors’ fees and salary have been agreed to being reduced by 20% in 2015/16 year.
For
per
sona
l use
onl
y

RUM JUNGLE RESOURCES LTD
DIRECTORS’ REPORT
Page 36
REMUNERATION REPORT AUDITED (continued)
2014
Short-term
benefits
Post-
employment
Share-based
payments
Proportion of
remuneration
performance
based
Salary and
fees Superannuation
Options Total
$ $ $ $ %
Non-executive directors
Robert Annells Chairman
Jeff Landels
* 99,000
* 74,000
-
2,312
-
-
99,000
76,312
-
-
Total non-executive directors 173,000 2,312 - 175,312 -
Executive directors
David Muller
Chris Tziolis
425,000
302,750
25,000
25,000
-
-
450,000
327,750
-
-
Total executive directors 727,750 50,000 - 777,750 -
Other key management personnel
Christopher Moyle
Bruce Arnold
Nigel Doyle
31,323
187,948
200,000
1,352
17,385
18,500
-
-
-
32,675
205,333
218,500
-
-
-
Total other key management personnel 419,271 37,237 - 456,508 -
Total directors’ and executive remuneration 1,320,021 89,549 - 1,409,570 -
* Consolidated director’s fees. Includes $24,000 paid by Central Australian Phosphate Limited for the period July 2013 to
December 2013 prior to becoming a wholly owned subsidiary.
There were no bonus payments in 2015 or 2014.
(e) Service agreements
On appointment to the Board, non-executive directors enter into service agreements with the Company in the form
of a letter of appointment. The letter summarises the Board’s policies and terms, including compensation, relevant to
the office of director.
Remuneration and other terms of employment for the Managing Director and other key management personnel are
recorded in service agreements. Major provisions of the agreements relating to remuneration are set out below.
Chris Tziolis, Executive Director – Managing Director
Term of Agreement – open ended effective 1 July 2014.
Base package $450,000 including SGC superannuation. (refer to note below that for 2015 / 16 a reduction of
20% to $360,000)
Contract may be terminated by executive giving three month’s notice or payment in lieu thereof.
Company may terminate (without cause) by giving 12 months notice or payment in lieu of notice or a
combination of notice and a payment in lieu.
Company may terminate immediately where there is cause.
Bruce Arnold, Company Secretary & Chief Financial Officer
Term of Agreement – open ended commencing 24 July 2013.
Contract may be terminated by either party with one month’s notice or payment in lieu thereof.
Nigel Doyle, Exploration Manager
Term of Agreement – open ended commencing 1 February 2008.
Contract may be terminated by either party with one month’s notice or payment in lieu thereof.
For
per
sona
l use
onl
y

RUM JUNGLE RESOURCES LTD
DIRECTORS’ REPORT
Page 37
REMUNERATION REPORT - AUDITED (continued)
Note - Director’s Fees and salary 2015 to 2016
As advised to the ASX 30 June 2015 the Directors have elected to reduce non-executive Director’s fees and the
Managing Directors fixed remuneration by 20% effective 1 July 2015. This reflects the current market status in the
resources industry and will support the Company’s general approach to preserving cash in the current cycle.
(f) Share–based compensation
Details of options over ordinary shares in the Company provided as remuneration to each director of Rum Jungle
Resources Ltd and each of the key management personnel of the Group are set out below. When exercised, each
option is convertible into one ordinary share of Rum Jungle Resources Ltd. Options are issued by the Board and the
exercise price is double the average weighted share price at the date of being awarded. There are no other
performance criteria.
Grant Date No. of
options
No. of
options
vested
during
year
Fair
value per
option at
grant
date
(cents)
Exercise
price
(cents)
Expiry date Date
exercisable
Robert Annells 19/12/12 2,000,000 - 4.4 49 19/12/15 19/12/12
Jeff Landels 19/12/12 2,000,000 - 4.4 49 19/12/15 19/12/12
David Muller 19/12/12 5,000,000 - 4.4 49 19/12/15 19/12/12
Chris Tziolis 19/12/12 1,500,000 - 3.8 43 15/10/15 15/10/13
Chris Tziolis 01/07/14* 3,000,000 - 2.36 16.71 01/07/18 01/07/14
Chris Tziolis 01/07/14* 2,000,000 - 2.50 21.71 01/07/19 01/07/15
Nigel Doyle 01/07/14 750,000 - 2.36 16.71 01/07/18 01/07/14
Nigel Doyle 01/07/14 750,000 - 2.50 21.71 01/07/19 01/07/15
Bruce Arnold 01/07/14 400,000 - 2.36 16.71 01/07/18 01/07/14
Bruce Arnold 01/07/14 400,000 - 2.50 21.71 01/07/19 01/07/15
* Issued and documented following 2014 AGM after shareholder approval.
Options are granted to attract and retain key management personnel and the number set by the Board.
There are no performance hurdles attaching to the options granted other than service vesting conditions (that the employee must be employed to exercise the options. In the event of termination (specified circumstances) only vested options are entitled to be exercised up to 30 days after termination. Unvested options are forfeited unless retained with Board approval.
During the year there were no alterations to the terms and conditions of options granted since their grant date.
Analysis of movements in options
During the year no options were issued under the Company’s Employee Share Option Plan. 900,000 options lapsed or expired as the exercise price was above the spot share price at the time. As at 30 June 2015 the Company’s share price was 5.61cents.
A B C D
Value of options
granted
Value of options
exercised
Value at expiry date Remuneration
that consists of
options
$ $ $ %
Directors of Rum Jungle Resources Ltd
Robert Annells - - - - Jeff Landels - - - - David Muller - - - - Chris Tziolis 120,800 - - -
Other key management personnel
Nigel Doyle 36,450 - 25,000 -
Bruce Arnold 19,440 - -
For
per
sona
l use
onl
y

RUM JUNGLE RESOURCES LTD
DIRECTORS’ REPORT
Page 38
REMUNERATION REPORT - AUDITED (continued)
A = the value at grant date, calculated in accordance with AASB 2 – Share-based Payment, of options granted during the year as part of remuneration.
B = the value at exercise date of options that were granted as part of remuneration and were exercised during the year, being the intrinsic value (spot price less exercise price) of the options at that date.
C = the value at lapse or expiry date of options that were granted as part of remuneration and that lapsed during the year. The value is determined at the time of lapsing and usually out of the money at the expiry.
D = the percentage of the value of remuneration consisting of options, based on the value of options expensed during the current year.
As the options generally vest immediately the assessed fair value at grant date of options granted to the individuals is expensed in the reporting period in which the grant occurs and the amount is included in the remuneration tables appearing on the previous page. Fair values at grant date are independently determined using a Black-Scholes option pricing model that takes into account the exercise price, the term of the option, the share price at grant date and expected price volatility of the underlying share, the expected dividend yield and the risk-free interest rate for the term of the option.
For each grant of options, the percentage of the grant value that vested in the financial year, and the percentage that was forfeited because the person did not meet the service performance criteria, are set out below. The options usually expire after 3 to 4 years. Because the options vest immediately upon grant, there are no minimum or maximum options yet to vest.
Year granted Vested Forfeited Financial years in
which the options
vest
% %
Directors of Rum Jungle Resources Ltd
Robert Annells 2012 100 - 2012
Jeff Landels 2012 100 - 2012
David Muller 2012 100 - 2012
Chris Tziolis 2012 100 - 2013
Chris Tziolis 2014 60 2014 & 2015
Other key management personnel
Nigel Doyle 2011 100 33.3 2011
Nigel Doyle 2014 50 2014 & 2015
Bruce Arnold 2014 50 2014 & 2015
Option holdings The numbers of options over ordinary shares in the company held during the financial year by each director of Rum Jungle Resources Ltd and other key management personnel of the Group, including their personally related parties, are set out below:
Name Balance at start of
year
Granted as Compensation
Exercised Other Changes
Balance at end of
year
Vested and exercisable
Directors of Rum Jungle Resources Ltd R J Annells 2,000,000 - - - 2,000,000 2,000,000 J Landels 2,000,000 - - - 2,000,000 2,000,000 D W Muller 5,000,000 - - - 5,000,000 5,000,000 C N Tziolis 1,500,000 5,000,000 - 6,500,000 4,500,000 Other key management personnel of the Group N J Doyle 500,000 1,500,000 - (500,000) 1,500,000 750,000 B W Arnold - 800,000 - - 800,000 400,000
For
per
sona
l use
onl
y

RUM JUNGLE RESOURCES LTD
DIRECTORS’ REPORT
Page 39
REMUNERATION REPORT - AUDITED (continued)
Share holdings
The number of shares in the company held during the financial year by each director of Rum Jungle Resources Ltd and other key management personnel of the Group, including their personally related parties are set out below. There were no shares granted during the reporting period as compensation.
Name Balance at start of the year
Received during the year on exercise of
options
Other changes during the year
Balance at end of the
year
Directors of Rum Jungle Resources Ltd Ordinary Shares R J Annells and related parties 2,240,000 - - 2,240,000 D W Muller and related parties 8,400,522 - - 8,400,522 C N Tziolis and related parties 300,000 - 200,000 500,000 Other key management personnel of the Group N J Doyle and related parties 328,299 - - 328,299
End of Remuneration Report – Audited
____________________________________________________________________________________________________
INDEMNIFICATION AND INSURANCE OF DIRECTORS AND OFFICERS
During or since the end of the year, the Company has not given any indemnity to a current or former officers or auditor against a liability or made any agreement under which an officer or auditor may be given any indemnity of the kind covered by the Corporations Act 2001.
During the year, the Company paid premiums in respect of directors’ and officers’ indemnity insurance contracts for the period ended 30 June 2015. The insurance contracts offer continued indemnity to officers of the Company where the person is no longer an officer at the time the claim is made. The Company paid a premium of $32,500 to insure the directors and secretaries of the Company during the financial year. This does not include such liabilities that arise from conduct involving a wilful breach of duty by the officers or the improper use by the officers of their position or of information to gain advantage for them or someone else or to cause detriment to the Company.
For
per
sona
l use
onl
y

RUM JUNGLE RESOURCES LTD
DIRECTORS’ REPORT
Page 40
PROCEEDINGS ON BEHALF OF THE COMPANY
The Company is not aware that any person has applied to the Court under section 237 of the Corporations Act 2001 for leave to bring proceedings on behalf of the Company, or to intervene in any proceedings in which the Company is a party, for the purpose of taking responsibility on behalf of the Company for all or part of those proceedings.
The Company was not a party to proceedings during the year or to the date of this report.
NON-AUDIT SERVICES
The Company may decide to employ the auditor on assignments additional to their statutory audit duties where the auditor’s expertise and experience with the Company and/or the Group is appropriate.
The board has considered the non-audit services provided during the year by the auditor and is satisfied that the provision of non-audit services is compatible with and did not compromise the auditor independence requirements of the Corporations Act 2001 for the following reasons:
all non-audit services have been reviewed to ensure that they do not impact the impartiality and objectivity of the auditor;
the services provided do not undermine the general principles relating to Auditor independence as set out in APES 110 Code of Ethics for Professional Accountants.
Details of the amounts paid or payable to the auditors for audit services provided during the year are set out in note 17 in the financial report.
During the year the following fees were paid or payable for non-audit services provided by the auditor of the parent entity, its related practices and non-related audit firms:
Consolidated Group
2015 2014
$ $
Other assurance services
Advisory and acquisition services - -
Non-audit services
Taxation services - -
R&D support - 73,000
Total remuneration for non-audit services - 73,000
AUDITOR’S INDEPENDENCE DECLARATION
A copy of the auditor’s independence declaration as required under section 307C of the Corporations Act 2001 is set out on page 46.
This report is made in accordance with a resolution of the directors.
David W Muller Chris N Tziolis
Chairman Managing Director
Darwin, Northern Territory 28 September 2015
For
per
sona
l use
onl
y

RUM JUNGLE RESOURCES LTD
CORPORATE GOVERNANCE
Page 41
The Board of Directors is responsible for the corporate governance of Rum Jungle Resources Ltd (the Company) and its controlled entities (the Group). The Group acknowledges and adopts the best practice where reasonable, taking into account the size of the company activities, when establishing policy and procedures. Corporate governance is having a set of core values and behaviours that ensure integrity, accountability and protection of the interests of all stakeholders – including shareholders, personnel, suppliers and communities in which the Group operates.
The Board of Directors supports the Corporate Governance Principles and Recommendations (3rd Edition, released in March 2014) (ASX Recommendations) developed by the ASX Corporate Governance Council (Council) and in accordance with ASX listings rules uses these principles as guidelines for establishing policy and procedures.
The Company’s endeavours to follow guidelines and practices are broadly consistent with the ASX Recommendations. In some instances the Board considers that the implementation of a small number of ASX Recommendations is not appropriate or reasonable given the size of the company and the scale of operations as the company is in exploration and evaluation phase at this point in time.
The Corporate Governance Statement (CGS) and ASX Appendix 4G – Key to Disclosures lodged to the ASX disclose the extent to which the Company has followed the ASX Recommendations or otherwise departed from recommendations during the Reporting Period. The statement is current to the date 28
th September 2015 and addresses the following
principles:
ASX Corporate Governance Principles
Principle 1 – Lay solid foundations for management and oversight
Principle 2 – Structure the Board to add value
Principle 3 – Act ethically and responsibly
Principle 4 – Safeguard integrity in corporate reporting
Principle 5 – Make timely and balanced disclosure
Principle 6 – Respect the rights of security holders
Principle 7 – Recognise and manage risk
Principle 8 – Remunerate fairly and responsibly
The Company’s 2015 Corporate Governance Statement, ASX Appendix 4G (Key to Disclosures of Corporate Governance Principles and Recommendations) and other ancillary corporate governance related documents can also be sourced on the Company’s website at the following URL: http://www.rumjungleresources.com.au/about/corporate-governance
For
per
sona
l use
onl
y

RUM JUNGLE RESOURCES LTD
Page 42
Auditor’s Independence Declaration under Section 307Cof the Corporations Act 2001
For
per
sona
l use
onl
y

RUM JUNGLE RESOURCES LTD
Page 43
Contents
ANNUAL FINANCIAL REPORT – 30 JUNE 2015
Page
Financial Report
Consolidated Statement of Profit or Loss and Other Comprehensive Income 44
Consolidated Statement of Financial Position 45
Consolidated Statement of Changes in Equity 46
Consolidated Statement of Cash Flows 47
Notes to the Financial Statements 48
Directors’ Declaration 72
Independent Auditor’s Report 73
For
per
sona
l use
onl
y
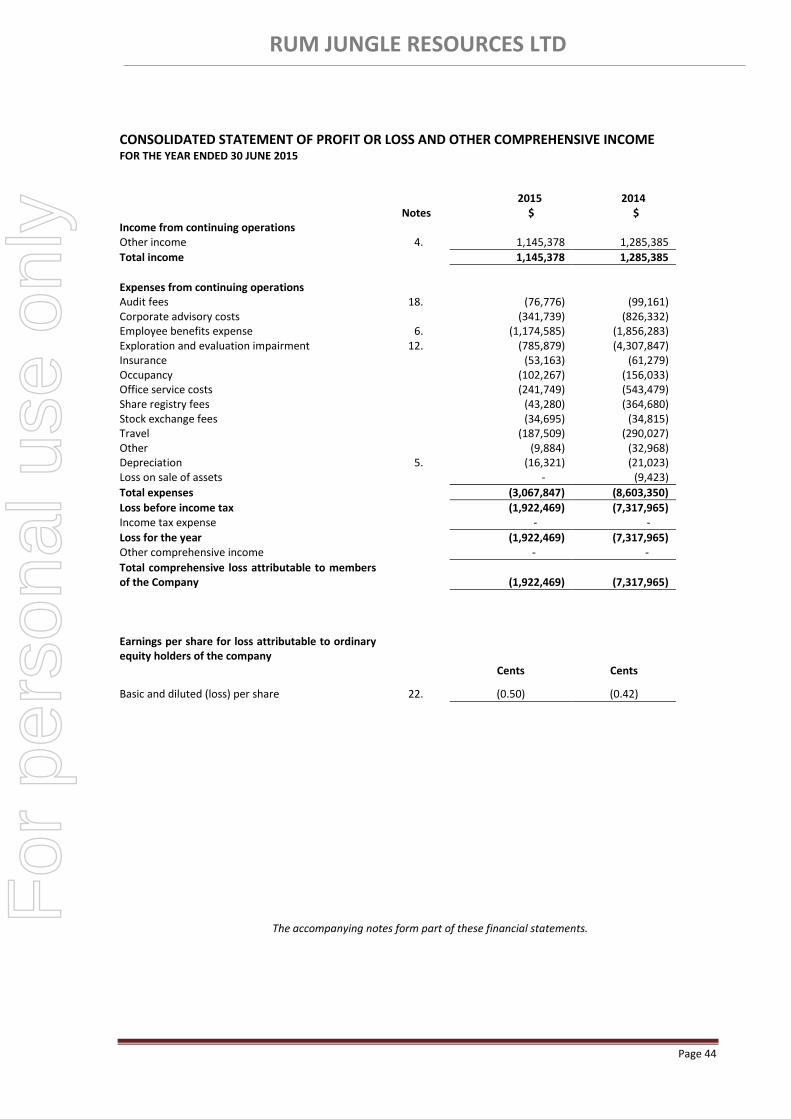
RUM JUNGLE RESOURCES LTD
Page 44
CONSOLIDATED STATEMENT OF PROFIT OR LOSS AND OTHER COMPREHENSIVE INCOME FOR THE YEAR ENDED 30 JUNE 2015
2015 2014 Notes $ $ Income from continuing operations Other income 4. 1,145,378 1,285,385
Total income 1,145,378 1,285,385
Expenses from continuing operations Audit fees 18. (76,776) (99,161) Corporate advisory costs (341,739) (826,332) Employee benefits expense 6. (1,174,585) (1,856,283) Exploration and evaluation impairment 12. (785,879) (4,307,847) Insurance (53,163) (61,279) Occupancy (102,267) (156,033) Office service costs (241,749) (543,479) Share registry fees (43,280) (364,680) Stock exchange fees (34,695) (34,815) Travel (187,509) (290,027) Other (9,884) (32,968) Depreciation 5. (16,321) (21,023) Loss on sale of assets - (9,423)
Total expenses (3,067,847) (8,603,350)
Loss before income tax (1,922,469) (7,317,965) Income tax expense - -
Loss for the year (1,922,469) (7,317,965) Other comprehensive income - -
Total comprehensive loss attributable to members of the Company
(1,922,469)
(7,317,965)
Earnings per share for loss attributable to ordinary equity holders of the company
Cents Cents
Basic and diluted (loss) per share 22. (0.50) (0.42)
The accompanying notes form part of these financial statements.
For
per
sona
l use
onl
y
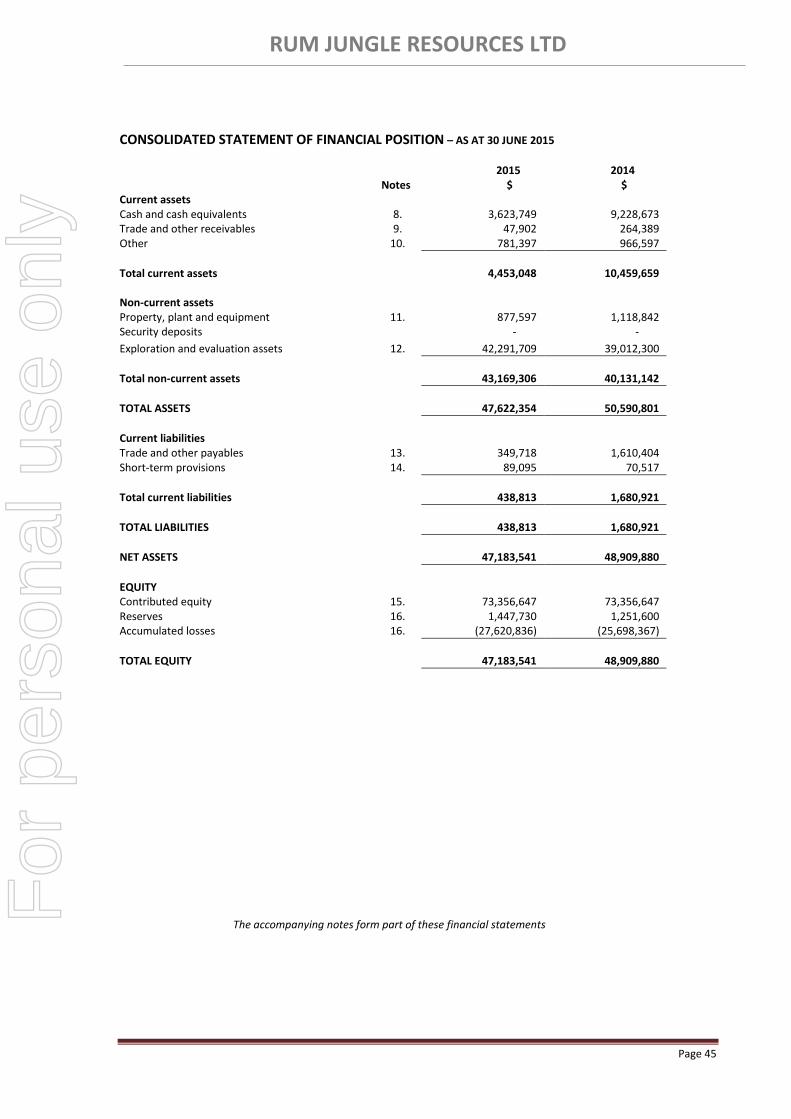
RUM JUNGLE RESOURCES LTD
Page 45
CONSOLIDATED STATEMENT OF FINANCIAL POSITION – AS AT 30 JUNE 2015
2015 2014 Notes $ $ Current assets Cash and cash equivalents 8. 3,623,749 9,228,673 Trade and other receivables 9. 47,902 264,389 Other 10. 781,397 966,597
Total current assets
4,453,048
10,459,659
Non-current assets
Property, plant and equipment 11. 877,597 1,118,842 Security deposits - -
Exploration and evaluation assets 12. 42,291,709 39,012,300
Total non-current assets
43,169,306
40,131,142
TOTAL ASSETS
47,622,354
50,590,801
Current liabilities
Trade and other payables 13. 349,718 1,610,404 Short-term provisions 14. 89,095 70,517
Total current liabilities
438,813
1,680,921
TOTAL LIABILITIES
438,813
1,680,921
NET ASSETS
47,183,541
48,909,880
EQUITY
Contributed equity 15. 73,356,647 73,356,647 Reserves 16. 1,447,730 1,251,600 Accumulated losses 16. (27,620,836) (25,698,367)
TOTAL EQUITY
47,183,541
48,909,880
The accompanying notes form part of these financial statements
For
per
sona
l use
onl
y

RUM JUNGLE RESOURCES LTD
Page 46
CONSOLIDATED STATEMENT OF CHANGES IN EQUITY – FOR THE YEAR ENDED 30 JUNE 2015
Share capital
Share-based payments
reserve
Accumulated
losses
Total
Notes $ $ $ $
2015
Balance at 30 June 2014
73,356,647 1,251,600 (25,698,367) 48,909,880
Loss for the year - - (1,922,469) (1,922,,469) Transfer from reserve - - - -
Shares issued during the year, net of transaction costs
-
-
-
-
Share based payment expense - 196,130 - 196,130
Balance at 30 June 2015
73,356,647 1,447,730 (27,620,836) 47,183,541
2014
Balance at 30 June 2013 52,273,138 1,251,600 (18,380,402) 35,144,336
Loss for the year - - (7,317,965) (7,317,965)
Transfer from reserve - - - -
Shares issued during the year, net of transaction costs
21,083,509
-
-
21,083,509
Share based payment expense - - - -
Balance at 30 June 2014
73,356,647 1,251,600 (25,698,367) 48,909,880
The accompanying notes form part of these financial statements.
For
per
sona
l use
onl
y

RUM JUNGLE RESOURCES LTD
Page 47
CONSOLIDATED STATEMENT OF CASH FLOWS – FOR THE YEAR ENDED 30 JUNE 2015
2015 2014 Notes $ $ Cash flows from operating activities Interest received 217,531 251,119 Subsidies received 973,406 949,016 Payments to suppliers and employees (3,174,964) (4,551,118)
Net cash (used in) operating activities
21 (a).
(1,984,027)
(3,350,983)
Cash flows from investing activities
Payments for property, plant and equipment
(10,943)
(93,013)
Acquisition of subsidiary net of cash acquired - (5,426,583) Receipts for property, plant and equipment 119,178 126,287 Payments for exploration and evaluation assets (3,913,132) (7,960,925)
Payments for security deposits - (84,578) Refund (Payments) for Term Deposits (secured) 184,000 (809,000) Recovery of security deposits - 1,122,170
Net cash (used in) investing activities
(3,620,897)
(13,125,642)
Cash flows from financing activities
Share issue (net of costs) - 12,660,020
Net cash provided by financing activities - 12,660,020
Net (decrease) in cash and cash equivalents
(5,604,924)
(3,816,605)
Cash and cash equivalents at the beginning of the year
9,228,673
13,045,278
Cash and cash equivalents at the end of the year
3,623,749
9,228,673
The accompanying notes form part of these financial statements.
For
per
sona
l use
onl
y
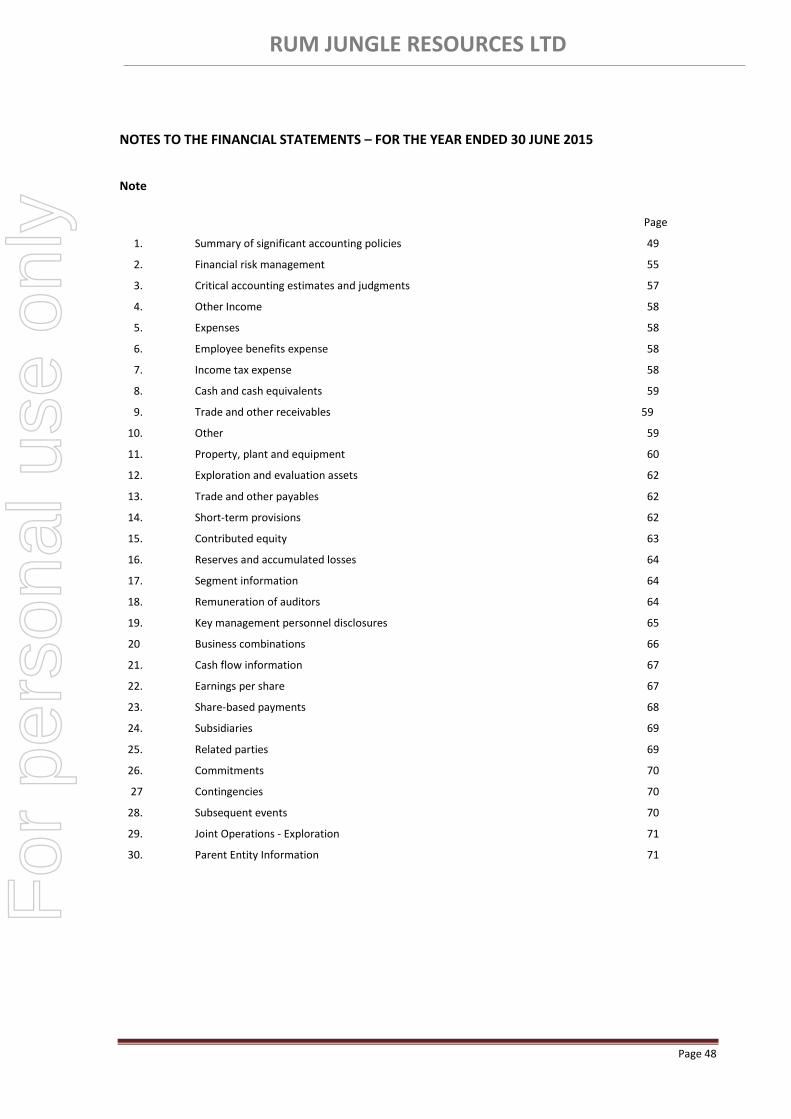
RUM JUNGLE RESOURCES LTD
Page 48
NOTES TO THE FINANCIAL STATEMENTS – FOR THE YEAR ENDED 30 JUNE 2015
Note
Page
1. Summary of significant accounting policies 49
2. Financial risk management 55
3. Critical accounting estimates and judgments 57
4. Other Income 58
5. Expenses 58
6. Employee benefits expense 58
7. Income tax expense 58
8. Cash and cash equivalents 59
9. Trade and other receivables 59
10. Other 59
11. Property, plant and equipment 60
12. Exploration and evaluation assets 62
13. Trade and other payables 62
14. Short-term provisions 62
15. Contributed equity 63
16. Reserves and accumulated losses 64
17. Segment information 64
18. Remuneration of auditors 64
19. Key management personnel disclosures 65
20 Business combinations 66
21. Cash flow information 67
22. Earnings per share 67
23. Share-based payments 68
24. Subsidiaries 69
25. Related parties 69
26. Commitments 70
27 Contingencies 70
28. Subsequent events 70
29. Joint Operations - Exploration 71
30. Parent Entity Information 71
For
per
sona
l use
onl
y

RUM JUNGLE RESOURCES LTD
NOTES TO THE FINANCIAL STATEMENTS FOR THE YEAR ENDED 30 JUNE 2015
Page 49
1. Summary of significant accounting policies
The consolidated financial statements of the company comprise the company and its subsidiaries (together the Group). The Group is a for profit entity and primarily is involved in the exploration of minerals and other metals and is domiciled in Australia.
The consolidated financial statements were authorised by the Board of Directors on 28 September 2015.
Basis of Preparation
The consolidated financial statements are general purpose financial statements that have been prepared in accordance with Australian Accounting Standards (AASBs), other authoritative pronouncements of the Australian Accounting Standards Board (AASB) and the Corporations Act 2001.
Australian Accounting Standards set out accounting policies that the AASB has concluded would result in financial statements containing relevant and reliable information about transactions, events and conditions. Compliance with Australian Accounting Standards ensures that the financial statements and notes also comply with International Financial Reporting Standards as issued by the International accounting Standards Board (IASB). Material accounting policies adopted in the preparation of these financial statements are presented below and have been consistently applied unless otherwise stated.
The financial statements have been prepared on an accruals basis and are based on historical costs, modified, where applicable, by the measurement at fair value of selected non-current assets, financial assets and financial liabilities.
The financial statements are presented in Australian dollars, which is the Group’s functional currency.
Going Concern
Notwithstanding the loss for the year of $1,922,469 the financial statements have been prepared on a going concern basis, which contemplates continuity of normal activities and realisation of assets and settlement of liabilities in the normal course of business. The Group’s current assets exceed its current liabilities at 30 June 2015 by $4,014,235 (2014: $8,778,738) and net cash outflows from operating activities were $1,984,027 for the year (2014: net operating outflow $3,350,983)
The Board believes the going concern basis of the financial statements is appropriate due to:
Availability of cash reserves of $3,623,749 at 30 June 2015;
The ability for the Group to manage the level of exploration activity relative to the availability of cash reserves;
The cash flow forecast indicates a positive cash position for 12 months until 30th
September 2016 with an assumption
for a capital raising for an amount in the region of $3 million during this period.
The Board anticipates the Group will be able to raise additional equity capital or funds from other sources for working capital and planned expenditure and has a history of securing such funding as required in the past to support their confidence. While the Board is confident in the ability to continue as a going concern, if the cash flow forecasts are adversely impacted by not being able to raise additional finance there would be material uncertainty as to whether the Group would be able to continue as a going concern beyond 12 months from the date the Directors sign the annual report.
Consequently, material uncertainty exists as to whether the Group will continue as a going concern and it may therefore be required to realise assets at amounts different to their carrying amounts in the statement of financial position and settle liabilities (and contingent liabilities) other than in the ordinary course of business.
a) Principles of consolidation
The consolidated financial statements incorporate the assets and liabilities of all subsidiaries of Rum Jungle Resources Limited (“company” or “parent entity”) as at 30 June 2015 and the results of all subsidiaries for the year then ended.
Subsidiaries are all those entities (including special purpose entities) over which the Group has the power to govern the financial and operating policies, generally accompanying a shareholding of more than one-half of the voting rights. The existence and effect of potential voting rights that are currently exercisable or convertible are considered when assessing whether the Group controls another entity.
Subsidiaries are fully consolidated from the date on which control is transferred to the Group.
The acquisition method of accounting is used to account for the acquisition of subsidiaries by the Group at the acquisition date.
For
per
sona
l use
onl
y
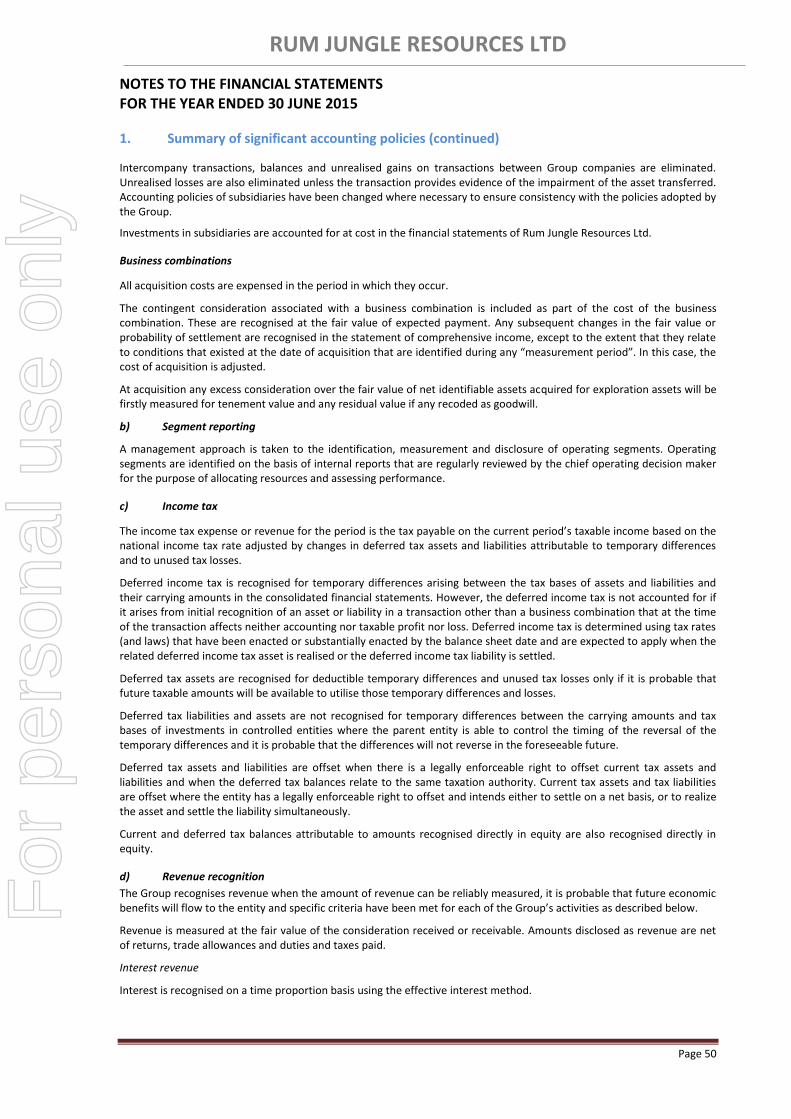
RUM JUNGLE RESOURCES LTD
NOTES TO THE FINANCIAL STATEMENTS FOR THE YEAR ENDED 30 JUNE 2015
Page 50
1. Summary of significant accounting policies (continued)
Intercompany transactions, balances and unrealised gains on transactions between Group companies are eliminated. Unrealised losses are also eliminated unless the transaction provides evidence of the impairment of the asset transferred. Accounting policies of subsidiaries have been changed where necessary to ensure consistency with the policies adopted by the Group.
Investments in subsidiaries are accounted for at cost in the financial statements of Rum Jungle Resources Ltd.
Business combinations
All acquisition costs are expensed in the period in which they occur.
The contingent consideration associated with a business combination is included as part of the cost of the business combination. These are recognised at the fair value of expected payment. Any subsequent changes in the fair value or probability of settlement are recognised in the statement of comprehensive income, except to the extent that they relate to conditions that existed at the date of acquisition that are identified during any “measurement period”. In this case, the cost of acquisition is adjusted.
At acquisition any excess consideration over the fair value of net identifiable assets acquired for exploration assets will be firstly measured for tenement value and any residual value if any recoded as goodwill.
b) Segment reporting
A management approach is taken to the identification, measurement and disclosure of operating segments. Operating segments are identified on the basis of internal reports that are regularly reviewed by the chief operating decision maker for the purpose of allocating resources and assessing performance.
c) Income tax
The income tax expense or revenue for the period is the tax payable on the current period’s taxable income based on the national income tax rate adjusted by changes in deferred tax assets and liabilities attributable to temporary differences and to unused tax losses.
Deferred income tax is recognised for temporary differences arising between the tax bases of assets and liabilities and their carrying amounts in the consolidated financial statements. However, the deferred income tax is not accounted for if it arises from initial recognition of an asset or liability in a transaction other than a business combination that at the time of the transaction affects neither accounting nor taxable profit nor loss. Deferred income tax is determined using tax rates (and laws) that have been enacted or substantially enacted by the balance sheet date and are expected to apply when the related deferred income tax asset is realised or the deferred income tax liability is settled.
Deferred tax assets are recognised for deductible temporary differences and unused tax losses only if it is probable that future taxable amounts will be available to utilise those temporary differences and losses.
Deferred tax liabilities and assets are not recognised for temporary differences between the carrying amounts and tax bases of investments in controlled entities where the parent entity is able to control the timing of the reversal of the temporary differences and it is probable that the differences will not reverse in the foreseeable future.
Deferred tax assets and liabilities are offset when there is a legally enforceable right to offset current tax assets and liabilities and when the deferred tax balances relate to the same taxation authority. Current tax assets and tax liabilities are offset where the entity has a legally enforceable right to offset and intends either to settle on a net basis, or to realize the asset and settle the liability simultaneously.
Current and deferred tax balances attributable to amounts recognised directly in equity are also recognised directly in equity.
d) Revenue recognition
The Group recognises revenue when the amount of revenue can be reliably measured, it is probable that future economic benefits will flow to the entity and specific criteria have been met for each of the Group’s activities as described below.
Revenue is measured at the fair value of the consideration received or receivable. Amounts disclosed as revenue are net of returns, trade allowances and duties and taxes paid.
Interest revenue
Interest is recognised on a time proportion basis using the effective interest method.
For
per
sona
l use
onl
y

RUM JUNGLE RESOURCES LTD
NOTES TO THE FINANCIAL STATEMENTS FOR THE YEAR ENDED 30 JUNE 2015
Page 51
1. Summary of significant accounting policies (continued)
e) Impairment of assets (other than exploration and evaluation)
Intangible assets that have an indefinite useful life are not subject to amortisation and are tested annually for impairment or more frequent if events or changes in circumstances indicate that they might be impaired. Other assets are reviewed for impairment whenever events or changes in circumstances indicate that the carrying amount may not be recoverable. An impairment loss is recognised in the statement of comprehensive income for the amount by which the asset’s carrying amount exceeds its recoverable amount. The recoverable amount is the higher of an asset’s fair value less costs to sell and value in use. For the purpose of assessing impairment, assets are grouped at the lowest levels for which there are separately identifiable cash inflows which are largely independent of the cash inflows from other assets or groups of assets (cash-generating units). Non-financial assets other than goodwill that suffered impairment are reviewed for possible reversal of impairment at each reporting date.
f) Cash and cash equivalents
For cash-flow presentation purposes cash and cash equivalents includes cash on hand, deposits held at call with financial institutions, other short-term, highly liquid investments with original maturities of three months or less that are readily convertible to known amounts of cash and which are subject to an insignificant risk of changes in value.
g) Exploration and evaluation expenditure
Exploration and evaluation costs, including costs of acquiring licences, are capitalised as exploration and evaluation assets on an areas of interest basis. Costs incurred before the Group has obtained the legal rights to explore an area are recognised as an expense in the income statement.
Exploration and evaluation assets are only recognised if the rights to the area of interest are current and either:
i. the expenditures are expected to be recouped through successful development and exploitation of the area of interest or by its sale; or
ii. activities in the areas of interest have not, at the reporting date, reached a stage which permits a reasonable assessment of the existence or otherwise of economically recoverable reserves, and active and significant operations in, or in relation to, the area of interest is continuing.
Exploration and evaluation assets are assessed for impairment when sufficient data exists to determine technical feasibility and commercial viability and information suggests that the carrying amount exceeds the recoverable amount. For the purposes of impairment testing, exploration and evaluation assets are allocated to cash-generating units to which the exploration activity relates. The cash generating unit shall not be larger than the area of interest.
Impairment will generally occur when the following circumstances exist:
The tenement has expired or will expire in the near future and is not expected to be renewed;
Further exploration and evaluation of mineral resources in the specific area are not budgeted or planned; and
Exploration and evaluation of mineral resources in the specific area have not led to the discovery of commercially
viable resources and the decision has been made to discontinue such activities in the specified area.
Once the technical feasibility and commercial viability of an area of interest are demonstrable, exploration and evaluation assets attributable to that area of interest are tested for impairment and then reclassified from exploration and evaluation expenditure to development assets.
Restoration costs that are incurred are capitalised into the cost of the exploration and evaluation phases that give rise to the need for restoration. Rehabilitation obligations are covered by lodgement of bank guarantees with the government.
h) Trade and other receivables
Trade and other receivables are recognised initially at fair value and subsequently measured at amortised cost using the effective interest method, less provision for impairment. Trade and other receivables are generally due for settlement within 30 days.
For
per
sona
l use
onl
y

RUM JUNGLE RESOURCES LTD
NOTES TO THE FINANCIAL STATEMENTS FOR THE YEAR ENDED 30 JUNE 2015
Page 52
1. Summary of significant accounting policies (continued)
i) Investments and other financial assets
The Group classifies its financial assets in the following categories: financial assets at fair value through profit or loss, available-for-sale, loans and receivables and held-to-maturity investments. The classification depends on the purpose for which the assets were acquired.
The Group has no financial assets at fair value through profit or loss, held-to-maturity investments or available-for-sale financial assets.
Loans and receivables
Loans and receivables are non-derivative financial assets with fixed or determinable payments that are not quoted in an active market. They are included in current assets, except for those with maturities greater than 12 months after the balance sheet date which are classified as non-current assets.
Subsequent to initial recognition, loans and receivables are carried at amortised cost using the effective interest rate method. The Group assesses at each balance date whether there is objective evidence that a financial asset or group of financial assets is impaired.
j) Trade and other payables
These amounts represent liabilities for goods and services provided to the Group prior to the end of financial year which are unpaid. The amounts are unsecured and are usually paid within 30 days of recognition.
k) Contributed equity
Ordinary shares are classified as equity.
Incremental costs directly attributable to the issue of new shares are shown in equity as a deduction, net of tax, from the proceeds.
l) Leases
Leases of property, plant and equipment where the Group, as lessee, has substantially all the risks and rewards of ownership, are classified as finance leases. Finance leases are capitalised at the lease’s inception at the fair value of the leased property or, if lower, the present value of the minimum lease payments. The corresponding rental obligations, net of financial charges, are included in liabilities. Each lease payment is allocated between the liability and finance cost. The finance cost is charged to the income statement over the lease period so as to produce a constant periodic rate of interest on the remaining balance of the liability for each period. The property, plant and equipment acquired under finance leases is depreciated over the estimated useful life of the asset. Where there is no reasonable certainty that the lessee will obtain ownership, the asset is depreciated over the shorter of the lease term and the asset’s useful life.
Leases in which a significant portion of the risks and rewards of ownership are not transferred to the Group as lessee are classified as operating leases. Payments made under operating leases are charged to the income statement on a straight-line basis over the period of the lease.
For
per
sona
l use
onl
y
RUM JUNGLE RESOURCES LTD
NOTES TO THE FINANCIAL STATEMENTS FOR THE YEAR ENDED 30 JUNE 2015
Page 53
1. Summary of significant accounting policies (continued)
m) Property, plant and equipment
Property, plant and equipment is stated at historical cost less depreciation. Historical cost includes expenditure that is directly attributable to the acquisition of the items.
Subsequent costs are included in the asset’s carrying amount or recognised as a separate asset, as appropriate, only when it is probable that future economic benefits associated with the item will flow to the Group and the cost of the item can be measured reliably. All other repairs and maintenance are charged to the income statement during the financial period in which they are incurred.
Depreciation of assets is generally calculated on the diminishing value (DV) method to allocate their cost, net of their residual values, over their estimated useful lives. The depreciation rates used for each class of depreciable asset are:
Classification Rate Depreciation Basis Motor vehicles 18.75% DV Scientific instruments 33.33% DV
Office equipment 15 – 50% DV Leasehold improvements 20% Straight line Furniture and fittings 11.25% DV Plant and equipment 7.5% DV Site camp equipment 7.5 – 20% DV
The assets’ residual values and useful lives are reviewed, and adjusted if appropriate, at each balance sheet date.
Gains and losses on disposals are determined by comparing proceeds with carrying amount. These are included in the income statement.
n) Employee benefits
i. Wages and salaries, annual leave and sick leave
Liabilities for wages and salaries, including non-monetary benefits and annual leave expected to be settled within 12 months of the reporting date are recognised in respect of employee’s services up to the reporting date and are measured at the amounts expected to be paid when the liabilities are settled.
ii. Long service leave
The liability for long service leave is recognised in the provision for employee benefits and measured as the present value of expected future payments to be made in respect of services provided by employees up to the reporting date. Consideration is given to anticipated future wages and salary levels, experience of employee departures and periods of service. Expected future payments are discounted using market yields at the reporting date on national government bonds with terms to maturity that match as closely as possible to the estimated future cash outflows.
iii. Superannuation
The Group makes contributions to defined contribution superannuation funds. Contributions are recognised as an expense as they become payable.
iv. Share-based payments
Share-based compensation benefits are provided to employees via the Rum Jungle Resources Limited Employee Share Option Plan.
The fair value of options granted for services rendered is recognised as an employee benefit expense with a corresponding increase in equity. The fair value is measured at grant date and recognised as an expense over the period during which the employee becomes unconditionally entitled to the options.
For
per
sona
l use
onl
y

RUM JUNGLE RESOURCES LTD
NOTES TO THE FINANCIAL STATEMENTS FOR THE YEAR ENDED 30 JUNE 2015
Page 54
1. Summary of significant accounting policies (continued)
o) Earnings per share
i. Basic earnings per share
Basic earnings per share is calculated by dividing the profit attributable to equity holders of the company, excluding any costs of servicing equity other than ordinary shares, by the weighted average number of ordinary shares outstanding during the financial year, adjusted for bonus elements in ordinary shares issued during the year.
ii. Diluted earnings per share
Diluted earnings per share adjusts the figures used in the determination of basic earnings per share to take into account the after income tax effect of interest and other financing costs associated with dilutive potential ordinary shares and the weighted average number of additional ordinary shares that would have been outstanding assuming the conversion of all dilutive potential ordinary shares.
p) Goods and services tax (GST)
Revenues, expenses and assets are recognised net of the amount of associated GST, unless the GST incurred is not recoverable from the taxation authority. In this case it is recognised as part of the cost of acquisition of the asset or as part of the expense.
Receivables and payables are stated inclusive of the amount of GST receivable or payable. The net amount of GST recoverable from, or payable to, the taxation authority is included with other receivables or payables in the balance sheet.
Cash flows are presented on a gross basis. The GST components of cash flows arising from investing or financing activities which are recoverable from, or payable to, the taxation authority, are presented as operating cash flows.
q) Dividends
Provision is made for the amount of any dividend declared, being appropriately authorised and no longer at the discretion of the entity, on or before the end of the financial year but not distributed at balance date.
r) Foreign currency translation
Foreign currency transactions are translated into the functional currency using the exchange rates prevailing at the dates of the transactions. Foreign exchange gains and losses resulting from the settlement of such transactions and from the translation at year end exchange rates of monetary assets and liabilities denominated in foreign currencies are recognised in the income statement.
s) New standards and interpretations not yet adopted
A number of new standards, amendments to standards and interpretations, are effective for annual periods beginning on or after 1 July 2014, and have not been applied in preparing these financial statements. The consolidated entity has reviewed these standards and interpretations, and with the exception of AASB 9 Financial Instruments, determined none of these standards and interpretations materially impacts the consolidated entity. AASB 9 Financial Instruments proposes a revised framework for the classification and measurement of financial instruments. The consolidated entity is currently assessing the impact of this standard although no material impact is anticipated.
For
per
sona
l use
onl
y

RUM JUNGLE RESOURCES LTD
NOTES TO THE FINANCIAL STATEMENTS FOR THE YEAR ENDED 30 JUNE 2015
Page 55
2. Financial risk management
The Group’s principal financial instruments comprise cash and term deposits. The main purpose of these financial instruments is to manage the finances for the Group’s operations. The Group has various other financial assets and liabilities such as trade receivables and trade payables, which arise directly from its operations. It is, and has been throughout the period under review, the Group’s policy that no trading in speculative financial instruments shall be undertaken. The main risks arising from the Group’s financial instruments are liquidity and interest rate risk (during the financial period and up to the date of this report).
Details of the significant accounting policies and methods adopted, including the criteria for recognition, the basis of measurement and the basis on which income and expenses are recognised, in respect of each class of financial asset and financial liability are disclosed in note 1 to the financial statements.
Primary responsibility for identification and control of financial risks rests with the Board of directors. However, the day-to-day management of these risks is under the control of the Managing Director and the Chief Financial Officer. The Board agrees with the strategy for managing future cash flow requirements and projections.
a) Financial instruments
The Group and the parent entity hold the following financial instruments:
Consolidated Group 2015 2014 $ $ Financial Assets
Cash and cash equivalents 3,623,749 9,228,673
Other 781,397 966,597
Trade and other receivables * 47,902 264,389
4,453,048 10,459,659
Financial Liabilities Trade and other payables ** 349,718 1,610,404
349,718 1,610,404
* Loans and receivables category ** Financial liabilities at amortised cost category
b) Market risk
i. Foreign exchange risk The Group does not operate internationally and is not exposed to foreign exchange risk.
ii. Price risk The Group is not exposed to any significant equity security or commodity price risk.
iii. Interest rate risk The Group’s exposure to interest rate risk arises predominately from cash and cash equivalents bearing variable interest rates. At balance date the Group maintained the following variable rate accounts:
30 June 2015 30 June 2014 Weighted
average interest rate
Balance Weighted average
interest rate
Balance
% $ % $ Cash and cash equivalents - floating 2.7 4,398,749 3.15 10,187,673 (including secured term deposits)
Total cash and cash equivalents 4,398,749
10,187,673
At balance date, if the interest rates had changed, as illustrated in the table below, with all other variables remaining constant, after-tax profit would have been affected as follows:
After-tax profit higher / (lower) Equity higher / (lower) 2015 2014 2015 2014 $ $ $ $ Consolidated +1% (100 bp) 43,987 101,876 43,987 101,876 -1% (100 bp) (43,987) (101,876) (43,987) (101,876)
For
per
sona
l use
onl
y
RUM JUNGLE RESOURCES LTD
NOTES TO THE FINANCIAL STATEMENTS FOR THE YEAR ENDED 30 JUNE 2015
Page 56
2. Financial risk management (continued)
c) Credit risk Credit risk primarily arises from cash and cash equivalents and term deposits deposited with banks. Cash and cash equivalents and term deposits are currently placed with Westpac Banking Corporation, which has an independently rated credit rating of AA. The maximum exposure to credit risk at the reporting date is the carrying amount of the financial assets as summarised in the table above.
d) Liquidity risk
Prudent liquidity risk management implies maintaining sufficient cash and cash equivalents in order to meet the Group’s forecast requirements. The Group manages liquidity risk by continuously monitoring forecast and actual cash flows and matching the maturity profiles of financial assets and liabilities. Surplus funds are generally only invested in bank deposits. At reporting date, the Group and parent entity did not have access to any undrawn borrowing facilities.
Maturity of financial liabilities
The table below analyses the Group’s financial liabilities into relevant maturity groupings based on the remaining period at the reporting date to the contractual maturity date.
Group – 30 June 2015
Less than 3 months Total contractual cash flows
Carrying amount
$ $ $ Trade and other payables 349,718 349,718 349,718 Group – 30 June 2014
Less than 3 months Total contractual cash flows
Carrying amount
$ $ $ Trade and other payables 1,610,404 1,610,404 1,610,404
e) Fair valuation estimation
The carrying amount of financial assets (net of any provision for impairment) and financial liabilities as disclosed in note 2 (a) above is assumed to approximate their fair values primarily due to their short maturities.
For
per
sona
l use
onl
y

RUM JUNGLE RESOURCES LTD
NOTES TO THE FINANCIAL STATEMENTS FOR THE YEAR ENDED 30 JUNE 2015
Page 57
3. Critical accounting estimates and judgments
Estimates and judgements are continually evaluated and are based on historical experience and other factors, including expectations of future events that may have a financial impact on the entity and that are believed to be reasonable under the circumstances. The resulting accounting estimates will, by definition seldom equal the related actual results.
Set out below is information about:
critical judgments in applying accounting policies that have the most significant effect on the amounts recognised in
the financial statements; and
assumptions and estimates that have risk of resulting in adjustments that may be material is subsequent financial
years.
Critical judgements
Going concern
A key assumption underlying the preparation of the financial statements is that the entity will continue as a going concern. As a going concern the group is considered to be able to pay its debts as and when they are due and to continue in operation without any intention or necessity to liquidate or otherwise wind up operations. A significant amount of judgement has been required in assessing that the entity is a going concern.
Deferred tax assets
The Group has made a judgement not to recognise the deferred tax assets disclosed in note 7(b) as the directors remain uncertain as to their future opportunity for application against any future taxable income.
Estimates and assumptions
Exploration and evaluation assets (note 12)
Determining the recoverability of exploration and evaluation expenditure capitalised in accordance with the group’s accounting policy (note 1 (g)) requires estimates and assumptions as to future events and circumstances, in particular, whether successful development and commercial exploitation or sale of the respective areas of interest will be achieved. Critical to this assessment is the estimates and assumptions as to Ore Resources, timing of the expected cash flows, exchange rates, commodity prices and future capital requirements. The Group determines and reports ore resources under the standards incorporated in the Australasian Code for Reporting Exploration Results, Mineral Resources and Ore Reserves, 2012 edition (the JORC Code).
Changes in these estimates and assumptions as new information about the presence or recoverability of ore resources becomes available, may impact the assessment of the recoverable amount of exploration and evaluation assets. If, after having capitalised the expenditure a judgement is made that recovery of the expenditure is unlikely, an impairment loss is recorded in the statement of profit or loss and other comprehensive income.
Where exploration and evaluation activities in a particular area of interest have not reached a stage to allow a reasonable assessment to be made regarding the existence of economically recoverable reserves results will be reviewed as test work continues. Accordingly, exploration and evaluation assets may be subject to impairment in the future.
Impairment of assets
The recoverable amount of each non-financial asset or cash-generating unit (CGU) is determined as the higher of the potential value in use and fair value less costs to sell. Determination of the recoverable amount of an asset or CGU based on a discounted cash flow model requires the use of estimates and assumptions, including discount rate, timing of probable cash flows, the expected life of the resource, exchange rates, commodity prices, capital requirements and future operating performance. Changes in these estimates and could result in an adjustment to the carrying amount of an asset.
For
per
sona
l use
onl
y
RUM JUNGLE RESOURCES LTD
NOTES TO THE FINANCIAL STATEMENTS FOR THE YEAR ENDED 30 JUNE 2015
Page 58
2015 2014
$ $
4. Other income
Interest income 189,849 278,801 Research & Development Subsidy 922,939 999,484 Profit on disposal of fixed assets 32,590 7,100
1,145,378 1,285,385
5. Expenses
Depreciation of non-current assets Motor vehicles * 66,473 89,331 Scientific instruments * 10,439 15,537 Office equipment 13,487 17,056 Furniture & fittings 2,389 2,683 Leasehold improvements 445 1,284 Plant & equipment * 34,830 40,913 Site camp equipment * 37,537 40,568
165,600 207,372 *Depreciation of exploration assets capitalised to Exploration and evaluation assets (149,279) (186,349)
16,321 21,023
6. Employee benefits expense
Wages, salaries, directors’ fees, and other remuneration expenses 1,509,276 2,622,605 Superannuation 126,395 153,455 Share-based payments expense 196,130 - Movement in annual leave provision 18,578 5,224 Capitalised to exploration and evaluation assets (675,794) (925,001)
1,174,585 1,856,283
7. Income tax expense
(a) Reconciliation of income tax expense to prima facie tax Loss before income tax (1,922,469) (7,317,965) Tax (Benefit) thereon at 30% (2014: 30%) (576,741) (2,195,390) Tax effect of amounts that are not deductible/ (taxable) in calculating taxable income:
Research and development tax credit (276,882) (299,845) Share based expense 58,839 - Non-deductible items 62,131 216,770 Sundry timing differences (3,524,396) (1,308,534) Effect of change in tax values of assets on tax consolidation (1,781,435) (Under) / Overstated prior year - 160,893
(6,038,484) (3,426,106)
Deferred tax assets not recognised 6,038,484 3,426,106
Income tax expense - -
For
per
sona
l use
onl
y

RUM JUNGLE RESOURCES LTD
NOTES TO THE FINANCIAL STATEMENTS FOR THE YEAR ENDED 30 JUNE 2015
Page 59
2015 2014
$ $
7. Income tax expense (continued)
(b) Unrecognised deferred tax assets
Deferred tax assets have not been recognised in respect of the following items:
Tax losses 26,221,239 20,588,048 Temporary differences (8,068,686) (4,518,683)
Temporary differences and tax losses 18,152,553 16,069,365
Tax expense / income, deferred tax liabilities and deferred tax assets arising from temporary differences and tax losses are not recognised as it is not probable that currently the Group can assume that future taxable profits will be available against which deductible temporary differences and tax losses can be utilised in the short to medium term.
(c) Tax consolidation
The company and its wholly-owned Australian entities formed a tax-consolidated group on 1 July 2014 and therefore are taxed as a single consolidated entity. Rum Jungle Resources is the head entity for the tax-consolidated group.
Due to the existence of a tax funding arrangement between the entities in the tax-consolidated group, amounts can be recognised as payable to or receivable by the company and each member of the group in relation to the tax contribution amounts paid or payable between the parent entity and the other members of the tax-consolidated group in accordance with the arrangement.
Nature of tax funding arrangements and tax sharing agreements
Entities within the tax-consolidated group have entered into a tax funding arrangement and a tax-sharing agreement with the head entity. Under the terms of the tax funding arrangement, Rum Jungle Resources Limited and each of the entities in the tax-consolidated group has agreed to pay a tax equivalent payment to or from the head entity, based on the current and tax liability or current tax asset of the entity.
The tax sharing agreement entered into between members of the tax-consolidated group provides for the determination of the allocation of income tax liabilities between the entities should the head entity default on its tax payment obligations or if an entity leaves the tax-consolidated group. The effect of the tax sharing agreement is that each member's liability for tax payable by the tax-consolidated group is limited to the amount payable to the head entity under the tax funding arrangement.
8. Cash and cash equivalents
Cash at bank and on hand 1,783,749 3,152,873 Term Deposits 1,840,000 6,075,800
3,623,749 9,228,673
Cash in at call bank accounts bear floating interest rates of an average 2.2% (2014: 2.8%). Term deposits during the year were held with Westpac Banking Corporation and ANZ. They had an average maturity of 3 months and earned interest of approximately 3.0%.
9. Trade and other receivables
Current Other receivables 47,902 264,389
Other receivables mainly represent entitlement to interest receivable on term deposits and recoverable GST. No receivables are past due or impaired.
10. Other
Prepayments 6,397 7,597 Term Deposits (secured against Bank Guarantees in lieu of Security Deposits)
775,000
959,000
781,397 966,597
For
per
sona
l use
onl
y

RUM JUNGLE RESOURCES LTD
NOTES TO THE FINANCIAL STATEMENTS FOR THE YEAR ENDED 30 JUNE 2015
Page 60
2015 2014
$ $
11. Property, plant and equipment
Motor vehicles – at cost 519,296 691,317 Accumulated depreciation (283,027) (304,261)
236,269 387,056
Scientific instruments – at cost 191,752 191,752 Accumulated depreciation (170,273) (159,834)
21,479 31,918
Office equipment – at cost 133,193 132,011 Accumulated depreciation (111,090) (97,603)
22,103 34,408
Furniture and fittings – at cost 43,034 43,034 Accumulated depreciation (24,185) (21,796)
18,849 21,238
Leasehold improvements – at cost 75,821 75,821 Accumulated depreciation (74,043) (73,598)
1,778 2,223
Plant and equipment – at cost 263,271 257,314 Accumulated depreciation (91,335) (57,027)
171,936 200,287
Site camp equipment – at cost 531,702 530,694 Accumulated depreciation (126,519) (88,982)
405,183 441,712
Total property , plant and equipment
877,597
1,118,842
Summary of individual asset groups
Motor vehicles
Carrying amount at beginning of year 387,056 440,823 Acquisition through business combination - 46,028 Additions - 1,414 Disposals (84,314) (11,878) Depreciation (66,473) (89,331) Impairment loss - -
Carrying amount at end of year 236,269 387,056
Scientific instruments
Carrying amount at beginning of year 31,918 47,455 Additions - - Disposals - - Depreciation (10,439) (15,537) Impairment loss - -
Carrying amount at end of year 21,479 31,918
For
per
sona
l use
onl
y

RUM JUNGLE RESOURCES LTD
NOTES TO THE FINANCIAL STATEMENTS FOR THE YEAR ENDED 30 JUNE 2015
Page 61
2015 2014 $ $
11. Property, plant and equipment (continued)
Site camp equipment
Carrying amount at beginning of year 441,712 466,288
Additions 1,008 15,992
Disposals - -
Depreciation (37,537) (40,568)
Carrying amount at end of year 405,183 441,712
Group Summary
Carrying Amount at beginning of year 1,118,842 1,154,823
Acquisition through business combination - 90,255
Additions 10,943 93,014
Disposals (86,588) (11,878)
Depreciation (165,600) (207,372)
Impairment (loss)/profit on disposal - -
Carrying amount at end of year 877,597 1,118,842
Office equipment
Carrying amount at beginning of year 34,408 23,914 Acquisition through business combination - 15,332 Additions 1,182 12,218 Disposals - - Depreciation (13,487) (17,056) Impairment loss - -
Carrying amount at end of year 22,103 34,408
Furniture and fittings
Carrying amount at beginning of year 21,238 23,649 Additions - 272 Disposals - - Depreciation (2,389) (2,683)
Carrying amount at end of year 18,849 21,238
Leasehold improvements
Carrying amount at beginning of year 2,223 3,507 Additions - - Disposals - - Depreciation (445) (1,284)
Carrying amount at end of year 1,778 2,223
Plant and equipment
Carrying amount at beginning of year 200,287 149,187
Acquisition through business combination - 28,895 Additions 8,753 63,118 Disposals (2,274) - Depreciation (34,830) (40,913)
Carrying amount at end of year 171,936 200,287
For
per
sona
l use
onl
y

RUM JUNGLE RESOURCES LTD
NOTES TO THE FINANCIAL STATEMENTS FOR THE YEAR ENDED 30 JUNE 2015
Page 62
2015 2014 $ $
12. Exploration and evaluation assets
At cost 42,291,709 39,012,300
Carrying amount at beginning of year 39,012,300 21,258,610 Allocation through business combination - 13,570,741 Expenditure 4,065,288 7,937,455 Impairment of exploration and evaluation assets (785,879) (4,307,847) Acquisition of Tenements - 662,937 Sale of Tenements - (109,596)
Carrying amount at end of year 42,291,709 39,012,300
The ultimate recoupment of these costs is dependent upon the successful development and commercial exploitation, or alternatively sale, of the respective areas of interest.
The exploration and evaluation targets are assessed regularly and when an area of interest has been adequately tested and deemed unprospective for target commodities the tenement costs are impaired where there is no further work anticipated and no development potential. The impairment reflects management assessment for tenements where evaluation has been assessed to be complete during the period and as the focus moves to new areas of interest, which includes a focus on fertilizer minerals phosphate and potash. Any exploration costs in the period that are not captured specifically as tenement associated costs are include in the impairment charge.
13. Trade and other payables
Trade creditors 236,756 809,209
Other creditors 67,962 751,195
Accrued expenses 45,000 50,000
Total trade and other payables 349,718 1,610,404
Trade payables and accrued expenses are generally unsecured, non-interest bearing and due approximately 1 month from the date of recognition.
14. Short-term provisions
Employee entitlements 89,095 70,517
For
per
sona
l use
onl
y

RUM JUNGLE RESOURCES LTD
NOTES TO THE FINANCIAL STATEMENTS FOR THE YEAR ENDED 30 JUNE 2015
Page 63
15. Contributed equity
Company 2015 2014 $ $ Ordinary shares – fully paid 73,356,647 73,356,647
(a) Movements in contributed equity
No. of shares $ Balance at 30 June 2014 385,504,597 73,356,647 Shares issued - -
Balance at 30 June 2015 385,504,597 73,356,647
Ordinary shares entitle the holder to participate in dividends and the proceeds on winding up of the company in proportion to the number of and amounts paid on the shares held.
On a show of hands every holder of ordinary shares present at a meeting or in person or by proxy, is entitled to one vote, and upon a poll, each share is entitled to one vote.
(b) Capital risk management
When managing capital, management’s objective is to ensure the entity continues as a going concern and to maintain a structure that ensures the lowest cost of capital available and to ensure adequate capital is available for exploration and evaluation of tenements.
In order to maintain or adjust the capital structure, the Group may seek to issue new shares.
Consistent with others in the industry, the Group and the parent entity monitor capital on the basis of forecast exploration and evaluation expenditure required to reach a stage which permits a reasonable assessment of the existence or otherwise of an economically recoverable reserve. Total capital is calculated as “equity” as shown in the balance sheets.
(c) Share options
At 30 June 2015, the following options for ordinary shares in Rum Jungle Resources Ltd were on issue:
2015 2014
Number Number
Director options 15,500,000 10,500,000
Employee options 3,100,000 900,000
18,600,000 11,400,000
For
per
sona
l use
onl
y
RUM JUNGLE RESOURCES LTD
NOTES TO THE FINANCIAL STATEMENTS FOR THE YEAR ENDED 30 JUNE 2015
Page 64
16. Reserves and accumulated losses
2015 2014 $ $ (a) Reserves
Share-based payments reserve 1,447,730 1,251,600
Movements:
Share-based payments reserve
Balance at beginning of year 1,251,600 1,251,600
Share based payment expense 196,130 -
Balance at end of year 1,447,730 1,251,600
(b) Accumulated losses
Movements in accumulated losses were as follows:
Balance at beginning of year (25,698,367) (18,380,402)
Net profit / (loss) for the year (1,922,469) (7,317,965)
Transfer from reserve - -
Balance at end of year (27,620,836) (25,698,367)
(c) Nature and purpose of reserves
Share-based payments reserve The share-based payments reserve is used to recognise the fair value of options granted over the vesting period.
17. Segment Information
Segment information is presented using a “management approach” i.e. segment information is provided on the same basis as information used for internal reporting purposes by the board including making strategic decisions. The Board has determined that there is only one operating segment because there is no other discrete information provided to them. The Board only receives consolidated financial information for the company. The company operates in one business segment being mineral exploration and evaluation and one geographic segment being Northern Australia.
The company is not selling products and as such no information has been provided on a product basis. The company has no sales revenue and no customers. As such no information is relevant for sales revenue on a geographic basis.
18. Remuneration of auditors
During the year the following fees were paid or payable for services provided by the auditor of the parent entity.
1. Audit services
2015 $
2014 $
KPMG 76,776 99,161
2. Other services
Other advisory, taxation and acquisition - 73,000
76,776 172,161
For
per
sona
l use
onl
y

RUM JUNGLE RESOURCES LTD
NOTES TO THE FINANCIAL STATEMENTS FOR THE YEAR ENDED 30 JUNE 2015
Page 65
19. Key management personnel disclosures
Key management personnel compensation
2015 2014 $ $ Short-term employee benefits 1,019,717 1,320,021 Post-employment benefits 79,875 89,549 Share-based payments 176,690 - Termination benefits – Liability at 30 June 2014 - 262,500
1,276,282 1,672,070
As expensed to the profit and loss statement and/or capitalised to exploration.
Information regarding individual director and other key management compensation is included in the remuneration
report in the Directors’ report
Loans to key management personnel
There were no loans to key management personnel at any time during the financial year.
Other transactions with key management personnel
There were no other transactions with key management personnel other than reimbursement of company expenses incurred by them in performing their respective duties.
For
per
sona
l use
onl
y
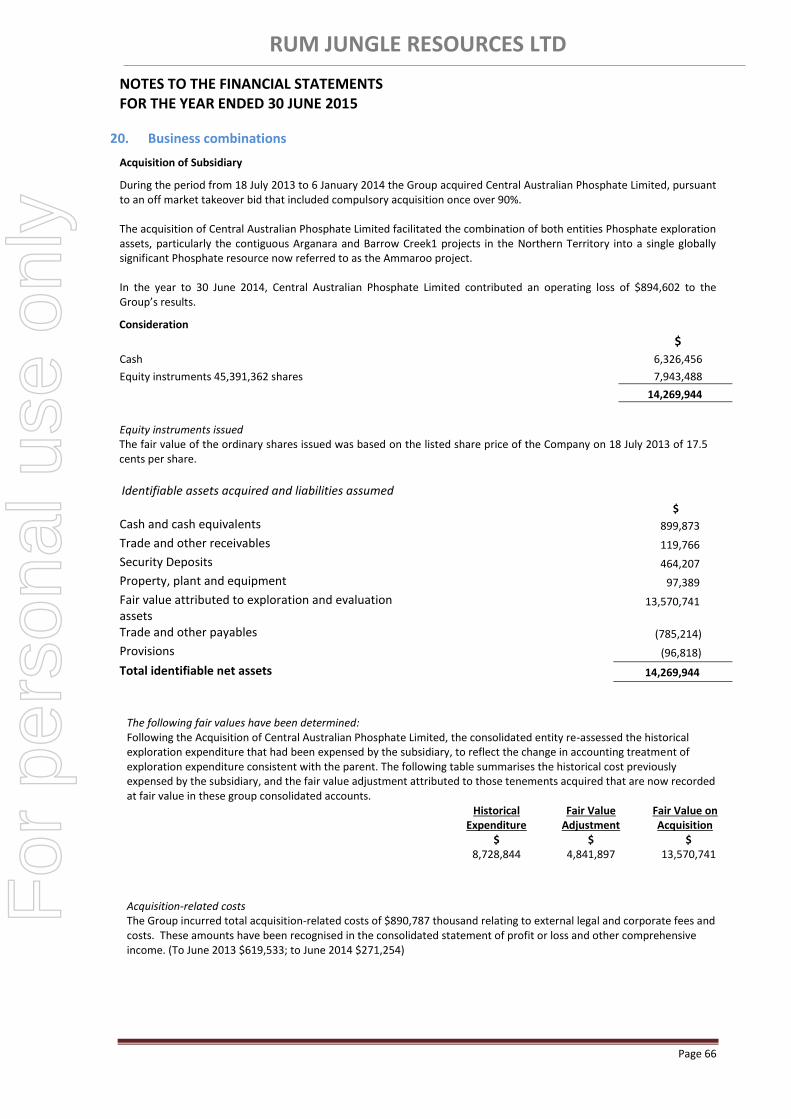
RUM JUNGLE RESOURCES LTD
NOTES TO THE FINANCIAL STATEMENTS FOR THE YEAR ENDED 30 JUNE 2015
Page 66
20. Business combinations
Acquisition of Subsidiary
During the period from 18 July 2013 to 6 January 2014 the Group acquired Central Australian Phosphate Limited, pursuant to an off market takeover bid that included compulsory acquisition once over 90%. The acquisition of Central Australian Phosphate Limited facilitated the combination of both entities Phosphate exploration assets, particularly the contiguous Arganara and Barrow Creek1 projects in the Northern Territory into a single globally significant Phosphate resource now referred to as the Ammaroo project. In the year to 30 June 2014, Central Australian Phosphate Limited contributed an operating loss of $894,602 to the Group’s results.
Consideration
$
Cash 6,326,456
Equity instruments 45,391,362 shares 7,943,488
14,269,944
Equity instruments issued The fair value of the ordinary shares issued was based on the listed share price of the Company on 18 July 2013 of 17.5 cents per share.
Identifiable assets acquired and liabilities assumed
$
Cash and cash equivalents 899,873
Trade and other receivables 119,766
Security Deposits 464,207
Property, plant and equipment 97,389
Fair value attributed to exploration and evaluation assets
13,570,741
Trade and other payables (785,214)
Provisions (96,818)
Total identifiable net assets 14,269,944
The following fair values have been determined: Following the Acquisition of Central Australian Phosphate Limited, the consolidated entity re-assessed the historical exploration expenditure that had been expensed by the subsidiary, to reflect the change in accounting treatment of exploration expenditure consistent with the parent. The following table summarises the historical cost previously expensed by the subsidiary, and the fair value adjustment attributed to those tenements acquired that are now recorded at fair value in these group consolidated accounts.
Historical Expenditure
Fair Value Adjustment
Fair Value on Acquisition
$ $ $ 8,728,844 4,841,897 13,570,741
Acquisition-related costs The Group incurred total acquisition-related costs of $890,787 thousand relating to external legal and corporate fees and costs. These amounts have been recognised in the consolidated statement of profit or loss and other comprehensive income. (To June 2013 $619,533; to June 2014 $271,254)
For
per
sona
l use
onl
y
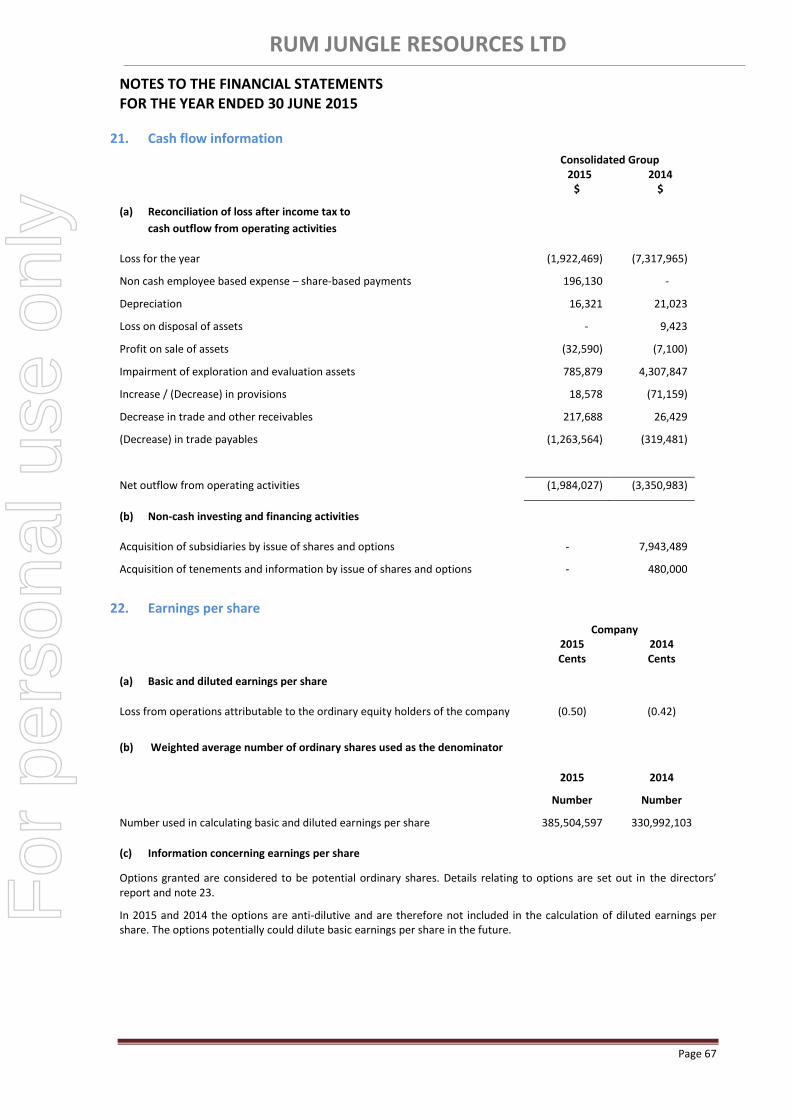
RUM JUNGLE RESOURCES LTD
NOTES TO THE FINANCIAL STATEMENTS FOR THE YEAR ENDED 30 JUNE 2015
Page 67
21. Cash flow information
Consolidated Group 2015 2014 $ $
(a) Reconciliation of loss after income tax to
cash outflow from operating activities
Loss for the year (1,922,469) (7,317,965)
Non cash employee based expense – share-based payments 196,130 -
Depreciation 16,321 21,023
Loss on disposal of assets - 9,423
Profit on sale of assets (32,590) (7,100)
Impairment of exploration and evaluation assets 785,879 4,307,847
Increase / (Decrease) in provisions 18,578 (71,159)
Decrease in trade and other receivables 217,688 26,429
(Decrease) in trade payables (1,263,564) (319,481)
Net outflow from operating activities (1,984,027) (3,350,983)
(b) Non-cash investing and financing activities
Acquisition of subsidiaries by issue of shares and options - 7,943,489
Acquisition of tenements and information by issue of shares and options - 480,000
22. Earnings per share
Company 2015 2014 Cents Cents
(a) Basic and diluted earnings per share
Loss from operations attributable to the ordinary equity holders of the company (0.50) (0.42)
(b) Weighted average number of ordinary shares used as the denominator
2015 2014
Number Number
Number used in calculating basic and diluted earnings per share 385,504,597 330,992,103
(c) Information concerning earnings per share
Options granted are considered to be potential ordinary shares. Details relating to options are set out in the directors’ report and note 23.
In 2015 and 2014 the options are anti-dilutive and are therefore not included in the calculation of diluted earnings per share. The options potentially could dilute basic earnings per share in the future.
For
per
sona
l use
onl
y

RUM JUNGLE RESOURCES LTD
NOTES TO THE FINANCIAL STATEMENTS FOR THE YEAR ENDED 30 JUNE 2015
Page 68
23. Share-based payments
Options have been issued to key management personnel. The number of options issued, the strike price of options issued and all other relevant terms have been set having regard to the person’s position in the Company and level of experience. All employee options have a maximum life of three to four years. Such options vest according to the terms that are agreed at the time of grant between Rum Jungle Resources Ltd and the employee, however options normally vest either immediately upon grant or progressively over the life of the option. Upon termination by either Rum Jungle Resources Ltd or by the employee, vested options can be exercised up to 30 days after termination. Upon termination all unvested options normally lapse.
Set out below are the summaries of options granted as share-based payments for services and incentives to directors and employees.
Grant date
Expiry date
Exercise
Price
Balance at start of the
year
Number
Granted during the
year
Number
Exercised during the
year
Number
Forfeited during the
year
Number
Balance at end of the
year
Number
Vested and exercisable at
end of the year
Number Group – 2015 04/04/2011 04/04/2015 $1.50 500,000 - - 500,000 - - 01/08/2011 31/07/2014 $1.50 400,000 - - 400,000 - - 19/12/2012 15/10/2015 $0.43 1,500,000 - - - 1,500,000 1,500,000 19/12/2012 15/10/2015 $0.49 9,000,000 - - - 9,000,000 9,000,000 01/07/2014 01/07/2018 $0.1671 - 4,550,000 - - 4,550,000 4,550,000 01/07/2014 01/07/2019 $0.2171 - 3,550,000 - - 3,550,000 -
11,400,000 8,100,000 - 900,000 18,600,000 15,050,000
Weighted average exercise price $0.64 $0.189 - $1.50 $0.3541 $0.3864
Weighted average share price at exercise date
-
Group – 2014 04/04/2011 04/04/2014 $1.00 500,000 - - 500,000 - - 04/04/2011 04/04/2015 $1.50 500,000 - - - 500,000 500,000 01/08/2011 31/07/2013 $1.00 600,000 - - 600,000 - - 01/08/2011 31/07/2014 $1.50 600,000 - - 200,000 400,000 400,000 19/12/2012 15/10/2015 $0.43 1,500,000 - - - 1,500,000 1,500,000 19/12/2012 15/10/2015 $0.49 9,000,000 - - - 9,000,000 9,000,000
12,700,000 - - 1,300,000 11,400,000 11,400,000
Weighted average exercise price $0.61 - - $1.08 $0.56 $0.64
900,000 options expired or were forfeited during the reporting period and no options were exercised.
The assessed fair value at grant date of options issued is determined using the Black Scholes option pricing model which takes into account the exercise price, the term of the option, the share price at grant date and expected volatility of the underlying share, the expected dividend yield and the risk free rate for the term of the option.
In respect of the options issued to employees during the year, the model inputs were as follows:
Total Options Issued 8,100,000 4,550,000 3,550,000 Consideration - - Options Life 4 years 5 years Exercise price $0.1671 $0.2171 Share price at valuation date 8.6c 8.6c Expected volatility 66% 66% Expected dividend yield - - Risk free interest rate 2.68% 2.85%
The weighted average fair value of options granted was $0.0242. The expected price volatility is based on the historical volatility of a number of similar entities (based on a period with a similar life of the options).
For
per
sona
l use
onl
y

RUM JUNGLE RESOURCES LTD
NOTES TO THE FINANCIAL STATEMENTS FOR THE YEAR ENDED 30 JUNE 2015
Page 69
23. Share-based payments (continued)
2015 2014 Expenses arising from share-based transactions $ $ Options issued to directors and employees - Employee benefits expense 196,130 -
196,130 -
24. Subsidiaries
The consolidated financial statements of Rum Jungle Resources Ltd incorporate the assets, liabilities and results of the following subsidiaries in accordance with the accounting policy described in note 1(a).
Name of entity Country of incorporation
Class of shares Equity holding*
2015 2014
% %
Territory Mining Pty Ltd Australia Ordinary 100 100
Waanyi Garawa Mining Pty Ltd Australia Ordinary 100 100
Territory Phosphate Pty Ltd Australia Ordinary 100 100
Central Australian Phosphate Pty Ltd Australia Ordinary 100 100
*The proportion of ownership interest is equal to the proportion of voting power held.
25. Related parties
a. Key management personnel
Disclosures relating to key management personnel are set out in note 19.
b. Loans to/from related parties
The company has not entered into any loan agreements with related parties.
For
per
sona
l use
onl
y
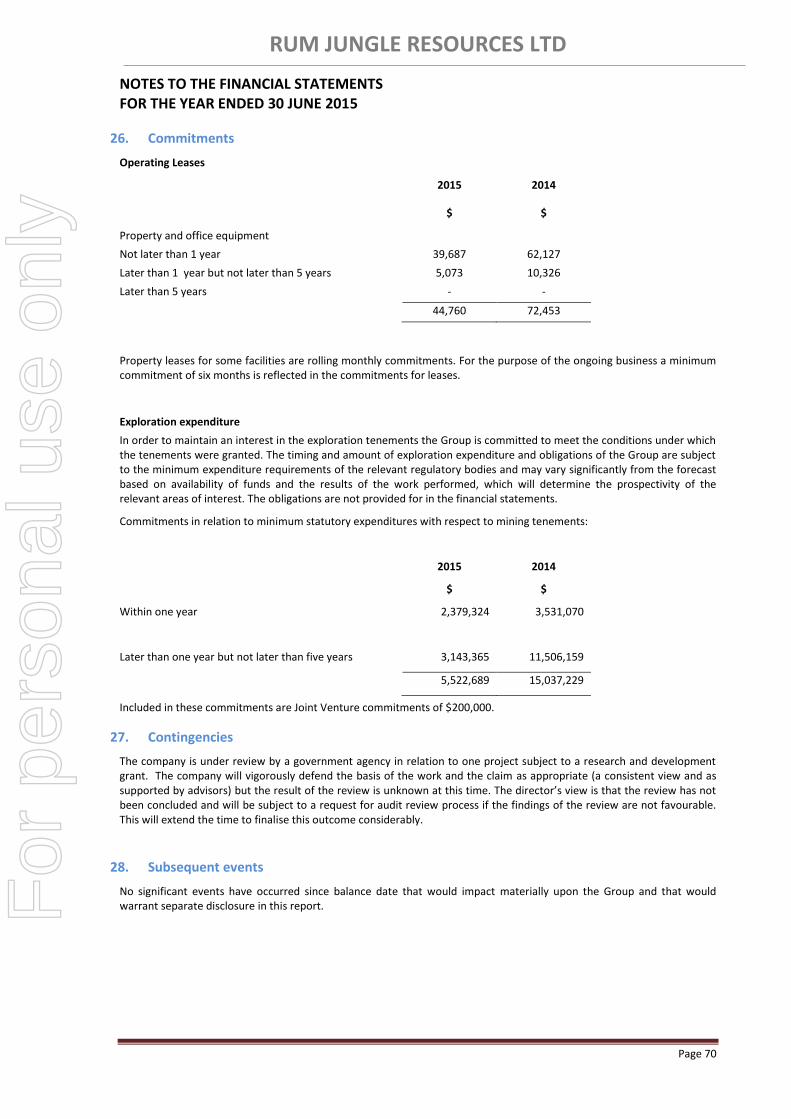
RUM JUNGLE RESOURCES LTD
NOTES TO THE FINANCIAL STATEMENTS FOR THE YEAR ENDED 30 JUNE 2015
Page 70
26. Commitments
Operating Leases
2015 2014
$ $
Property and office equipment
Not later than 1 year 39,687 62,127
Later than 1 year but not later than 5 years 5,073 10,326
Later than 5 years - -
44,760 72,453
Property leases for some facilities are rolling monthly commitments. For the purpose of the ongoing business a minimum commitment of six months is reflected in the commitments for leases.
Exploration expenditure
In order to maintain an interest in the exploration tenements the Group is committed to meet the conditions under which the tenements were granted. The timing and amount of exploration expenditure and obligations of the Group are subject to the minimum expenditure requirements of the relevant regulatory bodies and may vary significantly from the forecast based on availability of funds and the results of the work performed, which will determine the prospectivity of the relevant areas of interest. The obligations are not provided for in the financial statements.
Commitments in relation to minimum statutory expenditures with respect to mining tenements:
2015 2014
$ $
Within one year 2,379,324 3,531,070
Later than one year but not later than five years
3,143,365
11,506,159
5,522,689 15,037,229
Included in these commitments are Joint Venture commitments of $200,000.
27. Contingencies
The company is under review by a government agency in relation to one project subject to a research and development grant. The company will vigorously defend the basis of the work and the claim as appropriate (a consistent view and as supported by advisors) but the result of the review is unknown at this time. The director’s view is that the review has not been concluded and will be subject to a request for audit review process if the findings of the review are not favourable. This will extend the time to finalise this outcome considerably.
28. Subsequent events
No significant events have occurred since balance date that would impact materially upon the Group and that would warrant separate disclosure in this report.
For
per
sona
l use
onl
y
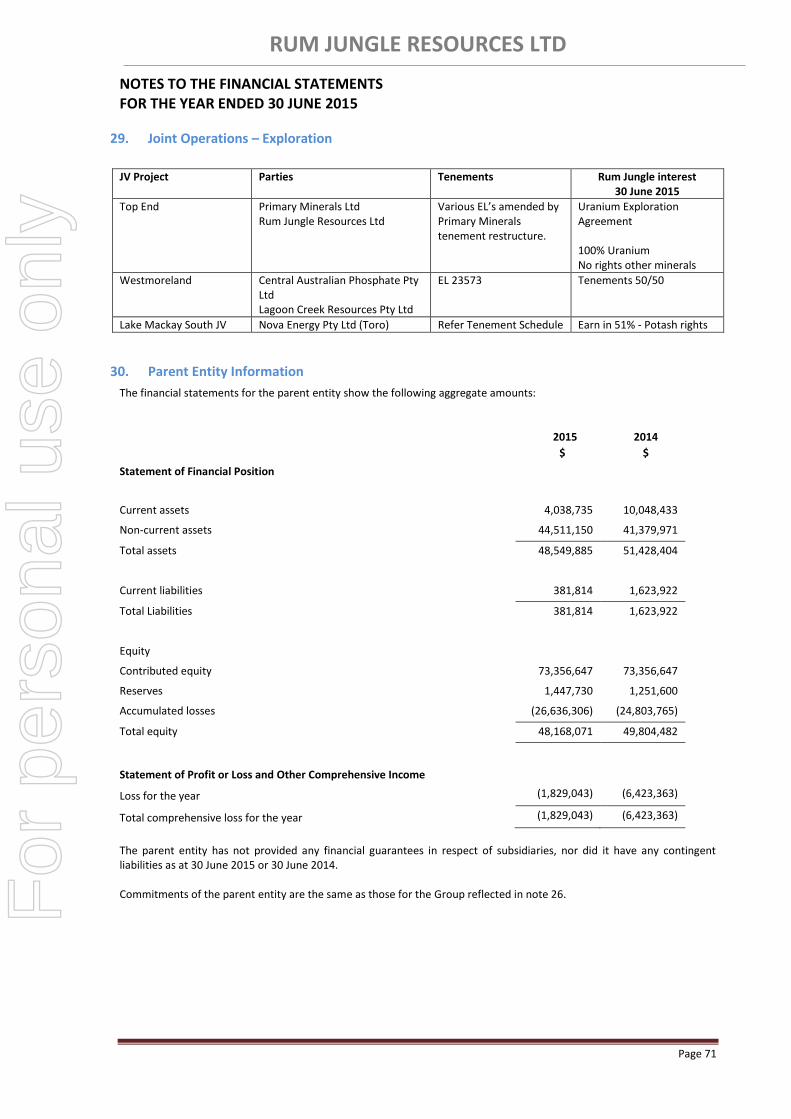
RUM JUNGLE RESOURCES LTD
NOTES TO THE FINANCIAL STATEMENTS FOR THE YEAR ENDED 30 JUNE 2015
Page 71
29. Joint Operations – Exploration
JV Project Parties Tenements Rum Jungle interest
30 June 2015
Top End Primary Minerals Ltd Rum Jungle Resources Ltd
Various EL’s amended by Primary Minerals tenement restructure.
Uranium Exploration Agreement 100% Uranium No rights other minerals
Westmoreland Central Australian Phosphate Pty Ltd Lagoon Creek Resources Pty Ltd
EL 23573 Tenements 50/50
Lake Mackay South JV Nova Energy Pty Ltd (Toro) Refer Tenement Schedule Earn in 51% - Potash rights
30. Parent Entity Information
The financial statements for the parent entity show the following aggregate amounts:
2015
$
2014
$
Statement of Financial Position
Current assets 4,038,735 10,048,433
Non-current assets 44,511,150 41,379,971
Total assets 48,549,885 51,428,404
Current liabilities 381,814 1,623,922
Total Liabilities 381,814 1,623,922
Equity
Contributed equity 73,356,647 73,356,647
Reserves 1,447,730 1,251,600
Accumulated losses (26,636,306) (24,803,765)
Total equity 48,168,071 49,804,482
Statement of Profit or Loss and Other Comprehensive Income
Loss for the year (1,829,043) (6,423,363)
Total comprehensive loss for the year (1,829,043) (6,423,363)
The parent entity has not provided any financial guarantees in respect of subsidiaries, nor did it have any contingent liabilities as at 30 June 2015 or 30 June 2014. Commitments of the parent entity are the same as those for the Group reflected in note 26. F
or p
erso
nal u
se o
nly

RUM JUNGLE RESOURCES LTD
Page 72
DIRECTORS’ DECLARATION
1. In the Directors’ opinion
(a) the consolidated financial statements and notes set out on pages 44 to 71 are in accordance with the
Corporations Act 2001, including:
i. complying with Australian Accounting Standards and the Corporations Regulations 2001; and
ii. giving a true and fair view of the Group’s financial position as at 30 June 2015 and of its performance,
as represented by the results of their operations and their cash flows, for the financial year ended on
that date; and
(b) there are reasonable grounds to believe that the Company will be able to pay its debts as and when they
become due and payable.
(c) the audited remuneration disclosures set out in the remuneration report comply with Accounting Standard
AASB 124 Related Party Disclosures.
2. The Directors have been given the declarations by the Chief Executive Officer and the Chief Financial Officer required by section 295A of the Corporations Act 2001.
3. The directors draw attention to Note 1(a) to the consolidated financial statements which include a statement of compliance International Financial Reporting Standards.
This declaration made in accordance with a resolution of the Directors.
David W Muller s Chris N Tziolis
Chairman Managing Director
Darwin, Northern Territory 28 September 2015
For
per
sona
l use
onl
y
RUM JUNGLE RESOURCES LTD
Page 73
INDEPENDENT AUDITOR’S REPORT
For
per
sona
l use
onl
y

RUM JUNGLE RESOURCES LTD
Page 74
For
per
sona
l use
onl
y
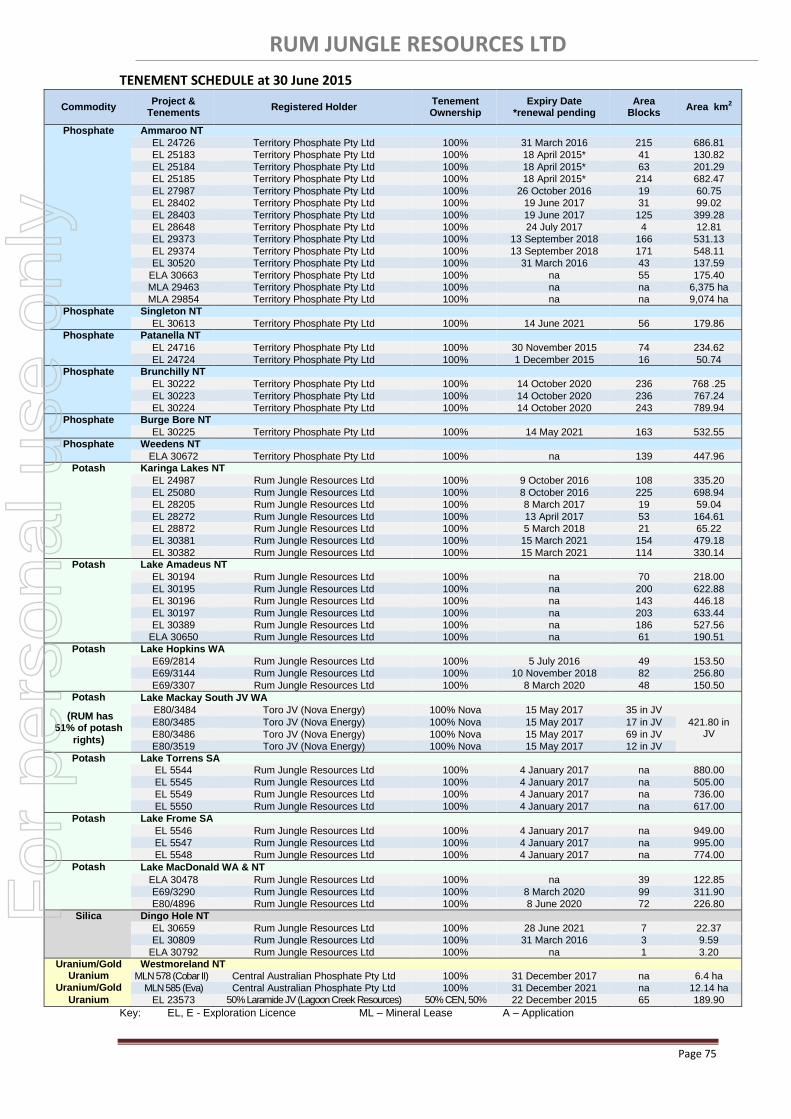
RUM JUNGLE RESOURCES LTD
Page 75
TENEMENT SCHEDULE at 30 June 2015
Commodity Project &
Tenements Registered Holder
Tenement Ownership
Expiry Date *renewal pending
Area Blocks
Area km2
Phosphate Ammaroo NT
EL 24726 Territory Phosphate Pty Ltd 100% 31 March 2016 215 686.81
EL 25183 Territory Phosphate Pty Ltd 100% 18 April 2015* 41 130.82
EL 25184 Territory Phosphate Pty Ltd 100% 18 April 2015* 63 201.29
EL 25185 Territory Phosphate Pty Ltd 100% 18 April 2015* 214 682.47
EL 27987 Territory Phosphate Pty Ltd 100% 26 October 2016 19 60.75
EL 28402 Territory Phosphate Pty Ltd 100% 19 June 2017 31 99.02
EL 28403 Territory Phosphate Pty Ltd 100% 19 June 2017 125 399.28
EL 28648 Territory Phosphate Pty Ltd 100% 24 July 2017 4 12.81
EL 29373 Territory Phosphate Pty Ltd 100% 13 September 2018 166 531.13
EL 29374 Territory Phosphate Pty Ltd 100% 13 September 2018 171 548.11
EL 30520 Territory Phosphate Pty Ltd 100% 31 March 2016 43 137.59
ELA 30663 Territory Phosphate Pty Ltd 100% na 55 175.40
MLA 29463 Territory Phosphate Pty Ltd 100% na na 6,375 ha
MLA 29854 Territory Phosphate Pty Ltd 100% na na 9,074 ha
Phosphate Singleton NT
EL 30613 Territory Phosphate Pty Ltd 100% 14 June 2021 56 179.86
Phosphate Patanella NT
EL 24716 Territory Phosphate Pty Ltd 100% 30 November 2015 74 234.62
EL 24724 Territory Phosphate Pty Ltd 100% 1 December 2015 16 50.74
Phosphate Brunchilly NT
EL 30222 Territory Phosphate Pty Ltd 100% 14 October 2020 236 768 .25
EL 30223 Territory Phosphate Pty Ltd 100% 14 October 2020 236 767.24
EL 30224 Territory Phosphate Pty Ltd 100% 14 October 2020 243 789.94
Phosphate Burge Bore NT
EL 30225 Territory Phosphate Pty Ltd 100% 14 May 2021 163 532.55
Phosphate Weedens NT
ELA 30672 Territory Phosphate Pty Ltd 100% na 139 447.96
Potash Karinga Lakes NT
EL 24987 Rum Jungle Resources Ltd 100% 9 October 2016 108 335.20
EL 25080 Rum Jungle Resources Ltd 100% 8 October 2016 225 698.94
EL 28205 Rum Jungle Resources Ltd 100% 8 March 2017 19 59.04
EL 28272 Rum Jungle Resources Ltd 100% 13 April 2017 53 164.61
EL 28872 Rum Jungle Resources Ltd 100% 5 March 2018 21 65.22
EL 30381 Rum Jungle Resources Ltd 100% 15 March 2021 154 479.18
EL 30382 Rum Jungle Resources Ltd 100% 15 March 2021 114 330.14
Potash Lake Amadeus NT
EL 30194 Rum Jungle Resources Ltd 100% na 70 218.00
EL 30195 Rum Jungle Resources Ltd 100% na 200 622.88
EL 30196 Rum Jungle Resources Ltd 100% na 143 446.18
EL 30197 Rum Jungle Resources Ltd 100% na 203 633.44
EL 30389 Rum Jungle Resources Ltd 100% na 186 527.56
ELA 30650 Rum Jungle Resources Ltd 100% na 61 190.51
Potash Lake Hopkins WA
E69/2814 Rum Jungle Resources Ltd 100% 5 July 2016 49 153.50
E69/3144 Rum Jungle Resources Ltd 100% 10 November 2018 82 256.80
E69/3307 Rum Jungle Resources Ltd 100% 8 March 2020 48 150.50
Potash Lake Mackay South JV WA
(RUM has 51% of potash
rights)
E80/3484 Toro JV (Nova Energy) 100% Nova 15 May 2017 35 in JV
421.80 in JV
E80/3485 Toro JV (Nova Energy) 100% Nova 15 May 2017 17 in JV
E80/3486 Toro JV (Nova Energy) 100% Nova 15 May 2017 69 in JV
E80/3519 Toro JV (Nova Energy) 100% Nova 15 May 2017 12 in JV
Potash Lake Torrens SA
EL 5544 Rum Jungle Resources Ltd 100% 4 January 2017 na 880.00
EL 5545 Rum Jungle Resources Ltd 100% 4 January 2017 na 505.00
EL 5549 Rum Jungle Resources Ltd 100% 4 January 2017 na 736.00
EL 5550 Rum Jungle Resources Ltd 100% 4 January 2017 na 617.00
Potash Lake Frome SA
EL 5546 Rum Jungle Resources Ltd 100% 4 January 2017 na 949.00
EL 5547 Rum Jungle Resources Ltd 100% 4 January 2017 na 995.00
EL 5548 Rum Jungle Resources Ltd 100% 4 January 2017 na 774.00
Potash Lake MacDonald WA & NT ELA 30478 Rum Jungle Resources Ltd 100% na 39 122.85
E69/3290 Rum Jungle Resources Ltd 100% 8 March 2020 99 311.90
E80/4896 Rum Jungle Resources Ltd 100% 8 June 2020 72 226.80
Silica Dingo Hole NT
EL 30659 Rum Jungle Resources Ltd 100% 28 June 2021 7 22.37
EL 30809 Rum Jungle Resources Ltd 100% 31 March 2016 3 9.59
ELA 30792 Rum Jungle Resources Ltd 100% na 1 3.20
Uranium/Gold Westmoreland NT Uranium MLN 578 (Cobar II) Central Australian Phosphate Pty Ltd 100% 31 December 2017 na 6.4 ha
Uranium/Gold MLN 585 (Eva) Central Australian Phosphate Pty Ltd 100% 31 December 2021 na 12.14 ha
Uranium EL 23573 50% Laramide JV (Lagoon Creek Resources) 50% Central Australian Phosphate
50% CEN, 50% Lagoon Creek
22 December 2015 65 189.90
Key: EL, E - Exploration Licence ML – Mineral Lease A – Application
For
per
sona
l use
onl
y

RUM JUNGLE RESOURCES LTD
Page 76
ADDITIONAL SHAREHOLDER INFORMATION Additional information required by the ASX Limited (“ASX”) Listing Rules as at 24 September 2015 and not disclosed elsewhere in the report is set out below.
Substantial shareholders
The following shareholders have lodged substantial shareholder notices with ASX:
Substantial Shareholder Number of RUM Shares held Percentage of issued share capital
Washington H Soul Pattinson and Co Ltd 54,826,688 14.22%
Farjoy Pty Ltd 25,808,526 7.11%
Distribution of Shareholders
The distribution of security holders is as follows:
Range of holding Shareholders Number of Ordinary Shares 100,001 and over 455 336,274,387 10,001 – 100,000 1,143 43,720,738 5,001 – 10,000 440 3,695,369 1,001 – 5,000 575 1,600,528 1 – 1,000 622 213,575
Totals 3,473 385,504,597
The number of shareholders holding less than a marketable parcel of ordinary shares is 1,460. Voting Rights (Ordinary Shares)
The voting rights attaching to Ordinary Shares are governed by the Constitution. On a show of hands every person present who is a member or representative of a member shall have one vote and on a poll, every member present in person or by proxy or by attorney or duly authorised representative shall have one vote each share held. Options have no voting rights.
On-Market Buyback
There is no current on-market buyback.
Listed Options
There are no listed options
Securities exchange
The Company is listed on the Australian Securities Exchange. The Home exchange is Melbourne.
Other information
Rum Jungle Resources Ltd incorporated and domiciled in Australia, is a publicly listed company limited by shares.
For
per
sona
l use
onl
y
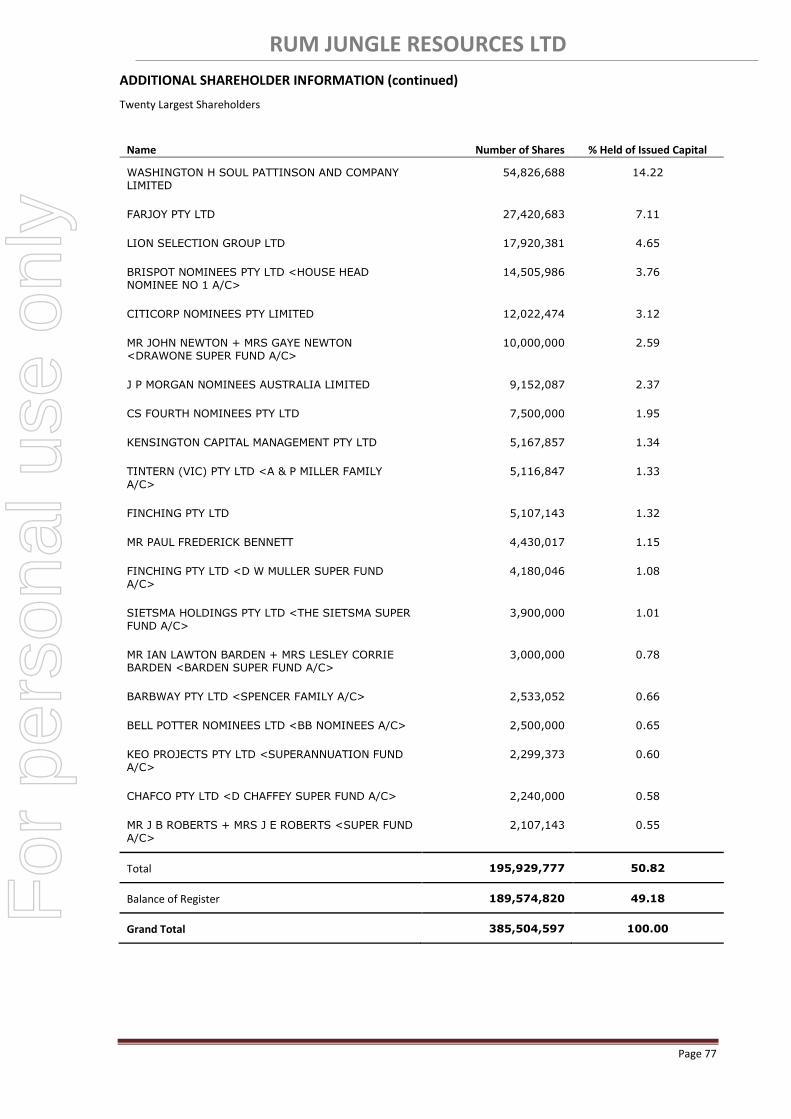
RUM JUNGLE RESOURCES LTD
Page 77
ADDITIONAL SHAREHOLDER INFORMATION (continued)
Twenty Largest Shareholders
Name Number of Shares % Held of Issued Capital
WASHINGTON H SOUL PATTINSON AND COMPANY LIMITED
54,826,688 14.22
FARJOY PTY LTD 27,420,683 7.11
LION SELECTION GROUP LTD 17,920,381 4.65
BRISPOT NOMINEES PTY LTD <HOUSE HEAD NOMINEE NO 1 A/C>
14,505,986 3.76
CITICORP NOMINEES PTY LIMITED 12,022,474 3.12
MR JOHN NEWTON + MRS GAYE NEWTON <DRAWONE SUPER FUND A/C>
10,000,000 2.59
J P MORGAN NOMINEES AUSTRALIA LIMITED 9,152,087 2.37
CS FOURTH NOMINEES PTY LTD 7,500,000 1.95
KENSINGTON CAPITAL MANAGEMENT PTY LTD 5,167,857 1.34
TINTERN (VIC) PTY LTD <A & P MILLER FAMILY
A/C>
5,116,847 1.33
FINCHING PTY LTD 5,107,143 1.32
MR PAUL FREDERICK BENNETT 4,430,017 1.15
FINCHING PTY LTD <D W MULLER SUPER FUND A/C>
4,180,046 1.08
SIETSMA HOLDINGS PTY LTD <THE SIETSMA SUPER FUND A/C>
3,900,000 1.01
MR IAN LAWTON BARDEN + MRS LESLEY CORRIE BARDEN <BARDEN SUPER FUND A/C>
3,000,000 0.78
BARBWAY PTY LTD <SPENCER FAMILY A/C> 2,533,052 0.66
BELL POTTER NOMINEES LTD <BB NOMINEES A/C> 2,500,000 0.65
KEO PROJECTS PTY LTD <SUPERANNUATION FUND A/C>
2,299,373 0.60
CHAFCO PTY LTD <D CHAFFEY SUPER FUND A/C> 2,240,000 0.58
MR J B ROBERTS + MRS J E ROBERTS <SUPER FUND A/C>
2,107,143 0.55
Total 195,929,777 50.82
Balance of Register 189,574,820 49.18
Grand Total 385,504,597 100.00
For
per
sona
l use
onl
y