rum jungle rehabilitation project oiffor fo...of the water resources division of the power and water...
TRANSCRIPT

I
Technical Report Number 51
RUM JUNGLE REHABILITATION PROJECT
OIffOR FOI
Edited by M. Kraatz and R.J. Applegate

Technical Report - Number 51
THE RUM JUNGLE REHABILITATION PROJECTMONITORING REPORT
(1986-88)
Edited by M. Kraatz and RJ. Applegate
Land Conservation UnitConservation Commission of the
Northern Territory
nan\e %'&i
January 1992 to \e {arnov ck

First published 1992
© Conservation Commission of the Northern Territory
ISBN 0 7245 1929 7
ISSN 0 729 9990
Cover Photograph: Looking south-southwest from the old treatment plant area towardsWhite's North and White's Overburden Heaps.
Printed and bound by the Northern Territory Government Printing Office

CONTENTS
PAGE No.
ACKNOWLEDGMENTS viABSTRACT viiLIST OF FIGURES viii, xivLIST OF PLATES xiLIST OF TABLES xii, xv, xvi
SUMMARY
1.1 Introduction 1
1.2 Summary of Monitoring Activities 2
1.2.1 Surface Water Hydrology 21.2.2 Groundwater Hydrology 31.2.3 Water Quality of the Open Cuts 3
1.2.4 Chemical Activity and Water Balanceof The Overburden Heaps 4
1.2.5 Revegetation, Erosion Control andCover Stability 4
1.2.6 Site Management 5
INTRODUCTION(M. Kraatz)
2.1 Location and Climate 72.2 History of the Site 72.3 The Legacy 92.4 The Rehabilitation Project 10
MONiTORING - GENERAL(From Allen and Verhoeven, 1986)
3.1 Introduction 13
3.2 Monitoring Program 13
3.2.1 The Copper Heap Leach Pile 13
3,2.2 The Old Tailings Dam 13
3.2.3 Dyson's Open Cut 143.2.4 White's Open Cut 143.2.5 Intermediate Open Cut 14
3.2.6 Dyson's Overburden Heap 143.2.7 White's Overburden Heap 16
3.2.8 Intermediate Overburden Heap 16
3.2.9 Area of Former White's North OverburdenHeap 17
3.2.10 Acid and Sweetwater Dams 173.2.11 Other Areas 173.2.12 Water Treatment Plant 17
3.2.13 Regional Monitoring 17
Rum Jungle Monitoring Report Page i

4. SURFACE WATER HYDROLOGYEast Finn iss River and Finniss River Pollution Study1986 - 87 (C.HR.F. Henkel and fE. Alcock)East Fin.niss River and Finniss River Pollution Study1987 - 88 (C.ILR.F. Henkel)
4.1 Introduction 19
4.1.1 Background 194.1.2 The 1986-87 and 1987-88 Surface Water
Quality Programme 19
4.1.3 Study Area 20
4.2 The East Finniss River Monitoring Programat GS8 150097 20
4.2.1 Introduction 204.2.2 Sample collection at GS8150097 204.2.3 Rum Jungle Mine Site Rainfall 204.2.4 Flow Characteristics at GSS 150097 234.2.5 Water Quality at OSS 150097 23
1986-87 231987-88 25
4.2.6 Pollutant Loads at GS8 150097 264.2.7 Radium - 226 Daily Concentrations and
Loads at GS8150097 28
4.3 Finniss River Water Quality. 30
4.3.1 1986-87 304.3.2 1987-88. 31
4.4 Mine Site Pollution Sources. 32
4.4.1 1986-87 32Dyson's Drainage System 33Wandering Creek 37White's Overburden Heap Subsoil Drains 39Run-off from White's and IntermediateOverburden Fleaps 42Open Cuts, Diversion Channel andWandering Creek. 43
4.4.2 1987-88 46Mine Site Pollutant Loads. 47Validity Check for Mine Site Calculations 48Individual Mine Site Pollution Sources 49Mine Site Water Quality. 52White's Overburden Heap Subsoil Drains.. 53Dyson's Opencut Drain GS8150215 60
Page ii Rum Jungle Monitoring Report

4.5 Conclusions and Recommendations 61
4.5.1 Conclusions 61Total Hows 61Pollutant Loads 61Radium-226 62Maximum Daily Pollution Concentrations 62Dyson's Open Cut 62White's Overburden Heap 63Pollutant Sources 63Finniss River Water Quality 64
4.5.2 Recommendations 64
GROUNDWATER HYDROLOGY(D.K. Gibson and G. Panteltc)
5.1 Introduction 675.2 Examination of Field Data. 70
5.2.1 Plan view of contaminant concentrations 705.2.2 Seasonal variation in water height 705.2.3 Seasonal variation of groundwater quality. 75
5.3 Mathematical Modelling 82
5.3.1 Mathematical basis. 825.3.2 Computer model 835.3.3 Results of simulation and discussion. 83
5.4 Picture of Groundwater Movement. 935.5 Conclusions. 93
WATER QUALITY OF OPEN CUTSWhite's Ope;i Cut and Intermediate Ope,i Cut Wale;' Quality, 1986-87(C.H. 1-Jenkel and fE. Alcock)White's Opel? Cut and Intermediate Open Cut Water Quality, 1987-88(C.H. Henkel)
6.1 Water Quality 1986-87 95
6.1.1 Introduction . 956.1.2 White's Open Cut 976.1.3 Intermediate Open Cut. 976.1.4 Discussion And Conclusions 98
6.2 Water Quality 1987-88. 99
6.2.1 Introduction 996.2.2 White's Open Cut 996.2,3 Intermediate Open Cut. 101
6.2.4 Conclusions l
Rum Jungle Monitoring Report Page iii

CHEMICAL ACTIVITY AND WATER BALANCE OF THEOVERBURDEN HEAPS(J.W. Bennett, JR. Harries and AJ.M. Ritchie)
7.1 Introduction 1037.2 Rehabilitation Work Carried Out On The Dumps. 1047.3 Water Balance 1047.4 Probe Holes. 1097.5 Temperature Profiles 1097,6 Pore Gas Composition 115
7.6.1 Before Rehabilitation 1157.6.2 After Rehabilitation 119
7.7 Conclusions 119
RE VEGETATION, EROSION CONTROL AND COVERSTABILITY(P. Ryan)
8.1 Introduction 1218.2 Results and Recommendations 121
8.2.1 Surface Drainage Structures 1218.2.2 Pasture Status 1268.2.3 Weeds 1318.2.4 Rock Mulch Stability 1318.2.5 Soil Fauna 1338.2.6 Opencut Surrounds 1338.2.7 Tree Colonisation 1338.2.8 Pasture Maintenance 134
8.3 Summary of Conclusions and Recommendations 1 37
8.3,1 Land Use/Maintenance 1378.3.2 Provision of Monitoring Results 137
SITE MAINTENANCE(M. Kraatz)
9.1 Introduction 1399.2 Maintenance Programme 139
9.2.1 Covers 1399.2.2 Vegetation 1399.2.3 Rediversion Works 1399.2.4 Drainage 1409.2.5 Other 140
9.3 Maintenance Conducted 141
Page iv Ruin Jungle Monitoring Report

FINANCE 143(M. Kraatz)
SITE MANAGEMENT PLAN(TJ. Verhoeven)
11.1 Introduction 147
11.2 Legislation and Administration 148
11.2.1 Ownership of the Site 14811.2.2 Legislation and Administration Under the Agreement 14811.2.3 Legislation and Administration Beyond the Agreement. 14811.2.4 Finniss River Land Claim 149
11.3 Land Uses and Restrictions. 153
11.3.1 Constraints. 15311.3.2 Tourisn'Research 15311.3.3 Grazing, 15511.3.4 Mining. 15511.3.5 Other Land Uses 156
11.4 Monitoring 15611.5 Maintenance 15911.6 Conclusions and Recommendations 160
REFERENCES 163
APPENI)ICES A Surface Water Quality . Figures. 167B Surface Water Quality . Tables 205C Water Quality of the Open Cuts - Figures 247D Water Quality of the Open Cuts Tables. 277E Extract from Soil Conservation and Land Utilization Act 295
Rum Jungle Monitoring Report Page v

ACKNOWLEDGEMENTS
The Rum Jungle Rehabilitation Project and the compilation of this report has been madepossible by funding from the Federal and Northern Territory governments.
The editors and authors of this report wish to gratefully acknowledge the followingpeople:
The staff of the East Point Laboratory and the Surface Water Monitoring Sectionof the Water Resources Division of the Power and Water Authority who gatheredthe results presented in Chapters 4 and 6.
M. C. Blackford, M. La Robina, A. Boyd and J. Stuart in the collection andanalysis of data for Chapter 7.
Belinda Colding for typing and editing sections of the manuscript with greatpatience and perseverance.
Page vi Runt Jungle Monitoring Report

ABSTRACT
In the late 1960's and 1970's it was recognised that pollutants emanating from theabandoned Rum Jungle uranium mine in the Northern Territory of Australia wereresponsible for severe environmental degradation of the Finniss River system. Productsof Acid Mine Drainage and low level radioactive material released from the TailingsDarn resulted in the virtual absence of flora and fauna species for ten kilometresdownstream of the mine.
In 1982 a joint Federal and Northern Territory government project was established torehabilitate the abandoned Rum Jungle site, This project successfully achieved a majorreduction in surface water pollution, public health hazard, (including radiation levels),pollution levels in the Open Cut water bodies and aesthetic improvement, includingrevegetation.
Monitoring of the site is continuing up to the present date to determine the ongoingsuccess of the project. This includes evaluation of the surface water quality, chemicalactivity and water balance within the overburden heaps, groundwater hydrology and anassessment of i'evegetation success, erosion control structures and cover stability.
This document presents the results of monitoring activities conducted between 1986 and1988 and outlines management and maintenance programs during that time.
Rum Jungle Monitoring Report Page vii
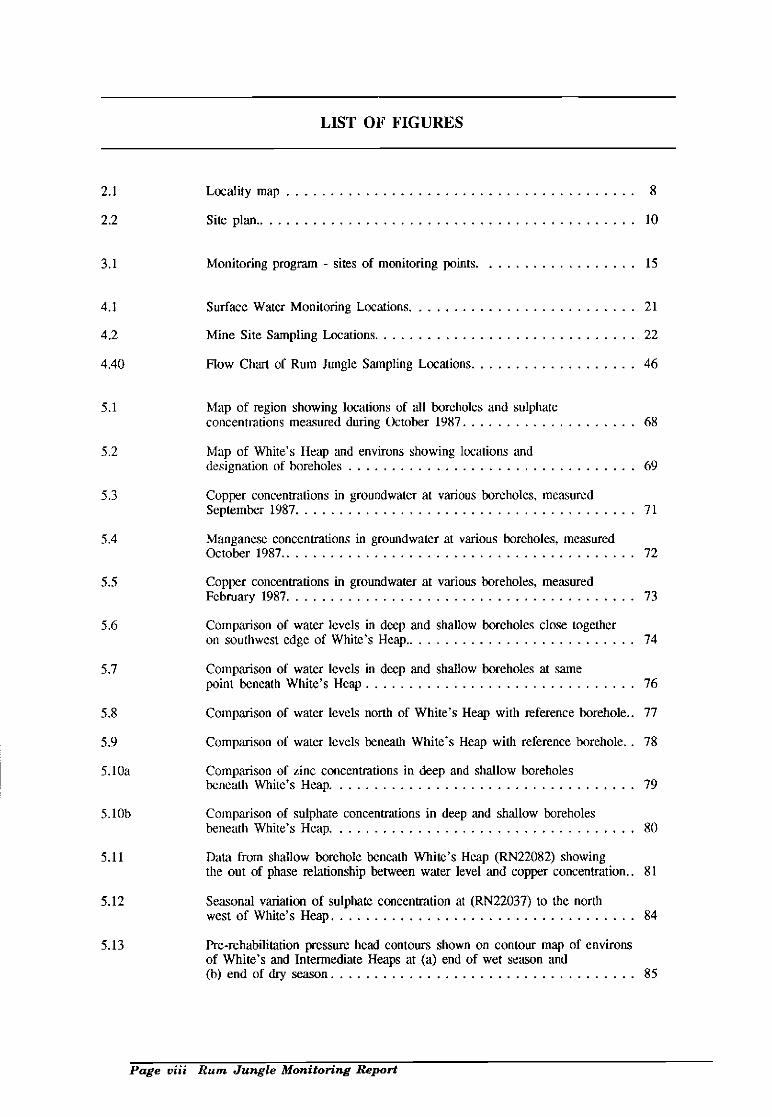
2.1 Locality map 8
2.2 Site plan. 10
3.1 Monitoring program - sites of monitoring points. 15
4.1 Surface Water Monitoring Locations. 21
4.2 Mine Site Sampling Locations 22
4.40 Flow Chart of Rum Jungle Sampling Locations 46
5.1 Map of region showing locations of all borcholes and sulphateconcentrations measured during October 1987 68
5.2 Map of White's Heap and environs showing locations anddesignation of boreholes 69
5.3 Copper concentrations in groundwater at various boreholes. measuredSeptember 1987 71
5.4 Manganese concentrations in groundwater at various boreholes, measuredOctober 1987. 72
5.5 Copper concentrations in groundwater at various boreholes, measuredFebruary 1987 73
5.6 Comparison of water levels in deep and shallow boreholes close togetheron southwest edge of White's Heap. 74
5.7 Comparison of water levels in deep and shallow boreholes at samepoint beneath White's Heap 76
5.8 Comparison of water levels north of White's Heap with reference borehole 77
5.9 Comparison of water levels beneath While's Heap with reference borehole. 78
5.lOa Comparison of zinc concentrations in deep and shallow boreholesbeneath White's Heap. 79
5.lOb Comparison of sulphate concentrations in deep and shallow boreholesbeneath White's Heap 80
5.11 Data from shallow borehole beneath White's Heap (RN22082) showingthe out of phase relationship between water level and copper concentration.. 81
5.12 Seasonal variation of sulphate concentration at (RN22037) to the northwest of White's Heap 84
5.13 Pre-rehabilitation pressure head contours shown on contour map of environsof White's and Intermediate Heaps at (a) end of wet season and(b) end of dry season 85
LIST OF FIGURES
Page viii Rum Jungle Monitoring Repofl

5.14 Post-rehabilitation pressure contours shown on contour map of environsof White's and Intermediate Heaps at (a) end of wet season and(b) end of dry season. 86
5.15 Pre-rehabiitation total horizontal discharge vectors shown on contour mapof environs of White's and Intermediate Heaps at (a) end of wet seasonand (b) end of dry season 87
5.16 Post-rehabilitation total horizontal discharge vectors on contour map ofenvirons of White's and Intermediate Heaps at (a) end of wet season and(b) end of dry season 88
5.17 Selected flow paths starting from various points on White's and IntermediateHeaps showing progressive height and speed and direction of flow(a) pre-rehabilitation and (b) post-rehabilitation 89
5.18 Flow paths in a two-dimensional vertical section of an overburden heap andunderlying shallow aquifer showing distance tnvelled at yearly intervals(a) pre-ithabilitation and (b) post-rehabilitation 91
5.19 Specific discharge vectors in a two-dimensional vertical section of anoverburden heap and underlying shallow aquifer(a) pre-rehabilitationand (b) post-rehabilitation 92
6.1 The rediversion of the East branch of the Pinniss River 96
7.1 Lysimeter construction and placement. 105
7.2 Lysimeter positions. 106
7.3 Accumulated water in five of White's lysimeters, June 1986-June 1987. . . . 108
7.4 Locations and Identifications of Probe Holes in White's dump 110
7.5 Locations and Identifications of Probe Holes in Intermediate Dump 111
7.6 Temperature Distributions in White's Dump Before and After Rehabilitation 112
7.7 Temperature distributions in Intermediate Dump before and afterrehabilitation 113
7.8 Temperature at Different Depths in Hole A in White's Dump 114
7.9 Heat production at hole locations (A to F) in White's dump (a) before and(1,) after rehabilitation 116
7.10 Oxygen distribution in White's Dump before and after rehabilitation 117
7.11 Oxygen distribution in Intermediate dump before and after rehabilitation . . 118
11.1 Finniss River Land Claim 'Area 4' 151
11.2 Site plan after completion of rehabilitation. 154
Rum Jungle Monitoring Report Page ix

Page x Rum Jungle Monitoring Report
LIST OF PLATES
8.1 White's Heap Drain B 123
8.2 Damaged rip rap, White's Heap Drain B 123
8.3 Subsidence and backfall in drain on Dyson's Open Cut 124
8.4 Precipitated salts and leachate, Dyson's Open Cut 124
8.5 White's Heap, view to the north-west. May 1988 127
8.6 Intermediate Heap, view to the west. May 1988 127
8.7 Tailings Dam viewed from old plant site. May 1988 129
8.8 Main drain on Tailings Dam. May 1988 130
8.9 Mature specimens of Mimosa pigra on Tailings Dam May 1988 130
8.10 Borrow pit near Mt Fitch gate, May 1988 132
8.11 Original sward of pasture. Tailings Dam area May 1988 132

LIST OF TABLES
4.1 Annual Rainfall Rum Jungle Mine Site 20
4.6 East Finniss River Total Monthly and Annual Flow Volume (1&'m')at GS8150097 23
4.7 Maximum Concentrations of Pollutants at GSS 150097 24
4.8 Mean Daily Dissolved Concentrations of GS8150097 26
4.11 East Finniss River Annual Pollutant Loads at G58150097 27
4.12 Percentage Reduction in Pollutant Loads at 058150097 27
4.13 Eist Finniss River GS8150097 Radium-226 Pollution in 1985-86,1986-87 and 1987.88 29
4.14 Racjiuin-226 Concentrations in the Vicinity of Tailings Creek(16 January 1987) 29
4.15 Radium-226 in Dyson's Open Cut Seepage 30
4.18 Maximum Concentrations of Pollutants at 058150204 31
4.19 Comparison of Dissolved Pollutants Carried at 0S815(X)97 and058150204 32
4.23 Water Quality from Dyson's Open Cut Seepage Site 6 33
4.24 Water Quality from Dyson's Overburden Heap Seepage Site 3 34
4.25 Water Quality from Dyson's Springs 34
4.26 Water Quality at 058150208 36
4.27 Water Quality at Wandering Creek Site A 38
4.28 Water Quality at Wandering Creek Drainage System Site D 38
4.29 Water Quality at White's Overburden Heap Drain 9 and Wandering CreekSite A 38
4.30 Water Quality at Wandering Creek 058150210 39
4.31 Water Quality in White's Overburden Heap Sub-Soil Drains 40
4.32 White's Overburden Heap Subsoil Drains Pollutant Loads in 1986-87 42
4.33 Average Water Quality at 058150205 43
4.34 Average Water Quality of Run-off from the Intermediate Overburden Heap 43
4.35 Gauging Station Locations 47
4.36 1987-88 Mine Site Pollutant Loads 47
4.37 Comparison of Synthesized and Calculated Dissolved Pollutant Loads 48
Rum Jungle Monitoring Report Page xi

4.38 Reconciliation of Dissolved Pollutant Loads at (358150200 with DissolvedPollutant Loads Found Upstream 49
4.39 Reconciliation of Combined Dissolved Mine Site Pollutant Loadswith Dissolved Pollutant Loads Found at G58 150097 . 49
4.40 Pollutant Input Between 058150209 and 058150211 50
4.41 Combined Total Dissolved Pollutant Loads Found at 0S8 150209 and(358150213 50
4.42 White's Overburden Heap Pollutant Input Above 058150209 51
4.43 Calculated Dissolved Loads from Dyson's Open Cut Rehabilitation Area. . 51
4.44 Dissolved Pollutant Input from White's and Intennediate Overburden Heaps 52
4.45 Dissolved Pollutant Input from White's and Intermediate Open Cuts 53
4.49 Comparison of White's Overburden Subsoil Drains Water Quality,1986-87 to 1987-88 54
4.50 White's Overburden Heap Subsoil Drains - Pollutant Concentrations 54
4.51 White's Overburden Subsoil Drains - Pollutant Loads 57
4.52 Dyson's Overburden Drain 0S8150215 - Water Quality 60
4.53 Dyson's Overburden Drain 058150215 - 1986-87 and 1987-88Pollutant Concentrations 61
4.54 Mine Site Contribution of Dissolved Pollutants to 058 150097 63
7.1 Characteristics of waste rock dumps before rehabilitation 103
7.2 Infiltration derived from the quantity of water collected in lysimetersas a percentage of rainfall 107
8.1 Tailings dam area soil cover - selected analyses 136
10.1 Summary of project expenditure 1982-86 144
10.2 Revenue and expenditure for 1986/87 145
10.3 Revenue and expenditure for 1987/88 146
11.1 Cost sharing for Rum Jungle monitoring and maintenance programme1988/89 to 1992,93 161
Page xii Rum Jungle Monitoring Report

APPENDIX A(Surface Water Hydrology - Figures)
4.3 1986-87 Mine site rainfall at pluvio R815202A 168
4.4 1987-88 Mine site rainfall at pluvio R815202A 169
4.5 1986-87 East Finniss River flow volume at 0S8150097 170
4.6 1987-88 East Finniss River flow volume at GS8150097 171
4.7 1986-87 East Finniss River pH at GS8150097 172
4.8 1986-87 East Finniss River specific conductance at GS8 150097 173
4.9 1986-87 East Finniss River copper concentration at GS8150097 174
4.10 1986-87 East Finniss River manganese concentration at 0S8150097 175
4.11 1986-87 East Finniss River zinc concentration at GS8150097 176
4.12 1986-87 East Finniss River sulphate concentration at GS8150097 177
4.13 1987-88 East Finniss River pH at GS8150097 178
4.14 1987-88 East Finniss River specific conductance at GS8150097 179
4.15 1987-88 East Finniss River copper concentration at G88l50097 180
4.16 1987-88 East Finniss River manganese concentration at GS8150097 181
4.17 1987-88 East Finniss River zinc concentration at GS8150097 182
4.18 1987-88 East Finniss River sulphate concentration at GS8150097 183
4.19 1986-87 East Finniss River copper loads at (358150097 184
4.20 1986-87 East Finniss River manganese loads at 0S8150097 185
4.21 1986-87 East Finniss River zinc loads at GS8150097 186
4.22 1986-87 East Finniss River sulphate loads at (358150097 187
4.23 1987-88 East Finniss River copper loads at GS8150097 188
4.24 1987-88 East Finniss River manganese loads at GS8150097 189
4.25 1987.88 East Finniss River zinc loads at 0S8150097 190
4.26 1987-88 East Finniss River sulphate loads at 058150097 191
4.27 1986-87 East Finniss River radium-226 concentrations at 0S8150097 192
4.28 1987-88 East Finniss River radium-226 concentrations at 058150097 193
4.29 1986-87 East Finniss River radium-226 loads at GS8150097 194
4.30 1987-88 East Finniss River radium-226 loads at 058150097 195
4.31 Mine site flow measurements 196
Rum Jungle Monitoring Report Page xiii

4.32 1986-87 Mine site copper concentrations 197
4.33 1986-87 Mine site manganese concentrations 198
4.34 1986-87 Mine site zinc concentrations 299
4.35 1986-87 Mine site sulphate concentrations 200
4.36 1986-87 Mine site copper loads 201
4.37 1986-87 Mine site manganese loads 202
4.38 1986-87 Mine site zinc loads 203
4.39 1986-87 Mine site sulphate loads 204
APPENDIX B(Surface Water Hydrology - Tables)
4.2 1986-87 Day to date conversion table 206
4.3 1987-88 Day to date conversion table 207
4.4 1986-87 East Finniss River water quality at G58150097 208
4.5 1987-88 East Finniss River water quality at 0S8150097 211
4.9 1986-87 East Finniss River pollutant load at 088150097 214
4.10 1987-88 East Finniss River pollutant load at GS8150097 217
4.16 1986-87 Finniss River water quality at 088150204 general parameters 220
4.17 1986-87 Finniss River water quality at GS8150204 heavy metals 221
4.20 1987-88 Finniss River water quality at 088150204 general parameters 222
4.21 1987-88 Finniss River water quality at 0s8150204 heavy metals 224
4.22 1987-88 East Finniss River water quality at G88150204 dissolved pollutant loads 226
4.46 (a) GS8150200 Dissolved pollutant loads 228
GS8150209 Dissolved pollutant loads 229
088150210 Dissolved pollutant loads 230
088150211 Dissolved pollutant loads 231
GS8150212 Dissolved pollutant loads 232
(0 GS81502l3 Dissolved pollutant loads 233
(g) GS8150214 Dissolved pollutant loads 234
4.47 (a) 0S8150200 dissolved pollutant concentrations 235
(b) GS8150209 dissolved pollutant concentrations 236
Page xiv Rum Jungle Monitoring Report

GS8150210 dissolved pollutant concentrations 237
GS815021 1 dissolved pollutant concentrations 238
GS8150212 dissolved pollutant concentrations 239
(Q 0S8150213 dissolved pollutant concentrations 240
(3S8 150214 dissolved pollutant concentrations 241
4.48 (a) GS8150200 waler quality 242
(388150209 water quality 242
0S8150210 water quality 243
GS8150211 water quality 243
GS8150212 water quality 244
(1) GS8150213 water quality 244
(g) 0S8150214 water quality 245
6.2 1986-87
6.3 1986-87
6.4 1986-87
6.5 1986-87
6.6 1986-87
6.7 1986-87
6.8 1986-87
6.9 1986-87
6.10 1986-87
6.11 1986-87
6.12 1986-87
6.13 1986-87
6.14
6.15
6.16
6.17
White's Open Cut 1987-88, profiles 260
White's Open Cut 1987-88, cumulative copper & manganese 261
White's Open Cut 1987-88, comparison of heavy metals 20/4/88 & 13/5/88 . . 262
White's Open Cut 1987-88, copper concentration start of wet season 263
Rum Jungle Monitoring Report Page xu
White's Open Cut p14 profiles 248
White's Open Cut specific conductance profiles 249
White's Open Cut copper profiles 250
White's Open Cut manganese profiles 251
White's Open Cut zinc profiles 252
White's Open Cut sulphate pmfiles 253
Intermediate Open Cut p1-I profiles 254
Intermediate Open Cut specific conductance profiles 255
Intermediate Open Cut copper profiles 256
Intermediate Open Cut manganese profiles 257
Intermediate Open Cut zinc profiles 258
Intermediate Open Cut sulphate profiles 259
APPENDIX C(Water Quality of the Open Cuts Figures)

6.18 White's Open Cut 1987-88, manganese concentration start of wet season 264
6.19 White's Open Cut 1987-88. copper concentration middle of wet season 265
6.20 White's Open Cut 1987-88. manganese concentration middle of wet season . . 266
621 White's Open Cut 1987-88, copper concentration end of wet season 267
6.22 White's Open Cut 1987-88, manganese concentration end of wet season 268
6.23 White's Open Cut 1987-88, copper concentration dry season 269
6.24 White's Open Cut 1987-88, manganese concentration dry season 270
6.25 Intermediate Open cut 1987-88, profiles 271
6.26 Intermediate Open cut 1987-88, copper concentration 272
6.27 Intermediate Open cut 1987-88, manganese concentration 273
6.28 Intermediate Open cut 1987-88, sulphate concentration 274
6.29 Intermediate Open Cut 1987-88. p1-I 275
APPENDIX D(Water Quality of the Open Cuts - Tables)
6.1 White's Open Cut water quality August 1986 to November 1987 278
6.2 Intermediate Open Cut water quality August 1986 to November 1987 280
6.3 White's Open Cut profiling data 1987-88 282
6.4 Intermediate Open Cut profiling data 1987-88 289
Page xvi Rum Jungle Monitoring Report
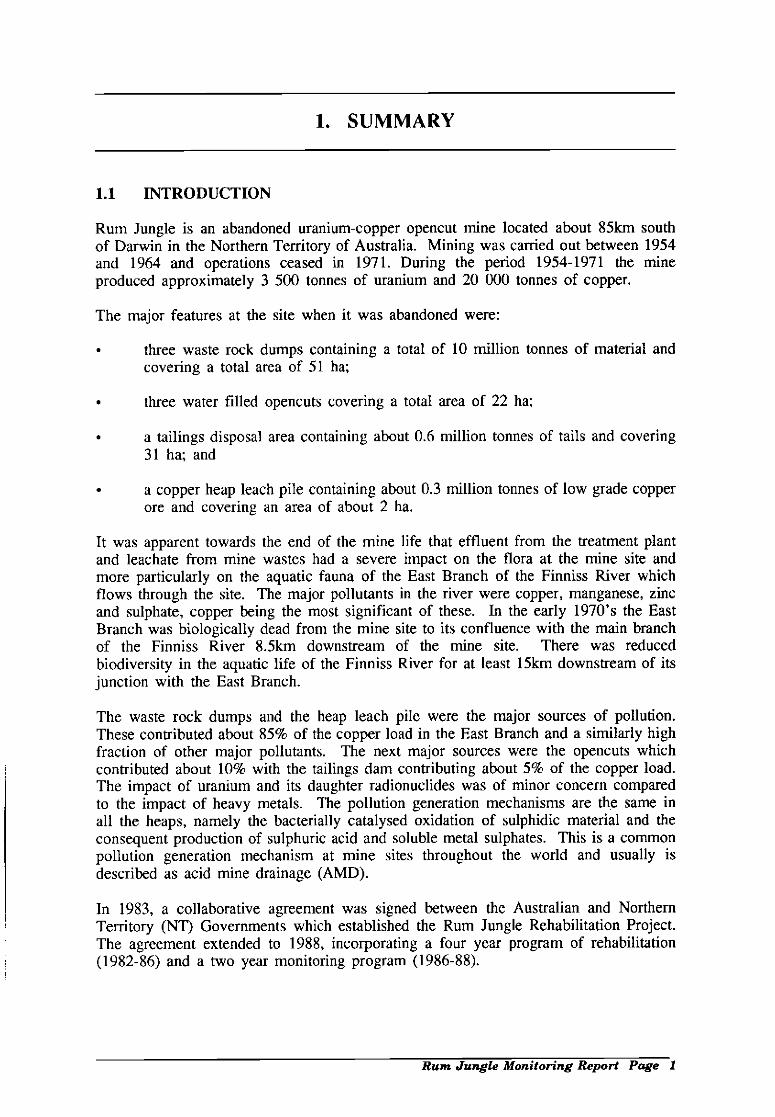
1.1 INTRODUCTION
Rum Jungle is an abandoned uranium-copper opencut mine located about 85km southof Darwin in the Northern Territory of Australia. Mining was carried out between 1954and 1964 and operations ceased in 1971. During the period 1954-1971 the mineproduced approximately 3 500 tonnes of uranium and 20 000 tonnes of copper.
The major features at the site when it was abandoned were:
three waste rock dumps containing a total of 10 million tonnes of material andcovering a total area of 51 ha;
three water filled opencuts covering a total area of 22 ha;
a tailings disposal area containing about 0.6 million tonnes of tails and covering31 ha; and
a copper heap leach pile containing about 0.3 million tonnes of low grade copperore and covering an area of about 2 ha.
It was apparent towards the end of the mine life that effluent from the treatment plantand leachate from mine wastes had a severe impact on the flora at the mine site andmore particularly on the aquatic fauna of the East Branch of the Finniss River whichflows through the site. The major pollutants in the river were copper, manganese, zincand sulphate, copper being the most significant of these. In the early 1970's the EastBranch was biologically dead from the mine site to its confluence with the main branchof the Finniss River 8.51cm downstream of the mine site. There was reducedbiodiversity in the aquatic life of the Finniss River for at least 15km downstream of itsjunction with the East Branch.
The waste rock dumps and the heap leach pile were the major sources of pollution.These contributed about 85% of the copper load in the East Branch and a similarly highfraction of other major pollutants. The next major sources were the opencuts whichcontributed about 10% with the tailings dam contributing about 5% of the copper load.The impact of uranium and its daughter radionuclides was of minor concern comparedto the impact of heavy metals. The pollution generation mechanisms are the same inall the heaps, namely the bacterially catalysed oxidation of sulphidic material and theconsequent production of sulphuric acid and soluble metal sulphates. This is a commonpollution generation mechanism at mine sites throughout the world and usually isdescribed as acid mine drainage (AMD).
In 1983, a collaborative agreement was signed between the Australian and NorthernTerritory (NT) Governments which established the Rum Jungle Rehabilitation Project.The agreement extended to 1988, incorporating a four year program of rehabilitation(1982-86) and a two year monitoring program (1986-88).
1. SUMMARY
Rum Jungle Monitoring Report Page 1

This document reports on the monitoring activities which have been conducted between1986 - 88 by the Power and Water Authority (PAWA) and the ConservationCommission of the Northern Territory (CCNT) of the NT government, and theAustralian Nuclear Science and Technology Organisation (Ansto). These activities havebeen designed to assess the success of the rehabilitation project in reducing the quantityof pollutants being generated on site.
Results of monitoring activities conducted since 1988 have been documented in separatereports which are available from the CCNT.
1.2 SUMMARY OF MONITORING ACTIVITIES
The following section summarises the findings of the various monitoring programsoutlined in detail in following chapters.
1.2.1 SURFACE WATER HYDROLOGY (CHAPTER 4)
The primary objectives of the surface water quality monitoring program on the EastFinniss and Finniss Rivers were the measurement of annual flow volume and dissolvedcopper, manganese, zinc and sulphate loads at GS8 150097.
Recorded total flow in the East Finniss River at G58150097 in the two years followingcompletion of the rehabilitation program was low. Flow recorded in 87/88 was thelowest seasonal flow volume recorded since the commencement of monitoring.
The original agreement between the Commonwealth and the Territory governments seta target for total dissolved pollutant load reduction in the East Finniss River. Figuresfor 1987/88 show that these targets for copper, manganese, zinc and sulphate have beenmet.
In 1987/88 radium-226 concentrations at no time exceeded the maximum recommendedlimit for drinking water of 0.4Bq/l. The maximum recorded concentration was 0.2BqIlas compared to 0.6lBq/l in 86/87.
High concentrations of copper and radium were recorded in seepage from Dyson's OpenCut in 1986/87, but annual loads were low. In the following year, copper concentrationswere reduced while similar radium concentrations were encountered.
Five out of seven of the subsoil drains on White's Overburden Heap discharged pollutedwater between 1986 and 1988. These flows were characterised by high pollutantconcentrations and low flows. Water quality was similar to that recorded during theprevious three seasons. This pollution is attributed to either shallow groundwater flowentering from the south or minor infiltration of rainwater through the covers.
Contributions to the total dissolved load at 0S8150097 from these drains is minor anda reduction in these levels was recorded from 1986-1988. The reduction could beattributed to both the success of the rehabilitation works and the difference in seasonalrainfall.
In 1987, the sampling programme was expanded in order to pinpoint the sources ofpollution entering the East Finniss River as recorded at 0S8150097 and to allocate
Page 2 Rum Jungle Monitoring Report

percentages of pollutant loads from each source to the total pollutant load. Thisprogram verified qualitative assessments that the open cuts were major contributors.
While targets for the reduction in pollutant loads in the East Finniss River have beenmet, it is concluded that the integrity of the rehabilitated structures needs to be testedby above average flows.
1.2.2 GROUNDWATER HYDROLOGY (CHAPTER 5)
The height and quality of the groundwater beneath the Rum Jungle site have beenmonitored since the rehabilitation of the site was started in 1983. These measurementshave been studied with the aim of establishing the pathways of pollution transport andthe time scale for improvement in water quality.
The average contamination concentration has not changed significantly over the five yearperiod 1983-1988, with high concentrations being localised around former sources ofcontamination, such as the overburden heaps. Cyclic seasonal variation in concentrationis observable in some boreholes, from which it can be implied that mixing betweeninfiltrating rainwater and the reservoir of polluted groundwater is limited.
Mathematical modelling has been used to gain understanding of the system. The modelshows that there is a large store of pollutants held in the porewater within theoverburden heaps. Calculations of the movement of water through the heaps indicatethat it will take from 10 to 20 years before there is noticeable drop in contaminantconcentration from this source.
The groundwater measurements show that the concentration of pollutants in the wateradjacent to the heaps has not been changed significantly by the rehabilitation.Nevertheless, a tenfold reduction in output must result from the reduction in infiltrationthrough the heaps. This is consistent with the measured improvement in surface waterquality.
Monitoring of groundwater should continue for at least 10 more years, given thatcalculations of water movements through the overburden heaps indicates that it will takefrom 10 to 20 years before there is a noticeable drop in contaminant concentration fromthis source.
1.2.3 WATER QUALITY OF THE OPEN CUTS (CHAPTER 6)
Water sampling in 1986/87 suggested that, post-rehabilitation, White's and IntermediateOpen Cuts were a greater source of pollutants to the East Finniss River than previouslythought. Monitoring activities in 1987/88 were increased in order to clarify a numberof questions which arose from the results of the 1986-87 program.
These results indicated that the pollutant contributions from Intermediate Open Cut werenot as great as originally thought. It was also determined that the higher concentrationsof heavy metals in the open cut may be due to:
The rise of contaminated groundwater from the Copper Heap Leach area andthe transport of pollutants via the adjacent waterway;The input of groundwater; andThe transport of pollutants from White's Open Cut.
Rum Jungle Monitoring Report Page 3

Heavy metal concentrations at depth are low but are gradually increasing.
The relatively unpolluted top layer in White's Open Cut deepened by two metres to 44metres AHD and the mixing zone deepened by three metres to 34 metres AHD.Increases in heavy metal pollutant concentrations in the upper White's Open Cut wereattributed to mixing with the deeper, polluted waters, evaporation and input ofcontaminated groundwater.
The zinc contribution from both open cuts was minimal when compared to the total loadmeasured at GS8150097, which is the sampling point on the East Finniss River for themeasurement of contaminants for the rehabilitated site.
1.2.4 CHEMICAL ACJIVHY AND WATER BALANCE (if ThE OVERUURJ*?4 HEWS (ca&vrut 7)
White's and Intermediate Overburden Heaps at Rum Jungle have been monitored todetermine the effectiveness of rehabilitation. Lysimeters installed in the heaps beforethe emplacement of the compacted clay layer were used to measure the infiltration ofrain. The results showed that less than five percent of the incident rainfall infiltratedthrough the cover layers.
Temperature profiles have been regularly measured using thermistor probes in bothheaps. Before rehabilitation the oxidation of pyrite in the dumps led to elevatedtemperatures. Heat production distributions derived from the measured temperaturesshowed that heat production occurring before rehabilitation was effectively stopped byrehabilitation.
The supply of oxygen was the main process limiting the rate of oxidation of pyrite inthe dumps before rehabilitation. Pore gas samples collected from the gas ports attachedto the probe holes have shown that rehabilitation greafly reduced oxygen concentrationsat depth within the dumps and effectively stopped the supply of oxygen by thermalconvection.
Monitoring of the heaps has shown that rehabilitation by reshaping and covering withcompacted clay was effective in reducing the ingress of water, the rate of oxidation ofpyrite and the transport of oxygen.
This monitoring should be continued on the current twice-yearly schedule. This is toenable the collection of data in both the wet and dry seasons, since conditions in theoverburden heaps have been found to display marked seasonal variations, withpotentially important ramifications with regard to pollution generations rates.
1.2.5 REvECETATION, EROSION CONTROL AND COVER STABILITY (CHAPTER 8)
Inspections were carried out in August 1987 and May 1988 on all rehabilitated surfacesat Rum Jungle to assess the integrity of drainage works stability, pasture status, slopestability, tree growth, and maintenance works.
Remedial works were required on sections of the main drain on White's Heap to repairdamaged rip rap, lower two gabion weirs and extend mattressed outfalls. Commonlyoccurring weeds such as Hyptis and Sida are present to varying degrees on allrehabilitated surfaces but competition from pasture grasses has been strong to date,
Page 4 Rum Jungle Monitoring Report

limiting the extent of weed growth. Removal of isolated plants of Mimosa Pigra hasbeen required, however.
Assessment of the success of revegetation and surface stabilisation by ongoingmonitoring should be continued at an appropriate and economically practical level. Itis recommended that the current levels of maintenance should be decreased and that areview be conducted in 12 months.
Annual inspections should be continued to assess the stability of surface drainagestructures, pasture status, weeds, rock mulch stability, and soil fauna. More frequentinspections are recommended, however, to control outbreaks of Mimosa pigra.
Tree eradication programmes are currently not considered necessary, however, a reviewof this situation within the next twelve months is recommended.
Primary production such as hay cutting and grazing without a guaranteed commitmentto fertilisation and activities supervision is not recommended.
Unrestricted vehicular use of the site should not be allowed. The level of visitationshould be controlled and a small information pamphlet be produced to complement sitevisits.
1.2.6 SITE MANAGEMENT (CHAPTER 11)
The original agreement between the Federal and Northern Territory (NT) Governmentscatered for the rehabilitation of the Rum Jungle mine site between 1982-86 and amonitoring program between 1986-88.
In order to ensure the on-going integrity of the rehabilitated structures beyond this date,continuing monitoring and maintenance is required. A Site Management Plan wasdrafted, describing the extent and nature of such a program.
While recognising that the future use of the Rum Jungle site is subject to determinationof the Finniss River Land Claim, the Plan recommended that in order to maintain theintegrity of the site, it should be declared a Restricted Use Area under Section 20B ofthe Soil Conservation and Land Utilization Act (1980). As the statutory bodyadministering this Act, responsibility for site management after 1988 should be passedto the Conservation Commission of the Northern Territory.
A preventative maintenance program should be carried out by the CCNT based onannual assessments and monitoring by PAWA, Ansto and CCNT should also becontinued. Both these programs should be reviewed annually with a view to gradualreductions and possible phasing out of monitoring by 1993.
Rum Jungle Monitoring Report Page 5

2. INTRODUCTION
Maria Kraatz
Conservation Commission of the Northern TerritoryP0 Box 496, Pa/met-stan, Northern Territory,
Australia, 0831.
The Rum Jungle mine operated between 1950 and 1971, producing uranium, copper,nickel and lead. In the late 1960's it was recognised that pollutants emanating from theabandoned mine were responsible for severe environmental degradation of the FinnissRiver system. In 1982, a joint rehabilitation program was conducted by the Federal andNorthern Territory governments. This project achieved a major reduction in surfacewater pollution, public health hazard, pollution levels in the open cut water bodies andaesthetic improvement, including revegetation.
The project is perhaps the most fully documented of its kind in the world, encompassinga variety of environmental problems dealing with waste rock dumps, open cuts, tailingsdams and associated with radiological pollution and Acid Mine Drainage (AMD).Dissemination of results of this project and collaboration with various internationalorganisations such as the Canadian MEND program will contribute to a greaterworldwide understanding of the mechanisms of pollutant production and transport andto the development of appropriate preventative or rehabilitative strategies.
2.1 LOCATION AND CLIMATE
The Rum Jungle rehabilitation site is located 85 kilometres south of Darwin, the capitalof the Northern Territory of Australia. The site is located on the East Branch of theFinniss River in close proximity to the small township of Batchelor (See Figure 2.1).Rainfall is strongly seasonal and highly variable. Mean annual falls are around 1600mmand 90% of this is received from November to March during periods of intense rainfall.
2.2 HISTORY OF THE SITE
The existence of uranium ore in the Batchelor district was first reported as early as1869 but at that time interest in the ore was minimal. By 1948, however, the FederalGovernment was offering rewards for the discovery of uranium ore. In 1949, a goldprospector reported what was to become Australia's first uranium field at Rum Jungle.
Mining of uranium, copper, nickel and lead from White's deposit was originallyconducted by underground methods, however, open cut operations were later consideredfeasible. Uranium was also extracted from Dyson's Opencut and copper fromIntermediate Opencut until 1965 when mining operations ceased (Figure 2.2). Oretreated at Rum Jungle was also extracted from Rum Jungle Creek South and MountBurton which were within a few kilometres of the site.
Rum Jungle Monitoring Report Page 7

A total of 3,500 tonnes of uranium oxide (U303) and 20,000 tonnes of copperconcentrate were processed on site at Rum Jungle.
The major features at the site when it was abandoned were:
three waste rock dumps containing a total of ten million tonnes of material andcovering an area of 51 ha;
three water fifled opencuts covering an area of 22 ha;
a tailings disposal area containing about 0.6 million tonnes of tails and covering 31ha; and
a copper heap leach pile containing about 0.3 million tonnes of low grade copper oreand covering an area of about 2 ha.
Page 8 Rum Jungle Monitoring Report
DAR95a
Figure 2.1 Location of the Rum Jungle mine rehabilitation site

2.3 THE LEGACY
The generation of sulphuric acid and heavy metals from the waste rock dumps and therelease of large quantities of radio-nuclides from the tailings dam at Rum Jungle wereresponsible for severe environmental degradation of the Finniss River, the East Branchof which flows through the site, and its surrounds.
Investigations in 1973-74 showed that the waste rock dumps and heap leach pile werethe major sources of pollution. These contributed about 85% of the copper load in theEast Branch and a similarly high fraction of other major pollutants. The next majorsources were the opencuts which contributed about 10% with the tailings damcontributing about 5 % of the copper load. The impact of uranium and its daughterradionuclides was of minor concern compared to the impact of heavy metals, particularlycopper, manganese, zinc and sulphate.
The pollution generation mechanisms are the same in all dumps, namely the bacteriallycatalysed oxidation of sulphidic material and the consequent production of sulphuric acidand soluble metal sulphates. This is a common pollution generation mechanism at minesites throughout the world and usually is described as Acid Mine Drainage (AMD),
Between 1954 and 1961 unneutralised tailings were released into the tailings dam whereit was partially contained by a series of small impoundments (Allen & Verhoeven 1986).Supernatant liquor containing entrained tailings were released over the dam wall intoTailings Creek which fed into the Finniss River. These tailings were acidic andconsisted of low levels of radio-nuclides and high levels of heavy metals. Consequently,the tailings dam area and the length of Tailings Creek were totally devoid of vegetation.On several occasions , the dam wall breached and significant quantities of tailingsmaterial entered the Finniss River system. After 1961, tailings were redirected intoDyson's Open Cut. The abandoned tailings dam wall again breached and tailingscontinued to be eroded and deposited into the river system for some time. It wasestimated that a total of 150,000 tonnes of acidic waste were transported from thetailings dam into the river.
High concentrations of heavy metals combined with a low pH in the East Finniss Riverresulted in the virtual absence of flora and fauna species for 8.5 kilometres downstreamof the mine to the confluence with the Finniss River. The number of species wasdrastically reduced due to both direct contamination from pollutants and a loss of habitatdue to vegetation death along the river banks (Davy 1975). This reduced biodiversityin aquatic life in the Finniss River was evident for at least 15 kilometres downstreamof the junction with the East Branch. This also contributed to increased rates oferosion.
One hundred square kilometres of the Finniss River floodplain was also affected bycontaminants and levels of copper and manganese in forage grasses appeared to be onthe borderline of stock injury although that had not been observed. Following closureof the mine in 1971, it became apparent that if uncontrolled, acid and heavy metalpollution generation would continue in the Rum Jungle waste rock dumps at a veryslowly decreasing level for a period of some hundreds of years (Department of theNorthern Territory 1978).
Rum Jungle Monitoring Report Page 9

BORROW AREA5
-- - -J-. - j
BORROWTA LI! uAM r J
AREA 'N1. Wash dsw' '
-aoIiiv --- Lirn estoraqe DS3NSr Fec shcd -- / OPENJ cut 2YSONS
N < 2 çTTh BLRDEN
iVaier Offices _t2( 2 / -aflt EvaDsrstIt'
N 4seraj4 eor/t oran
2 Dari
- 'emasiete /Overbsrder - ) r -- Saeet Water Darn
/HeaD
BUDENJ,CkEA
N
Page 10 Rum Jungle Monitoring Report
- -
SCALE
Figure 2.2 Rum Jungle Site Plan
2.4 THE REHABILITATION PROJECT
The Australian Nuclear Science and Technology Organisation (Ansto, formerly theAustralian Atomic Energy Commission, AAEC) conducted a series of studies aimed atidentifying the extent and major sources of pollution at Rum Jungle. Following therelease of these studies and mounting public concern regarding the ongoing pollution ofthe Finniss River system, the Australian Government announced in 1977 that it wasconsidering the rehabilitation of the Rum Jungle site. It stated that the Rum Jungleoperation was carried out with inadequate concern for the environment and would notbe permitted by today's standards. (Department of the Northern Territory 1978).
An initial clean up was conducted in late 1977. However, the measures taken werelargely aesthetic and were not aimed at reducing the generation of pollutants on site.
A number of strategies had been proposed world-wide to counter the problem of AcidMine Drainage, but none of these had been tested. A working group was establishedto develop a series of strategies for the rehabilitation of the Rum Jungle site and in1982 an agreement was signed between the Federal and Northern Territory Governmentswhich established the Rum Jungle Rehabilitation Project. The agreement established a
0 500 bOOm

project which was clearly beyond the scope of a single company or mine and which wasnot hindered by ongoing mining operations. Rehabilitation was completed in 1986 ontime and within budget at a total cost of about M$18 (in 1986 terms).
The objectives of the rehabilitation project were:
to achieve a major reduction in surface water pollution, aimed at reducing theaverage annual quantifies of copper, zinc and manganese by 70%, 70% and 56%respectively as measured at the confluence of the East Finniss River and theFinniss River;
to reduce public health hazards, including radiation levels;
to reduce pollution levels in the waters of White's and Intermediate Open Cuts;and
to implement aesthetic improvements including revegetation.
Each of these objectives is dealt with in detail in the Final Project Report (Allen &Verhoeven 1986).
The following works were completed under the project, which was carried out over afour year period commencing in 1982.
The rehabilitation of White's, White's North, Tntermediate and Dyson'sOverburden Heaps.
The treatment of water contained in White's and Intermediate Open Cut pits.
The removal of the tailings contained in the Old Tailings Dam to Dyson's OpenCut and the rehabilitation of the area previously occupied by the tailings.
The removal of the low grade copper ore from the Copper Heap Leach Pile toDyson's Open Cut, and the rehabilitation of the Copper Heap Leach Pile area.
The rehabilitation of the Treatment Plant and stockpile areas.
The partial rediversion of the East branch of the Finniss River and the removalof the Acid and Sweetwater Dams.
Monitoring was established as a crucial part of the project to determine the success ofthe project as outlined in the original agreement. This document reports on themonitoring activities which have been conducted between 1986 - 88 by the Power andWater Authority (PAWA) and the Conservation Commission of the Northern Territory(CCNT) of the NT government, and the Australian Nuclear Science and TechnologyOrganisation (Ansto), Results collected and analysed prior to and including 1986 werereported in detail in the Final Project Report (Allen & Verhoeven 1986). Results ofmonitoring activities conducted since 1988 ¶iave been documented in separate reportswhich are available from the CCNT.
Rum Jungle Monitoring Report Page 11

3. MONITORING - GENERAL
From Chapter 12 A lien & Verhoeven (1986)
3.1 INTRODUCTION
The Agreement between the Commonwealth and Northern Territory governments whichestablished the Rum Jungle Rehabilitation Project defined monitoring as ..that part of therehabilitation programme that calls for investigatory work to be carried out to determine theeffect of the rehabilitation work on the site and the river and maintenance measures asnecessary to preserve the integrity of the rehabilitation work.
The monitoring period was defined as 1st July, 1982 to 1st July, 1988. It was recognised,however, that monitoring would probably extend beyond that date to 1992, (a total period often years), in order to determine the long term success of the project (Mining and ProcessEngineering Services, 1982).
3.2 MONITORING PROGRAMME
3.2.1 THE COPPER HEAP LEACH PILE
Monitor revegetation of the area.Visual inspection of the revegetation of the area by the Conservation Commission ofthe Northern Territory (CCNT).
Monitor erosion of the area.Visual inspection by the CCNT.
3.2.2 THE OLD TAILINGS DAM
Monitor the migration of radium in the subsoil. A study by the AustralianNuclear Science and Technology Organisation (Ansto, formerly the Australian AtomicEnergy Commission, AAEC) to determine the extent of migration of radium in thesubsoil below the tailings in the Old Tailings Dam, if any.
Monitor revegetation of the area.Visual inspection of the revegetation of the area by the CCNT.
Monitor erosion of the area.Visual inspection by the CCNT.
Rum Jungle Monitoring Report Page 13

3.2.3 DYSON'S OPEN CUT
(I) Monitor local groundwater regime.A number of observation bores have been established on the down slope side ofDyson's Open Cut (Figure 3.1) monitoring the groundwater around the opencut toconfirm the containment of the tailings material. Monitoring by Water ResourcesDivision of the Power and Water Authority (PAWA)(formerly the Water ResourcesDivision of the Department of Mines and Energy).
Monitor erosion of covers and drains.Visual inspection of the covers and drains by the CCNT.
Monitor vegetation condition.Visual inspection of the condition of the vegetation on the fill in the open cut by theCCNT.
Monitor settlement of fill.Periodic survey of the established grid system on the open cut to determine the extentof, and any changes to, the settlement of the fill material in the open cut. The surveyis conducted on request by the Northern Territory Department of Lands.
3.2.4 WHITES'S OPEN CUT
Monitor water quality and temperature profiles.Regular assessment of the quality and temperature of the vertical profiles of the opencut by Water Resources Division of PAWA.
Monitor revegetation of embankments.A visual programme conducted by the CCNT.
3.2.5 INTERMEDIATE OPEN CUT
Monitor water quality and temperature profiles.Regular assessment of the quality and temperature of the vertical profiles of the opencut by Water Resources Division of the PAWA.
Monitor revegetation of embankments.A visual programme conducted by the CCNT.
3.2.6 DYSON'S OVERBURDEN HEAP
Monitor erosion of covers and drains.A visual programme of inspection by the CCNT.
Monitor condition of vegetation.A visual programme by the CCNT.
Page 14 Rum Jungle Monitoring Report

AREA 2
BORROWAREA 1
N
\\
r'o\iiingscree
S
1 TAILINGS DAM=c; BORROW
)'"DYSONSDYSONS
AREAwashdown
Lime Storage I)
HEAP
FacibtyN Feed Shed .5' OPEN CUT.
OVERBURDEN
/b j,_Treatment- Water Offices -
-I-
IPtant Evaporati WHITES t2Fniss er
-C,PosOPEN iP Rediversion
er HeapCUT /
LeachDamN ermediat -=. (Open Qut
:::?: 'c)/cS
* WHtTESOVER AURDEN/- / '\\ HEAPI- ;t
4,/I
\//>
/BORROW AREAS
___/ Sto/ pence
BORROW AREA 5
/t
Sweet Water Dam
BORE HOLES
Figure 3.1 Borehole Locations
/
j
SCALE
N
N
500 bOOm
DDAR95c
II-//

3.2.7 WHITE'S OVERBURDEN HEAP
Monitor the water balance of the heap.Programme of measurement of infiltration through the cover system (by Ansto)and run off from the heap (by the Water Resources Division of PAWA).
Monitor groundwater in and around the heap.An observation bore has been established through White's Overburden Heapand a network of shallow and deep observation bores have been establishedaround the heap (Figure 3.1). The water levels and quality of the aquifersystem are monitored. The recording of levels, sampling and data analysisfor this programme were being conducted by the Water Resources Division ofthe Department of Mines and Energy (now PAWA). However, after June1986 responsibility for the assessment of the data passed to Ansto.
Monitor erosion of covers and drains.A visual programme of inspection and assessment by the CCNT.
Monitor chemical activity.Chemical activity within the overburden heap is monitored by the measurementof temperature and gas composition within the heap. This programme isconducted by Ansto.
Monitor condition of vegetation on the heap.A visual programme of monitoring the condition and extent of vegetation bythe CCNT.
3.2.8 INTERMEDIATE OVERBURDEN HEAP
Monitor infiltration into the heap.Programme of measurement of infiltration through the cover system by Ansto.
Monitor groundwater in and around the heap.A network of shallow and deep observation bores has been established aroundthe heap (Figure 3.1). Water levels and quality of the aquifer system aremonitored. The sampling and data assessment for this programme was beingcarried out by the Water Resources Division of the Department of Mines andEnergy (nos? PAWA). However, after June 1986, responsibility for theassessment of the data passed to Ansto.
Monitor erosion of covers and drains.A visual programme of inspection and assessment by the CCNT.
Monitor chemical activity.Chemical activity within the overburden heap is monitored by the measurementof temperature and gas composition within the heap. This programme is carriedout by Ansto,
Monitor condition of vegetation on the heap.A visual programme of monitoring condition and extent of vegetation carriedout by the CCNT.
Page 16 Rum Jungle Monitoring Report

3.2.9 AREA OF FORMER WHITE'S NORTH OVERBURDEN HEAP
(1) Monitor erosion of the area.A visual programme of inspection by the CCNT.
(ii) Monitor condition of vegetation.A visual programme carried out by the CCNT.
3.2.10 ACID AND SWEETWATER DAMS
Monitor stream bed and embankment condition.A visual assessment of the condition and vegetation of the stream beds and banks bythe CCNT.
3.2.11 OTHER AREAS
Monitor the regeneration of vegetation around the site, in particular on the rehabilitatedborrow areas. Conducted by the CCNT.
3.2.12 WATER TREATMENT PLANT
Groundwater at filter cake disposal site.Regular sampling of groundwater observation bores around the filter cake disposal siteby the Water Resources Division of PAWA.
3.2.13 REGIONAL MONITORING
Regional groundwater monitoring to detect possible movement of heavy metalsaway from the mine site.Regular monitoring of water levels and sampling of established observation boresin and around the mine site, and monitoring of spring flows (Figure 3.1).Conducted by the Water Resources Division of PAWA.
Water quality of the Finniss River system.Stream flows in the Finniss River and the East Branch of the Finniss River aremeasured at sites shown in Figure 4.1 and 4.2. Monitoring for water quality andflow regime during each wet season is conducted by the Water ResourcesDivision of PAWA.
Stream bed sediments of the East Branch of the Finniss River.
Random sampling and analysis of the sediment deposits in the bed of the EastBranch of the Finniss River by the Water Resources Division of PAWA.
Rum Jungle Monitoring Report Page 17

4. SURFACE WATER HYDROLOGY
C.H.R.F. Henkel and J.F. Alcock (1986-87)C.H.R F. Henkel(1 98 7-88)
Power and Water Authority,GPO Box 1096,
Northern Territory, Australia, 0801
4.1 INTRODUCTION
4.1.1 BACKGROUND
The pollution regime of the East Finniss and Finniss Rivers was monitored during theRum Jungle Rehabilitation Project from 1982-83 to 1985-86, (Alcock & Henkel 1984,85, 86 and Henkel & Alcock 1987). One of the main objectives of these studies wasthe measurement of annual flow volume and copper, manganese, zinc and sulphate loadsat 058150097 on the East Finniss River. These studies showed that the project was asuccess and that copper and zinc loads were substantially reduced. The Commonwealthand Northern Territory Governments agreed to continue detailed monitoring, includingsurface water quality monitoring for the 1986-87 and 1987-88 wet seasons.
4.1.2 THE 1986-87 AND 1987-88 SURFACE WATER QUALITY PROGRAMMES
The purpose of the 1986-87 surface water monitoring programme was to measurepollution in the Finniss River system and on the mine site, and to relate thesemeasurements to the rehabilitation programme. Specifically, the objectives of the 1986-87 monitoring were to:
Accurately measure daily and annual copper, manganese, zinc, sulphate andradium-226 loads transported by the East Finniss River at 058150097.
Describe the rainfall and stream discharge and the pollutant concentrations andloads in the East Finniss River.
Monitor water quality in the Finniss River at 058150204 below the confluencewith the East Branch.
Collect mine site water quality data to provide information on the location ofpollution sources and their contribution to stream pollution.
Rum Jungle Monitoring Report Page 19

4.1.3 THE STUDY AREA
Figure 4.1 shows the surface water monitoring locations including gauging stationsGS8l50097 on the East Finniss River and GS8150204 on the Finniss River.
Figure 4.2 shows the mine site gauge stations and sampling locations in greater detail.
4.2 THE 1986-87 AND 1987-88 EAST FINNISS RIVER MONITORINGPROGRAMME AT GS8150097
4.2.1 INTRODUCTION
The sampling programme, described in Section 4.1.2 , comprised the measurement ofdaily rainfall at pluviometer station R815202A (in 1986-87) and R815205 (in 1987-88), daily flow volumes and daily discharge weighted pH, specific conductance andcopper, manganese, zinc, sulphate and radium-226 concentrations at GS8150097.
Gauging station GS8 150097 is downstream of all mine site pollution input and is thesite identified by the Commonwealth and Northern Territory Governments for themeasurement of pollution loads.
4.2.2 SAMPLE COLLECTION AT GS8150097
The technique for sample collection was the same as that used since the inception ofmonitoring in 1982-83, (Alcock et al. 1984, 1985, 1986 and Henkel & Alcock 1987).This involved the collection of twelve, two hourly samples, each comprised of threesamples taken at 40 minute intervals using an automatic sampler. A daily compositewas prepared according to the average discharge for the twelve two hour periods.Discharge weighted samples were also collected for soluble radium-226 analysis.
4.2.3 RUM JUNGLE MINE SITE RAINFALL
The daily rainfall at mine site pluvios R815202A and R815205 is shown in AppendixA Figures 4.3 and 4.4. Annual rainfall at pluviometers R815202A and R815205 since1982-83 are shown in Table 4.1. The pluviometer locations are shown in Figure 4.1.
Table 4.1 Annual Rainfall Rum Jungle Mine Site (mm)
Page 20 Rum Jungle Monitoring Report
WATER YEAR R815202A R815205
1982-83 1 1211984-85 1 112 1 1361985-86 1 207 11851986-87 1 345 1 2221987-88 1 058 1 064

Rum
Jungle Monitoring R
eport Page 21
___çt3815C2O4 ,___/
\cçcIMtFitch
___/_..,._ ..,, - -'S.
Hannas Pool
GSS150097 \
Mt Duflon
F,ncnsc
Ia
J
K
/I
cs,
Figure 4.1 Surface water monitoring locations
.5
I
'I
- -. .
R815202A
WhitesOverburden
Heap
II C 1 2km
-5S.-. \ "S.- 5.
-i-St.')
44rS.
.5-R81 5205t
- GS8150208 Gauge Station
I
LEGEND
Scale
IN
.1
DDAR95d

I
a0581 50210
0581 50214
Intermediate 1/Overburden Heap/fIA'
Whites Open CutCr0
InlermediateOpen Cut
058150211 058150209-..6S81 50205
815021Z- I
C
II- 058150213
0581 50216
GS8150217
N.
05815021
0581 50221
rcN 2d)058150222<2
<2-<2
<2 -<2
'7
/
Dysons Open 1)tt. 0581 50215Cut Landlorm,,ç,/<
/oGS8l50208
Figure 4.2 Mine site sampling locations
1. O
N
DysonsOverburden Heap
LEGEND
03 SEEPAGE OUTLET
B SAMPLING LOCATIONS- WANDERINQ CREEK
DRAINAGE $YSTEM
A4 SAMPLING LOCATIONS- DYSONS DRAINAGE SYSTEM
SAMPLING LOCATIONS- DYSONS OVERBURDEN HEAP
SPRING
I U5 SAMPLING POINT
0 200 400m
Scale
DDAR95e

4.2.4 FLOW CHARACTERISTICS AT GS8150097
The 1986-87 wet season flow commenced on the 4th December 1986. Flow ceased onthe 12th December 1986, recommenced on the 14th January 1987, and then continueduninterrupted until the 3rd May, 1987. The 1987-88 flow commenced on the 21stDecember 1987 and continued uninterrupted until the 9th May, 1988. Day to dateconversions for both years are given in Appendix B Tables 4.2 and 4.3, Daily flowvolumes at GS8150097 are shown in Appendix A Figures 4.5 and 4.6 and in AppendixB Tables 4.4 and 4.5. The total flow volume for 1986/87 was 13.2 x 10 m3, similarto the flow volumes for 1982-83, 1984-85, and 1985-86. The total flow for 1987-88was 6.3 x 10⁶ m3 which was the lowest flow recorded since the inception of thesampling programme. The total and monthly flow volumes for these years are shownin Table 4.6.
Table 4.6 East Finniss River total monthly and annual flow volumes (it? m3)at GS8150097
YEAR DEC JAN FEB MAR APR MAY TOTAL
Run off characteristics and stream flow have altered because of rehabilitation. Themajor alteration to stream flow resulted from the partial rediversion of the East FinnissRiver to flow through White's and Intermediate Open Cuts. Water began to flow fromWhite's Open Cut via Copper Creek and from the Intermediate Open Cut outflow sometime between midday 17th January 1987 and midday 18th January 1987.
Overflow from White's commenced on the 16th January, 1988 (day 27) and continueduntil the 29th April, 1988 (day 131). The Intermediate Open Cut started to flow on day33, the 22th January, 1988 and flowed intermittently until finally ceasing on day 110,the 8th April, 1988.
4.2.5 WATER QUALITY AT GS8150097
i986-87
The temporal variation of pollutant concentrations at GS8150097 is the result of theinteraction of all of the mine site pollution sources. The mine site hydrology iscomplex and incompletely understood and this limits the interpretation of the pollutionregime at GS8 150097. The temporal contribution of the major mine site pollutionsources is discussed in Section 4.5.
Rum Jungle Monitoring Report Page 23
1982-83 237 46 225 6 190 2 800 89 9 7001984-85 0 662 1 820 4 900 3 780 34 11 7001985-86 88 6 060 2 730 1 030 1 270 45 Il 4001986-87 43 581 8 710 3 510 386 1 13 2001987-88 230 480 2 700 1 500 10 10 6 300

The 1986-87 daily discharge and discharge based daily pH, specific conductance, copper,manganese, zinc, and sulphate concentrations are shown in Appendix A Figures 4.5 and4.7 to 4.12 respectively. The data are in Appendix B Table 4.4.
Flow commenced at GS8150097 on the 4th December 1986 which is defined as day 1.Hydrographic data from 058150097 suggest that the first two days of flow atGS8150097 were the result of local run-off. This is supported by the fact that pollutantconcentrations were very low. The next three days' water quality data were lost dueto equipment malfunction.
The water quality for days six to ten showed low pH, increased specific conductanceand increased concentrations of copper, manganese, zinc and sulphate. Low flowsthrough the mine site are designed to flow in the Diversion Channel. Contaminationof water flowing in the Diversion Channel occurred through: the dissolution of salts inthe stream bed and on the banks, by polluted groundwater and by seepage from theOverburden Heaps.
There was no flow for the next 32 days. Flow at 058 150097 recommenced on day 42,the 4th January, 1987. As flow increased, more water was diverted to the Open Cutswhich overflowed on day 45, the 17th January, 1987. Days 45 to 49 had low flowwhich resulted in relatively high concentrations of pollutants at 058150097. Low flowconditions were conducive to relatively high pollutant concentration in the Diversionchannel and Wandering Creek. Also, early low volume flows through the Open Cutsresulted in seasonal highs for Open Cut outflow pollutant concentrations.
Daily flow volumes increased on day 60 and by day 63 the effect of reduced pollutantconcentrations in the Open Cuts outflow waters and reduced pollutant concentrations inthe Diversion Channel and Wandering Creek was manifested by steadily reducingpollutant concentrations at GS8150097. Pollutant concentrations remained low untilaround day 120.
Following day 120, pollutant concentrations at 058 150097 increased. Low flows in theEast Branch were diverted toward the Diversion Channel and water quality wasmarkedly influenced by polluted ground water and seepage particularly from theIntermediate Overburden Heap.
The maximum average daily dissolved pollutant concentrations measured for the sixyears of monitoring are given in Table 4.7.
Table 4.7 Maximum concentrations of pollutants at GS8150097 (mg/I)
YEAR COPPER MANGANESE ZINC SULPHATE
Page 24 Rum Jungle Monitoring Report
1982-83 182 13 3.7 1 2901983-84 69 6.2 3.8 1 3501984-85 10.5 7.0 2.8 7001985-86 5.3 3.5 2.8 1 0601986-87 3.4 3.7 3.6 6001987-88 4.4 4.0 6.9 950

The maximum daily metal concentrations at 058150097 occurred during very low flowon the 13th December 1986, in waters that had flowed from the Diversion Channel andWandering Creek.
The maximum daily concentration of copper, environmentally the most significantpollutant, continued to decrease in comparison to the maximum concentrations measuredin previous years. The maximum daily concentration of zinc, which is also toxic toaquatic life, was greater than that recorded in 1985-86 and 1984-85 and similar to thatof 1982-83 and 1983-84. The maximum daily concentration of manganese was near tothat of 1985-86, and much less than that recorded in 1982-83. The maximum dailyconcentration of sulphate decreased significantly from 1060 mg/I in 1985-86 to 600mg/l in 1986-87, (1-lenkel & Alcock 1987). The maximum daily concentration ofsulphate was recorded on day 45, the first day that water overflowed from the opencuts.
1987-88
Due to the increased sampling frequency at the mine site sampling points, a betterunderstanding of the pollution sources and the interpretation of the pollution regime atGS8150097 was possible during the 1987-88 sampling program.
Good agreement was obtained between measured total mine site pollution loads andpollution loads measured at GS8150097. This applies to both the calculated andsynthesised loads. This is further dealt with in Section 4.4.2.
The 1987-88 daily discharge and discharge based daily pH, specific conductance,dissolved copper, manganese, zinc, and sulphate concentrations are shown in AppendixA Figures 4.6 and 4.13 to 4.18 respectively. The data are shown in Appendix B Table4.5.
Flow commenced at 0S8150097 on the 21st December 1987 which is defined as day1, and continued to flow uninterrupted until the 9th May 1988, day 141.
As with previous initial flows at 058150097, the pollutant concentrations were high assalts deposited at the end of the past wet season were redissolved.
The concentrations again gradually increase with diminishing flows unless high rainfallsestablish a good soaking of the ground and a constant flow in the river system isestablished.
Copper Creek started flowing on day 27, the 16th January 1988, coinciding with arainfall of 38mm. Notable are the high zinc concentrations found at 058 150097 untilthis date, pointing to the fact that most of the pollution, other than that caused by theredissolving of salts in the river and creek beds, originated from groundwater seepagesfrom White's and Tntermediate Overburden Heaps into the Diversion Channel (seesection 4.4.2).
As the run off from the catchment increased, more water diverted through the open cuts.White's Open Cut started releasing water on day 27, the 16th January 1988, into CopperCreek and then into Intermediate Open Cut
The initial release of water from the open cuts resulted in temporarily high pollutantloads at 058150097. After a constant flow through the open cuts was established,however, pollutant concentrations abated.
Rum Jungle Monitoring Report Page 25

It is worthwhile to. note that pollutant concentrations remained relatively low at the endof flow for the 1987-88 season. This is particularly the case for sulphate and copperconcentrations, which had less than half the concentrations at end of flow in the 1986-87 season.
The maximum daily metal concentrations at 088150097 occurred during very low flowon day 25 to 26, the 14/15th January 1988, in waters that had flowed from theDiversion Channel and Wandering Creek only (Table 4.7),
The maximum daily concentration of all measured pollutants were greater in 1987-88than in 1986-87. This does not mean that pollution in the East Finniss River isworsening, as these concentrations were measured on days of low flow, hence only asmall amount of pollution load was carried.
The mean concentrations from 1986-87 to 1987-88 increased for copper manganese andzinc by 16, 28 and 48 percent respectively. Sulphate and radium-226 mean dailyconcentrations reduced by seven percent. The increases in concentrations for the heavymetals should be seen in the light of the reduced flow for the season. The decreasefor sulphate shows a non-flow related trend, and could indicate, that a general cleansingof the mine site is taking place. Table 4.8 gives the comparison of mean dailyconcentrations at GS8150097 between 1987-88 and 1986-87,
Table 4.8 Mean daily dissolved pollutant concentrations at GS8150097
4,2,6 POLLUTANT LOADS AT GS$150097
The 1986-87 wet season total flow volume of 13.2 x 10 m3 resulted in the transportof 5.6 tonnes of copper, 8.6 tonnes of manganese, 2.7 tonnes of zinc and 2 870 tonnesof sulphate.
In 1987-88, 3.2 tonnes of copper, 5.4 tonnes of manganese. 2.0 tonnes of zinc and 1230tonnes of sulphate were carried by a total flow volume of 6.3 x 10⁶ m3.
The daily loads for copper, manganese, zinc and sulphate at GS8150097 for 1986-87 areshown in Appendix A Figures 4.19 to 4.22 respectively, and in Appendix B Table 4.9.Loads for 1987-88 are shown in Appendix A Figures 4.23 to 4.26 and Appendix BTable 4.10. The pollutant loads for the past five years are given in Table 4.11.
Page 26 Rum Jungle Monitoring Repofl
1986-87 1987-88
Copper mg/i .44 .51Manganese " .67 .85Zinc " .21 .31Sulphate " 213 199Radium Bq/l .059 .055

Table 4.11 East Finniss River annual pollutant loads at GS8150097
TOTAL FLOW LOAD (tonnes)VOL
(m3 x 106) COPPER MANGANESE ZINC SULPHATE
In order to compare pollutant loads for 1986-87 with the pre-rehabilitation loads of1982-83 it was originally considered necessary to make an adjustment for the differencein total flow volumes for the two years. For the purpose of comparison, the 1982-83load data were adjusted by a factor of 1.3, which is the ratio of the total flow volumein 1986-87 to the total flow volume in 1982-83. It was then decided, however, thattotal load carried did not increase proportionally to increased flow and figures for 1987-88 were not adjusted. The percentage improvement in 1986-87 and 1987-88 loads incomparison to 1982-83 pre-rehabilitation loads is given in Table 4.12. Table 4.12 alsoshows the percentage improvement in the 1986-87 copper, manganese and zinc loads incomparison to the loads anticipated on the basis of the 1971-72 to 1973-74 "possiblepre-rehabilitation relationship" between annual discharge and annual load described inthe "Final Project Report" (Allen & Verhoeven 1986).
The agreement between the Northern Territory and Commonwealth Governments refersto target load improvements of 70% for copper, 56% for manganese and 70% for zincin comparison to the loads anticipated on the basis of the 1969-74 monitoring data.Table 4.12 shows that the targets have been achieved.
Table 4.12 Percentage reduction in pollutant loads at GS8150097
Rum Jungle Monitoring Report Page 27
1982-83 9.7 22.7 6.1 5.2 1 5201984-85 11.7 9.1 7.2 4,1 1 6001985-86 11.4 3.7 8.2 2.7 4 4001986-87 13.2 5.6 8.6 2.7 2 8701987-88 6.3 3.2 5.4 2.0 1 230
1986-87(adjusted)
1987-88(non-adjusted)
POLLUTANT 1982-83 to 1971-74 to 1982-83 to 1971-74 to1986-87 1986-87 1987-88 1987-88
Copper 80 85 85 95Manganese Nil 85 10 90Zinc 60 80 60 90Sulphate -40 20 85

Comparison of the 1982-83, 1986-87 and 1987-88 load data shows that rehabilitation hassuccessfully reduced the copper and zinc loads in the East Finniss River, particularlycopper.
No improvement was shown in manganese loads from 1982-83 to 1986-87, however, aslight improvement was shown in 1987-88. Comparison of the 1982-83 pollutant loadswith those measured in 1969-74 showed that the pollution momentum had decreased.This decrease was very marked for manganese, as was discussed in Alcock & Johnston(1984). Currently there is still insufficient understanding of the pollution process towarrant speculation as to the future trend for manganese loads.
The increase in sulphate load in 1986-87 was the result of the partial rediversion Of theEast Branch to flow through the open cuts. The treated water in the open cutscontained high concentrations of sulphate which are being progressively flushed into theEast Finniss River. Sulphate loads, however, decreased in 1987-88 to bring about a20% improvement since 1982-83. It is not possible to further discuss the significanceof the 1986-87 or 1987-88 loads or to make predictions without a more detailedunderstanding of the pollution regime.
4.2.7 RADIUM-226 DAILY CONCENTRATTON AND LOADS AT GS8150097
Discharge based daily composite samples were collected during the 1986-87 and 1987-88 wet seasons, and the filtrate analysed for radium-226,
Prior to the burial of the tailings material and sub-soil in Dyson's Open Cut during the1984 dry season, radium-226 concentrations exceeded the drinking water criterion onabout one day in three, (Alcock & Johnston 1984, 85). The highest concentrations inboth years were measured early in the wet season. After 1984, radium concentrationsin the East Branch decreased. The drinking water criterion of 0.4 Bq/l was exceededonce in 1984-85 and not at all in 1985-86.
In 1986-87, five of the daily discharge based samples had soluble radium-226concentrations above the drinking water criterion. Two of these were only slightly inexcess of the drinking water criterion. In common with previous years. these occurredwith the low flows early in the wet season. Radium concentrations decreased withincreased flow and increased modestly during the flow recession. No 1987-88 samplesshowed concentrations higher that the drinking water criterion. Daily discharge basedradium-226 concentrations at GS8150097 are shown in Appendix A Figures 4.27 and4.28.
The 1986-87 and 1987-88 radium-226 loads at GS8150097 were 800 and 350megaBecquerels respectively. The daily loads are shown in Appendix A Figures 4.29and 4.30.
A comparison of the previous two seasons and 1987-88 radium-226 pollution data aregiven in Table 4.13.
Page 28 Rum Jungle Monitoring Report

Table 4.13 East Finniss River GS8150097 radium-226 pollution
Units: Concentration BqIlLoad MBq
A one-off" sampling programme was carried out on the 16th January 1987 to providean indication as to the source of radium contamination. The results of the sampling areshown in Table 4.14.
Table 4.14 Radium-226 concentration in the vicinity of tailings creek (16thJanuary 1987)
LOCATION Ra-226 CONCENTRATION
The radium-226 concentrations listed in Table 4.14 imply that Tailings Creek providedthe bulk of the radium-226 pollution and that the pollution input to Tailings Creek ismore than 50 metres downstream of the lined creek channel. Aerial photographs showthat prior to rehabilitation tailings material was widely distributed by erosion in the areadownstream of Tailings Creek. Confirmation would require further measurements.
Rum Jungle Monitoring Repon Page 29
1985-86 1986-87 1987-88
No. Samples analysed 97 114 141
No. days exceedingdrinking water criterion Nil 5 Nil
Maximum daily Ra-226concentrations 0.37 0.61 0.29
Mean daily Ra-226concentrations 0.090 0.095 0.05
Maximum daily Ra-226 load 95 90 26
Mean daily Ra-226 load 8 10 2.5
Total Ra-226 load 800 800 350
East Finniss River upstream of Tailings Creek 0.042East Finniss River downstream of Tailings Creek 0.14Tailings Creek - 50 metres downstream of the
end of the lined channel 0.016
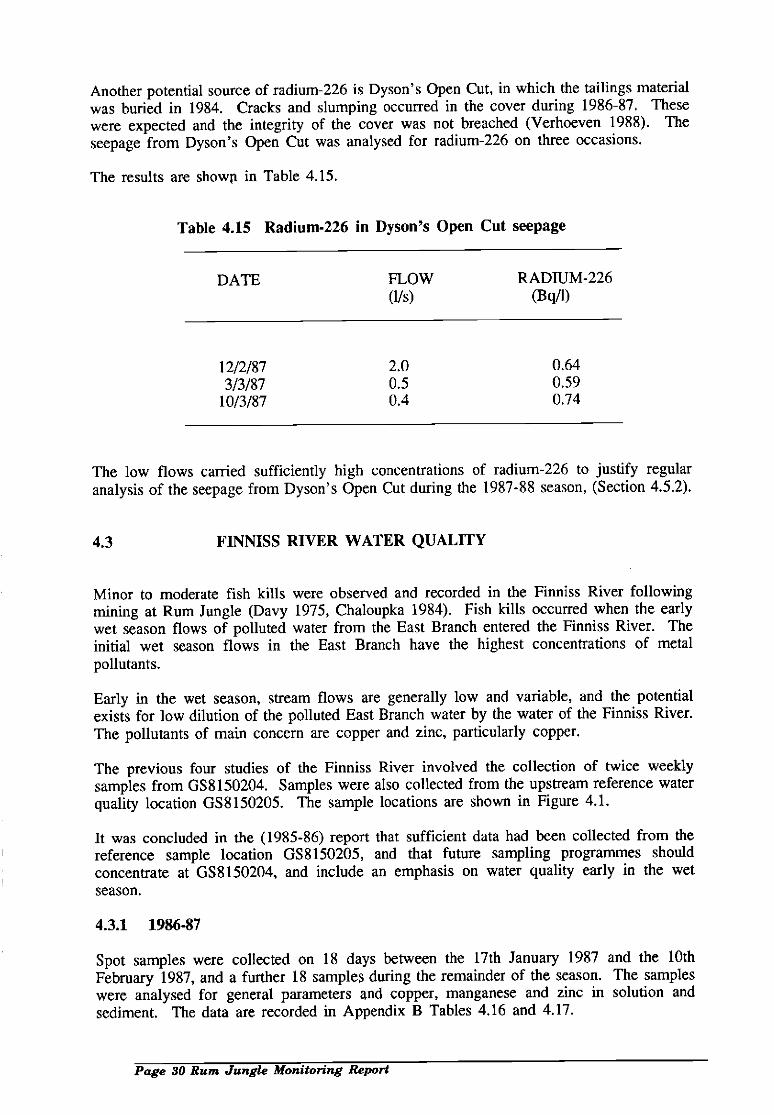
Another potential source of radium-226 is Dyson's Open Cut, in which the tailings materialwas buried in 1984. Cracks and slumping occurred in the cover during 1986-87, Thesewere expected and the integrity of the cover was not breached (Verhoeven 1988). Theseepage from Dyson's Open Cut was analysed for radium-226 on three occasions.
The results are showp in Table 4.15.
Table 4.1S Radium-226 in Dyson's Open Cut seepage
The low flows carried sufficiently high concentrations of radium-226 to justify regularanalysis of the seepage from Dyson's Open Cut during the 1987-88 season, (Section 4.5.2).
4.3 FINNISS RIVER WATER QUALITY
Minor to moderate fish kills were observed and recorded in the Finniss River followingmining at Rum Jungle (Davy 1975, Chaloupka 1984). Fish kills occurred when the earlywet season flows of polluted water from the East Branch entered the Finniss River. Theinitial wet season flows in the East Branch have the highest concentrations of metalpollutants.
Early in the wet season, stream flows are generally low and variable, and the potentialexists for low dilution of the polluted East Branch water by the water of the Finniss River.The pollutants of main concern are copper and zinc, particularly copper.
The previous four studies of the Finniss River involved the collection of twice weeklysamples from 0S8150204. Samples were also collected from the upstream reference waterquality location GS8150205. The sample locations are shown in Figure 4.1.
It was concluded in the (1985-86) report that sufficient data had been collected from thereference sample location GS8150205, and that future sampling programmes shouldconcentrate at GSS 150204, and include an emphasis on water quality early in the wetseason.
4.3.1 1986-87
Spot samples were collected on 18 days between the 17th January 1987 and the 10thFebruary 1987, and a further 18 samples during the remainder of the season. The sampleswere analysed for general parameters and copper, manganese and zinc in solution andsediment. The data are recorded in Appendix B Tables 4.16 and 4.17.
Page 30 Rum Jungle Monitoring Report
12/2/87 2,0 0.643/3/87 0.5 0.59
10/3/87 0.4 0.74
DATE FLOW RADIUM-226(l/s) (Bq/l)

The highest concentration of sulphate, and soluble and total copper, manganese and zincwere recorded on the first day of sampling, the 17th January 1987. This was coincidentwith the start of outflow from the open cuts and was the second day of flow for thewet season at 058150204. The maximum pollutant concentrations measured at0S8150204 from 1982-83 to 1987-88 are given in Table 4.18.
Table 4.18 Maximum concentrations of pollutants at GS8150204 (pg/I)
COPPER MANGANESE ZINC SULPHATEYEAR FILTRATE TOTAL FILTRATE TOTAL FILTRATE TOTAL (mg/I)
During 1987-88 the Finniss River at 058150204 was sampled on 68 occasions. Goodagreement exists for the calculated loads of soluble copper, zinc and sulphate whencompared to the loads carried at 058150097 at the East Finniss River. No reasonablerelationship could be established for the manganese load.
The behaviour of manganese in most environmental studies has been hard to predict andno explanation is offered for the discrepancy for the dissolved manganese loads betweenthese two gauging stations other than the likelihood of precipitation or the absorptionon particulate matter of both organic and inorganic origin.
The Finniss River upstream of the East Finniss River confluence is generally unaffectedby Rum Jungle mine site pollutants. All heavy metals and most of the sulphate foundat GS8 150204, which is below the confluence with the East Finniss River, originatefrom the various Rum Jungle mine site pollution sources. It has been estimated that thebackground concentration of sulphate in the Finniss River above its confluence with theEast Finniss River is approximately 12 mg/I.
Table 4.19 shows the loads calculated for GS8 150204 and compares them with the loadsfound at GS8150097. The sulphate concentration of 12mg/I estimated to be thebackground concentration in the Finniss river above its confluence with the East Branchis included in the calculations. Data collected at GS8150204 are shown in AppendixB Tables 4.20, 4.21 and 4.22.
Rum Jungle Monitoring Report Page 31
1982-83 21 000 21 020 4 000 4 030 1 000 - 370
1983-84 9 500 9 530 2 500 2 500 1 750 - 390
1984-85 1 360 2 380 1 630 1 645 40 - 190
1985-86 83 123 95 115 60 270
1986-87 850 950 800 920 500 530 150
1987-88 220 1100 530 640 310 900 140
4.3.2 1987-88

Table 4.19 Comparison of Dissolved Pollutant Load carried at GS8150097 andGS8150204
FLOW Cu Mn Zn SO4(m3 x 106) (tonnes)
The release of water from the open cuts was marked by a significant increase insulphate concentration and load at 058150204. High stilphate concentrations persisteduntil the open cuts were flushed and relatively unpolluted water flowed from the opencuts. This occurred between day 58 and 61, the 16th and 19th February, 1988.
Maximum soluble heavy metal concentrations in 1987-88 were lower than those for the1986-87 season. When considering the poor wet season of 1987-88, it is an indication,that pollution from the mine site is lessening, providing the generally accepted statementthat low flows are conducive to high concentrations, is valid.
The decrease in concentrations between 1982-83 and 1987-88 shows that a significantimprovement in water quality has resulted from the rehabilitation of the mine site.
4.4 MINE SITE POLLUTION SOURCES
4.4.1 1986-87
The second part of the surface water study involved measurements of discharge andwater quality at selected mine site locations. The information gathered from the analysisof this data is intended for:
assessing the contribution of individual sources to the pollution of the East FinnissRiver in the 1986-87 wet season;
providing information to aid other agencies in their studies; and
evaluating the success of the rehabilitation programme.
The studies described in this Section are:
the Dyson's Open Cut and Overburden Heap drainage system;
the Wandering Creek drainage system;
the White's Overburden Heap subsoil drainage outflow; and
a qualitative description of the seasonal load contributions from the DiversionChannel, Wandering Creek and the Open Cuts.
Mine site sample locations are shown in Figure 4.2.
Page 32 Rum Jungle Monitoring Report
GS8 150097 6.3 3.2 5.4 2.0 1 260
058 150204 55.0 3,2 1.5 2.0 1 300

DYSON'S DRAINAGE SYSTEM
The copper leach heap material and tailings material were buried in Dyson's Open Cut.Water seeps from Dyson's Open Cut to a drain which also receives seepage fromDyson's Overburden Heap before flowing into the East Finniss River. Some cracksappeared in the top of Dyson's Open Cut in 1986 and there was some slumping ofmaterial towards the centre, Some subsidence was expected and the cover did notappear to fail (Verhoeven 1988). The small volume of outflow was probably due tominor inflow through the cover and water squeezed from the tailings material.
The 1986-87 monitoring consisted of collecting water quality data and measuring flowsin the drain that carries the seepage from Dyson's Open Cut and Overburden Heap tothe East Branch. Sampling was carried out on ten occasions, at six locations, from the17th of February 1987 to the 21st of April 1987.
The following conclusions were made:
Water seeping from Dyson's Open Cut was acidic, (pH from about 3.2 to 4.0),and contained high concentrations of copper, manganese and radium-226 at smallflow volume. The maximum, minimum and flow weighted mean concentrationsfor the spot samples are in Table 4.23.
The pH of the water seeping from the Overburden Heap (sites 3 and 4) rangedbetween 2.4 and 3.6 and the copper, manganese and zinc concentrations weremuch lower than in the seepage from the Open Cut. Maximum, minimum anddischarge weighted mean concentrations for copper, manganese, zinc and sulphateare in Table 4.24.
Table 4.23 Water quality from l)yson's Open Cut Seepage Site 6
* Only three samples were analysed for radium-226.
Number of samples: 0Samples collected: 17/2/87 to 21/4/87Units: Concentration mg/i
Flow 1/sRadium-226 Bq/l
Rum Jungle Monitoring Report Page 33
MAX.CONC. FLOW DATE
MIN.CONC. FLOW DATE
MEANCONC.
Copper 784 0.50 3/3/87 110 2.0 1712/87 290
Manganese 457 0.05 21/4/87 51 1.0 24/2/87 110
Zinc 36 0.05 21/4/87 2.5 1.0 24/2/87 5.7
Sulphate 12 570 0.05 21/4/87 2 840 1.0 24/2/87 4 620Ra226* 0.74 0.40 10/3/87 0.54 2.0 3/3/87 0.62

Table 4.24 Water quality from Dyson's Overburden Heap Seepage Site 3
MAX. MN. MEANCONC. ROW DATE CONC. ROW DATE CONC.
Number of samples: 10
Samples collected: 17/2/87 to 21/4/87Units: Concentration mg/i
Flow 1/s
Pollution also enters the East Finniss River from a series of springs and seepage at thesouth side of the base of Dyson's Overburden Heap. The four sampling locations areshown in Figure 4.2.
The seepages were acidic (pH <3.0) and characterised by high manganese concentrations.Maximum, minimum and discharge weighted mean concentrations for copper,manganese, zinc, and sulphate for the four springs are in Tables 4.25.
Table 4.25 Water quality from Dyson's Springs
Dyson's Spring 1
Number of samples: 11
Samples collected: 15/2/87 to 22/4/87Units: Concentration mg/l
Flow 1/s
Page 34 Rum Jungle Monitoring Report
Copper 1.5 0.300 1712/87 0.73 0.01 21/4/87 1.2
Manganese 6.3 0.001 24/3/87 2.60 0.01 21/4/87 3.4
Zinc 1.5 0.050 3/3/87 0.58 0.02 17/3/87 0.8
Sulphate 9 480 0.050 3/3/87 3 090 0.01 2 1/4/87 7 920
MAX.CONC. FLOW DATE
MNCONC. FLOW DATE
MEANCONC
Copper 3.0 1.0 14/2/87 1.30 0.05 22/4/87 2.2
Manganese 43.0 0.1 17/3/87 20.00 2.00 2412/87 27.0
Zinc 1.8 2.0 3/3/87 0.94 0.13 24/3/87 1.4
Sulphate 20 800 2.0 24/2/87 9 760 0.05 22/4/87 17 250

Table 4.25 Cont'd
Dyson's Spring 2
Number of samples: 10Samples Collected: 14/2/87 to 22/4/87Units: as above
Rum Jungle Monitoring Report Page 85
MAX.CONC. aow DATE
MN.CONC. PLOW DATE
MEANCONC.
Copper 1.3 0.10 17/2/87 0.57 0.01 17/3/87 1.00
Manganese 40.0 0.01 17/3/87 16.00 0.10 17/2/87 24.00
Zinc 0.6 1.00 24/2/87 0.38 0.47 10/3/87 0.52
Sulphate 11 700 1.00 24/2/87 6 200 0.07 17/3/87 8 950
Number of samples: 5Samples collected: 14/2/87 to 17/3/87Units: as above
Dyson's Spring 3
MAX. MIN. MEANCONC. ROW DATE CONC. ROW DATE CONC.
Copper 0.95 3.00 14/2/87 0.48 0.17 17/3/87 0.80
Manganese 35.00 0.15 31/3/87 14.00 0.41 17/2/87 19.00
Zinc 0.84 0.02 22/4/87 0.28 1.50 24(2/87 0,33
Sulphate 6 340 0.01 7/4/87 4 490 0.26 10/3/87 4 990
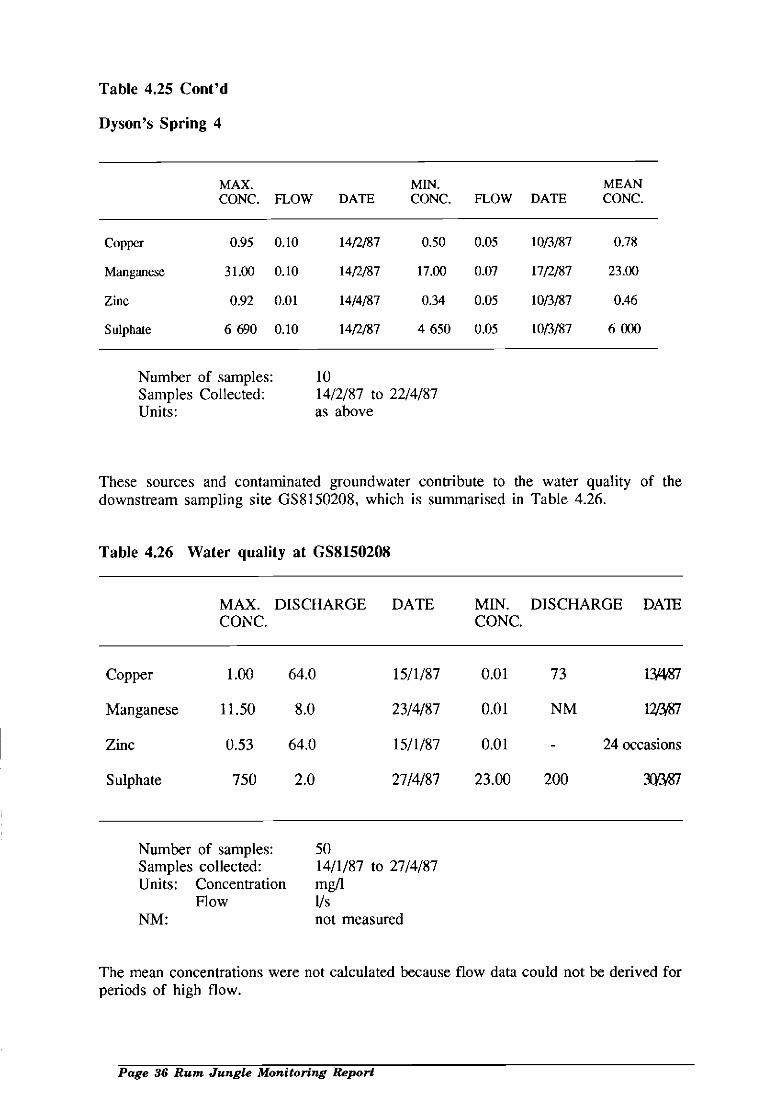
Table 4.25 Cont'd
Dyson's Spring 4
Number of samples:Samples collected:Units: Concentration
RowNM:
Page 36 Rum Jungle Monitoring Report
5014/1/87 to 27/4/87mg/i1/snot measured
The mean concentrations were not calculated because flow data could not be derived forperiods of high flow.
MAX.CONC. FLOW DATE
MIN.CONC. FLOW DATE
MEANCONC.
Copper 0.95 0.10 14/2/87 0.50 0.05 1013/87 0.78
Manganese 31.00 0.10 14/2/87 17.00 0.07 17/2/87 23.00
Zinc 0.92 0.01 14/4187 0.34 0.05 10/3/87 0.46
Sulphate 6 690 0.10 14/2/87 4 650 0.05 10/3/87 6 000
MAX.CONC.
DISCHARGE DATE MIN.CONC.
DISCHARGE DATh
Copper 1.00 64.0 15/1/87 0.01 73 13487
Manganese 11.50 8.0 23/4/87 0.01 NM 12t87
Zinc 0.53 64,0 15/1/87 0.01 - 24 occasions
Sulphate 750 2.0 27/4/87 23.00 200
Number of samples: 10Samples Collected: 14/2/87 to 22/4/87Units: as above
These sources and contaminated groundwater contribute to the water quality of thedownstream sampling site G58 150208, which is summarised in Table 4.26.
Table 4.26 Water quality at GSS1SO2O8

WANDERING CREEK
Wandering Creek flows from near the south west corner of White's Overburden Heapto its junction with the East Branch of the Finniss River. The junction is upstream ofthe road bridge and almost directly opposite the outflow from Intermediate Open Cut(Figure 4,1).
The 1985-86 study found that early in the wet season Wandering Creek carried highconcentrations of pollutants, but near the end of the wet season it was essentiallyunpolluted (Henkel & Alcock 1987).
Polluted water flows into Wandering Creek from two sources, White's and IntermediateOverburden Heaps. The creek is fed by three separate streamlets entering from asoutherly direction, Stream flow and analytical data were collected from nine sitescommencing on the 25th February 1987. The following conclusions were made:
White's Overburden Heap was the major contributor to the pollution of WanderingCreek, The flow volumes and concentrations of pollutants from this heap wereconsiderably greater than the pollutant concentrations and flow volumes fromIntermediate Overburden Heap. Water quality data from the output of White's andthe Intermediate Overburden Heaps (sample sites A and D) are given in Tables4.27 and 4.28 respectively.
The major source of pollutants from White's Overburden Heap is drain 9, (referlater section). The water quality from Drain 9 was similar to that at Point A. Onfour occasions both sites were sampled on the same day. The analyses are shownin Table 4.29.
Discharge from Wandering Creek can be a significant contributor to high early wetseason pollutant concentrations in the East Branch. The water quality data forsample location GS8150210 are shown in Table 4.30.
Three streamlets feed Wandering Creek from a southerly direction. The first ofthese is represented by sample Site B. The other two streamlets are unpolluted.The second of these, represented by sample location F. provides the greatest flowof water in Wandering Creek.
During flow recession, flow from White's Overburden Heap either ceases orinfiltrates the soil and does not reach Wandering Creek. Flow is maintained inWandering Creek mainly by the streamlet represented by sample site F. Pollutantconcentrations were low.
Pollutant loads transported in Wandering Creek were low. The calculated pollutantloads from Drain No. 9 are discussed in the next section.
It is recommended that the 1987-88 investigation be restricted to 058150210 andWhite's Overburden Heap Drain 9.
Rum Jungle Monitoring Report Page 37

Table 4.27 Water quality at Wandering Creek Site A
Number of samples: 5
Table 4.28 Water quality at Wandering Creek Drainage system Site D
Number of samples: 4
Table 4.29 Water quality at White's Overburden Heap Drain 9 and WanderingCreek Site A
Page 38 Rum Jungle Monitoring Report
CONCENI'RATION (mg/i)Maximum Minimum
CONCENTRATION (mgi!)Maximum Minimum
DRAIN NO. 9(mg/l)
SITE A(mg/i)
DATE Cu Mn Zn SO4 Cu Mn Zn 504
25/2/87 28 26 32 8250 24 18 30 6Y304/3/87 33 28 21 9 650 35 30 45 931)11/3/87 35 32 23 10 630 34 34 24 9HJ24/3/87 36 20 24 11 000 38 35 23 10410
CopperManganeseZincSulphate 12
476145600 6
241823
290
Copper 6.4 0.7Manganese 4.8 0.5Zinc 4.5 0.3Sulphate 1 250 525

Table 4.30 Water quality at Wandering Creek GS8150210
Number of samples: 44
WHITE'S OVERBURDEN HEAP SUBSOIL DRAINS
Prior to the rehabilitation of White's Overburden Heap, highly polluted water flowedfrom springs at its northeast and southwest base.
Part of the drainage design for the rehabilitated White's Overburden Heap included asubsoil drainage system constructed to intercept groundwater at the interface between theoriginal ground surface and the base of the heap.
The subsoil drainage system was located in areas where springs had previously beenobserved. A description of the design of the drainage system is given in Allen &Verhoeven (1986).
Nine seepage pits are located around White's Overburden Heap. The locations areshown in Figure 4.2. Only seven have drainage outlets. Flows were observed in fiveof the outlets during the wet season. Volumetric and water quality measurements weremade throughout the periods of flow. Volumetric flow measurement were made on adaily basis during the early flows and twice a week thereafter. pH, specificconductance, copper, manganese, zinc and sulphate concentrations were measured on aweekly basis. Pollutant loads were calculated using the following approach.
Recorded daily flows were plotted as a daily volume in cubic metres and a seasonalhydrograph was interpolated using the daily flow and the recorded daily rainfall atWhite's Overburden Heap pluviometer R815205. Daily and then weekly total flowvolumes were extracted from the resulting hydrograph.
The following observations were made:
The temperature of the water flowing from the drains was about 30° to 32° C.Early in the season the pH was about 3.5. The pH then fell to about 3.0 duringmid season flows.
Drains one, three and nine flowed for the longest period with one and ninecarrying the greatest flow volumes, Response to rainfall was typically 24 to 48hours, (Masters, pers. comm.).
CONCENTRATION (mg/I)MAXIMUM MIMMUM DISCHARGE WEIGHTED
MEAN
Rum Jungle Monitoring Report Page 39
Copper 8.5 0.01 11.16Manganese 2.6 0.01 0.48Zinc 3.3 0.01 0.61Sulphate 1 360 6.00 250

Pollutant concentrations in the water flowing from the drains were high.Generally the early wet season flows had lower pollutant concentrations. Onceflow was established pollutant concentrations became fairly constant.
Drains one and nine showed marked increases in zinc concentrations toward theend of the wet season. Maximum, minimum and mean discharge weightedpollutant concentrations for pollutants in all drains are shown in Table 4.31.
Drains one and nine carried the largest pollutant loads (Table 4.32). Drain nineis the major source of pollutants in Wandering Creek.
The White's Overburden Heap sub-soil drains contained high concentrations ofcopper, manganese, zinc and sulphate, but contributed only four, two, nine andtwo percent respectively of the total loads of those pollutants at GS8150097.
High concentrations of zinc were observed in the end of season flow in theDiversion Channel and from the Drains.
Table 4.31 Water Quality in White's Overburden Heap Subsoil Drains
IfflAIN 1
Page 40 Rum Jungle Monitoring Repon
MAX.CONC.
FLOW DATE MN. FLOW DATECONC.
MEANCONC.
Copper 53 0.12 17/3/87 16.0 0.01 22/1/87 33Manganese 47 0.01 24/4/87 3.0 0.01 22/1/87 20
23/1/87Zinc 190 0.04 14/4/87 6.1 0.01 22/1/87 45
0.01 22/4/870.01 24/4/87 2 640 0.01 22/1/87 1 140
Sulphate 18 070 0.04 14/4/87
Number of samples: 16Period of flow: 22/1/87 to 24/4/87.Units: Concentration mg/i
Discharge 1/s
DRAIN 2
MAX. FLOW DATE MN. FLOW DATE MEANCONC. CONC. CONC.
Copper 31 0.04 11/3/87 27 0.50 2512/87 28
Manganese 25 0.13 1312/87 10 0.06 6/2/87 19
Zinc 55 0.07 2112/87 13 0.06 6/2/87 42
Sulphate 12 600 0.04 1113/87 5 350 0.06 6/2/87 1 050
Number of samples: 7Period of flow: 6/2/87 to 11/3/87Units: as above

Table 4.31 Cont'd
DRAIN 3
Number of samples. 17Period of flow: 22/1/87 to 24/4/87Units: as above
Rum Jungle Monitoring Report Page 4!
MAX.CONC.
FLOW DATE MIN.CONC.
FLOW DATE MEANCONC.
Copper 39 0.01 22/1/87 25 0.10 2512/87 27
0.08 4/3/87
Manganese 30 0.05 1/4/87 II 0.16 11/3/87 23
0.02 14/4/87 0.01 22/1/87
Zinc 88 0.02 14/4/87 21 0.01 22/1/87 34
Sulphate 11 650 0.06 1713/87 15 700 0.01 22/1/87 9 700
Number of samples: 13Period of flow: 22/1/87 to 14/4/87Units: as above
DRAIN 6
MAX. FLOW DATE MIN. FLOW DATE MEANCONC. CONC. CONC.
Copper 48 0.07 13/2/87 29 0.00 7/2/87 39
Manganese 27 0.07 13/2/87 11 0.08 7/2/87 21
Zinc 36 0.07 13/2/87 22 0.08 7/2/87 44
Sulphate 10 600 0.07 13/2/87 6 600 0.08 7/2/87 8 600
Number of samples: 6Period of flow: 7/2/87 to 11/3/87Units: as above
DRAIN 9
MAX. FLOW DATE MIN. FLOW DATE MEANCONC. CONC. CONC.
Copper 53 0.12 1/4187 23 0.02 22/1/87 33
Manganese 54 0.02 24/4/87 18 0.02 22/1/87 28
Zinc 88 0.06 14/4/87 14 0.02 22/1/87 25
Sulphate 13 950 0.04 22/4/87 6 950 0.02 22/1/87 9 360

Table 4.32 White's Overburden Heap subsoil drains pollutant loads 1986-87
DRAIN VOLUME COPPER MANGANESE ZINC SULPHATENo. (m3) (kg) (kg) (kg) (tonnes)
TOTAL 6 400 200 150 240 67.0
The total volume of water that flowed from the drains was 6,400 m3. By comparison,the rainfall incident on the top of the overburden heap was approximately 230,000 m3,and that on the top and sides was approximately 350,000 m. The source of the waterflowing from the drains may be groundwater or rain water that has infiltrated the cover.
Three new holes were drilled into White's Overburden Heap during the 1987 dry season.More bores were also drilled in the White's Overburden Heap surrounds. Water levelstudies at these bores, lysimeter data, heap moisture profiles and toe drain water volumemeasurements will help to clarify the hydrodynamics and pollution process within theheap. This will aid the prediction of future groundwater and mine site pollution trends.
It was recommended that the program to determine the water quality and pollutant loadsin the water from White's Overburden Heap sub soil drains be continued in 1987-88,and that detailed groundwater level measurements be taken on and around the heap.
RUN-OFF FROM WHITE'S AND INTERMEDIATE OVERBURDEN HEAPS
Decreases in the early wet season pollutant concentrations and falls in seasonal pollutantloads since rehabilitation have been attributed in various degrees to the improved qualityof run-off water from White's and Intermediate Overburden Heaps. (Alcock & Johnston1985 Henkel & Alcock 1985). The heaps were previously identified as the majorcontributors to pollution of the East Branch through polluted run-off, seepage andpollution of groundwater.
The mn-off from White's Overburden Heap at GS8150205 was analysed on threeoccasions in January of 1987. The average water quality is shown in Table 4.33. Therun-off was unpolluted.
Page 42 Rum Jungle Monitoring Report
1 3150 95 65 190 36.02 520 15 10 22 5.53 450 12 10 16 4.46 260 10 6 13 2.29 2020 67 60 50 18.9

Table 4.33 Average water quality at GSS1SO2OS
pH
pH
SPEC IFIC CONDUCTANCE POLLUTANT CONCENTRATIONS (mg/I)(pS/cm) Cu Mn Zn SO1
5.4 62 0.04 0.04 0.04 20
Run-off from Intermediate Overburden Heap was analysed on two occasions in Januaryof 1987. The average water quality is shown in Table 4.34. The water was of goodquality.
Table 4.34 Average water quality of run-off from the Intermediate OverburdenHeap
SPECIFIC CONDUCTANCE POLLUTANT CONCENTRATIONS (mg/I)(pS/cm) Cu Mn Zn SO4
5.2 52 0.08 0.10 0.04 19
THE OPEN CUTS, THE DIVERSION CHANNEL AND WANDERING CREEK
INTRODUCTION
Low flows in the East Branch of the Finniss River bypass the open cuts and flowthrough the Diversion Channel. Higher flows are divided between the DiversionChannel and White's Open Cut. Low outflow from White's Open Cut follows CopperCreek to the East Branch of the Finniss River. Greater flows are divided betweenCopper Creek and the Intermediate Open Cut inflow. The Intermediate Open Cutoutflows to the East branch of the Finniss River directly opposite another source ofpollution, Wandering Creek (Figure 4.2). Water quality in the open cuts is discussedin Chapter Six. The Wandering Creek drainage system was discussed previously.
During the wet season, 33 grab samples and stream gaugings were taken at:
GS8 150209 at the top of the Diversion Channel;
GS8150210 (Wandering Creek);
Point 5 in the Diversion Channel above the junction with the IntermediateOpen Cut outflow and Wandering Creek; and
GS8150200 at the East Finniss River below the junction with Wandering Creekand the Intermediate Open Cut outflow.
In some instances, samples and gaugings were made at the inflow to the Open Cuts, theIntermediate Open Cut outflow and Copper Creek (the outflow from White's Open Cut).
Ruin Jungle Monitoring Report Page 43

The samples were taken consecutively to minimise the effects of changing flowconditions in an endeavour to provide an instant view of the mine site pollution regime.There is not necessarily any relationship between spot measurements of pollutantconcentrations and discharge at these locations with daily flow volumes and dischargebased daily concentrations and loads at GS8150097. The measurements give aqualitative picture of the seasonal variation of flow, pollutant concentrations and loadsfrom pollution sources on the mine site,
FLOW
The wet season flow data for locations G58150209, GS8150210, P'oint 5 and (iS8l50200are shown in Appendix A, Figure 4.31. The following observations are made:
A comparison of Figures 4.7 and 4.31 indicates that the wet season flowpattern at 0S8 150200 was similar to that at GS8 150097; and
Most of the water flowing by GS8150200 came from the Intermediate Open Cutoutflow. Stream gaugings at the inflow to White's Open Cut and at the topof the Diversion Channel at GS8150209 indicated that for 1986-87,approximately 90% of the annual flow was diverted through the Open Cuts.The open cut outflows were minor contributors to flow during low flow periodsin the early part of the wet season and during the flow recession.
POLLUTANT CONCENTRATIONS
The wet season pollutant concentration data for copper, manganese, zinc and sulphateare in Appendix A Figures 4.32 to 4.35. Sampling at point 5 did not commence untilday 62. Only four samples were taken from the Intermediate Open Cut outflow andWhite's outflow, and these were taken after the major flushing of the open cuts hadoccurred. The following observations are made:
Wandering Creek carried high concentrations of pollutants during the early partof the wet season. The principal source of pollution was White's Drain 9.Concentrations decreased as the wet season progressed;
Pollutant concentrations at 0S8150209 were high at the early low flows. Thiswas presumably due to dissolved salts from the creek bed and banks and theinfluence of polluted groundwater. Pollutant concentrations decreased rapidlyas flow increased and increased again during flow recession due to thecontribution of polluted groundwater;
Pollutant concentration at Point 5 were much higher than those at 0S8150209.The Diversion Channel is polluted through dissolution of salts, groundwater andseepage from the overburden heaps. Seepage from Intermediate OverburdenHeap was readily observed, and demonstrated by specific conductance surveysfrom GS8150200 to G58150209.
During flow recession, the pollutant concentrations at GS8 150200 were similarin magnitude to those at Point 5; and
Zinc concentrations increased significantly in the Diversion Channel as the riverneared cease to flow. This was consistent with the trend shown in the White'sOverburden Heap drains.
Page 44 Ruin Jungle Monitoring Report

POLLUTANT LOADS
The copper, manganese, zinc and sulphate loads measured at GS8150209, GS8150210,Point 5 and GS8 150200 and the loads calculated for the Diversion Channel (Point 5 -0S8150209) and the Tnterrnediate Open Cut outflow [GS8150200 - (Point 5 +
GS8150210)] are shown in Appendix A Figures 4.36 to 4.39 respectively.
Assurances that the load data were meaningful was provided in four instances wherepollutant concentrations and flow data existed for the Intermediate Open Cut outflowwater. Good agreement between the pollutant loads at GSS 150200 and the summationof the loads at GSS15O21O, Point 5 and the Intermediate Open Cut out-flow wasobtained. The following observations are made:
The seasonal pollution load patterns at GS8I 50200 were similar for copper,manganese, zinc and sulphate and followed the pattern of the season's flow;
The highest flow carried the highest loads at GS8150200;
For the greater part of the season the Intermediate Open Cut outflow was themajor contributor to pollutant loads at GS8150200; and
The load contribution from the Diversion Channel was predominant in early seasonlow flows and during flow recession.
The data is insufficient to warrant the calculation of seasonal loads transported via theOpen Cuts, the diversion Channel and Wandering Creek. Nevertheless, it seems clearthat in 1986-87 most of the pollutant loads appeared in the overflow from the OpenCuts. The question as to the source of the pollution should be addressed.
The East Finniss River flow to White's Open Cut carries only a small pollution load.The depth of water in White's Open Cut susceptible to flushing was thought to beapproximately 15 metres (Elenkel & Alcock 1987). which implied that the open cutsthemselves could only contribute small loads of pollutant metals to the East Branch.However, if high flows in the East Finniss River disturb water at greater depth, wherepollutant concentrations are much higher, White's Open Cut could be a significantsource of pollution to the East Branch. This possibility requires investigation in 1987-88, and it is recommended that the open cuts, in particular, White's are profiled at closeintervals before, during and after large flows from the East Finniss River.
In an endeavour to gain further quantitative knowledge of pollution sources it isrecommended that in 1987-88 more detailed studies of the sample locations GS8150210,GS8 150200, Point 5 the Intermediate Outflow and Copper Creek are made oversignificant flow events, preferably in conjunction with open cut profiles.
Rum Jungle Monitoring Report Page 45

4.4.2 1987-88
In 1987-88 a more detailed sampling programme enabled a better understanding of thevarious pollution sources and their contribution to the East Finniss River, and beyond,was made possible. Percentage contribution allocations were made possible by havingcollected enough data to use statistics.
It was found that the open cuts, and particularly White's were responsible for about halfof the dissolved pollution load at 038150097, other than zinc.
Most of the zinc pollution originated from the diversion channel between GS8150209and 038150211, and Wandering Creek, which receive groundwater and water fromsprings from White's Overburden Heap and groundwater from Intermediate OverburdenHeap. A schematic flow chart of the major sampling points is given in Figure 4.40,Figure 4.2 shows all mine site sampling locations.
8150214
OS8150210
DDAR95h
Page 46 Rum Jungle Monitoring Report
INTERMEDIATEOUTFLOW
L
8150212
Figure 4.40 Flow chart of Rum Jungle sampling locations
8150213
COPPERCREEK
WHITESINFLOW
OS8150215
OS8150204
VOS OS
OS8150097
OS8150200
OS8150211
OS8150209

Table 4.35 lists the gauging points and locations of the 1987-88 sampling programmefor the East Finniss River system including Wandering Creek and open cut inflow andoutflow sampling points.
Table 4.35 Gauging station locations
GS8150097 East Finniss River, downstream from mine
()S8150200 East Finniss River, downstream from road bridge
GS8150209 East Finniss River, start of diversion channel
GS8150210 Wandering Creek, above confluence with diversion channeldownstream from Intermediate 0/C outlet
GS815021 1 Diversion Channel, downstream from GS8 150209, upstream fromWandering Creek and Intermediate 0/C outflow
GS8 150212 Intermediate 0/C outflow
GS8150213 White's 0/C inflow
GS8150214 Copper Creek
MINE SITE POLLUTION LOADS
Table 4.36 lists calculated dissolved loads and flows. The results were obtained bycalculating the average daily flow weighted load and multiplying this average by thetotal days of flow.
Table 4.36 1987-88 mine site pollutant loads
Rum Jungle Monitoring Report Page 47
GS8150
DAYS OFFLOW
NO. OF % OF FLOWSAMPLES SAMPLED
FLOW(m3xl(Y)
Cu Mn Zn(tonnes)
SO,
200 140 38 27 3.04 2.80 2.91 1.78 811
209 115 32 28 1.21 0.31 0.23 0.23
210 110 32 29 0.32 0.39 0.18 0.28 99
211 126 35 28 1.22 .69 033 1.10 232
212 72 22 33 1.50 1.79 1.94 0.30 473
213 94 27 29 3.99 0.62 0.65 0.51 219
214 101 30 30 2.28 0 .93 1.81 0.28 353
097 141 141 100 6.32 3.23 5.39 2.00 1 )

VALIDITY CHECK FOR MINE SITE LOAD CALCULATIONS
By comparing the flows and loads of the various mine site sampling points, andinterpolating results obtained at 0S8150097. it was possible to verify sampling andanalytical methods.
For selected sampling points synthesized data was provided using calculated results fordays no samples where taken. Table 4.37 compares results obtained by East PointLaboratory and the Hydrographic section. East Point Laboratory results are used in thisreport for the calculations of load and flow distributions.
Table 4.37 Comparison of synthesized and calculated dissolved pollutant loads
Page 48 Rum Jungle Monitoring Report
Table 4.38 shows that the combined calculated flows and pollutant loads found atGS8150210, 0S8150211 and 0S8150212 are in good agreement with those found at0S8 150200.
The combined total flow and pollution load of GS8150200 and 058150214 should besimilar to that at 088150097. Adjustments for flow and sulphates entering the EastFinniss River beyond 088150214 were made, It was calculated that an additional flowof approximately 900 000 m3 entered the East Finniss River downstream of 088150214and 088150200. A concentration of 15 mg/I for sulphate has been assumed as typicalbackground concentration for the off mine site catchment area. Table 4.39 shows thata reasonable relationship exists between results obtained for these sampling points.
FLOW(m3xlO')
Cu Mn(tonnes)
Zn SO4
0S8150200 CALC. 3.04 2.80 2.91 1.78 8110S8150200 SYNT. 2.97 3.02 3.11 2.10 814
GS8150209 CALC. 1.21 0.31 0.23 0.23 96GS8150209 SYNT. 0.97 0.21 0.17 0.19 74
GS8150210 CALC. 0.31 0.39 0.18 0.28 99058150210 SYNT. 0.29 0.41 0.18 0.29 96
058150211 CALC. 1.22 0.69 0.73 1.10 232058150211 SYNT. 1.06 0.76 0.80 1.30 242
0S8150212 CALC. 1.50 1.79 1.94 0.29 473058150212 SYNT. 1.36 1.50 131 0.27 405
058150214 CALC. 2.28 0.93 1.81 0.28 353058150214 SYNT. 2.49 0.93 1.81 0.28 355

Table 4.38 Reconciliation of dissolved pollutant toads at GS8150200 with dissolvedpollutant loads found upstream
INDIVIDUAL MINE SITE POLLUTION SOURCES
This section deals with the pinpointing and assessing of the magnitude of mine sitepollution areas.
Results obtained at GS8150097 are an indication of the total dissolved load originatingfrom the mine site.
The next sampling point upstream from GS8150097 is GS8150214. It canies part ofthe flushings from White's Open Cut. The remainder of White's Open Cut flushingsdischarges into Intermediate Open Cut. White's Open Cut inflow water is measured atGS8150213.
GS8150213 measured about 75 percent of the water flowing from the Acid andSweetwater Dam area, which also drain the rehabilitated Dyson's sites. 658150209measured the remains water from upstream of White's Open Cut and the DiversionChannel. Approximately 83 percent of the flow measured at 058 150097 flowed through058150213 and 058150209.
Table 4.39 Reconciliation of combined dissolved minesite pollutant loads withdissolved pollutant loads found at GS8150097
Rum Jungle Monitoring Report Page 49
FLOW(m3x106)
Cu Mn(tonnes)
Zn SO,
058150214 2.28 0.93 1.81 0.28 3530S8150200 3.04 2.80 2.91 1.78 811EXTRA ROW 0.90 . 14
TOTAL 6.22 3.73 4.72 2.00 1178058150097 6.32 3.23 5.39 2.01 1 260
DIFFERENCE 0.10 0.50 0.67 0.01 82
FLOW(m3x 106)
Cu Mn Zn(tonnes)
SO4
GS8150210 0.31 0.39 0.18 0.28 99GS8150211 1.22 0.69 0.73 1.10 232058150212 1.50 1.79 1.94 0.30 473
TOTAL 3.03 2.87 2.85 1.68 804GS8150200 3.04 2.80 2.91 1.78 811
DIFFERENCE 0.01 0.07 0.06 0.10 7

The pollution input between 0S8150209 and 08150211 is thought to originate mainlyfrom groundwater input from White's and Intermediate Overburden Heaps, and wascalculated by deducting flows and pollutant loads found at GS8 150209 from those foundat GS815021 1. Table 4.40 shows the calculations.
Table 4.40 Pollutant input between GS8150209 and GS8150211
The combined total loads of 0S8150209 and GS8150213 constitute the pollutionoriginating from the Dyson's rehabilitation area, input from White's Overburden Heapfrom six subsoil drains, GS8150216 - GS8150221, and surface water run off.
Contributions from White's Overburden Heap to the East Finniss River above theDiversion Channel were calculated using the assumption that the water quality atGS8150209 should be similar to that measured at GS8150213. About 3.3 times morewater flowed through GS8150213 than through GS8150209. The loads found atGS8150213 were divided by a factor of 3.3 to calculate the expected load atGS8150209. Table 4.41 shows the total loads found at GS8150209 and GS8150213.Table 4.42 shows the total calculated and expected loads at GS8150209 and thecalculated pollution input from White's Overburden Heap to the East Finniss Riverabove the Diversion Channel.
Table 4.41 Combined total dissolved pollutant loads found at GS8150209 and
Page 50 Rum Jungle Monitoring Report
GS8150213
PLOW(m3x106)
Cu Mn(tonnes)
Zn 504
GS8150213GS8150209
3.991.20
.62
.31.65.23
.51
.2321996
TOTAL 5.19 .93 .88 .74 315
aow(m'x106)
Cu Mn Zn(tonnes)
so4
GS8150211 1,22 0.69 0.73 1.10 232GS8150209 1.20 0.31 0.23 .23 96
INPUT 0.02 0.38 0.50 0.87 136
as percentat 058150097 0.3 11.9 9.3 43.5 10.8

Table 4.42 White's Overburden Heap pollutant input above GS8150209
Pollution originating from Dyson's rehabilitation area can also be calculated by usingthe calculated loads at 058150209 and combining them with the loads from GS8150213.Table 4.43 shows the input from Dyson's area. No corrections were made for the inputof White's subsoil drains 058150216 to GS8150221, as they carried only small amountsof pollutants.
Table 4.43 Calculated dissolved loads from Dyson's Open Cut rehabilitation area
058150210 is at the confluence of Wandering Creek and the Diversion Channel.Pollution found here originates from Drain 058150222 and groundwater from White'sand Intermediate Overburden Heaps.
Pollution loads originating from White's and Intermediate Overburden Heaps can beestimated by combining the loads calculated for the input of White's Overburden Heapabove the Diversion Channel and the input of White's and Intermediate OverburdenHeaps to the Diversion Channel between GS8 150209 and 058150211 and 058150210.
Table 4.44 shows the loads at GS8150210 and the total calculated pollution loadestimated to have come from the White's and Intermediate Overburden Heap.
Rum Jungle Monitoring Report Page 51
ROW(m3x 106)
Cu Mn Zn(tonnes)
SO4
GS8150213 3.99 0.62 0.65 0.51 219058150209 CALCULATED 1.20 0.19 0.20 0.16 66
TOTAL 5.19 0.81 0.85 0.67 285
AS PERCENTAGE OFGS8150097 82.0 25.10 15.80 33.50 22.6
(tonnes)
TOTAL GS8150209 0.31 0.23 0.23 96CALCUL. 058150209 0.19 0.19 0.16 66
WHITE'S 0/B INPUT 0.12 0.04 0.07 30
Cu Mn Zn SO,

Table 4.44 Dissolved pollutant input from White's and Intermediate OverburdenHeaps
The most significant source of pollutants in the East Finniss River other than zinc arethe open cuts.
The treatment of White's Open Cut in 1985 with lime to a depth of approximately 22metres, established a layer of relatively unpolluted water over highly polluted water.An annual flushing process, achieved by re-diverting the East Finniss River through theopen cuts, affected the layer to an estimated depth of 30 metres. Profiling of White's
en Cut has revealed that some of the more polluted water may have been disturbedand mixed with water leaving White's Open Cut through Copper Creek and IntermediateOpen Cut.
Intermediate Open Cut was treated in total and, at present, is only a minor contributorto the pollution regime in the East Finniss River. Most of its pollution is carry overfrom the water it received from White's Open Cut. Some polluted groundwater inflowand the dissolving of sludge not removed from ledges and crevasses during the treatmentof the Tntermediate Open Cut may be contributing.
The loads thought to originate from the open cuts were calculated by deducting thecombined outflows from White's and Intermediate Open Cuts, 0S8150214 andGS8150212, from White's Open Cut inflow, 0S8150213.
Table 4.45 shows the loads coming from the open cuts and the percentage contributionto the total pollution load at GS8150097.
MINE SITE WATER QUALITY
Dissolved pollutant loads and concentrations measured at 0S8150200 and GS8150209to '214 are given in Appendix B Tables 4.46, 4.47 and 4.48 (a) to (g). White's andDyson Overburden Heap drains will be discussed later.
No comparison can be made between previous years and the 1987-88 data, as inprevious years insufficient data was collected.
Page 52 Rum Jungle Monitoring Report
Cu Mn(tonnes)
Zn SO4
0S8150210 0.39 0.18 0.28 99INPUT ABOVE GS8150209 0.13 0.04 0.07 30INPUT BETWEEN 058 150209& 058150210 0.38 0.50 0.87 137
TOTAL INPUT 0.90 0.72 1.22 266
AS PERCENTAGE OF GS8150097 28.10 13.40 61.00 21.0

Table 4.45 Dissolved Pollutant input from White's and Intermediate Open Cuts
WHITE'S OVERBURDEN HEAP SUBSOIL DRAINS
White's Overburden Heap has nine subsoil drains. Five flowed and are shown in Figure4.2.
The calculated flow volume was significanfly smaller for the 1987-88 season, as a resultof low rainfall experienced. Of the five subsoil drains, GS8150222 flowed longest,whilst GS8150221 flowed only for a very brief period and was excluded fromcalculations for loads. As for 1986-87, drain 088150222 remains the strongest flowing.
It was calculated that in 1987-88 a total of 2400m3 of polluted water seeped from thedrains, carrying 57 kg of copper, 57 kg of manganese, 56 kg of zinc and 23 tonnes ofsulphate, as compared to 6400m3 with 200 kg of copper, 150 kg of manganese, 240 kgof zinc and 67 tonnes of sulphate in 1986-87. Calculations of mean concentrations forcopper and zinc showed reductions compared with 1986-87, while manganese andsulphate mean concentrations were similar.
When considering the accepted theory that low flows are conducive to high pollutantconcentrations, significant improvement in water quality may have occurred at thissource.
Table 4.49 shows comparison of loads calculated for 1986-87 and 1987-88 andpercentage improvement for the 1987-88 season based on adjusted flow from 1986-87to 1987-88 season. Table 4.50 shows the water quality as measured for the five drainsas well as maximum and minimum concentrations measured in 1986-87 and 1987-88.Table 4.51 shows the loads calculated for White's Overburden Heap drains.
Rum Jungie Monitoring Report Page 53
FLOW(m3x10)
Cu Mn Zn(torines)
SO,
GS8150214, WHITE'S 0/C OUTFLOW 2.28 .93 1.81 .28 353058150212, INTERMEDIATE 0/C OUTFLOW 1.50 1.79 1.94 .30 473
TOTAL OPEN CUT OUTFLOW 4.03 2.72 3.75 .58 826- 088150213. WHITE'S 0/C INFLOW 3.99 0.62 0.65 .51 219
POLLUTION INPUT BY OPEN CUTS N/A 2.10 3.10 .07 607
AS PERCENTAGE OF 058150097 65.0 57.5 3.5 48.0

Table 4.49 Comparison of White's Overburden Heap subsoil drain's waterquality 1986/87 to 1987/88
SEASON FLOW COPPER MANGANESE ZINC SUUMATE(m3 (kg)
1986-87 6 400 200 150 240 67 0001987-88 2 350 57 57 56 23 000
198 7-88 ADJUSTED TO 1986-87 FLOW
6 400 160 150 150 62 000
% IMPROVEMENT 20 0 38 7
Page 54 Rum Jungle Monitoring Report
Table 4.50 White's Overburden Heap subsoil drains - pollutant concentrations
GS8 15 02 16
DATE FLOW pH SC Cu Mn Zn SO4(1/s) (ps/cm) (mg/i)
12-01-88 .004 3.4 2 900 9.5 4.5 7 2 10310-02-88 .011 3.2 7 000 17 14 14 61113
16-02-88 .438 3.5 10 000 18 23 28 6 103
23-02-88 .300 3.3 10 000 21 21 29 10 010
01-02-88 .250 3.1 12000 21 24 35 121110
07-03-88 .122 3.0 13 000 26 26 41 13 ff023-03-88 .056 2.9 16 000 33 33 54 17 ff028-03-88 .009 3.0 12 000 24 24 39 12 ff005-04-88 .032 2.8 15 000 29 31 52 17 ff1)
12-04-88 .011 2.8 16000 30 33 55 18013
Max 1987-88 33 33 55 18 010
Max 1986-87 53 47 190 180113
Mm 1987-88 9.5 4.5 7 2 1WMm 1986-87 16 3 6 2ffl3Mean 1987-88 12 15 23 7X0Mean 1986-87 33 20 45 11 010

Table 4.50 Cont'd
GS8150221
Rum Jungle Monitoring Report Page 55
16-02-88 .022 3.4 8 200 27 14 25 7 70023-02-88 .016 3.4 8 400 28 15 27 7 900
Max 1986-87 48 27 36 11 000Mm 1986-87 29 11 22 6 600Mean 1986-87 39 21 34 8 600
GS8150222
DATE FLOW pH SC Cu Mn Zn SO4(1/s) (ps/cm) (mg/I)
04-01-88 .093 3.2 11 000 37 35 27 12 00011-01-88 .061 3.1 12 000 42 38 30 13 00019-01-88 .056 3.1 12 000 37 37 28 12 00025-01-88 .072 3.1 12 000 35 36 27 12 00001-02-88 .130 3.1 13 000 44 38 31 14 00009-02-88 .073 3.1 12 000 40 36 29 13 00016-02-88 .316 3,2 8 800 25 26 17 8 10023-02-88 .200 3.1 9 800 28 29 20 9 10001-03-88 .156 3.0 10 000 30 31 22 10 00007-03-88 .109 3.0 11 000 35 33 23 11 00016-03-88 .058 3.0 12 000 40 36 26 13 00023-03-88 .039 3.0 12 000 39 35 25 12 00028-03-88 .039 3.0 11 000 34 32 23 11 00005-04-88 .200 3.1 9 600 27 27 17 8 90012-04-88 .112 3.0 11 000 30 30 20 10 00020-04-88 .055 3.0 12 000 37 32 24 12 00026-04-88 .044 3,0 12 000 37 33 25 12 00003-05-88 .020 3,0 12 000 39 33 25 13 000
Max 1987-88 44 38 31 13 000Max 1986-87 53 54 88 14 000Mm 1987-88 25 26 17 8 100Mm 1986-87 23 18 14 9 400Mean 1987-88 33 32 23 10 000Mean 1987-88 33 32 23 10 000Mean 1986-87 33 28 25 9 400
DATE FLOW pH SC Cu Mn Zn 504(L's) (ps/cm) (mg/i)

Table 4.50 Cont'd
GS8150217
Page 56 Rum Jungle Monitoring Report
10-02-88 .011 3.6 5 100 18 8.5 6.0 4 313
16-02-88 .048 3.2 9 600 29 23 29 9 010
23-02-88 .041 3.2 8 700 26 20 25 8 310
01-03-88 .020 3.1 11 000 27 27 36 1101)07-03-88 .004 3.2 11 000 26 27 36 11010
16-03-88 .002 3,7 12 000 22 29 35 12 01)
12-04-88 .001 3.6 11 000 22 27 28 11 010
Max 1987-88 29 29 36 120.13
Max 1986-87 31 25 55 13 011)
Mm 1987-88 18 8.5 25 4310Mm 1986-87 27 10 13 541)Mean 1987-88 26 23 29 9 310
Mean 1986-87 28 19 42 11 0113
GS8150218
DATE FLOW pH SC Cu Mn Zn 504(1/s) (ps/cm) (mg/i)
10-02-88 .057 3.5 2 100 4.0 4.0 4.5 1 310
16-02-88 .083 3.2 8 600 19 20 6.0 7 810
23-02-88 .104 3.1 8 700 18 19 9.0 8011)
01-03-88 .076 3.1 10 000 18 22 35 961007-03-88 .048 3.1 10 000 19 24 35 10010
16-03-88 .016 3.1 11 000 18 24 34 10010
23-03-88 .098 3.1 10 000 17 24 32 9 811)
28-03-88 .030 3.1 9 600 18 21 27 8 '110
05-04-88 .078 3.1 9 100 18 20 26 851012-04-88 .039 3.1 9 700 16 22 27 931020-04-88 .019 3.1 10000 16 23 28 9310
Max 1987-88 19 24 35 100113
Max 1986-87 39 30 88 16010
Mm 1987-88 4 3 4.5 1 310
Mm 1986-87 25 11 21 9X0Mean 1987-88 17 20 22 8310Mean 1986-87 27 23 34 120111)
DATE FLOW pH SC Cu Mn Zn SO4
(us) (ps/cm) (mg/i)

Table 4.51 White's Overburden Heap subsoil drain - pollutant loads
GSS1SO2I 6
Rum Jungle Monitoring Report Page 57
FLOW(I x 106)
Cu Mn(kg/d)
Zn SO4
12-01-88 .001 .01 <.01 .01 210-02-88 .001 .02 .01 .01 616-02-88 .038 .68 .87 1.10 37023-02-88 .026 .55 .55 .75 26001-02-88 .022 .46 .53 .77 26007-03-88 .011 .29 .29 .45 14023-03-88 .005 .17 .17 .27 8528-03-88 .001 .02 .02 .04 1205-04-88 .003 .09 .09 .16 5112-04-88 .001 .03 .03 .06 18
Calculated LoadFor Season .910 14.60 14.60 22.80 7 800
Days of Flow: 91
GS8150217
FLOW Cu Mn Zn SO4(1 x 10⁶) (kg/d)
10-02-88 .001 .02 .01 .07 4.216-02-88 .004 .12 .09 .12 3623-02-88 .004 .10 .08 .10 3301-03-88 .002 .05 .05 .07 2207-03-88 .001 .03 .03 .04 1116-03-88 .001 .02 .03 .04 1212-04-88 .001 .02 .03 .03 11
Calculated LoadFor Season (kg) .12 3.1 2.5 3.1 1 100
Days of Flow: 91

Table 4.51 Cont'd
* (3S8150221 flowed only briefly during the sampling period. Pollutant loads were notcalculated. Pollutants coming from this source are minimal and would not significantlyeffect calculations for the total loads at 0S8150097.
Page 58 Rum Jungle Monitoring Report
GS8150218
FLOW Cu Mn Zn SO4(1 x 10⁶) (kg/d)
10-02-88 .005 .02 .02 .02 6.516-02-88 .007 .13 .14 .04 5523-02-88 .009 .16 .17 .08 7201-03-88 .007 .13 .15 .25 6707-03-88 .004 .07 .10 .14 4016-03-88 .001 .02 .02 .03 1023-03-88 .008 .14 .19 .26 7828-03-88 .003 .05 .06 .08 2605-04-88 .007 .13 .14 .18 5912-04-88 .003 .05 .07 .08 2720-04-88 .002 .03 .05 .06 19
Calculated LoadFor Season (kg) .35 5.6 7.0 7.7 2 900
Days of flow: 70
GS8150221*
FLOW Cu Mn Zn SO4(1 x 10⁶) (kg/d)
16-02-88 .002 .05 .03 .05 1523-02-88 .001 .04 .02 .04 11

Table 4.51 Cont'd
GSS150222
Rum Jungle Monitoring Repon Page 59
FLOW(1 x 10⁶)
Cu Mn Zn(kgJd)
SO4
04-01-88 .008 .30 .28 .22 9611-01-88 .005 .21 .19 .15 6519-01-88 .005 .19 .19 .14 6025-01-88 .006 .21 .22 .16 7201-02-88 .011 .48 .42 .34 15009-02-88 .006 .24 .22 .17 7816-02-88 .027 .68 .70 .46 22023-02-88 .017 .48 .49 .34 15001-03-88 .013 .39 A0 .29 13007-03-88 .009 .32 .30 .21 9916-03-88 .005 .20 .18 .13 6523-03-88 .003 .12 .11 .08 3628-03-88 .003 .10 .10 .07 3305-04-88 .017 .46 .46 .29 15012-04-88 .010 .30 .30 .20 10020-04-88 .005 .19 .16 .12 6026-04-88 .004 .15 .13 .10 4803-05-88 .002 .08 .07 .05 26
Calculated LoadFor Season (kg) .97 33.9 32.6 23.0 11 000
Days of Flow: 121

DYSON'S OPEN CUT DRAIN GS8150215
Dyson's Open Cut Drain GS8150215 was sampled eight times during the 1987-88 sampling programme. Only copper and radium-226 were measured.
Data collected during the 1986-87 wet season indicated that the integrity of therehabilitation work may have been breached, as cracks and slumping were observed.It was calculated that for the 1986-87 season, 2300m of highly polluted watercarrying 670 kg of copper and 1,4 x 10 Bq radium-226 found its way into theEast Finniss River system. Tn terms of percentage contribution of the total loadmeasured at GS8l50097, this was 12 percent, and made Dyson's Open Cut area amajor source of pollution during the 1986-87 wet season.
During the 1987 dry season, Dyson's Open Cut was recontoured. Significantreductions in flow and copper concentrations were experienced in the 1987-88 wetseason. The reduction of flow and copper concentration were almost certainly theresult of the repairs carried out, and the poor wet season. Radium-226concentrations were similar for both wet seasons.
The data obtained are presented in Table 4.52 and the location is shown in Figure4.2.
Whilst eight samples may not provide sufficient data to engage in seriouscalculations, they give an indication of the magnitude of flow and copper andradium-226 originating from this source.
It was calculated that approximately 550m of polluted water were carried by thedrain, containing 11 kg of copper and 0.2 Bq x 106 of Ra-226.
Table 4.53 compares minimum and maximum concentrations of copper and radium-226 for the 1986-87 and the 1987-88 wet seasons.
4.52 Dyson's Open Cut drain GS8150215 water quality
Page 60 Rum Jungle Monitoring Report
DATE FLOW(1X10⁶/d)
pH SC(ps/cm)
Cu(mgIl)
Ra-226(Bq/l)
Cu(kgld)
Ra-226(Bq/d)
10-02-88 0.043 3.4 920 1.45 0.120 0.06 5 16017-02-88 0,002 2.8 7 000 26.00 0.860 0.05 1 72024-02-88 0.006 2.9 6 300 22.00 0.760 0.13 4 56009-03-88 0.004 2.8 9 500 48.00 0.770 0.19 3 08024-03-88 0.009 3.0 3 970 17.95 0.280 0.16 2 52031-03-88 0.002 3.2 2 800 10,20 0.210 0.02 42006-04-88 0.008 2.8 7 800 71.00 0.780 0.57 6 24012-04-88 0.003 2.8 9 300 83.00 0.680 0,25 2 040

Table 4.53 l)yson's Open Cut drain GS8150215 - 1986-87 and 1987-88pollutant concentrations
4.5 CONCLUSIONS AND RECOMMENDATIONS
4.5.1 CONCLUSIONS
TOTAL FLOWS
The total flow volume for the 1986-87 wet season at 058150097 on the East FinnissRiver was 13.2 x 10⁶ m3. This was similar to the total flow volumes of 1982-83, 1984-85 and 1985-86 (Section 4.3.4). Approximately half that flow was measured for the1987-88 season which represented the lowest seasonal flow volume recorded since theinception of monitoring.
POLLUTANT LOADS
Pollutant loads for 1986-87 at 058150097 were 5.6, 8.6, 2.7 and 2870 tonnes forcopper, manganese, zinc and sulphate respectively. Comparable loads for 1987-88 were3.2, 5.4, 2.0 and 1230 tonnes.
The agreement between the Commonwealth and NT Governments refer to a target loadreduction of 70% for copper, 56% for manganese and 70% for zinc in comparison withthe loads determined by the AAEC, based on the monitoring data obtained for the 1969-74 wet seasons.
In 1986-87 loads had reduced by 80% for copper and 60% for zinc, while themanganese load has not changed. The sulphate load increased by 140% in 1985-86 asa result of the rediversion of the East Finniss River through the Open Cuts. Thesulphate load decreased to be 40% above pre-rehabilitation levels in 1986-87. (Thesulphate load is expected to further decrease in the future as flushing of the Open Cutscontinues.)
By 1987-88 all load reduction targets had been met. The percentage reductions were90. 90 and 80 percent for dissolved copper, manganese and zinc. These percentages arebased on the loads expected for a similar flow during the 1969-74 seasons (Verhoeven,pers. comm.).
Based on a non-adjusted flow, the reductions of dissolved loads from 1969-74 to 1987-88 were 95% for copper, 90% for manganese, 90% for zinc and 85 % for sulphate.
Rum Jungle Monitoring Report Page 61
1986-87 780 110 290 670 0.74 0.59 0.62 1.41987-88 83 2 35 11 0.86 0.12 0.55 0.2
Copper Radium-226Year Max Mm Mean Load Max Mm Mean Load
(mg/i) (kg) (Bq/1) (BqxlO') (kg)

Decrease of dissolved loads in 1987-88 as compared with those in 1986-87 should beviewed in light of the greatly reduced total flow.
RADIUM-226
Radium-226 concentrations and loads at GS8150097 in 1986-87 were similar to thoseof 1985-86. On five early wet season low flow days the discharge based dailycomposite gave radium-226 concentrations slightly greater than the drinking-watercriterion of 0.4 Bq/l. The maximum concentration recorded was 0.6lBq/l (Section3.4.7).
The levels of radium-226 reduced significantly, however, in 1987 to less than half ofthose experienced in the previous season. The maximum level recorded was 0.09 Bq/l.The total Ra-226 load for the 1987-88 wet season was 350 x 10' Bq as compared with800 x 106 Bq in 1986-87.
MAXIMUM DAILY POLLUTANT CONCENTRATIONS
Prior to rehabilitation, maximum daily concentrations were 182 mg/l for copper, 13mg/l for manganese, 3.7 mg/l for zinc and 1290 mg/I for sulphate.
The maximum daily concentrations for copper, manganese, zinc and sulphate atGS8150097 for the 1987-88 season were 4.4, 4.0, 6.9 and 950 mg/I and for the 1986-87 season 3.4, 3.7, 3.5 and 600 mg/I respectively. Whilst the maxima represent a slightincrease over those found for the 1986-87 season, all high concentrations were measuredat the start of the wet season at very low flows.
Early wet season water quality at GS8I 50097 is highly dependent on the rainfall patternand resultant flows. In 1987-88, the first 26 days of flow through 0S8150097 camemainly from water which flowed through the Diversion Channel. The high valuesobtained during this period were the result of the dissolution of residual salts from theprevious season and the rising of the polluted groundwater table.
As with previous wet seasons the highest concentrations occurred at lowest flows.Consequently, these high concentrations mean low loads.
DYSON'S OPEN CUT
Tailings and Copper Creek materials were buried in Dyson's Open Cut which producessmall volumes of seepage containing concentrations of copper and radium-226.
During the 1987-88 season an estimated 560 m3 of polluted water with a maximumconcentration of 83 mg/l copper and 0.86 Bq/l radium-226 flowed from Dyson's DrainGS8150215 as compared to 1600 m3 of water with a maximum of 780 mg/l copper and0.74 Bq/l of radium-226 in 1986-87. The load reduced from 640 kg copper and 1.0Bq X 106 radium-226 in 1986-87, to 11 kg copper and 0.2 Bq X 106 Ra-226 in 1987-88.
Page 62 Rum Jungle Monitoring Report

Dyson's Overburden Heap pollutes the East Branch of the Finniss River via springs atits base. The dominant pollutant is manganese (maximum recorded concentration in1986-87 was 43 mg/i). Dyson's, however, is only a minor contributor to the pollutionof the East Finniss River.
WHITE'S OVERBURDEN HEAP
White's Overburden Heap has seven subsoil drains. Five flowed during the past twoyears (1986-87 to 1987-88). The flows in the drains were characterized by highpollutant concentrations and low flow volumes. The water quality was similar to thatof the last three seasons. During 1987-88 approximately 1500 m3 of water from thedrains carried 45 kg of copper, 45 kg of manganese, 35 kg of zinc and 16 tonnes ofsulphate, as compared to 1986-87, when 6400 m3 of water carried 200 kg of copper,150 kg of manganese, 240 kg of zinc and 67 tonnes of sulphate.
This source of pollution could be either shallow groundwater entering from the southor minor infiltration of rainwater through the cover.
The drains were only minor contributors to the total dissolved loads at 0S8 150097.The percentage of loads contribution by the drains during the 1987-88 season to thetotal dissolved loads measured at 0S8150097 were, 1.4% copper, 0.8% manganese,1.8% zinc and 1.3% sulphate. This was lower than the 4% copper, 2% manganese,9% zinc and the 2% sulphate found during the 1986-87 wet season. This reductioncould be attributed to both the success of the rehabilitation works and the differencein seasonal rainfall.
POLLUTANT SOURCES
In 1987-88 the sampling program was extended in order to pinpoint the locations ofpollution input to the East Finniss River and allocate percentages of pollution loadscontributed to the total dissolved pollution load in the East Finniss River at GS8150097.This confirmed the opinions expressed in the 1986-87 report, i.e. that the open cuts werethe major contributors. Approximate percentage contributions of the mine site samplingpoints are shown in Table 4.54.
Table 4.54 Mine Site Contribution Of Dissolved Pollutants to GS8150097
Units: Percent
Rum Jungle Monitoring Report Page 63
Open Cuts 65.0 58.0 3 48.0GS8150210 4.9 12.0 3.3 14 7.90S8150213 63.0 19.0 12.0 26 18.06S8150209 19.0 9.7 4.3 12 7.6Diversion Channelbetween GS8150209and 0S8150211 - 12.0 9.3 43 11.0
LOADArea flow Cu Mn Zn SO4

Two different methods of synthesizing missing data were used to compare the minesiteloads with the total loads at GS8150097.
The first method was to obtain a flow weighted daily average for the various samplingpoints and multiply these averages by the days of flow. As a validity check, flows andconcentrations were synthesized for days no sampling was done.
The results of the two methods were in approximate agreement and in reasonableagreement with the results obtained at GSS 150097.
The figures obtained by the first method are used throughout this report.
FINNISS RIVER WATER QUALITY
The minor fish kills noted in the past in the Finniss River should be diminishing withthe lowering of dissolved heavy metals in general and of copper in particular.
The maximum soluble concentrations of heavy metals found in the Finniss River at0S8150204 were lower for the 1987-88 wet season than previously. Copper was 0.22mg/l, manganese, 0.80 mg/l and zinc, 0.31 mg/I, as compared to 1986-87, when themaximum soluble concentrations were 0.85 mg/I for copper, 0.80 mg/I manganese and0.50 mg/I zinc. The sulphate concentrations were similar for 1986-87 and 1987-88being 140 and 150 mg/i respectively.
The maximum total concentrations, consisting of dissolved and particulate heavy metals,were erratic. For manganese, a reduction from a maximum of 0.921 mg/I in 1986-87to 0.64 mg/I in 1987-88 was experienced. The maximum total copper concentrationchanged from 0.95 to 1.14 mg/i and the zinc from 0.53 to 0.09 mg/l.
As with the previous season, the highest concentrations coincided with the initial lowflow of water from the open cuts.
Firm reasons cannot be determined for the difference in results of total and dissolvedconcentrations in 1985-86, 1986-87 and 1987-88, other than the differences in flowpatterns and rainfall over the catchment area. This particularity applies to the 1987-88 season when rainfalls were highly localised,
An above average wet season is needed to test the integrity of the rehabilitated areas.
4.5.2 Recommendations
It is recommended that:
The sampling programme at 0S8 150097 on the East Finniss River bemaintained.
The sampling programme at GS8150204 on the Finniss River below theconfluence with the East Finniss River be maintained.
Page 64 Rum Jungle Monitoring Report
Monitoring of the Open Cuts be intensified and modified to determine the extentto which flushing occurs in White's Open Cut, and whether pollutants are beingtransfered from the untreated water to the East Branch of the Finniss River.
The on-site monitoring programme be revised, consistent with logistic andeconomic constraints, to determine the proportion of pollutant loads transportedvia the Open Cuts, the Diversion Channel and Wandering Creek.
Monitoring of White's Overburden Heap sub-soil drains continue.
The seepage from Dyson's Open Cut be monitored, particularly for copper andradium.
Monitoring of ground-water levels and water quality continue.
Monitoring of the Overburden Heap covers and the physical and chemicalconditions within the heaps be continued through the agency of the AustralianNuclear Science and Technology Organisation,
Rum Jungle Monitoring Report Page 65
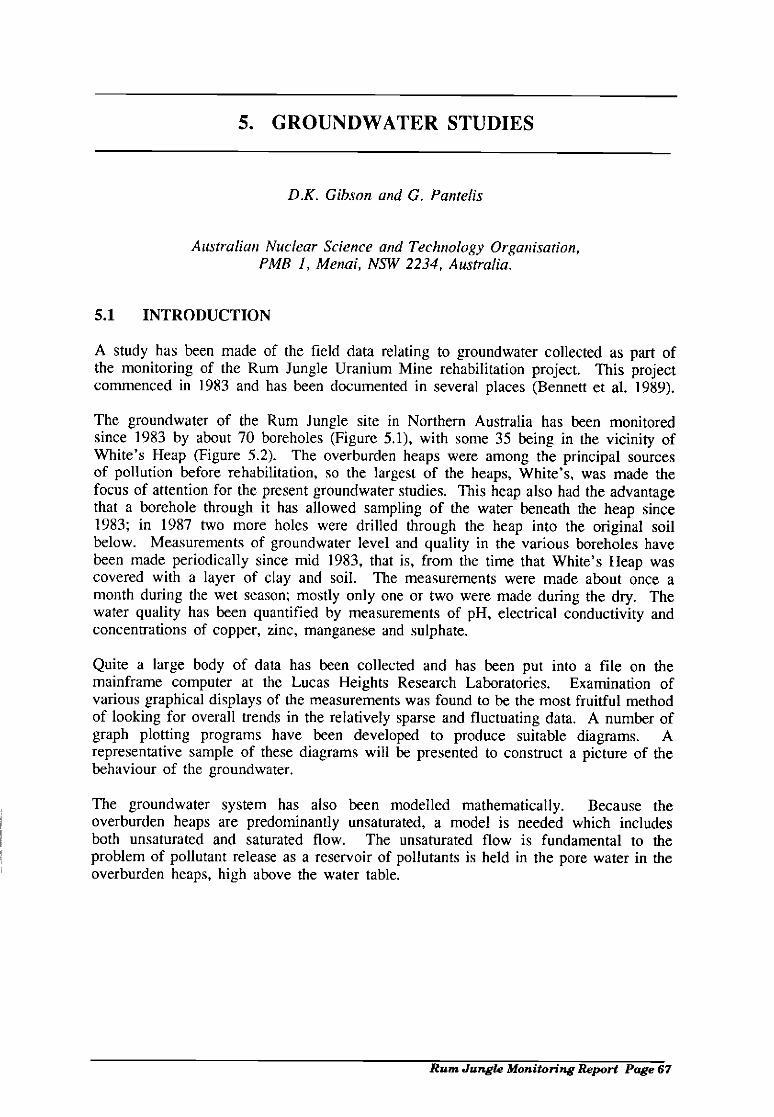
S. GROUNDWATER STUDIES
D.K. Gibson and G. Pantelis
Australian Nuclear Science and Technology Organisation,PMB 1, Menai, NSW 2234, Australia.
5.1 INTRODUCTION
A study has been made of the field data relating to groundwater collected as part ofthe monitoring of the Rum Jungle Uranium Mine rehabilitation project. This projectcommenced in 1983 and has been documented in several places (Bennett et al. 1989).
The groundwater of the Rum Jungle site in Northern Australia has been monitoredsince 1983 by about 70 boreholes (Figure 5,1), with some 35 being in the vicinity ofWhite's Heap (Figure 5.2). The overburden heaps were among the principal sourcesof pollution before rehabilitation, so the largest of the heaps, White's, was made thefocus of attention for the present groundwater studies. This heap also had the advantagethat a borehole through it has allowed sampling of the water beneath the heap since1983; in 1987 two more holes were drilled through the heap into the original soilbelow. Measurements of groundwater level and quality in the various boreholes havebeen made periodically since mid 1983, that is, from the time that White's Heap wascovered with a layer of clay and soil. The measurements were made about once amonth during the wet season; mostly only one or two were made during the dry. Thewater quality has been quantified by measurements of pH, electrical conductivity andconcentrations of copper, zinc, manganese and sulphate.
Quite a large body of data has been collected and has been put into a file on themainframe computer at the Lucas Heights Research Laboratories. Examination ofvarious graphical displays of the measurements was found to be the most fruitful methodof looking for overall trends in the relatively sparse and fluctuating data. A number ofgraph plotting programs have been developed to produce suitable diagrams. Arepresentative sample of these diagrams will be presented to construct a picture of thebehaviour of the groundwater.
The groundwater system has also been modelled mathematically. Because theoverburden heaps are predominantly unsaturated, a model is needed which includesboth unsaturated and saturated flow. The unsaturated flow is fundamental to theproblem of pollutant release as a reservoir of pollutants is held in the pore water in theoverburden heaps, high above the water table.
Rum Jungle Monitoring Report Page 67

Page 68 Rum Jungle Monitoring Report
Figure 5.1 Map of region showing locations of all boreholes. The circlesrepresent the sulphate concentrations measured during October 1987(circle area is proportional to the concentration), The concentriccircles represent sampling at two depths from one borehole.

0221
.25171..1
02203S .25169
'25
22037'25r73 .25
235084
'25164
o 25165
.25t
22083'22414
.221.13
22 12
Figure 5.2 Map of White's Heap and environs showing locations anddesignations of boreholes.
Ruin Jungle Monitoring Report Page 69

5.2 EXAMINATION OF FIELD DATA
5.2.1 PLAN VIEW OF CONTAMINANT CONCENTRATIONS
The measurements are too sparse to permit the generation of meaningful contour mapsof contaminant concentrations at specific times. However, if circles are drawn on a mapof the site at the positions of the boreholes, and the area of each circle is madeproportional to the concentration of a particular contaminant measured on a particulardate, a good overview of the contaminant concentration distribution on that date is
obtained. The distributions of sulphate, copper and manganese are shown by thismethod in Figures 5.1, 5.3 and 5.4. These diagrams are for measurements made in late1987 because this is the only time that measurements are available for more than oneborehole beneath White's Heap. Apart from this, they are typical of measurementsmade at other times. It is clearly seen that the pollution levels of the groundwater inthe vicinity of the overburden heaps are markedly higher than the average. In view ofthe work carried out before rehabilitation, when the overburden heaps were identifiedas major sources of pollution, this is no surprise. However, it shows that there is astrong localisation of pollutants beneath the heap even after five years of reducedcontaminant production following the capping of the heap. Measurements of copperconcentration at February 1986, the end of the wet season, shows that the groundwaterin the vicinity of the former spring sites, on the south-east and north-west of the heap,contains more than average contaminant (Figure 5,5). This reflects the predominantdrainage pattern of the area, in which water entering the region below the heap fromhigher ground to the south tends to leave by the small gullies in the original groundsurface which used to feed the springs.
Figure 5.1 shows that the water quality in the distant, or regional, boreholes has beenunaffected by the mining, when it is understood that the smallest circles on the diagramcorrespond to sulphate concentrations of around 20 mgfl. This level can be expectedto occur naturally in this region; for example, levels fluctuating about 20 mgfl havebeen measured in the East Branch of the Finniss River upstream of the mine site.
5.2.2 SEASONAL VARIATION IN WATER HEIGHT
Borehole RN22084, situated on the south-west side of White's Heap, has been used asa reference for the comparison of the seasonal rise and fall of groundwater levels, forno other reason than it has a fairly complete set of measurements. It is a deep borehole(I 8m) and is sealed at nine metres to exclude water from above this level. During thewet season, when the water table is high, its behaviour is very similar to that of anearby very shallow hole. RN23514, which was dug by auger to a depth of two metreswhere weathered granite was struck (Figure 5.6). The seven low water levels recordedin the shallow hole should be viewed sceptically, as they correspond to times when thehole was almost completely dry. In other words, if this hole had been 1.5m deeper thevariation in water level would have followed that of the deeper hole. Therefore, itwould seem that the two boreholes are in fact sampling the same aquifer, or aquifersthat are closely connected. The water level rises and falls past the weathered graniteboundary without interruption, implying that the hydraulic conductivity of at least thetop layer of this material does not differ markedly from that of the overlying soil.
Page 70 Rum JungLe Monitoring Report

Figure 5.3 Copper concentrations in groundwater at various boreholes,measured September 1987 (circle area is proportional to theconcentration). The maximum concentration is 64 mg/I. Theconcentric circles represent sampling at two depths from oneborehole.
Runs Jungle Monitoring Report Page 71

Figure 5.4 Manganese concentrations in groundwater at various boreholes,measured October 1987 (circle area is proportional to theconcentration). The maximum concentration is 223 mg/I. Theconcentric circles represent sampling at two depths from oneborehole.
Page 72 Rum Jungle Monitoring Repofl

Rum Jungle Monitoring Report Page 73
Figure 5.5 Copper concentrations in groundwater at various boreholes, measuredFebruary 1987 (circle area is proportional to the concentration). Themaximum concentration is 76 mg/i.

B9jJ
Page 74 Rum Jungle Monitoring Report
Year
Figure 5.6 Comparison of water levels in deep and shallow boreholes closetogether on southwest edge of White's Heap.
RN2?08's CD) RN123514 (5)
83 84 87 88

Further evidence is gained from a pair of monitoring holes which were installed in oneborehole drilled through the heap (RN22082). The liner of one hole passes through acement plug some 15m below the original ground surface and proceeds on for a further18m. The other hole penetrates 8.5m below the original ground surface. Figure 5.7shows that the water levels of these two holes follow the same seasonal pattern, againindicating that the aquifers are closely connected. A third example is shown in Figure5.8 where the deep reference borehole is compared with another deep hole, but one thatis not sealed off from any shallow aquifer. The argument based on Figure 5.6 is againsupported, but without the complication of a very shallow borehole.
As the water table varies seasonally from one to three metres below the ground surfaceit is inferred that the surface aquifer must be at least three metres thick. Borehole logsshow that this aquifer is composed of sandy, gravelly soil lying on top of weatheredgranite. We have already shown that the boundary between these is rather indistinctfrom a hydrological point of view. The two metre seasonal rise and fall in the watertable corresponds reasonably well with a rainfall of about 1. lm recorded over the lastfew years, an infiltration coefficient of 0.5 and a porosity of 0.3 (Sz = 1.1 x 0.5/0.3 =1.8).
In Figure 5.9 the water levels below the heap are compared with the levels in thereference hole. The level of the water below the dump is higher than that in thereference borehole because it lies higher on the original ridge and is recharged fromthe higher ground to the south. The region around the reference hole will be rechargedfrom local rainfall infiltration and seepage from higher ground, both from under andoutside the heap. It is apparent that the rise and fall of the level below the heap lagsbehind the reference hole by about three months. As the infiltration through the cappedheap has been reduced to five per cent, the only significant recharge for the groundwaterbelow the dump comes from nearly horizontal flow and therefore a time delay is to beexpected. However, it is somewhat surprising that the water table under the heap, ona ridge in the underlying ground, has a full two metres seasonal variation. It seems thatthe catchment area outside the heap that contributes to the influx of water must be largecompared with the area lost through shielding by the heap. The close connectionbetween the deep and shallow water movements may play a part in this process, withwater being forced upwards during the wet season recharge.
5.2.3 SEASON VARIATION OF GROUNDWATER QUALITY
For further inferences about water movement we must look at the groundwater qualitydata. In Figure 5.lOa the zinc concentrations in the two boreholes below White's Heapare compared; Figure 5.lOb is a similar plot for sulphate. The concentrations in thedeeper level do not vary greatly with season. They show some indication of an initialimprovement in water quality in the first year or so after rehabilitation. The situationis reversed in the upper level, where there is strong seasonal oscillation of concentrationbut no evidence of a long term change. Figure 5.11 shows the contaminantconcentration in the shallow hole falls as the water levels rises and vice versa..Therefore the rise in water level must be due to an influx of relatively pure water,causing apparent dilution of the contaminated water. If the water rise was caused bya pressure induced rise in the water already under the heap this dilution could not occur.
Rum Jungle Monitoring Report Page 75

71.5
71.0
69.5
69.0
. 5
83
Figure 5.7
Page 76 Rum Jungle Monitoring Report
Year
Comparison of water levels in deep and shallow boreholes at samepoint beneath White's Heap.
RN22082 (5) 19N?208? (0)
70.5
0
ff 70.0
81. 85 87

69
68
67
0
C0J4-0n
57
56 4
IT
11111 lilt I83 84 85 85 67
Year
Figure 5.8 Comparison of water levels north of White's Heap withreference borehole.
Rum Jungle Monitoring Report Page 77
F9N22084 ID) F9N22 108

Page 78 Rum Jungle Monitoring Report
71.0
70.0
C
6a0U,
0,
67J
RN2208L+ ID) RN22082 (5)
83 81$ 87
Year
Figure 5.9 Comparison of water levels beneath White's Heap with referenceborehole.
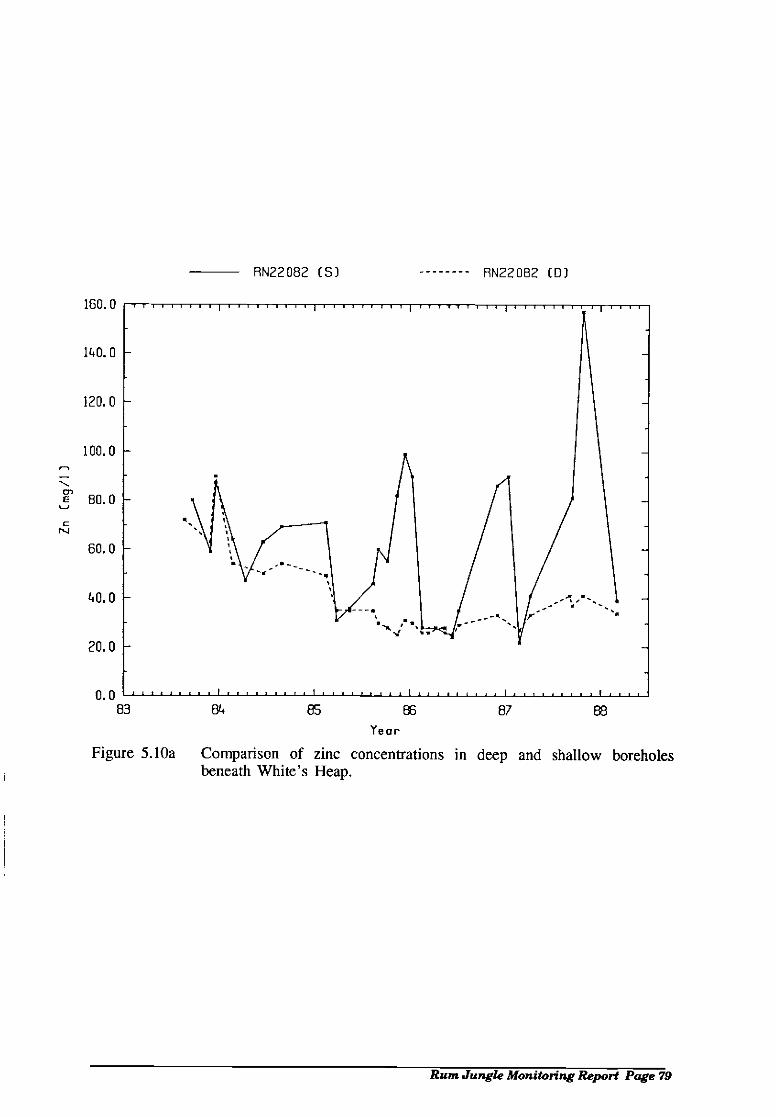
160.0
1t40. 0
120.0
100.0
80.0
CNJ
60.0
20.0
0.083 84 85
Year
Figure 5.lOa Comparison of zinc concentrations in deep and shallow boreholesbeneath White's Heap.
87
Rum Jungle Monitoring Report Page 79
RN22082 (5) 19N22082 ID)
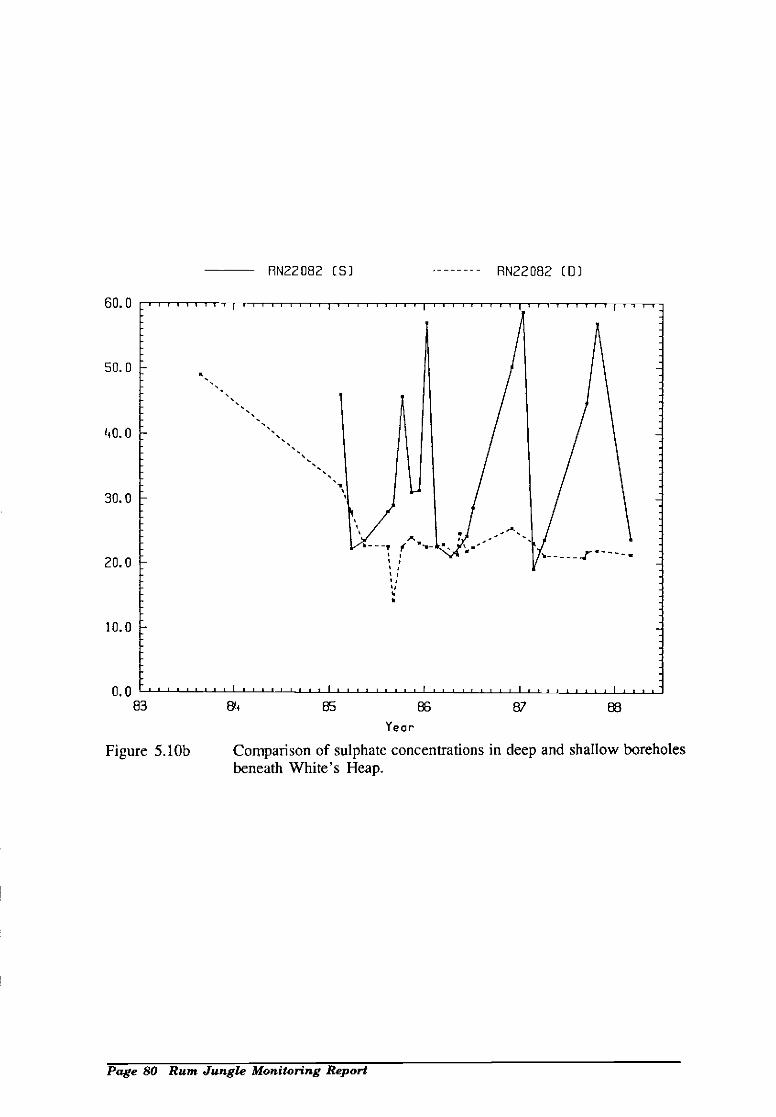
60.0
50. 0
t10.0
30.0
20.0
10.0
0.0
Page 80 Rum Jungle Monitoring Report
19N22082 IS) RN22082 [Ii)
83 814 65 87
Year
Figure 5.lOb Comparison of sulphate concentrations in deep and shallow boreholesbeneath White's Heap.

71.0
70.6
69.0
68.6
Figure 5.11
40.O
30.0
20.0
10.0
YearData from shallow borehole beneath White's Heap (RN220W2) showingthe out of phase relationship between water level (solid) and copperconcentration.
Rum Jungle Monitoring Repon Page 81
85 87

We have referred to an apparent dilution, as it appears that there is little mixing of thesurface water with that lying below except during the sampling procedure. The evidenceof the lack of mixing comes from the observation that the concentration returns to itsoriginal value as the water level falls during the dry season. The measuredcontamination levels are weighted means of those of the two water bodies Likewise,the water sampled from the deep bore under the heap is probably a mixture ofcontaminated water lying below the heap and an input from a very deep aquifer (about30m depth) noted as a plentiful source of water at the time of drilling. At present itcan only be seen as a coincidence that the contaminant concentrations in the lowerborehole are very similar to those in the upper hole each wet season. The fact that thedeep groundwater has been contaminated by the overburden heap again shows that thetwo aquifers are not isolated from one another.
The concentration of sulphate in a borehole downslope of the heap is plotted againsttime in Figure 5.11. The Figure shows that the average concentration if anything hastended to increase over the five year period that has elapsed since rehabilitation of theheap. Clearly there has not yet been any reduction in pollution levels of thegroundwater in response to the rehabilitation. Hence the field data support the resultsof modelling in that the timescale for significant changes to the groundwater quality willprobably be long compared with this period (Gibson & Pantelis 1988).
5.3. MATHEMATICAL MODELLING
5.3.1 MATHEMATICAL BASIS
The horizontal extent of the aquifer at the Rum Jungle site is very large compared tothe vertical distance between its highest and lowest points. Also we are interested inthe long term movement of water through the system. The asymptotic approximationmodel, which describes the saturated-unsaturated flow in gently sloping, thin unconfinedaquifers over a long time span (Pantelis 1987), is therefore well suited for a study ofthe site. The model gives sufficiently accurate details while considerably reducing thecomputational effort required and is relatively easy to set up even for complicatedgeometries. The water movement can be described by a three-dimensional specificdischarge field, which can also be used to calculate the flow paths and travel times ofcontaminants.
Let D be the vertical distance containing the aquifer system, L be its horizontal extentand K, the representative saturated hydraulic conductivity of the aquifer system. Ananalysis of the order of magnitudes of the various terms in the equations shows that thecharacteristic timescale for vertical mass transport over the aquifer's vertical length scale,D, is of the order of L2/(DK5). This is the same as the characteristic timescale forhorizontal mass transport over the horizontal length scale L. The vertical timescale isgoverned by the slow unsaturated flow, predominantly vertical, through the small heightof the heap, D, whereas horizontally the flow is almost entirely via faster saturated flow,but the distance, L, that must be traversed is much greater.
Page 82 Rum Jungle Monitoring Report

5.3.2 COMPUTER MODEL
Simulations were carried out over a region of approximately one square kilometre whichincludes White's and Intermediate Overburden Heaps. Although the model can beextended to deal with a layered and heterogeneous aquifer system (Pantelis 1988b) thelack of hydrogeological data requires that some simplification be made. Therefore theoverburden heaps and the underlying shallow aquifer are treated as a single unconfinedaquifer. Data for the ground surface height were obtained from local survey maps. Thecontours of the lower impermeable bed of the aquifer was derived from the sparsegeological data from the borehole logs and the few simple pump down and slug testsmade at the site.
The pressure head was computed from a finite difference scheme of the water transportequation. Tracer flow paths emanating from several selected points near the uppersurface of the heaps were obtained using the pressure heads to compute the interstitialvelocities (Pantelis 1988a, b).
5.3.3 RESULTS OF SIMULATION AND DISCUSSION
The computations were carried out over a simulation time of several years for twocases. In the first simulation there was normal infiltration of rain into the overburdenheaps but for the second the infiltration into the heaps was restricted, as by clay covers.Before rehabilitation the infiltration rates were estimated by measurements of rainfall,runoff and evaporation to be about 0.5. After rehabilitation lysimeter measurementsshowed that the infiltration had been reduced to less than 0.05 by the clay covering (seeChapter 7). The values of 0.5 and 0.05 were therefore used for the pre and post-rehabilitation infiltration rates in the calculations. The rainfall rates were the averageof the mean monthly falls of the last 20 years.
The pressure heads and total horizontal discharges before and after rehabilitation, andat two seasonal extremes, are shown in Figures 5.13 to 5.16. The heads and flowdirections are significantly changed by the rehabilitation. The heads largely appear tofollow the contours of the original ground surface but are slightly perturbed below theheaps. There is no evidence of a water table mound developing below the heaps as wassuggested by Salama (1986). However, other simulations using larger recharge rates doshow evidence of mounds developing under the heaps.
Figure 5,17 shows flow paths which would be followed by conservative tracers startingfrom near the tops of two heaps, for the pre and post-rehabilitation regimes. The flowpaths are terminated when they intersect the ground surface; at this point the water istransported by surface flow and the tracer enters the river system either directly or byoverland flow from a spring. The tracer depths at regular intervals are shown in metresA.H.D. (Australian Height Datum). Arrow heads appear at yearly intervals along theflow paths. It can be seen that the longest flow path from White's heap to the nearestwaterway is about five years before rehabilitation and 15 years after rehabilitation, Ifwe assume that the oxidation of pyrite ceased immediately after the placing of the claycovers, so the only contaminants to be considered are those stored in the unsaturatedand saturated zones of the heaps, then
Rum Jungle Monitoring Report Page 83

Sul
phat
e (g
/LJ
6. 0
5. 0
L40
3.0
2.0
1.0
0.0
19N22037 [U)
Page 84 Rum Jungle Monitoring Report
83 8L. 85 87
Ye or
Figure 5.12 Seasonal variation of sulphate concentration at RN22037 to the north-west of White's Heap.

65
62
U
(12
N 65
67'.
70
0
67
(a) End of wet season
(b) End of dry season
Figure 5.13 Pre-rehabiitation pressure head contours (one metre interval) shownon contour map of environs of White's and Intermediate Heaps (fivemetre contour interval, dashed).
Rum Jungle MonitoHng Report Page 85
71
755
74

wcL
End of wet season
End of dry season
Figure 5.14 Post-rehabilitation pressure head contours (one metre interval) shownon contour map of environs of White's and Intermediate Heaps (fivemetre contour interval, dashed).
Page 86 Rum Jungle Monitoring Report

(a) End of wet season
(b) End of dry season
Rum Jungle Monitoring Report Page 87
Pie-rehabilitation total horizontal discharge vectors shown on contourmap of environs of White's and Intermediate Heaps (five metrecontour interval). The maximum vector length corresponds to (a)1.5m2 /day and (b) 1.0m2 day.
Figure 5.15
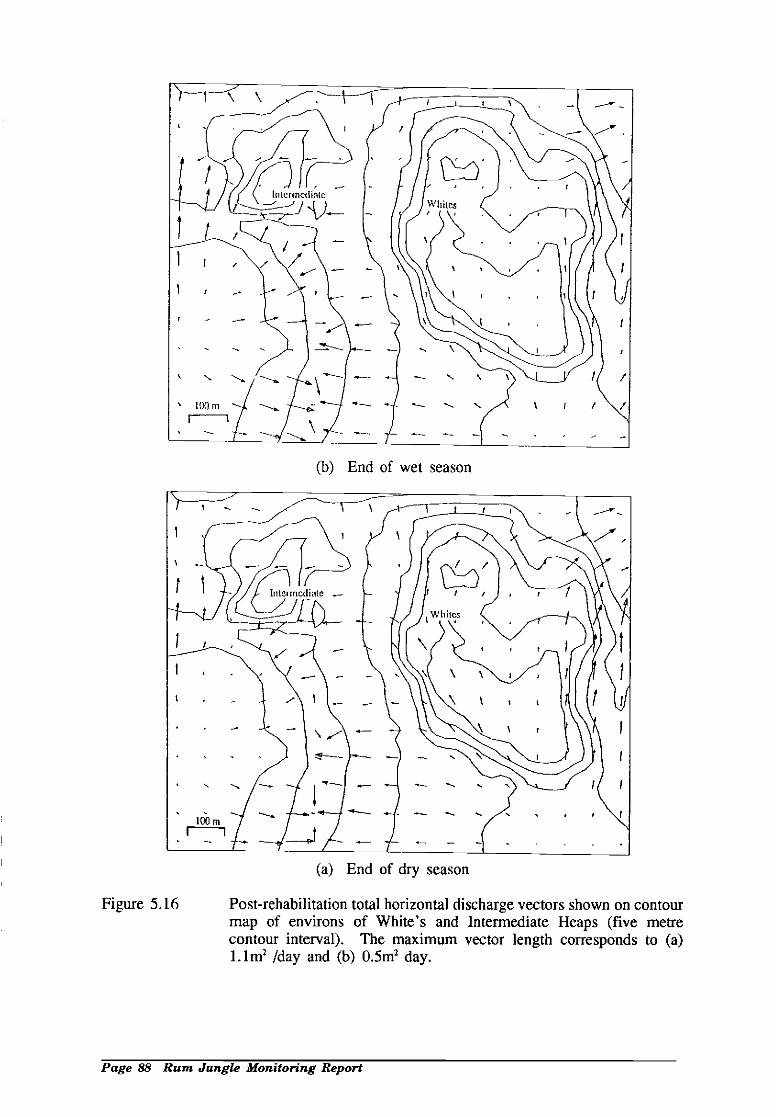
(b) End of wet season
Page 88 Rum Jungle Monitoring Repofl
(a) End of dry season
Figure 5.16 Post-rehabilitation total horizontal discharge vectors shown on contourmap of environs of White's and Intermediate Heaps (five metrecontour interval). The maximum vector length corresponds to (a)1.1m2 /day and (b) O.5m2 day.

lnteriiieIiaIe
S 62.0
62.0 64.4
62.6 Whites
(a) Pre-rehabilitation
(b) Post-rehabilitation
Figure 5.17 Selected flow paths starting from various points on White's andIntermediate Heaps. the arrowheads indicate yearly intervals; thecurrent heights of the paths are shown in m A.H.D (AustralianHeight Datum).
Rum Jungle Monitoñng Report Page 89

the travel times of the tracer flow paths give some indication of the timescale associatedwith flushing the contaminants into the local river system.
An alternative approach has been followed using a vertically averaged convectiondispersion equation (Pantelis 1987). The results suggested a flushing-out period ofabout 20 years after rehabilitation. In this work it was assumed that the clay coverswere completely impervious to rainfall, so that the vertical transport was severelyreduced at the top of the heaps. It is therefore implied that the five percent infiltrationthrough the clay significantly influences the flushing-out time.
An analysis of the chemical transport equation (the convection-dispersion equation) hasbeen carried out for general unconfined aquifer systems. It is shown by Pantelis(1988b) that while vertical advection is numerically much smaller than the horizontaladvection, the vertical advection plays a significant role in the long-term transport ofsolutes in aquifer systems of a kind considered at Rum Jungle. It is also shown thattransverse dispersion is also important in vertical mixing where horizontal flows aresignificant while longitudinal dispersion need not be included.
Simulations using a simplified vertical slice to represent a cross section of White'sheap illustrate the importance of vertical advection at the top of the heap in determiningthe transit time of pollutants from the top to the water table. Figure 5.18 shows thevertical discharge fields, and Figure 5.19 the flow paths, before and after rehabilitation,assuming steady state conditions. It is seen that horizontal flows high in the heap arealways extremely small. This means that the action of transverse dispersion in thisregion is small which leaves vertical advection as the only significant means ofcontaminant transport. Thus it is obvious that the clay cover increases the travel time.Close to the water table horizontal flows are large and transverse dispersion is important.
It must be stressed that these simulations are based on certain parameters which wehave inferred from the scarce hydraulic information that is available. It was evidentthat the reruns for slight changes in the topography of the impermeable bed of theshallow aquifer can significantly change the flow directions in certain areas. Also theparameters associated with the capillarity of the soils strongly influence the travel timesof the tracers, especially in the overburden heaps. For instance it was found that theflushing-out times were shortened by increasing the capillarity of the soil, for a fixedvalue of saturated hydraulic conductivity. This was evident in the larger horizontalflows in the unsaturated zone for soils of higher capillarity.
The above results are instructive since they give an idea of the direction and traveltimes of contaminants being released high in the overburden heaps. However, manymajor mechanisms have been omitted. First, in applying flow paths to contaminanttransport it is assumed that the contaminants are conservative. Also, it has beenimpossible to isolate a few dominant chemical reactions and the many reactions thatmust be considered are not necessarily fast. This means that the local equilibriumassumption cannot be made, and makes modelling difficult due to the unavailability ofreliable rate constants which describe the chemical kinetics.
Page 90 Rum JungLe Monitoring Report
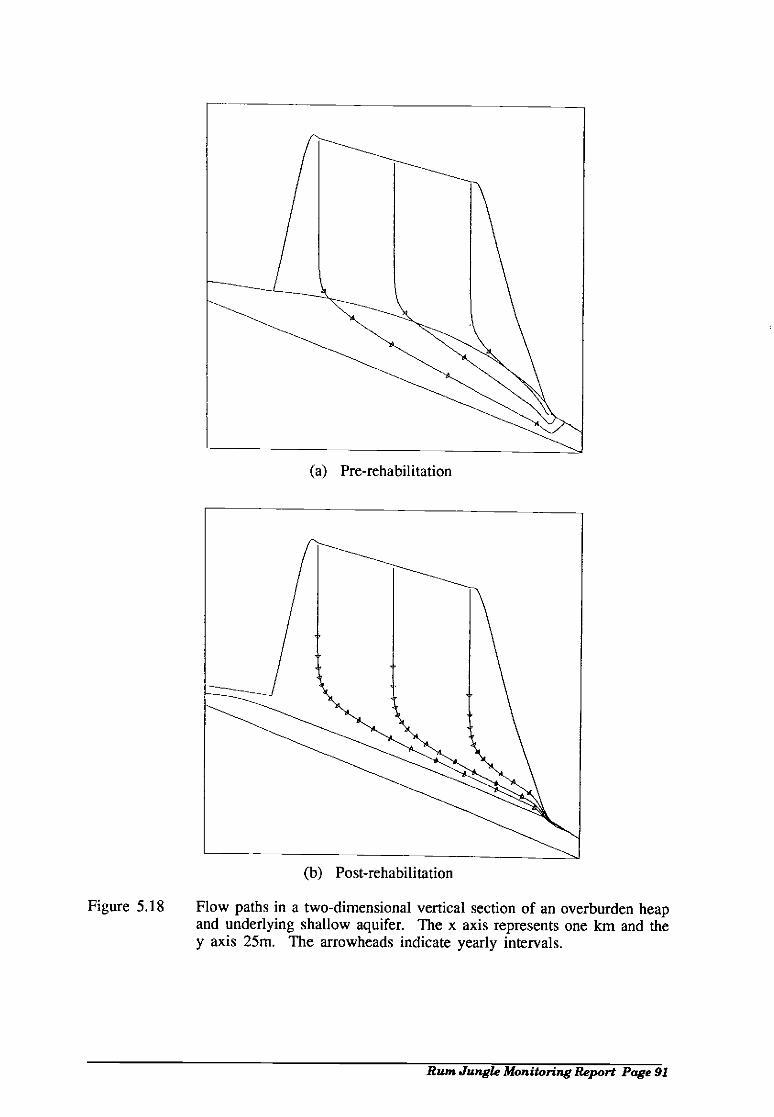
Pre-rehabilitation
Post-rehabilitation
Figure 5.18 Flow paths in a two-dimensional vertical section of an overburden heapand underlying shallow aquifer. The x axis represents one km and they axis 25m. The arrowheads indicate yearly intervals.
Rum Jungle Monitoring Report Page 91
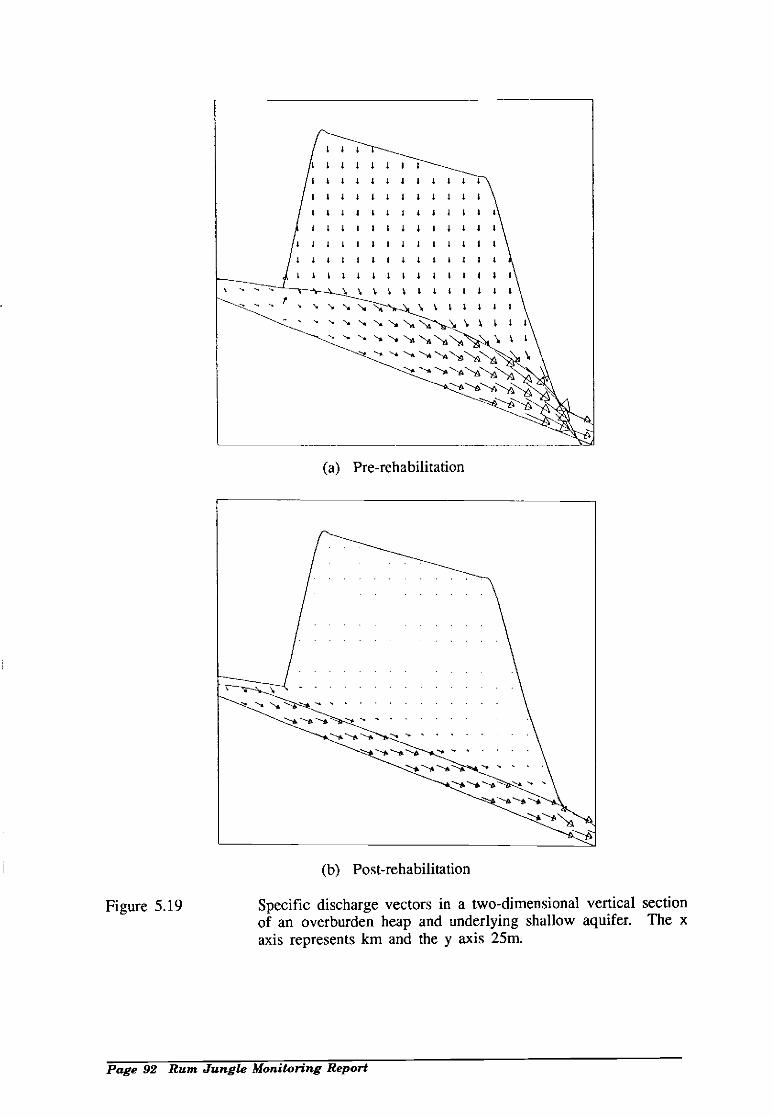
Figure 5.19
LI I
Page 92 Rum Jungle Monitoring Report
II 11441141144441114III It 444441£44114 144*4*
11411$ 4414141141111 LII It Ill41413$ III 5*44154$ 11114411111It 15$ It It
' '. '%. . I S I I I
' - "a 'a N N'\ ' I I
-'a
Pre-rehabilitation
Post-rehabilitation
-. a '-a 4 "A"-S '-* '-'s
Specific discharge vectors in a two-dimensional vertical sectionof an overburden heap and underlying shallow aquifer. The xaxis represents km and the y axis 25m.

5.4. PICTURE OF GROUNDWATER MOVEMENT
The following picture of the groundwater system in the region of White's Heap is asynthesis of the conclusions derived from the field data and the results of calculations.Below the heap there is a body of contaminated water (e.g. [Cul - 50mg/I) extendingfrom 3m below the original ground surface to possibly 20-30m depth. Each wet seasonthere is an influx of clean water, from rainfall infiltration upslope of the heap, over thetop of this water. Owing to density differences and also perhaps to low hydraulicconductivity at the deeper levels there is little mixing of these two lots of water.During the dry season the top water layer drains off, leaving the contaminated reservoirlargely unchanged. Calculations show that, with the 0.5 rainfall infiltration into the heapwhich occurred before rehabilitation, the unsaturated water flow through the heap wouldhave carried contaminants downward into the saturated zone (Figure 5.lSa). Thisprocess would have produced the body of contaminated water below the heap.However, when the infiltration is reduced to 0.05 by the clay cover, the calculationsshow that the unsaturated flow has a strong lateral component, especially in the capillaryfringe one -two metres above the water table. The water in this unsaturated flowreaches the edge of the heap before entering the saturated zone and therefore does notcontaminate the upper water layer below the heap (Figure 5.1 8b). At the heap boundaryit adds to spring water, if the water table so dictates, or else is washed into thegroundwater by the normal rainfall infiltration applying outside the heap's perimeter.The contaminants stored in the pore water within the heap are leached out by thismechanism.
In the above argument, which implies that there is little mixing of the surface anddeeper waters, there is, however, some conflict with theoretical considerations whichsuggest that there would be rapid vertical dispersion of the contaminants to thegroundwater (Pantelis 1988a). Here is should be emphasised that the arguments againstmixing are based on measurements from one borehole situated near the high end of theheap and that future measurements from the more recent holes at lower points on theheap may show otherwise. These uncertainties suggest that an informative extension ofthe monitoring program would be the installation of several boreholes with multiplesampling ports to measure the vertical distribution of the contaminant concentration.
The concentration of pollutants in the seepage water appears to be substantially thesame before and after rehabilitation, which would be expected as it is governed by thepore water contamination level. However, rehabilitation will have reduced the annualoutput of pollutants from the heap tenfold, proportional to the reduction in infiltrationrate. Thus annual releases of one tonne of copper and 250 tonnes of sulphate can beexpected, from scaling the estimates of Daniel et al. (1982). Such a reduction incontaminant load is consistent with the observed improvement in surface water quality.
5.5 CONCLUSIONS
The borehole monitoring data show that the groundwater quality close to the wasterock heaps at the Rum Jungle site continues to be affected by pollutants which haveemanated from the overburden heaps. The overall contaminant concentration of thegroundwater has not changed since the rehabilitation, despite good evidence thatoxidation of the pyrite in the heap has been virtually halted. Calculations show thatthere is a large store of pollutants held in the pore water in the unsaturated regions ofthe heap. The time taken for this store to be noticeably depleted has been calculated
Rum Jungle Monitoring Report Page 93

to be in the order of 10 to 20 years. It is therefore most desirable to capitalise on themonitoring work done at the site by continuing the programme until these changes canbe verified.
Page 94 Rum Jungle Monitoring Report

6. WATER QUALITY OF OPEN CUTS
C.E.R.F. Henkel and J.F. Alcock (1986-87)C.ER.F. Henkel (1987-88)
Power and Water AuthorityGPO Box 1097 Darwin, Northern Territory, Australia 0801
6.1 WATER QUALITY 1986-87
6.1.1 INTRODUCTION
The treatment of water in White's and Intermediate Open Cuts and the subsequentrediversion of the East Branch of the Finniss River has been documented in a previousreport (Henkel & Alcock 1987).
The main reason for rediverting the East Branch of the Finniss River to flow throughthe open cuts was to ensure annual flushing. It was anticipated that the design wouldensure that at least the top few metres of water in the open cuts would be flushed onan annual basis. The re-routed river is shown in Figure 6.1.
The open Cuts were studied in detail prior to treatment, and closely monitored duringthe treatment process. After treatment was completed a sampling programme wasinitiated to monitor the seasonal and annual variation of water quality in both open cuts.Henkel & Alcock (1987) describe the water quality in the open cuts on five occasionsfrom November 1985 to August 1986. It was concluded that the water treatment wasa success and the strategy of rediversion was also successful, resulting in improvedwater quality on an annual basis. It was anticipated that water quality would continueto improve with further flushing during successive wet seasons. The influence of inflowwater was initially thought to be around five metres depth in both open cuts (Allen &Verhoeven 1986). However, it was later shown to be in the order of 15 metres(Henkel & Alcock 1987).
This report is a record and discussion of monitoring from August 1986 to November1987.
Rum Jungle Monitoring Report Page 95

'1A 0'
F'
Page 96 Ruin Jungle Monitoring Report
CULVE AT
"I
0vets?0n Channel
- S
I/
//,
CULVERT- - WEI''S..WEIR2
Figure 6.1 The rediversion of the East branch of the Finniss River
IntermediateOverburden
Heap
Whites Overburden Heap /\
DDAR95g

6.1.2 WHITE'S OPEN CUT
The pH, specific conductance, copper, manganese, zinc and sulphate concentrations forsix sampling profiles from the 27th August 1986 to the 9th November 1987 are shownin Appendix C, Figures 6.2 to 6.7. The data are in Appendix D, Table 6,1. Thefollowing observations are made:
The 1986-87 wet season flush caused an increase in pH above approximately AHD3Dm. pH decreased as the 1987 dry season progressed. Generally, for a givenprofile, pH was fairly consistent to 45m AHD, and then decreased overapproximately the next 12m to approximately 3.0, which is the pH of the untreatedwater.
For a given profile the specific conductance was fairly consistent from the surfaceto 44-46m AHD, then increased to about 8000 p S/cm, at about 30m AHD whichis the specific conductance of the untreated water. Specific conductance decreasedduring the 1986-87 wet season because of the flushing by river water. The specificconductance of water above 45m AHD in November 1987 was approximately 700uS/cm, which was a considerable improvement on the water quality of November1986 when the specific conductance was 1400 pS/cm.
The specific conductance results mainly from alkaline earth sulphates. Thus thesulphate profiles were similar to those for specific conductance.
Comparison of the copper, manganese and zinc profiles with the correspondingpH profiles show that metal concentrations increase as the water becomes moreacidic. The lowest concentrations of metals measured in the treated water wereafter the wet season flush. Concentrations increased during the dry season as thewater became more acidic.
6.1.3 INTERMEDIATE OPEN CUT
Seven profiles were measured from the 26th August 1986 to the 9th November 1987.The pH, specific conductance, copper, manganese, zinc and sulphate profiles are shownin Appendix C, Figures 6.8 to 6.13. The data is in Appendix D, Table 6.2. Thefollowing observations are made:
The pH profiles generally showed several highs and lows. The most notable andconsistent feature was increased pH at 27 m AHD. Above this is the fresh waterinput. Below this layer there is more acidic water with higher concentrations ofmetals.
pH decreased steadily during the dry season over the interval from the surface toapproximately 38m AHD. The surface waters are poorly buffered, typical of thewet season river water flow.
The specific conductance profiles show that water quality above 37m AHD wasmarkedly affected by inflow water. The 1986-87 wet season was the second timethat the open cuts were flushed by flow from the East Finniss River. This resultedin a further decrease in the specific conductance of the water in the IntermediateOpen Cut. Specific conductance increased during the 1987 dry season.
Rum Jungle Monitoring Report Page 97

As with White's Open Cut, the specific conductance was largely a result of sulphatesalts. The sulphate profiles were similar to those of specific conductance.
Comparison of the copper, manganese and zinc profiles with the pH profiles showedthat lower metal concentrations were evident at 27m AHD where a layer of relativelyhigh pH water exists. Below 27m AHD metal concentrations steadily increased.This may be the result of polluted groundwater inflow or pyritic oxidation, andredissolution of metal hydroxides residual from the in-situ water treatment. Therewere some anomalous profiles which could not be explained; these include the profilefor manganese of November 1986.
6,1.4 DISCUSSION AND CONCLUSIONS
The 1986-87 East Finniss River and Finniss River monitoring report suggested that theopen cuts were a greater source of pollutants to the East Finniss River than previouslysuspected (Henkel & Alcock 1987a). It was suggested that high flow conditions intoWhite's Open Cut flushed polluted water from depths greater than 15m.
This report recommended that the open cut monitoring be increased and refers to themonitoring prior to the adoption of the more detailed 1987-88 programme.
The 1987-88 programme of sampling should result in less ambiguous data. Questionswhich arise from the 1986-87 data and which require resolution are:
What is the depth to which White's Open Cut is affected by flushing and what arethe implications for pollution of the East Finniss River?
What will be the effect of above average flow years?
The data in this report suggests that flushing occurs to a depth of at least 30m AHD,where untreated water was encountered. The depth of flushing would dependprimarily on the energy of the inflow water, and would presumably be moreextensive if the water density was lowered because of previous flushing. To date,the open cuts, and in fact the entire rehabilitation works have been tested only bywell below average flow years.
How stable are the bottom waters in the Intermediate Open Cut?
The data suggest that metal concentrations increased in 1987 below 27in AHID. Thedecrease in pH could result from oxidation of a pyrite surface or input from an acidicgroundwater. Both of these mechanisms combined with the dissolution of residualsludge would lead to an increase in metal contamination.
What is the origin and stability of the higher pH water at 27m AHD in theIntermediate Open Cut?
This water is a buffer between the bottom and top waters and is thought to be theresidual of the initial treated water.
What is the mechanism by which polluted concentrations in the upper water levelsincreased during the dry season?
Page 98 Rum Jungle Monitoring Report

The mechanisms previously proposed were thermal density differences, energy fromwinds and diffusion across concentration boundaries. However, the profiling wasnot sufficiently detailed to prove that mixing was the predominant mechanism, andthe possibility of polluted groundwater inflow was not precluded.
Successful prediction requires a greater knowledge of the open cuts' hydrology. Thisreport is confined to a record of the water quality in the open cuts over the study period(Appendix D, Tables 6.1 and 6.2), As expected, the overall quality of the water subjectto annual flushing in the Intermediate Open Cut is inferior to that in White's Open Cut.The overall quality of the water subject to annual flushing is a major improvement onthe quality of water before treatment (Henkel & Alcock l987a, Allen & Verhoeven1986).
6.2 WATER QUALITY 1987-88
6.2.1 INTRODUCTION
The following is a record of the monitoring of White's and Intermediate Open Cutsfrom November 1987 to October 1988 and shows the deepening of the fresh waterlayers in the open cuts beyond design expectations (Allen & Verhoeven 1986).
6.2.2 WHITE'S OPEN CUT
Fresh water entering White's Open Cut during the wet season as a matter of plannedannual flushing, affected the water quality to a depth of about 31m AHD (29m fromsurface).
Three distinct zones have become evident since treatment and annual flushingcommenced. These are the relatively unpolluted top layer of 16 metres, the mixedlayer from 16 metres to 23 metres consisting of fresh water mixed with polluted waterfrom depth, gradually increasing in contaminant concentrations with increasing depth,and the untreated layer, from 23 metres to the bottom consisting of water not treatedduring the rehabilitation of White's Open Cut.
At the start of the 1987-88 wet season in December 1987, profiling showed the layerof fresh water to be at 44 metres AHD, and the mixing zone from 44 to 37 metresAHD, (Appendix C, Figure 6.14).
The data for the profiling of White's Open Cut from November 1987 to October 1988are shown in Appendix D, Table 6.3.
The 1986-87 report on the open cuts, (Henkel & Alcock 1987b), mentioned thelikelihood that the untreated layer in White's Open Cut may be disturbed when flowvelocities of water entering the open cut from the Diversion Channel are increased intimes of heavy rains.
This has been proven, since profiling carried out during and after days of high flow-through showed that the fresh water and the mixed water layer deepened by two metres,Figure 6.14 (Appendix C) shows the changes of depth of the layers that took placebetween November 1987 and October 1988.
Rum Jungle Monitoring Report Page 99

It is estimated that on that occasion, approximately five tonnes of copper and 20 tonnesof manganese were brought up into the mixing and fresh water layers.
Two mechanisms are put forward to explain the lowering of heavy metal concentrationsin the top layer, the first being the action of flow-through of relatively uncontaminatedwater. The second is the action of water with a pH of greater than 6.0 entering theopen cut during times of high flows. The velocity of the in-flowing water causesturbulence at greater depth and disturbs the polluted bottom layer, thus bringing heavymetals to the surface, where precipitation takes place. This precipitate sinks back intothe low pH layer and redissolves.
The theory for the first mechanism. is obvious.
The validity of the second action is borne out by the fact that at the beginnthg of the1987/88 wet season (measurements taken 2 1/12/87) 21,000 kg of copper and 83,000 kgof manganese were measured in the top 29 metres of White's Open Cut. At the endof the wet (13/5/88), one month after flow-through ceased, 13,000 kg of copper and57.000 kg of manganese were found to be present in the top 30 metres.
About 8,000 kg of copper and 26,000 kg of manganese were removed from the top 30metres.
As only 3,200 kg of copper and 5,000 kg of manganese were found to have passedGS8150097. of which 2,000 kg of copper and 2,500 kg of manganese were thought tooriginate from the open cuts (Henkel 1989) about 5,000 kg of copper and 21,000 kg ofmanganese may have been precipitated and sunk to below 31 metres AHD in the opencut where they were redissolved.
The mechanism of settling is clearly shown by comparing results obtained for the20/4/88 and the 13/5/88 measurements (Appendix C, Figure 6.16). Between those twomeasurements flow had ceased and movement in the water was minimal.
Another indication that precipitated heavy metals are transported into the untreated layeris the increase of copper at depth. Prior to the treatment, the copper concentration hadbeen stable for ten years at approximately 60 mg/I.
Since treatment, the copper concentration has risen significantly and was analysed as 84mg/I at 24 metres AHD (35 metres from the surface) in October 1988.
During the same period, the manganese concentrations increased from 210 mg/i to 240mg/i.
The increase of heavy metal concentrations between wet seasons in the top of White'sOpen Cut is due to mixing of highly polluted water from greater depth by thermal andwind actions, entry of polluted ground water, and to a lesser degree by evaporation atthe surface. Figures 6.17 to 6.24 (Appendix C) show the changes of copper andmanganese concentrations from the start of the 1987-88 wet season to the end of the1988 dry season.
The water quality in the top of White's Open Cut deteriorated during the dry season,indicating that the open cut may be receiving significant amounts of contaminatedground water, (Anon 1978). It is estimated that approximately 89,000 m3 of pollutedgroundwater entered White's Open Cut This figure was obtained by calculating the
Page 100 Rum Jungle Monitoring Report

difference in volume between the estimated loss of water by evaporation, of rainfall andthe difference in the surface water level.
This estimate does not include a seepage loss which is thought to occur through a faultline and could be significant.
6.2.3 INTERMEDIATE OPEN CUT
Water in Intermediate Open Cut to a depth of 38 metres AHD (20 metres from surface),has been replaced by relatively unpolluted water from White's Open Cut Thisrepresents a deepening of the fresh water layer by approximately two metres whencompared to the profilings carried out on the 15/11/87 and the 27/10/88. Figure 6.25(Appendix C) describes the gradual deepening of the fresh water layer since August1966. Table 6.4 (Appendix D) shows the data obtained for profilings from November1987 to October 1988.
Using 38 metres AHD as a cut off, the calculated pollution load contributed byIntermediate Open Cut to the East Finniss River was small when compared to the totalpollution load carried at GS8 150097.
At the beginning of the 1987/88 wet season about 800 kg of copper, 900 kg ofmanganese and 170 kg of zinc were present ii the top twenty metres of IntermediateOpen Cut. This was reduced to 430 kg copper, 840 kg of manganese and 80 kg of zincat the end of the wet season in May 1988, when all surface flow ceased.
Most heavy metals found in the top layer of Intermediate Open Cut at the beginning ofthe 1987/88 wet season were the result of heavy metals transported from White's OpenCut, pollutants picked up from the channel connecting White's and Intermediate OpenCuts, and the input from contaminated ground water.
This occurred during periods of heavy rainfalls when the water table rose, and water,contaminated with copper was released into the connecting water course, andconsequently transported into the Intermediate Open Cut.
It is reasonable to assume that a similar precipitation action took place in theIntermediate Open Cut as described for White's Open Cut, but with reduced effect asthe prevailing pH values were generally lower than in White's Open Cut, andprecipitation especially for manganese would have been less. This is shown by thesmall difference in manganese found at the start of the wet and the end of the wetseason.
Contaminated ground water entered the Intermediate Open Cut during the whole year.This was manifested in the decrease of p1-I and the gradual increase of heavy metals inthe top layer as the dry season progressed.
The increase of pollutant concentrations at the surface of the top layer of IntermediateOpen Cut is largely due to evaporation.
The quality of water in the Intermediate Open Cut should improve with time as themeasures taken during the rehabilitation of the Rum Jungle Mine Site will take fulleffect and the residual pollutants will have diminished.
Rum Jungle Monitoring Report Page 101

6.2.4 CONCLUSIONS
Sampling of the open cuts was carried out throughout the 1987-88 wet season, givinga better understanding of the behaviour of the open cuts since treatment.
Results obtained show that:
The relatively unpolluted top layer in White's Open Cut deepened by twometres, from 44 metres AHD to 42 metres ARD and the mixing zone deepenedby three metres, from 37 metres AHD to 34 metres AHD.
The open cuts are major contributors of copper and manganese to the EastFinniss River, (Henkel 1989).
The zinc contribution from both open cuts was minimal when compared to thetotal load measured at GS8 150097.
The Intermediate Open Cut contributions of pollutants are not as great asinitially thought (Henkel 1989).
The water course connecting White's and Intermediate Open Cuts is the originalbed of the East Finniss River, and passes through the rehabilitated Copper HeapLeach area.
Although much of the highly contaminated material has been removed from thisarea and was securely buried, and the surface capped with clay and neutralisedwith lime, pollutants which have seeped to greater depth in the soil and to thewater table were not removed during rehabilitation. When the water table roseduring the wet season, these pollutants were mobilised and entered the watercourse. This could be the reason for the water in the top layer of IntermediateOpen Cut containing consistently higher heavy metal concentrations thanWhite's Open Cut, (Allen & Verhoeven 1986).
The increase of heavy metal pollutant concentrations in the top layer of White'sOpen Cut is also attributed to the mixing with polluted water from greaterdepth, evaporation and input of contaminated groundwater. (Anon 1978).
The increase of heavy metal concentrations in Intermediate Open Cut is due tothe input of groundwater, the carry-over of pollutants from White's Open Cutand the pick-up of pollutants from the water course connecting the open cuts.Heavy metal concentrations in Intermediate Open Cut at depth remained low,but are gradually increasing.
Page 102 Rum Jungle Monitoring Report

7. CHEMICAL ACTIVITY AND WATER BALANCE OF THEOVERBURDEN HEAPS
J. W. Bennett, J. R. Harries and A. L M Ritchie
Australia,, Nuclear Science and Technology Organ isation,PMB I, Menai, P/SW 2234, Australia.
7.1 INTRODUCTION
The waste rock dumps were major sources of heavy metal and acid pollution at the RumJungle site before rehabilitation. It was estimated that about 50% of the copper, 21% of themanganese and 99% of the zinc released from the site in the 1973174 wet season came fromWhite's and Intermediate dumps (Allen & Verhoeven 1986,Table 3.2). A further 32% of thecopper came from the Heap Leach Pile which was removed during rehabilitation and dumpedinto Dyson's Opencut. Hence the objective of reducing pollutants in the East Branch to thedesired levels could only be achieved if the release of pollutants from the waste rock dumpswas greatly reduced. This chapter describes the program to monitor the effectiveness ofrehabilitation work carried out on the waste rock dumps.
The monitoring of the waste rock dumps was carried out by the Australian Nuclear Scienceand Technology Organisation (Ansto), previously known as the Australian Atomic EnergyCommission (AAEC). Ansto had investigated the waste rock dumps before rehabilitationbegan and collected data which formed a basis for evaluating the effectiveness of therehabilitation project.
Pollutants were generated in the waste rock dumps by the bacterially catalysed oxidation ofpyritic material. The main pollutants were sulphuric acid and soluble salts of copper,manganese and zinc.
Studies on the unrehabilitated dumps showed that ground water provided the main pathwayfor the release of pollutants. These were leached by infiltrating rainwater to the base of thedumps and transported thence to the local river system by groundwater. Pollutants in seepagesfrom the side of the dumps and run off were visually obvious pathways but they were lessimportant than groundwater. The main characteristics of the waste rock dumps are summarisedin Table 7.1.
Table 7.1 Characteristics of waste rock dumps beforerehabilitation
Rum Jungle Monitoring Report Page 103
White's Intermediate Dyson's
Area (ha) 26 6.9 8.4Volume (m3) 4x10' 0.8x10⁶ 1.2x10⁶Mass (Mt) 8 1.6 2.3Sulphur (glkg) 32.7 30.6Copper (g/kg) 0.86 2.0

7.2 REHABILITATION WORK CARRIED OUT ON THE DUMPS
The rehabilitation strategy adopted for the waste rock dumps was to minimise the ingress ofwater by covering the dumps with a low permeability layer. As well as reducing the transportof pollutants from the dumps, this cover was also expected to reduce the supply of oxygento oxidation sites within the dumps and hence limit the further production of pollutants.
The following is a brief description of the work carried out on the waste rock dumps. Fora detailed description of the design criteria and implementation see Allen & Verhoeven (1986).
The dumps were reshaped to create a stable landform . The slopes of the side of the dumpswere reduced to a maximum slope of one-in-three horizontal and on White's dump a bermwas constructed at mid-height to enable greater control of stormwater run off. The tops of thedumps were graded towards central drainage channels with gradients between one and tendegrees. Erosion control banks were constructed on the top surface to divide the surface intorelatively small sub-catchments and control overland flow velocities. The top surface ofIntermediate dump, which was believed to be more reactive than the other dumps, was limedto reduce acidity.
A three-layer cover was then spread over the dumps. On the top surface the cover consistedof a layer of compacted clay (minimum thickness 225 mm) as a moisture barrier, a layer ofsandy clay loam (minimum thickness 250 mm) as a moisture retention zone to supportvegetation and prevent the clay layer drying out, and, on top, a layer of gravelly sand(minimum thickness 150 mm) to provide erosion protection and to restrict moisture loss byevaporation in the dry season. A similar three-layer cover was spread on the sides of thedumps, but the layers were thicker (minimum thickness 300 mm of compacted clay andminimum thickness 300 mm of sandy clay loam) and crushed rock was used for the erosionbarrier Engineered runoff channels were constructed on the tops and sides of the dumps. Thedesign life of the rehabilitation works applied to the dumps is 100 years. Vegetation wasestablished to stabilise the dump surface against the long-term effects of erosion.
White's dump was rehabilitated in 1983/84, almost two years before Intermediate and Dyson'sdumps were rehabilitated. Hence the results of monitoring White's dump provided earlyconfirmation of the success of the rehabilitation techniques applied. If major problems hadbeen evident on White's there would have been time to modify the planned work forintermediate and Dyson's dumps.
7.3 WATER BALANCE
The infiltration of water through the cover layers was monitored using lysimeters installed inthe reshaped White's and Intermediate dumps before emplacement of the clay layer. Thelysimeters, Figure 7.1, consisted of 200 1 drums with tubes to allow collected water to beextracted and measured. The bottom of each drum was filled with 300 mm of gravel to makea water collection zone, the gravel was covered with graded sand layers and the rest of thedrum was filled with dump material. Ten lysimeters were installed in White's dump and eightin Intermediate, two at each of the locations shown in Figure 7.2.
As the bottom of the lysimeters is effectively a perched water table in the unsaturated dumpsome water that enters the top of the lysimeter will be transported out of the lysimeter to thewater table at the base of the dump rather than collect at the bottom of the lysimeter. Anestimate of the magnitude of this effect has been obtained for lysimeters in different soil typesby using steady state and time dependent water flow models. The results show that the
Page 104 Rum Jungle Monitoring Report

c/c/a / 7sandy clay cam0/Compacted clay
///\\\7j/ / /\\\ /7/
0 /\///\\
1 /7/
- .. -, -, '\ / U Cd C / \O
gravefly sand -' 'a/ 0 / o - s ° \ 0
originar dump surf ace
compacted
dump material
creek sand
5- 7 mm gravel
l4mm gravel
5- 7mm gravel
sieve
0 300p p P
scale mm
Figure 7.1 Lysimeter construction and placement.
-t = =
outlels
C
C
Rum Jungle Monitoring Report Page 105
aN
a /

Intermediate dump
Page 106 Rum Jungle Monitoring Report
White's dump
Figure 7.2 Lysimeter positions; two lysimeters are located ateach position marked by a triangle.
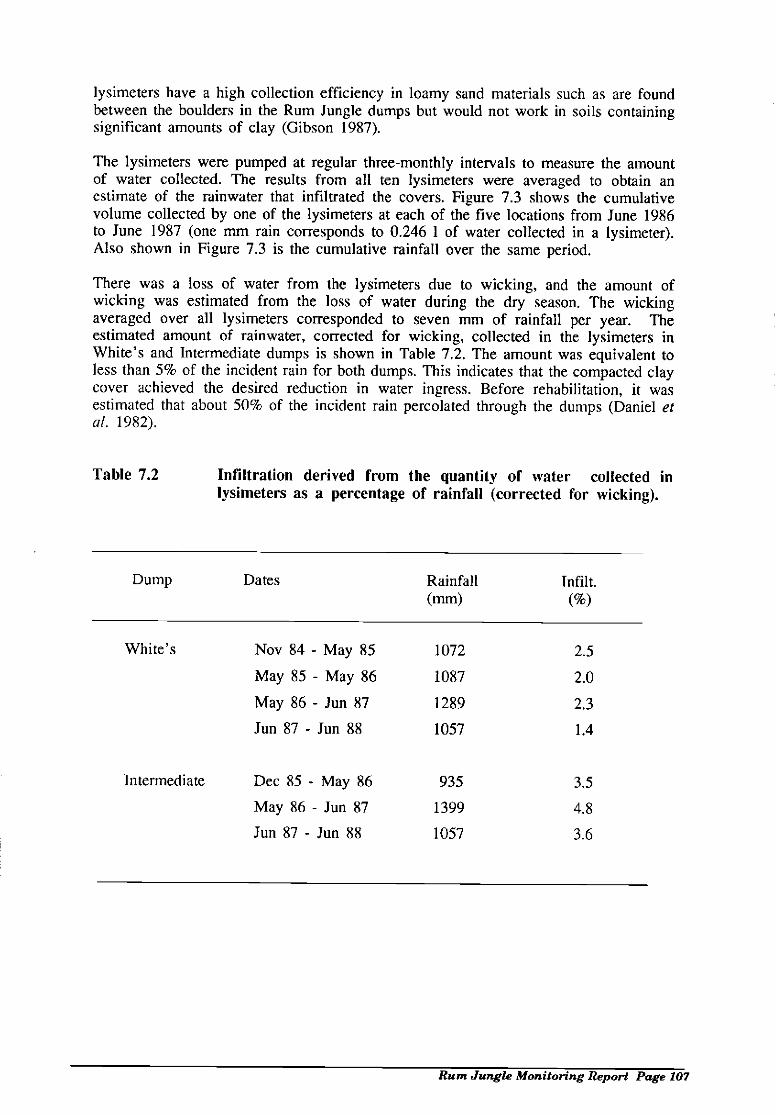
lysimeters have a high collection efficiency in loamy sand materials such as are foundbetween the boulders in the Rum Jungle dumps but would not work in soils containingsignificant amounts of clay (Gibson 1987).
The lysimeters were pumped at regular three-monthly intervals to measure the amountof water collected. The results from all ten lysimeters were averaged to obtain anestimate of the rainwater that infiltrated the covers. Figure 7.3 shows the cumulativevolume collected by one of the lysimeters at each of the five locations from June 1986to June 1987 (one mm rain corresponds to 0.246 1 of water collected in a lysimeter).Also shown in Figure 7.3 is the cumulative rainfall over the same period.
There was a loss of water from the lysimeters due to wicking, and the amount ofwicking was estimated from the loss of water during the dry season. The wickingaveraged over all lysimeters corresponded to seven mm of rainfall per year. Theestimated amount of rainwater, corrected for wicking, collected in the lysimeters inWhite's and Intermediate dumps is shown in Table 7.2. The amount was equivalent toless than 5% of the incident rain for both dumps. This indicates that the compacted claycover achieved the desired reduction in water ingress. Before rehabilitation, it wasestimated that about 50% of the incident rain percolated through the dumps (Daniel etal. 1982).
Rum Jungle Monitoring Report Page 107
Table 7.2 Infiltration derived from the quantity of water collected inlysimeters as a percentage of rainfall (corrected for wicking).
Dump Dates Rainfall(mm)
Infilt.(%)
White's Nov 84 - May 85 1072 2.5
May 85 - May 86 1087 2.0
May 86 - Jun 87 1289 2,3
Jun 87 - Jun 88 1057 1.4
Intermediate Dec 85 - May 86 935 3.5
May 86 - Jun 87 1399 4.8
Jun 87 - Jun 88 1057 3.6

me
Cum
ulat
ive
Inci
dent
Rai
nfal
l
EE
1200
sao
400E
C.)
0
8
0E
Page 108 Rum Jungle Monitoring Report
'S..
-
D
I I I I I I I I I t i t I I I I
Jun1986
Dec Jan1987
Jun
Month
Figure 7.3 Accumulated water in five of White's lysimeters, June 1986 - June1987.

7.4 PROBE HOLES
Probe holes drilled down to the original ground surface in White's and Intermediatedumps have been used to monitor temperature, gas composition and water content withinthe dumps, Early data were obtained using holes installed by Ansto before therehabilitation project began. Holes drilled since 1983 were installed as part of themonitoring program for the Rum Jungle Project.
The first drilling program in the Rum Jungle waste rock dumps was in 1976 when sixholes were installed in White's dump. These holes were lined with a 50 mm i.d.polyethylene pipe and sealed at the bottom to exclude water (type "n" holes). In 1982three holes were drilled in White's dump to enable the interstitial gas to be sampled.These holes had gas ports inset into the liner at depths of 0.5, 1.0, 1.5, 2.0, 3.0, 5.0 mand then at 2.5 m intervals to the bottom of the hole (type "g" holes - Ag, Bg, Dg).The locations of the pre-rehabilitation holes in White's dump are shown in Figure 7.4.
The holes in White's dumps were preserved during the rehabilitation earthworks whichwere carried out between August 1983 and June 1984, although the liners of most holeshad to be lengthened to reach the top of the cover layers, An additional ten holes wereinstalled in White's dump in June 1987. These holes have pairs of gas sampling tubesattached to the outside of the polyethylene liner to directly sample the gas in gravelback-filled zones at each metre down the hole (type "p" holes), Figure 7.4.
The first drilling program in Intermediate dump was carried out in 1982 when four g-holes and two n-holes were installed. An additional nine g-holes were drilled in 1984to provide additional information about pre-rehabilitation conditions. The location of theholes in Intermediate dump before the earthworks began is shown in Figure 7.5.
All the pre-rehabilitation holes in Intermediate dump were lost when it was rehabilitatedbetween August and December 1985. Nineteen new p-holes were installed inIntermediate dump in November and December 1985 after the earthworks on the dumpwere completed (Figure 7.5.).
7.5 TEMPERATURE PROFILES
Temperatures within the dumps were measured using thermistor probes lowered downthe probe holes. Temperature profiles were measured at approximately three-monthlyintervals before and after rehabilitation. Before rehabilitation, the temperatures at severallocations within both White's and Intermediate dumps exceeded 50°C. The temperatureshave decreased since rehabilitation and the highest temperature in either dump in June1988 was 41°C. Figures 7.6 and 7.7 show the temperature distribution in White's andIntermediate dumps before and after rehabilitation. The temperatures in hole A werealready decreasing before rehabilitation and there was a more rapid decrease followingrehabilitation in late 1983, Figure 7.8. Subsequently, the rate of decrease has slowed butthe rate of approach to the ambient temperature continued to be more rapid than it wasbefore rehabilitation.
The elevated temperatures in the dumps were caused by heat released by the oxidationof suiphidic materials. The heat production is principally due to the oxidation of pyriteto sulphuric acid and ferrous sulphate which is exothermic and releases 1440 kJmot' (FeS2).
Rum Jungle Monitoring Report Page 109

Page 110R
um Jungle M
onitoring Report
pre-rehabilitation
DIVERS!ONCHSA
v
post-rehabilitation
Figure 7.4 Locations and identifications of probe holes in White's dump,type 'n' holes ( ), 'g' holes ( ) and 'p' holes ( ).

Rum
Jungle Monitoring R
eport Page
IFigure 7.5 Locations and identifications of probe holes in Intermediate dump,
type 'n' holes ( ), 'g' holes ( ) and 'p' holes ( ).
post-rehabilitationpre- rehabilitation
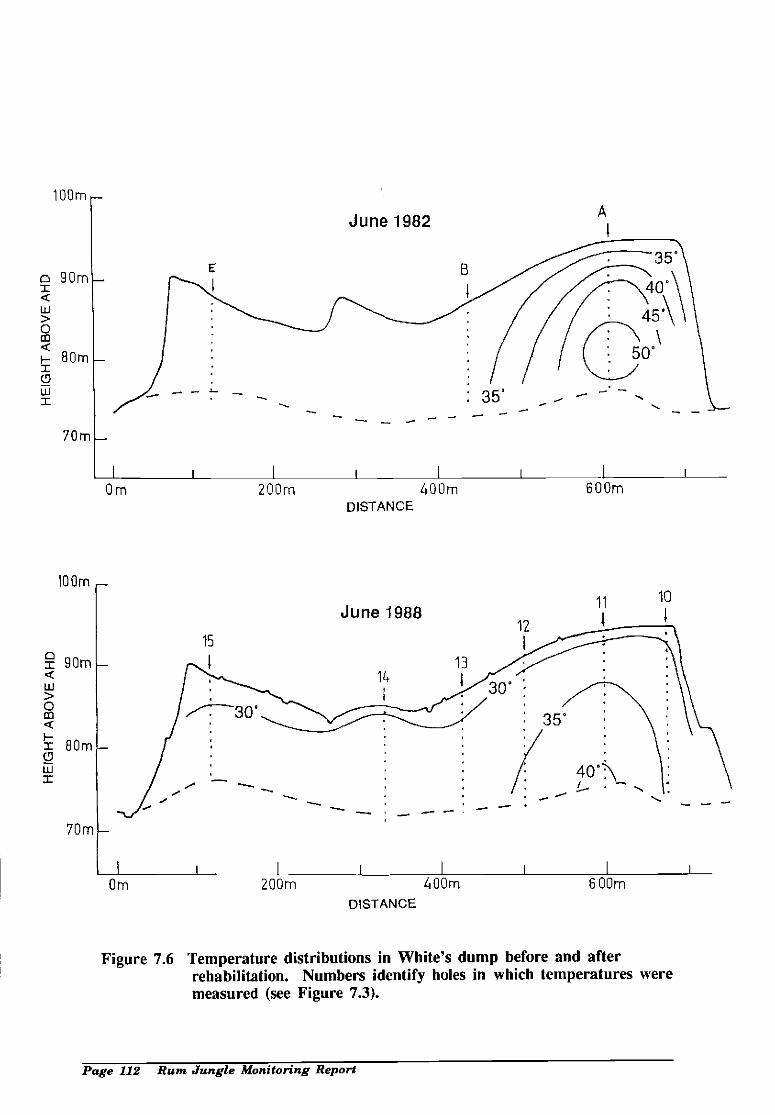
HE
IGH
T A
BO
VE
.AH
D
33
0
z
0 3
10Dm-
YOrn
I i I i
Om 20Dm 40GmDISTANCE
June 1988
35,
35,
40'
45' \
50'
BOOm
10
I I
20Dm 40Dm
DISTANCE
Figure 7.6 Temperature distributions in White's dump before and afterrehabilitation. Numbers identify holes in which temperatures weremeasured (see Figure 7.3).
Page 112 Rum Jungle Monitoring Repon
AJune 1982

HE
IGH
T A
BO
VE
AH
D
HE
IGH
T A
BO
VE
00
Th
BOrn
CICw>C
7Om
I-IwI
6Gm
30
56K 1q11 14
35' -- -
163
June 1988
19
I I I
Rum Jungle Monitoring Report Page 113
Om lOOm 20Gm 30GmDISTANCE
Gm lOOm 200m 300 mDISTANCE
Figure 7.7 Temperature distributions in Intermediate dump before and afterrehabilitation. Numbers identify holes in which temperatureswere measured (see Figure 7.4).

60. 0
;-' 1+5.0
1+0.0I.-
- -.
55.0
30. 0
20 1.1 ,,ii,,.it
HOLE R
Page 114 Rum Jungle Monitoring Report
\'.- -.------
-
1111111! I I t,j,tt I .i...uii I i.t.ii..i I
TIME Ly}
LEGEND
Figure 7.8 Temperatures at different depths in hole A in White's dump.
Zm
6mSn,
10 rn
12 In
114 ni
ISlB rn
79.0 81.0 87.0 89.0

The heat production necessary to produce the observed temperature profiles was derived usinga one-dimensional heat transfer model (Harries & Ritchie 1980, 1987). This calculationrequired estimates of the thermal conductivity, heat capacity and density of the dump material.Thermal conductivity was determined by measuring the rate of temperature rise produced inthe probe holes by a known heat source. The rate of oxidation of pyrite is directly related tothe heat production by the heat of reaction.
The derived heat production distributions showed that the heat production that was occurringat depth in holes A, C, D and F in White's dump before rehabilitation was effectively stoppedby rehabilitation (Figure 7.9). The analysis of the Intermediate dump temperature distributionis complicated by the large amount of dump material that was moved when the dump wasreshaped. Even so, it is clear that there was heat production before rehabilitation in someparts of the dump and effectively none after rehabilitation.
7.6 PORE GAS COMPOSITION
7.6.1. BEFORE REHABILITATION
The distribution of oxygen in the dumps showed some regions where the oxygen concentrationdecreased monotonically with depth, and other regions where the oxygen increased at depth,Figures 7.10 and 7.11. The monotonic decrease with depth is characteristic of oxygentransport by diffusion from the top surface. The oxygen concentrations increased at depth inthose regions where there were high temperatures in the dump and this indicated thermalconvection was transporting air in from the sides of the dumps and up through the hotregions. The atmospheric air entering at the side has an oxygen concentration of 20.9 vol. %
and the oxygen would be removed as the air flow encountered material containing unoxidisedpyrite. The supply of oxygen was the main process limiting the rate of oxidation in the RumJungle waste rock dumps before rehabilitation (Harries & Ritchie 1985).
At some locations the oxygen concentrations varied over time scales of less than a day.These short-time variations are caused by advection of the interstitial gas driven by variationsin atmospheric pressure. At tropical locations like Rum Jungle, the main atmospheric pressurevariations are atmospheric tides which have two maxima and two minima per day. Increasingpressure causes air to flow into the pore space and, because the incoming air has a higheroxygen content than air already in the dump, the oxygen concentration measured at a givenpoint increases. Decreasing atmospheric pressure caused air from which oxygen has been usedto flow out of the dump. Hence the atmospheric tides cause the oxygen concentration at agiven point in the dump to have maxima and minima twice daily.
Carbon dioxide concentrations in the pore gas were anticorrelated with the oxygenconcentrations. This suggests that the controlling process was the rate of exchange betweenthe pore gas and the atmosphere; the lower the exchange rate between the pore gas and theatmosphere the greater the time for the oxygen to be used in the oxidation process and thesmaller the opportunity for carbon dioxide to escape into the atmosphere. It was surmised thathigh carbon dioxide levels in the dumps resulted from acid reacting with dolomitic materialin the dumps.
The air permeability of the dump material has been measured using a two-tube technique. Thepertheability was found to range between 1xl0" and 2x10'° m2 and at some locations therewas a higher permeability zone at the base. A permeability of 10'° m2 is typical of dry finesand.
Rum Jungle Monitoring Report Page 115

Heat
Source
1.6
1.2
0.8
0.4
0.4
0.0
0.4
0.0
0.4
0.0
-0.4
1.6
1.2
0.8
0.4
0.0
0.4
0.0
0.4
0.0
0.4
0.0
0.4
0.0
0.4
0.0
-0.4
Figure 7.9 Heat production at hole locations A, C, D, and F in White's dump (a) before and (14 after rehabilitation.
-
/
(b)
A -
H \r'_r_ k4N
"1
I D-
//
-L____ F
b
L -.
N
I I'l
/N A
--
B -
I j
-
-
--
-
8.0 12.0
Depth(m)16.0 0.0 16.04.020.0 20.08.0 12.0
Depth Cm)4.00.0

HE
IGH
T A
BO
VE
AH
D
00
70m
DISTANCE
Figure 7.10 Oxygen distribution in White's dump before and after rehabilitation.The hole positions along the sections are as shown in Figure 7.4.The contours indicate pore gas oxygen concentration (vol%).
JUNE 1988 10
Rum Jungle Monitoring Report Page 117
lOOm APRiL 1983
400mDISTANCE
Om BOOm200m
090m
u-I>0
I-a 80mwI
70 m
Urn 200 m 400 rn 600ni

90 in
02
10
JUNE 1988
Page 118 Rum Jungle Monitoring Report
:- 0.2
- - p --------
Figure 7.11 Oxygen distribution in Intermediate dump before and afterrehabilitation. The hole positions along the sections are as shown inFigure 7.5. The contours indicate pore gas oxygen concentration(vol%).
lOOm DISTANCE200 in BOOm
14 192
I Y9
60 m- - -
Om lOOm DISTANCE200 in 300 in

7.6.2 AFTER REHABILITATION
The emplacement of the compacted clay covers on the dumps greatly reduced the levelof oxygen in most regions of the dumps, Figures 7.10 and 7.11. Since rehabilitation,the oxygen concentrations at depth have been low at all measuring points except in thenorthwest corner of White's dump where there were very low levels of pyrite. The claycover effectively stopped oxygen transport by thermal convection. After the covers hadbeen in place for about a year, the oxygen concentrations in the top few metres werefound to increase in the morning and evenings in the wet season. This diurnal behaviourwas similar to that observed before rehabilitation and was due to advection driven byvariations in atmospheric pressure. These elevated oxygen concentrations were presentonly in the wet season and this can be explained by the effect of seasonal changes in thepermeability of the compacted clay cover. If the clay near the holes was not as wellcompacted as the clay further from the holes, air flow produced by variations in theatmospheric pressure would tend to be concentrated in the higher permeability materialnear the holes. This would cause the diurnal variation seen in the wet season.
The low oxygen concentrations and the lack of diurnal variation in the dry season indicatethat there was cracking of the clay layer in the dry season, and that the cracks providepaths over the whole dump surface for advection of air by atmospheric pressurevariations. The reappearance of the diurnal variations in the oxygen concentrations earlyin the wet season shows that most of the cracks closed as the moisture content of theclay increased, but the clay near the holes did not seal as well as that further away.Oxygen concentrations at depth in the dumps continue to be much less than they werebefore rehabilitation. The compacted clay cover appears to have stopped oxygen transportby thermal convection.
7.7 CONCLUSIONS
Monitoring the waste rock dumps at Rum Jungle has shown that rehabilitation byreshaping and covering with compacted clay was effective in greatly reducing the ingressof water, the rate of oxidation of pyrite and the transport of oxygen. The lysimeters andgas composition measurements provided early evidence of the success of the rehabilitationstrategy. The reduced ingress of water and the low or zero oxidation rate (pollutiongeneration rate) gives confidence that the release of pollutants from the waste rock dumpshas decreased, although it will be some years before improvement is evident ingroundwater quality (see Chapter 5). Further monitoring will be necessary to show thatthe low oxygen levels and oxidation rates continue in the long term and to confirm thatthe leaching of heavy metals and acid has been reduced to acceptable levels.
Rum Jungle Monitoring Report Page 119

8. REVEGETATION, EROSION CONTROL ANDCOVER STABILITY
P. Ryan
Australian Groundwater Consultants Woodward Clyde Pty. Ltd.616 Qualtrough Street, Buranda, QLD 4102, Australia.
8.1 INTRODUCTION
Assessments of several aspects of minesite rehabilitation at the Rum Jungle minesitewere conducted by Australian Groundwater Consultants Pty Limited (AGC) in August1987 and May 1988 on behalf of the Power and Water Authority (PAWA). An interimreport was presented in September 1987. This report presents more complete findingsand conclusions of the monitoring and assessment works as a result of site inspectionsconducted on all rehabilitated surfaces in May 1988 (Figures 2.1 and 2.2). Aspectsaddressed include drainage works stability, pasture status, slope stability, tree growth,maintenance works, and land use recommendations.
8.2 RESULTS AND RECOMMENDATIONS
8.2.1 SURFACE DRAINAGE STRUCTURES
White's Heap
Since construction in September 1984, the rip rapped section (Drain B) of the mainrunoff drain on White's Heap has experienced instability. The probable causes ofinstability of rip-rap used in the main drain on Whites Heap were addressed in theinterim report (AUC 1987) and can be summarised as being:
short, over-steep sections of channel;
rip-rap particle sizing and wide tolerance in the 100 mm range; and
possible less than optimum layer thickness.
The interim report (AGC 1987) recommended the mattressing of damaged sections ofrip rap, in addition to extensions to the mattressed outfalls from erosion control drainswhich discharge surface runoff into the main drain. These works and, in particular, theoutfall mattressing, were substantially successful in stabilising active sections of rip-rap. However, two significant zones of instability developed during the 1987/1988 wetseason (Plates 8.1 and 8.2). These zones appear to relate to the location of mitigationworks carried out in 1987, whereby mattressing or low gabion structures were to be
Rum Jungle Monitoring Report Page 121

constructed on previously active zones of rip-rap. These works were carried out, withthe addition of the construction of gabion weirs across the drain (Plate 8.1). Movementof rip-rap and damage to the drain occurred downstream (and in one case upstream) ofthe gabion weirs.
Inspection of the damaged sections of drain was conducted with the assistance ofConservation Commission soil conservation specialists in May 1988. There was generalagreement that at least one of the gabion weirs had been constructed too high and thedownstream mattressed section too short, leading to significant flood damage downstream(Plate 8.2). In the remaining zones of damage, the precise cause of failure was moredifficult to define and the separation of damage attributable to mitigation works fromhistorical (i.e. construction and design works) causes was not possible.
As a result of the site inspections, it is recommended that the damaged sections of rip-rap be repaired with mattressing, and the two gabion weirs be substantially lowered.Loose pieces of geotextile fabric should be removed from the drain to minimise thepotential for blockage to flow in the drain (Plate 8.1).
Elsewhere on White's Heap, surface runoff drains appeared stable and future problemareas were not evident
Dyson's Open Cut
Corrective earthworks conducted in 1987 have resulted in shedding of runoff to the maindrain. Previously, the low area had accumulated water. The main drain continues topond water along a 20 metre section of subsidence. Remedial measures are notconsidered economically feasible, or warranted in terms of the potential (low) impactof allowing seasonal ponding to occur.
A small amount of leachate or "groundwater" was observed emanating from the baseof the drop structure beneath the main drain (Plate 8.4). Details of this leachate arediscussed in the report by Henkel & Alcock (1988).
Dyson's Heap
The rip-rapped and mattressed sections of drains on Dyson's Heap remain stable.
The soil conservation works conducted on the approach track to Dyson's in 1987 havebeen successful in preventing further gullying of the soil covers.
Intermediate Heap
The rip-rap drains of Intermediate Heap are stable and have been colonised in patchesby stands of pasture grass. The mattressed sections of drain appear quite stable, withno further slumping evident at the drop structure above the outfall of the main drain.
Minor sheeting of the 2A soil covers either side of the drop structure has occurred.Elsewhere, vegetation and the rock mulch are providing adequate protection of soilcovers from surface drainage, and significant zones of erosion are not evident.
Page 122 Rum Jungle Monitoring Report

Plate 8.1 White's Heap Drain B looking downstream. Gabion weir constructed1987.
Plate 8.2
I)amaged section of rip-rap downstream of gabionweir. May 1988.
Rum Jungle Monitoring Report Page 123

Page 124 Rum Jungle Monitoring Report
Plate 8.4
Precipitated salts andleachate. Dyson's OpenCut. May 1988.
Subsidence and backfaH in mattressed drain on Dyson's Open Cut.Created by settlement of fill. May 1988.
Plate 8.3

White's North and Copper Heap Leach Area
The contour drainage and outfall systems established on White's North appear to havebeen operating effectively. Minor sheeting on the flank of White's North at the EastFinniss channel to White's Open Cut has occurred. Drainage banks on the old CopperHeap Leach area are stable and performing to expectations.
Tailings Dam Area
The main rip-rap channel draining the Tailings Dam area is essentially stable. Finegravels and sands are gradually infihling voids between the rip-rap particles, providinga form of cementing matrix (Plate 8.8). A single point of scour has developed at theconfluence of the rip rap drain and the western channel. No remedial action isrecommended at this stage. Contour drain outfalls to the drain are stable andperforming effectively.
The developing tree belts lining the main rip rap drain are also providing additionalstability to the drain surrounds and batters (Plate 8.8). Relatively minor sheet erosionof the soil cover is occurring in the western sector of the tailings dam, at the break inslope between the pasture covered surface and the western channel batters.
Treatment Plant and Stockpile Area
Drainage structures on these areas consist of a main rip rap channel, contour drainoutfalls and contour drains. All structures remain essentially stable and grass cover inthe drains is increasing.
The remedial soil conservation works conducted on the old Treatment Plant site haverepaired the runoff backfall problems that previously existed, However, some runoffalong the vehicular track will inevitably continue to occur. Runoff will probablycontinue to channel at one side of the track, maintaining the small gully that exists onthe track.
Filter Cake Disposal Area
Remedial erosion control works conducted on the Filter Cake Disposal area have beenlargely successful. The previously existing scour channel in the centre of the site hasbeen successfully stabilised with rip-rap and a low mattress outfall,
Minor sheeting is taking place on the northern boundary, however remedial action is notconsidered necessary at this stage.
Borrow Pits
Attention by the Conservation Commission to ensure effective drainage and recontouringof borrow pits during the operational phases between 1984 and 1986 has resulted in ahigh standard of borrow pit rehabilitation.
Rum Jungle Monitoring Report Page 125

Two borrow pits to the south west of White's Heap continue to display some battererosion. These particular pits were sources of lB material and were located in highlyerodible, weathered granitic material, However, there are signs that vegetation and slopelowering will gradually reduce the degree of erosion.
8.2.2 PASTURE STATUS
White's Heap
A high standard of vegetation cover has developed on the surface of White's Heap(Plate 8.5). Pastures are dominated by Urochloa mozambicensis (Sabi grass),Stylosanthes hamata (Verano stylo) and Chioris gayana (Rhodes grass). The previouslydormant Paspalum notatum (Bahia grass) has made some advances in the past 12months. The creeping legume Macroptiliwn atropurpureum (Siratro) is advancing fromthe batters into the top surface pasture sward.
Overall, the appearance of the pasture is good and an effective erosion cover has beenestablished due primarily to the provision of a soil medium and follow-up maintenancefertilisation and slashing.
The naturalised grass Pennisetum pedicellatum (Pennisetum) is a common species onsections of White's Heap, particularly in the main drain (Drain B). Cynodon dactylon(Couch grass) continues to dominate barren areas, and is often present beneath thetaller, more visible grasses. Acacia holosericea shrubs are slowly colonising the topsurface and are mostly confined to contour drainage banks and alongside drains. Some50 specimens were counted.
Vegetation cover over the rock-mulched batters continues to increase. Siratro is thedominant species, in association with annual Sorghum and Heteropogon species.Numerous shrubs of Acacia holosericea have established.
Dyson's Open Cut
Pastures are dominated by Sabi grass, Verano stylo and Rhodes grass. The wet seasonannuals, Alysicarpus vaginalis (Alyce clover) and Digitaria ciliaris (Summer grass) arealso common. Couch grass appears to dominate minor low-lying areas. Significantamounts of Pennisetum grass have established in the main runoff drain.
The batters of Dyson's Opencut exhibit gradually increasing cover by Siratro and anassortment of naturalised and native annual grass species.
Dyson's Heap
Pasture development on Dyson's Heap has progressed satisfactorily and, in general, agood protective cover exists. The sward is dominated by Sabi, Rhodes and Bahiagrasses, with amounts of Brachiaria decumbens (Signal grass). Sections of the drainsand outfalls continue to support a cover of Paspalum plicatulum (Bryan plicatulum) andBrachiaria inutica (Para grass).
Page 126 Rum Jungle Monitoring Report

Plate 8.5 White's Heap; view to the northwest, showing good quality pasturecover and colonisation by Acacia holosericea. May 1988.
Plate 8.6 Intermediate Heap; view to the west showing a dense pasture swarddominated by Brac/ziaria decuinbens (Signal grass). May 1988.
Rum Jungle Monitoring Report Page 127

Patches of native spear grasses are evident in the pastures and on contour bank surfaces.Some colonisation by Siratro, presumably from Dyson's Opencut batters, has also
occurred.
Intermediate Heap
The pasture sward on Intermediate Heap is noticeably different to other surfaces, beingdominated almost exclusively by a dense cover of Signal grass (Plate 8.6). Verano stylois present in lesser amounts, and Rhodes grass occurs consistently but in low densities.Trees have not colonised the surface or batters. Batter vegetation is dominated bySiratro, and the naturalised species Eriachne glauca (Pan Wanderrie Grass).
White's North and Copper Heap Leach Area
Pasture cover on both these areas is of a good standard and primarily dominated bySabi and Rhodes grasses and Verano stylo. Significant amounts of Signal grass occurin the southeastern sector of White's North. Colonisation by other species has beenminimal.
The native shrub and tree species sown as seed along the northern flank of the CopperHeap Leach area have established well. They should continue to provide stability to thedischarge channel from White's Opencut.
Tailings Dam Area
A healthy cover of pasture generally dominated by Sabi, Bahia and Rhodes grasses andVerano stylo, has established on the Tailings Dam site (Plate 8.7). Noticeable advancesby Bahia grass have been made in the past 12 months, particularly in the southern
sector.
The tree belts and clumps continue to develop and a dense line of trees, dominated by
Acacia holosericea, has established on both sides of the main runoff drain (Plate 8.8).Isolated specimens of Mimosa pigra continue to appear in the drainage bank outfalls onthe Tailings Dam site (Plate 8.8 and Section 8.2.3).
Treatment Plant and Stockpile Areas
Pasture cover on these areas remains somewhat retarded in comparison to the surfacesdiscussed above. The degree of soil compaction and consequent moisture infiltrationrates are the likely reasons. However, the lighter cover does not appear to bedetrimental to the erosion status of the surfaces and may be expected to increase with
time and favourable seasons.
Sabi and Rhodes grasses dominate, with lesser amounts of Verano stylo. Couch grassoccurs in isolated patches and as a common ground cover beneath the taller grasses.
Page 128 Rum Jungle Monitoring Report

Rum
Jungle Monitoring R
eport Page 129
Plate 8.7 Tailings Dam area viewed from the old plant site, showing pasture cover and developing tree belts. Slashing inprogress, May 1988.

Plate 8.9 Mature specimens of Mimosa pigra on the Tailings Dam area. May1988.
Page 130 Rum Jungle Monitoring Report
Plate 8.8 Close up view of main drain on the Tailings Dam area, showingdeveloping tree belts and infilling of rip- rap voids with finematerial. May 1988.
Filter Cake Disposal Area
Vegetation cover on the disposal area has improved considerably over the 1987/1988 wetseason. The site was sown in December 1986 with an extensive mixture of remainingavailable pasture grass and legume species, and the resultant cover reflects this mixture.The dominant species include Rhodes, Sabi and Couch grasses, and the legumes Veranostylo and Stylosanthes scabra (Seca stylo). Significant numbers of invader species havecolonised including Pennisetum grass, native Couch, spear grasses, Wanderrie grass andthe common weeds Hyptis suaveolens (Hyptis) and lesser amounts of Sida acuta (Sida).Trees and shrubs have not yet colonised the site.
Borrow Pits
Attention to drainage, recontouring and topsoil respreading aspects during borrow pitoperations has resulted in high standards of revegetation (Plate 8.10). Minor exceptionsare generally confined to sections of batter, particularly on the pits located in graniticsoil profiles southwest of White's Heap.
8.2.3 WEEDS
The commonly occurring weeds, Hyptis and Sida are present to varying degrees on allrehabilitated surfaces. Competition from the pasture grasses has been strong to date,restilting in a general restriction of weed species to the contour drainage banks, and theedges of the rehabilitated heaps. This situation can be expected to continue whilst thevigour of the pasture species (both sown and colonising species) is maintained. Thisis related to a variety of factors, including soil nutrient levels, seasonal climaticvariables, fire, and vegetation density.
Isolated outbreaks of Mimosa pigra continue to occur in consistent locations. These arethe drainage outfalls on the Tailings Dam site, the ripped area in front of thesheds/workshops, Borrow Area 3 (immediately east of workshops), and Drain B onWhite's Heap. Inspection and eradication of outbreaks at six monthly intervals isstrongly recommended.
8.2.4 ROCK MULCH STABILITY
Detailed monitoring of the stability transects established in 1985 on White's Heap wasnot conducted, since gross movement or failure of the mulch has not occurred on anyof the Heaps.
Movement, however, continues to occur in discrete particles. Conversely, vegetationcover across the batters continues to increase, adding stability to the mulch.
Future potential avenues of gross failure of rock mulch, such as failure of sections of1A clay, or widespread windthrow of colonising trees were not investigated becausetheir occurrence is considered remote.
Rum Jungle Monitoring Report Page 131

Page 132 Rum Jungle Monitoring Report
Plate 8.10 Borrow pit near Mt Fitch gate, May 1988. Recontoured December1985. Unassisted re-vegetation.
Plate 8.11 Original sward of pasture, Tailings I)am area, May 1988. The plothas remained un-mown since planting in December 1984.

8.2.5 SOIL FAUNA
Several species of ants and one species of termite continue to be active on therehabilitated surfaces. The surface of White's Heap displays the most diverse array ofspecies and activity, with an active soil fauna in the surface lifter layer.
The grass-eating termite Nausitermes triodeae occupies at least 20 mounds, mostly inthe northwestern sector of White's Heap surface. The mounds are generally less than350 mm high and appear to be increasing more in number than individual size.Observation (by eye) of the particle size and quartz particle content of the mounds, andtheir colour, would indicate that the 1A clay material is not being targeted as aconstruction material.
8.2.6 OPEN CUT SURROUNDS
A small proportion of the hand-sown native shrub and tree seed spread around White'sand Dyson's Open Cuts has established. Acacia holosericea dominates the successfulspecies. A gradual increase over time in the development and diversity of cover ispredicted.
8.2.7 TREE COLONISATTON
An extensive search of literature pertaining to the effects of tree roots upon the integrityof compacted clay layers has revealed surprisingly little data, Reference is often madein the literature to potential effects, however, quantification or case studies are absent.
On the basis of the trials conducted on site for 18 months between 1985 and 1986,regional observations, and an analysis of tree removal costs/benefits versusstability/aesthetic benefits, some comments are presented:
Endemic trees have the ability to penetrate the 1A clay seal. Whilst theEucalypts on trial maintained their habit to deep root, they confined many majorroots to a lateral habit, following the planes of weakness created by compactedlift layers. Acacia species on trial maintained their habit to confine the greatbulk of roots in the less compacted, surface layers. However, rootlets were ableto penetrate the lA clay.
Competition from pasture species and Acacia shrubs will delay the colonisationof surfaces by Eucalypt species for an unknown period of time, perhaps severalyears.
Colonising trees will need to expend considerable energy penetrating compactedlayers, severely retarding their physical development.
Volumetrically, the pore spaces (and therefore potential pathways) created bytree roots in the 1A clay can only constitute a small percentage of the totalamount of seal afforded by the 1A clay layer.
Rum Jungle Monitoring Report Page 133

Windthrow of colonising trees is not considered to be a significant factor onthe rehabilitated top surfaces. Windthrow on the batters could potentially leadto local erosion.
The annual removal of trees entails an annual, permanent maintenance costestimated to be of the order of $5,000 to $10,000, and increasing withincreased tree numbers.
Gradually, trees and shrubs will take on some of the erosion protection rolecurrently undertaken by the pastures. Removal of trees will place a greaterrequirement for pasture maintenance works, and therefore costs.
In terms of floral and faunal population dynamics, the available literature onrehabilitated landforms suggests the attainment of a vegetation communityincorporating grasses, shrubs and trees is a more desirable goal.
Consequently, it is recommended that trees not be removed. The characteristics ofcolonisation and the effects of trees upon the integrity of the covers at Rum Jungleshould be specifically addressed, again, within the next two years.
8.2.8 PASTURE MAINTENANCE
Soil Chemistry and Implications
From an agronomic point of view, the soils at Rum Jungle in which pastures areestablishing have a low nutrient status (Table 8.1).
The analytical results for the common nutrients required for plant growth (nitrogen,phosphorus, potassium and sulphur) for May 1988 (Table 8.1) show the availablenutrient levels for a soil profile through the Tailings Dam soil cover system. Levels ofN, P and K are low whilst S is adequate. Comparison of these levels, however, withthose recorded from the same site in November, 1986 show the benefits of maintenancefertilising between 1986 and 1988 whereby the more stable nutrients, P and K, havebuilt up from extremely low to low levels.
Soil pH and conductivity remain at stable and desirable levels, whilst the levels ofspecific elements in Table 8.1 do not indicate abnormal migration of elements from theold tailings subsoil into the overlying soil covers. The recorded level of 150 ppm Cuat depth is, however, an indication of the presence of metals in the old subsoil andprobably reflects some mixing of soil cover with subsoil.
The higher pH of the lower-most layer of soil covers (400 mm depth) is a reflectionof the residual lime that is still visible in soil samples from depth.
In terms of the natural soil systems surrounding the rehabilitated surfaces at Rum Jungle,the levels of soil nutrients are not abnormal. Thus, discussion of the nutrient status ofRum Jungle soil covers should be made only in conjunction with discussion of theintended land use of the site.
Page 134 Rum Jungle Monitoring Report

Land Use Options and Recommendations for Pasture Maintenance
With regular maintenance fertilisation, the rehabilitated surfaces at Rum Jungle arecurrently capable of supporting light forms of primary production, such as grazing orannual hay cutting. Without maintenance, soil nutrient levels are insufficient to supportsuch land use.
Additional land use options fall in the more passive category, and include light visitoruse, research and rehabilitation monitoring, and simply leaving the site alone.
Primary production is not a recommended form of land use at Rum Jungle, unless acommitment to maintenance fertilisation is guaranteed. Given the decreasing financialcommitment to the site, this would appear to be an unlikely development Activitiessuch as hay cutting and grazing without fertilisation will remove large amounts ofavailable nutrient, to the detriment of vegetation cover. Commonly, about 180 kg ofnitrogen per hectare is removed in clippings from maintained pastures.
If funds permit, fertilisation of pastures with a compound (NPK) fertilizer in the1988/1989 or 1989/1990 wet season is recommended. A similar recommendation foran annual slashing towards the end of the wet is also made.
Without maintenance, and in particular, slashing, pastures will gradually develop athicker, taller habit with increasing colonisation by native and neutralised species (Plate8,11). Species used in the rehabilitation of batters such as Siratro, will also tend tocolonise for the first few years. Fires will burn "hotter" due to the increased amountof combustible matter, and native Acacia shrubs Acacia holosericea, in particular, willprobably tend to be replaced over time with the fire-favourable species such as theeucalypts.
Thus, a balance between the currently maintained pastures and a no-maintenance policyis recommended. Slashing and fertilising on an ever reducing frequency should allowthe phasing in of a no-maintenance policy.
It is strongly recommended that the pasture status and maintenance issues be reviewedin 12 months time. Fire breaks should be re-instated around the site. This will notexclude fires, but should reduce their frequency and extent.
Rum Jungle Monitoring Report Page 135

Table 8.1 Tailings Dam Area Soil Cover - Selected Analysest.
1. Located adjacent to the southern grazing/mowing exciosure (TD1).* Department of Primary Production, Darwin. November, 1986** SGS Quantum Brisbane. May 1988.N/R Not recorded.
Page 138 Rum Jungle Monitoring Report
SOIL DEPTH (mm)
0-100 100-250 250-325 325-400
GENERAL PARAMETERS
Saturated PastepH (May 1988) 6.82 6.45 6.58 7.24EC mS/cm (May 1988) 0.09 0.07 0.08 0.15
NUTRIENTS (ppm)
AvailableN* 56plc <5 Nm N/R NIRK* 22
N** 2 2 2 211 5 2 14
K** 120 70 80 8029 25 24 10
SPECIFIC ELEMENTS (ppm)
Total (by ICP) (May 1988)Cu 15 150Pb <5 <5Zn 15 <5Fe% 11.8 N Nm 8.64Mn 5300 5 750Mg 1650 3 200K 1000 8 400P 950 500S 30 30
8.3. SUMMARY OF CONCLUSIONS AND RECOMMENDATIONS
8.3.1 LAND USE/MAINTENANCE
Primary production without a guaranteed commitment to fertilisation and activitiessupervision is not recommended.
A decreasing level of current maintenance practices is recommended, Review in 12months is recommended.
Controlled visitor use of the site, with the provision to visitors of an accurate summaryof the project's history (i.e. an official handout sheet), is recommended.
Unrestricted vehicular use of the site is not recommended.
Regular eradication of Mimosa pigra outbreaks is recommended. The Department ofIndustry and Development may be able to provide assistance with control.
Tree eradication programmes are currently not considered necessary. However, a reviewof the situation within the next 12 months is recommended.
A low level of monitoring of the issues investigated in this report is stronglyrecommended. This could be simply achieved, and take the form of inspections at 12monthly intervals.
8.3.2 PROVISION OF MONITORING RESULTS
The rehabilitation of Rum Jungle will continue to provide both government legislatorsand the mining industry with valuable data with respect to more effective mineregulation and decommissioning.
Assessment of the success of the project in the form of revegetation, and surfacestability monitoring is therefore recommended at an appropriate and economicallypractical level. Also, as part of Project assessment, it is understood that the appropriateagencies will be seeking a continuance to water quality monitoring programmes. Thedissemination of the results of monitoring programmes to the appropriate authorities andindustry personnel is an important adjunct to monitoring programmes.
Rum Jungle Monitoring Report Page 137

9.1 INTRODUCTION
Annual inspections are conducted at the Rum Jungle site to ascertain the requirement formaintenance. The maintenance program was outlined in The Final Project Report (Allen &Verhoeven 1986) and is reproduced below.
9.2 MAINTENANCE PROGRAMME
9.2.1 COVERS
Maintenance of the cover system comprises the detailed inspection of the covers during andat the end of the wet season and the repair of any significant erosion damage, particularlygully erosion, during the ensuing dry season. Repairs to the covers should be made withmaterial similar to that which has eroded from the area, sourced from one of the previouslyestablished borrow pits from around the site and placed in a similar manner as the originalmaterial. Reasons for damage should be ascertained to enable design of approximate remedialworks and repairs.
9.2.2 VEGETATION
This comprises the inspection and re-seeding at the start of the wet season of any significantareas where seeding has failed during the previous dry season, the re-seeding of any repairedareas and the subsequent fertilising and slashing of all revegetated areas of the site. Re-seeding should utilise seed mixes similar to those used for the original seeding.
Fertilising and slashing should be carried out twice during the wet season, the first beingearly February and again during April, the exact timing will be dependant on seasonal weatherconditions. Selection of a suitable fertiliser should be based on an analysis of vegetation atthe time of application and should take into account any recognised soil deficiencies. Detailsare described by Ryan, 1986.
Unfortunately, the two year period may not be sufficient time to ensure successful siterevegetation to a point where maintenance fertilisation and slashing can cease. Nor may itbe sufficient time to conclude that revegetation works have been totally successful in thelonger term. These issues will need to be carefully considered before the works cease.
9.2.3 REDIVERSION WORKS
Maintenance of the rediversion works should be limited to the inspection of culverts andweirs during and at the end of the wet season, the removal of any accumulated debris fromthe structures, and the repair of any damage to the structures or their foundations before thenext wet season.
9. SITE MAINTENANCE
Rum Jungle Monitoring Report Page 139

Page 140 Rum Jungle Monitoring Report
9.2.4 DRAINAGE
This programme comprises inspection (formally on an annual basis after the wetseason but also during the wet season when appropriate) and rectification asdescribed below.
Inspect all erosion control drains and repair any damage, particularly thedrain outlet area.
Inspect all rip-rap lined drains for signs of movement of lining material andany other damage, and repair as necessary.
Inspect all mattress lined drains for signs of deterioration of wire mattresses,movement of fill material and any other damage, and repair as required.
Inspect all half round pipes (berm drain and drop down drains on White'sheap) for signs of deterioration or erosion of drain foundations and repair asrequired.
Inspect all drainage structures (gabion drop structures, manholes, energydissipaters, culverts etc) and carry out repairs as necessary.
Inspect subsoil drains and repair as required.
9.2.5 OTHER
Inspect and repair the designated road pavements to maintain serviceability,to the standard of gravel all weather roads.
Inspect the cattle proof fences around the site and around the filter cakedisposal area annually after the wet season and carry out repairs as required.
Inspect all buildings remaining on the site and repair as required to maintaintheir serviceability.
Inspect all monitoring facilities (gauging stations, pluviometer stations, etc)prior to the start of and during the monitoring season and repair as required.
Inspect the site water supply facilities and repair as required.
On completion of repairs to fencing (item above), eradicate feral buffalofrom within the site.
Inspect and maintain the fire break around the site perimeter fence annually.Exclusion of fire from the site is necessary to ensure the survival of theintroduced pasture species.
Under the Noxious Weeds Act 1985 certain plant species must be controlledor removed. Other species are undesirable in terms of the Project aims.

Inspect at six monthly intervals, and keep at tolerable levels by the use of herbicidesand mowing, weeds including Hyptis sauveolens, Sida acuta and Mimosa pigra,
This maintenance program is the responsibility of, and to be co-ordinated by the WaterResources Division of the Department of Mines and Energy.
9.3 MAiNTENANCE CONDUCTED
Fertilisation and slashing of pastures, weed control and minor repairs to drainagestructures were conducted and are described in detail in Chapter 8.
Ruin Jungle Monitoring Report Page 141

10. FINANCE
Expenditure on the Rum Jungle Rehabilitation Project up to June 1986 totalled $18.6million. This is summarised in Table 10.1.
Tables 10.2 and 10.3 show expenditure for the following years 1986-88, as reported atthe ninth and eleventh meetings of the Monitoring Committee.
The surplus identified at the eleventh and final committee meeting in June 1988 was$11 310. Revenue from sales of assets and recoveries from other accounts after thisdate provided an additional $22 277.90. A total of $33 587.90 was therefore held inthe Trust Account and was transferred to the Conservation Commission of NorthernTerritory when it assumed responsibility for the site.
Rum Jungle Monitoring Report Page 143

Table 10.1 Summary of Project Expenditure 1982 - 86
Page 144 Rum Jungle Monitoring Report
CATEGORY C. PROJECT MANAGEMENT, SITE SERVICING, MONITORING
CATEGORY DESCRIPTIONUP TOEXPENDITURE
30 JUNE 1986
CATEGORY A. EARTHWORKS ETC
Al Copper Heap Leach 3 539 670A2 Tailings Dam 138 157A3 Dyson's Open Cut 8 098A4 White's Open Cut 320 268AS Intermediate Open Cut 240A6 Dyson's Overburden Heap 262 047A7 White's Overbunien Heap 1 376 783AS White's North Overburden Heap 696 771A9 Intermediate Overburden Fleap 491 396AlO Acid/Sweetwater Dams 204 231All Other Areas 379 981Al2 Site Establishment Including
Protective Fence 1 194 932
Sub Total 8 612 574
CATEGORY B. CONSTRUCTION WORKS
B! Watcr Treatment Plant 2 016 228B2 Pipeline 1 012B3 Construction Camp 227 065
Sub Total 2 244 305
Cl Camp Services - power, water, sewerage 52 493C2 Camp Generator, Fuel and maintenance 161 587C3 Camp Accomodation 1 617C4 Monitoring 322 346CS Engineering and Management 3 028 293C6 Site Services 0
Sub Total 3 566 389
CATEGORY P SUPPLY OF CHEMICALS FOR WATERTREATMENT PLANT 2 824 581
CATEGORY E OPERATION OF WATER TREATMENTPLANT 1 392 400
CONTINGENCY 600 000
GRAND TOTAL (Not including Contingency) 18 640 249

Table 10.2 Revenue and Expenditure for 1986/87
Rum Jungle Monitoring Report Page 145
REVENUE $
Previous Balance 194 103.13C'wealth grant 86/87 480 000.00Sale of assets 398 819.00
TOTAL 1 072 922.13
EXPENDITURE
Administration 421 763.54Maintenance 582 667.72Monitoring 63 706.53
TOTAL 1 068 137.79
SURPLUS 2 285.10

Table 10.3 Revenue and Expenditure for 1 987/88
REVENUE $
Brought forward from 86/87 2 285Commonwealth funding 87/88 231 000RECEIPTS - SALE OF ASSETS TO MAY 14 805
- ADDITIONAL DISPOSALS 8 000
TOTAL 256 090
EXPENDITURE $
ITEM ESTIMATED AT REMAINING SUB-TOTAL
31.5.88
MonitoringANSTO bores 23 700 40 700 9 500 50 200*ANSTO monitor 21 700PAWA 26400 34000 2000 36 000*Consultancy 11 800 6 700 9 000 15 700Final Report 5 000 5 000 5 000
Maintenance
Vegetation 20 000 27 800 2 000 29 800Covers 30000 18100 2000 20100Rediversion Works 10 000 - -Drainage 20 000 28 400 1 000 29 400Roadworks 10 000 -
Fencing 1 000Build. maint. 2 000 600 400 1 000Buffalo control 500 -
Other - 500 - 500
Contingency 17 900 -
Thiess 14 700 14 700Tax H & K 33 000 33 0001986 Report 9 200 9 200*MPES
TOTAL 200 000 244 600
Page 146 Rum Jungle Monitoring Report
SURPLUS 11 310
Notes: * Total includes revote items from 86/87 not allowed for in estimates.+ Items not allowed for estimates.

11. SITE MANAGEMENT PLAN *
Ti. Verhoeven
Formerly Power and Water AuthorityP0 Box 1921, Darwin NT 0801, Australia.
11.1 INTRODUCTION
Under an Agreement between the Commonwealth and Northern Territory Governments(O'Donovan 1983), the Rum Jungle mine site has been undergoing rehabilitation since1982. The Agreement provided for scheduled works to be undertaken over a periodof four years, together with a monitoring program for a further period of two years,with an all up cost to the Commonwealth Government of $16.2 million (1982 value).The work has been undertaken by the Northern Territory Government. The Agreementcontains several important provisions including its operation, rehabilitation of the site,liaison and finance (described in detail in the Final Project Report (Allen & Verhoeven1986)).
The program of works and monitoring as defined by the Agreement will be completedby August 1988. To ensure the lasting integrity of the rehabilitation measures aftercompletion of the works, it is necessary to properly manage the site and to maintain therehabilitation measures. This is recognised in the Agreement.
This chapter describes the nature and extent of ongoing management measures and landuse restrictions needed at the site, to ensure Northern Territory public safetyrequirements are met and to protect the Commonwealth's investment in the rehabilitationstructures. These matters need to be the subject of an agreement between the NorthernTerritory and the Commonwealth in mid 1988.
* This plan was developed in June 7988. Since that time many of the recommendationshave been implemented and are outlined in Chapter Two.
Rum Jungle Monitoring Report Page 147

11.2 LEGISLATION AND ADMINISTRATION
11.2.1 OWNERSHIP OF THE SITE
The land concerned is within Sections 1090, 1091 and 2890 Hundred of Goyder, It isowned by and therefore controlled by the Northern Territory, subject only to twomatters:
(1) Finniss River Land Claim (Claim No. 39). All of these sections are subject to thisclaim which has yet to be determined (discussed in Section 2.4).
(ii) Any continuing role by the Commonwealth in rehabilitation, maintenance andmonitoring of the land pursuant to the Agreement.
11.2.2 LEGISLATION AND ADMINISTRATION UNDER THE AGREEMENT
Legislative control has been exercised via the Mines Safety Control Act, theresponsibility of the Minister for Mines and Energy. This Act will not appropriate tothe administration of the site after termination of the Agreement. The site is also adeclared Fire Protection Zone.
For the period 1983 to mid 1986, the rehabilitation work was managed by a specialProject Unit. The Unit was first located within the Department of Transport andWorks, and then transferred in late 1984 to the Department of Mines and Energy. TheProject Unit was disbanded in mid 1986, the work then being managed by staff who arenow within the Power and Water Authority (PAWA).
The project team's main objective was to implement the program of rehabilitation withinboth the approved time and limit of grants provided. The team sought to minimise themanagement costs of the project by drawing on resource and expertise provided by othergovernment authorities and private consultants where necessary. Project management,including control, financial administration, and public information, is described in Allen& Verhoeven (1986).
Three committees were involved in the oversight and co-ordination of various mattersrelating to the project; the Liaison Committee, the Monitoring Committee, and theTechnical Committee. Their composition, objectives and functions are described inAllen & Verhoeven (1986).
11.2.3 LEGISLATION AND ADMINISTRATION BEYOND THE AGREEMENT
The Final Project Report (Allen & Verhoeven 1986) identified that beyond mid 1988an adequate degree of control of the site would still be required, but that the MinesSafety Control Act currently providing such control would no longer be applicable. Inparticular, the Report concluded that abuse of the rehabilitated mine site may result indamage to the cover systems employed to prevent the further spread of pollution. Asnoted in Section 11.3, the potential for soil erosion thus jeopardises the integrity of thewhole rehabilitation.
Page 148 Ruin Jungle Monitoring Report

The report concluded that a legislative framework was still required to maintain adequatecontrol. It recommended that this control be achieved by applying the provisions of theSoil Conservation and Land Utilization Act (1980).
A Working Group of PAWA and Conservation Commission (CCNT) staff has examinedpossible appropriate legislation. It recommended to the Soil Conservation AdvisoryCouncil that it recommended to the CCNT that the mine site within the fenced boundarybe declared a Restricted Use Area as defined in Clause 20 of the Soil Conservation andLand Utilization Act (1980). The various conditions listed in Clause 20(C) (seeAppendix E) will form an important tool to help manage the site and to restrict erosion.
The above recommendation is currently under consideration by the CCNT.
With the change in controlling legislation, the administration of the site, and hence ofprograms of monitoring and maintenance, should transfer to the CCNT. The mainadministrative tasks would include:
Management of the Rum Jungle site (described in Section 11.3).Co-ordination of the monitoring program (described in Section 11.4).Administration and supervision of the maintenance program (described in Section11.5).Maintenance of video and photographic records of the site beyond mid 1988.By liaison with the Department of Primary Industries and Energy, advise theappropriate Commonwealth and Territory Ministers of progress.
Any administrative activities beyond August 1988 which pertain to the period 1986 to1988 (such as compilation of a comprehensive report) remain the responsibility ofPAWA to complete.
11.2.4 FINNISS RIVER LAND CLAIM
Ownership
The Rum Jungle rehabilitation site area as defined in the Aboriginal LandCommissioner's Report on the Finniss River Land Claim (1981) is within the boundariesof 'Area 4' as defined (shown in Figure 11.1).
Title of this land is vested in the NT following proclamation of the NT SelfGovernment Act (1978) Section 69 (2). The Land Commissioner has recommendedthat 'Area 4' including the Rum Jungle site be granted to an Aboriginal Land Trust(Allen & Verhoeven 1986, p. 40) and noted at paragraph 310 that it appears thatthe Commonwealth would suffer no detriment by the sites becoming Aboriginal Land".
Status of Land Claim
Finalisation of this claim by the Minister for Aboriginal Affairs is dependent on theresolution of a number of detriment issues. It is understood that it may take a fewmonths before those issues in respect to 'Area 4' are resolved. This has been the statusof the land claim since mid 1985.
Rum Jungle Monitoring Report Page 149

Protection of Commonwealth/NT Interests
Although the Land Commissioner has indicated that the continuation of the Rum Junglerehabilitation project could be permitted under Section 14 of the Land Rights Act thereare doubts that this section of the Act provides sufficient protection for essentialCommonwealth/NT interests. The traditional owners have been in favour of the projectbut there may be a need for a more formal arrangement to protect ongoingCommonwealth/NT maintenance and monitoring activities. For example the exclusionof the Rum Jungle access road from any grant cannot be assumed.
Conditional Grants
Morison's report in 1985 stressed that the key objective for the Commonwealth/NT isto ensure that any grant of land to an Aboriginal Land Trust subsequent to theGovernment's consideration of the Finniss River Land Claim is conditional uponCommonwealth/NT identified land use restrictions and other measures deemed necessaryfor public safety and to protect the integrity of the rehabilitation work. Justice Tooheyin his review report (l9S3) on the 'Aboriginal Land Rights (NT) Act 1976 and RelatedMatters' (paragraphs 164-169) recommended that conditional grants as envisaged abovecould be made. However, as the concept of conditional grants has not been tested, thereis no guarantee that it can be applied.
Alternatives to the 'conditional grants' concept include:
Propose an amendment to the Land Rights Act for Rum Jungle as was the case for
Ranger and Kakadu National Park.
Effect a grant conditional on a lease-back arrangement to the NT. This has specialattractions for the Rum Jungle site since it has the advantage of enabling the NTto exercise appropriate land use management controls. The lease back arrangementwould need to be negotiated between the NT Government and the traditionalowners.
It was decided by the Liaison Committee in 1985 (Morison, 1985) that before adetermination is made with respect to a grant of site land to an Aboriginal Land Trust,that Commonwealth/NT formulate land use controls based on long term assessments ofthe site. These would include an assessment of health risks for people at or near thesite, from residual pollutants, and identification of measures needed to protectrehabilitated areas from excessive wear as a result of man and nature. The basicobjective of such restrictions and management controls would not vary, regardless offuture ownership of the site, but their detailed character would have to be tailored tothe nature of activities contemplated by the owners. Provisions are available within theLand Rights Act to defer the grant of land subject to the resolution of theserequirements.
Page 150 Rum Jungle Monitoring Report
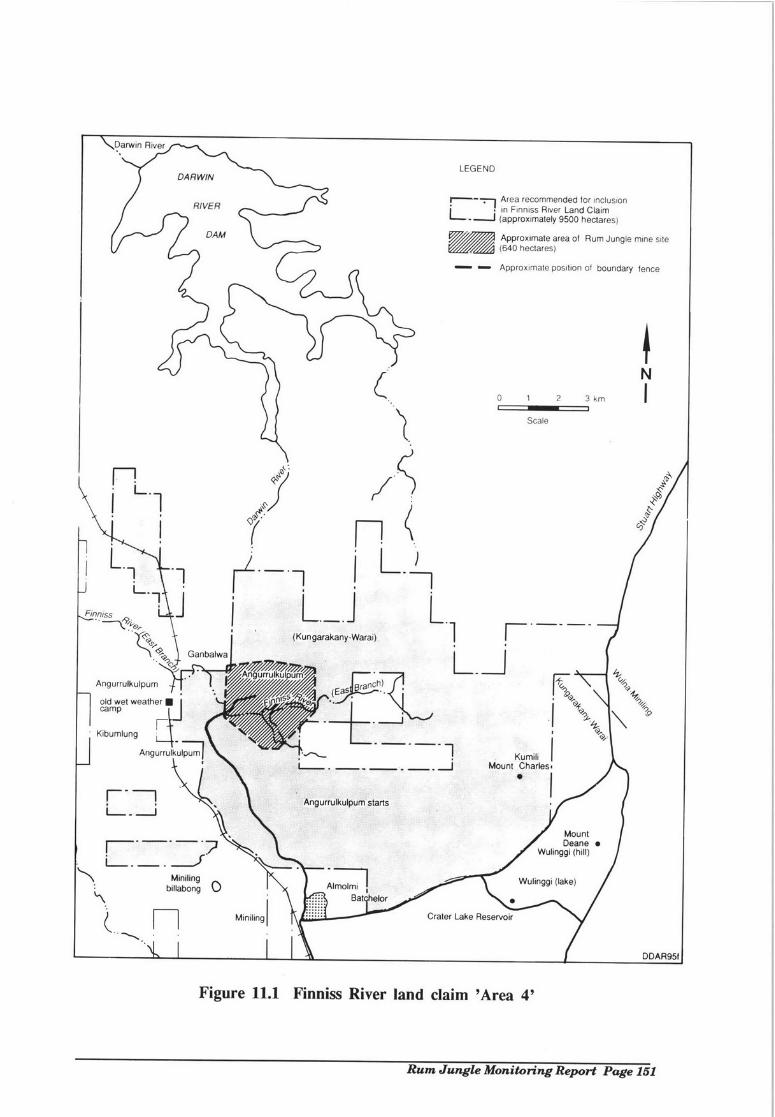
.
MountDeane
Wulinggi (hill)
Wutieggi (lake)
Crater Lake Reservoir
Angurrulkulpum
old wet weathercamp
L_J
1
1
Kibumlung
Angurrulkulpum
Ganbalwa
Minilingbillabong 0
Angurrulkul urn
A
Miniling
rA
L..J L.(Kungarakany-Waral)
1 PL
aS
Angurrulkulpum starts
AlmolmiBat etor
LEGEND
Area recommended for inclusionin Finniss River Land Claim(approximately 9500 hectares)
Figure 11.1 Finniss River land claim 'Area 4'
Approximate area of Rum Jungle mine s1e1640 hectares)
- - Approximate position of boundary fence
0 1 2 3km
Scale
c
N
Rum Jungle Monitoring Report Page 151
DDAR95t
KumiliMount Charles_J

Conditions of Grant
The Department of Aboriginal Affairs (DAA) were advised in 1985 of the followingpreliminary conditions to be attached to the grant, to safeguard Commonwealth/NTinterests:
adequate rights to complete works covered by the Rum Jungle Agreement, and tocarry out any further rehabilitation work which may be deemed necessary;
rights of access to carry out environmental monitoring and any remedial work;and,
restraints as necessary in land management and usage consistent with public healthand environmental protection requirements (including protection and maintenanceof the integrity of the rehabilitation work).
Other identified conditions included:
rights of access restricted to authorised personnel during the life of the rehabilitationprogram;
rights to erect and maintain prominent long-standing markers with relevantinformation engraved thereon;
endorsement of appropriate Rum Jungle site information (irrespective of ownership)on local and national land survey plans and title deeds and placement of covenantson future land use;indemnity against liability on the part of the NT or Commonwealth arising fromprevious use of the site; and,
rights to apply and vary land use restrictions and management controls.
In addition to the above conditions, the land use restrictions listed in Morison's paper(1985) were agreed to as appropriate for further advice to DAA on site managementcontrols:
Restriction of activity on waste containment sites and overburden covers so thatdamage does not result.
Restriction on the use of open cut pit water if unfit for recreation followingtreatment.
Restriction on flora intrusion to those varieties which would be unlikely to damagethe rehabilitation works.
Restriction on access of fauna to those types which would be unlikely to damage therehabilitation works.
Restriction of mining operations to those consistent with agreed site managementrequirements.
Restriction of tourism/recreation activities consistent with determined site managementcontrols.
Page 152 Rum Jungle Monitoring Report

11.3 LAND USES AND RESTRICTIONS
11.3.1 CONSTRAINTS
As indicated in Section 11.2 and in the Final Project Report (Allen & Verhoeven 1986),the long term effectiveness of the rehabilitation measures depends on the integrity of theworks. Whilst these works have been designed to withstand the impact of animals anda wide range of weather conditions, their integrity could be compromised as a result ofhuman activities.
In particular, the integrity of the above-ground structures can only be maintained if theirimpervious covers are not breached. The Liaison Committee (Morison 1985) stated thatthere should be no activity permitted on waste containment sites or other areas wherethe resulting mechanical action could accelerate the removal of soil covers and thereviewed release of containment material. These areas are located throughout the siteand include White's, Intermediate and Dyson's Overburden Heap, the infilled Dyson'sOpen Cut, rehabilitated slopes and earth banks (Figure 11.2). In addition, the banks andbeds of watercourses, channels and dams should be protected.
Turning to the open cuts, the objective in the Agreement was to reduce pollution. Thiswas interpreted by the Liaison Committee to mean that, after treatment, the water in theopen cuts should be of a quality suitable for recreational use (Morison 1985).Following completion of water treatment, the East Branch of the Finniss River wasrediverted through the open cuts as described in the Final Project Report (Allen &Verhoeven 1986). Thus at the end of each wet season the water quality in the upperlayers of the pits is of riverine quality. However, the behaviour of the water bodies iscomplex. Water quality changes seasonally and with depth, responding alternately tothe impact of groundwater hydrology and surface water mixing. At this stage there isinsufficient information to develop a sound policy on the use of the open cuts.
11.3.2 TOURISM/RESEARCH
Public awareness, general educational interest, and research (both national andinternational) interest in the site are high, and will continue to be so for a number ofyears. Whilst limited supervised public access is considered to be an important part ofsite management, unsupervised access is not recommended at any stage as this willresult in damage from vehicles with resulting soil erosion.
Rum Jungle Monitoring Report Page 153

N
/_/_
/_/J
3)
N
N
/
c Old TaiIirs:9arnArea.z
--
cc
/ / /
Areas of water treatment
Areas of vegetation
Recommended tourist drive
Figure 11.2 Site plan after completion of rehabilitation
Page 154 Rum Jungle Monitoring Report
\\
9- HILLSIDEINTERPRETATIONDISPLAY
It))
Dysons Open4 Cut Landform
A
N
/
DysonOverburdenHeap
/
N
N
7
SCALEDDAR95b
/ / /
500 l000m0

Access should cater for two groups:
The public, including tour groups and school children. An offer was made in1987 by the Batchelor-Adelaide River Tourism Development Association toconduct guided tours. This offer has recently been restated to the CCNT. Suchan arrangement has the advantages of:
Guided, restricted access with tight control on areas inspected.
Minimal maintenance costs associated with public access.
A local sense of responsibility for the upkeep of the site, helpiig in sitemanagement.Generation of income to help the local community and to help maintain the majoraccess roads.
Figure 11.2 shows possible tour areas. (The cost of construction of the proposedhillside interpretation display should be negotiated with the Commonwealth this year).This route is used for current tours arranged through PAWA.
Researchers (both national and international) with a bona-fide interest in the site.These could have less restrictive access to the site, with written authorisation froma delegated officer of CCNT. At present such 'do it yourself' access is arrangedthrough PAWA; it has proven a successful working arrangement.
11.3.3 GRAZING
Maintenance of the stock proof fence erected around the mine site area should serve tocontrol its use by animals. The earlier (Morison 1985) recommendations of the LiaisonCommittee have been modified with time as vegetation has become established. Faunain the area should be restricted generally to those types which would be unlikely todamage the rehabilitation works. While it is almost impossible to exclude buffaloestotally, their numbers on site should be kept to a minimum, both now and in the future.
11.3.4 MINING
A number of companies hold mining and exploration rights within the region. However,within the boundaries of the site there are no current mining leases. The site is coveredby an exploration licence application (EL 4880).
If a mining operation was to be undertaken the NT would need to ensure that suchoperations were consistent with agreed site management requirements as well as withnormal requirements under NT Government mining regulations. Associated rehabilitationmeasures are a matter for the NT Government and the companies.
Rum Jungle Monitoring Report Page 155

11.3.5 OTHER LAND USES
The above described uses of the site take into account the site constraints, communityrequirements and the costs of managing the site for the specified uses.
Similarly, future land uses (for example using the pastures as a source of mulching hay)will need to be considered on the basis of:
the site constraints identified in Section 11.3.1; or restated, what the land surfaceis capable of withstanding without detriment; and,
the overall costs of ongoing site management.
11.4 MONITORING
Results of the monitoring program show that as an indicator of short term success theobjectives as set out in the agreement appear to have been achieved. While pollutionstill exists, it is important to emphasise that the rehabilitation works were never intendedor expected to eliminate all of the pollution sources. Minor sources will remain, butthe effect will be very small by comparison with that prior to rehabilitation (Allen &Verhoeven 1986).
However, there are two areas of concern:
The four wet seasons during and after rehabilitation (1984/85 to 1987/88) have allbeen of below average rainfall and run off. Total annual run off in the EastBranch of the Finniss River in each year has been approximately one third that ofthe median annual flow. As a consequence, the rehabilitation works have not beensufficiently stressed by an average or above average wet season to enable analysisof the long term behaviour of the works.
The environmental response to the rehabilitation of some elements on site haspredictably been relatively slow. The longer term effects on groundwater hydrologyand water quality of the open cuts, for example, cannot yet be quantified.
When examining the question of the need for and scope of further monitoring, it wasconsidered important to separate the monitoring required to verify the continuing successand integrity of the rehabilitation works from monitoring required for other researchpurposes (using the site as a laboratory to monitor population dynamics, slope stability,etc).
Monitoring to date has tended to extend over the whole site, and at relatively frequentintervals in time. The Monitoring committee has identified key indicators to obtain anearly warning of negative changes/trends on site, and has redefined sampling frequencies.
Page 156 Rum Jungle Monitoring Report

The recommended monitoring program includes:
(I) Monitor Water Quality of the East Branch of the Finniss River
This is required in order to safeguard the water resources of the Finniss River system.The change in the water quality of the river is the prime indicator of the effects ofrehabilitation measures adopted under the Agreement.
The current extensive surface water monitoring program over the site is to bemarkedly reduced to the measurement of water quantity and chemical quality at onegauge station GS 8150097 downstream of the main site. To further reduce costs, dailygrab samples are to be taken using the installed automatic sampler, with the stationvisited only every 24 days to change the carousel. Samples are to be analysed forSpecific Conductance, pH, Copper, Manganese, Zinc and Sulphate.
Rainfall information should be collected on site so that streamfiow and pollution levelscan be related to storm intensity and duration, and to the seasonal total. The rainfallmonitoring network is to be cut back to the operation of one pluviometer R815205located at Whites Overburden Heap. Rainfall information thus collected can also beused by other monitoring agencies in their studies:
Australian Nuclear Science and Technology Organisation (Ansto) monitoringwater balance in the overburden heaps, and groundwater behaviour.
CCNT monitoring vegetation, drainage and erosion.
The implementing agency PAWA has estimated the total cost of the above to be$17,500 per annum (including salaries). While it is intended that this work becarried out for five years to 1993, the work proposed should be reviewed annuallyagainst results obtained.
(ii) Monitor Water Quality and Temperature Profiles in Whites andIntermediate Open Cuts
Monitoring to date has shown complex behaviour of water quality in the opencuts, seasonally and with depth, Further monitoring is required to assess the longterm quality stability of the open cut pits.
The frequency of monitoring can be reduced from weekly to half yearly.Sampling runs should be made toward the end of the wet season, and at the endof the dry season, with water quality at its best and worst respectively.Monitoring is required in 1988/89, to help assess long term stability. Beyond that,no monitoring is required until a wet season of average or above average rainfalland streamfiow is experienced. Sampling runs for that year should then be madetoward the end of the wet season, and at the end of the dry season.
For each sampling run, water samples should be collected at two metre intervals,and analysed for Specific Conductance, pH, Copper, Manganese, Zinc, Sulphate,Dissolved Oxygen and Temperature.
The implementing agency PAWA has estimate the cost of this work to be $6,400per annum, for two years.
Rum Jungle Mon ito ring Report Page 157

Monitor the Water Balance and Chemical Activity of Whites andIntermediate Overburden Heaps
This is required to confirm long term trends for chemical activity and groundwaterpollution. Programs include:
Water balance. Lysimeters, rainfall data (from PAWA), groundwater monitoringbores. Water levels and quality are currently measured in 83 bores. This can bereduced to field measurement of water level, Specific Conductance and pH in 16bores (four on Whites Overburden Heap and 12 surrounding it) with completechemical analysis of water from five of these bores. Sampling should be carriedout in November, February and April each year.Chemical activity. Measurement of oxygen, moisture content and temperature withinthe heaps. The frequency of monitoring can be safely reduced from quarterly to halfyearly for the two years 1988/89 and 1989/90, and thereafter to once annually.
The implementing agency is Ansto; the estimated cost of the above chemical activityand lysimeter monitoring is $6,000 per monitoring trip (excluding salaries). ThePAWA are able to carry out bore monitoring work for Ansto at a cost of $1,200 perannum, including salaries. It is intended that this work be carried out for five yearsto 1993, with annual reviews of the results.
Monitor the General Integrity of the Site
This is required to confirm long term trends, and to program annual preventativemaintenance requirements.
One annual visual inspection (recorded with photographs) is required at the end ofthe wet season to monitor vegetation condition, the introduction of weeds, erosion ofcover systems and drains, streambed and embankment conditions. It also includesa visual inspection of the infill of Dysons Open Cut (renewed slumping, settlementor cracking are to be quantified by survey using the existing grid of permanentmarks).
The implementing agency is CCNT; the estimated cost of the work is $1,500 perannum, including salaries. It is intended that this work be carried out for the fiveyears to 1993.
Flora and Fauna Survey
This survey was recommended to be carried out (Allen & Verhoeven 1986), fiveyears after the completion of rehabilitation and associated programs. It is requiredwhen the above monitoring programs show there is little change to the site.
It is not intended that the extensive surveys reported by Davy (1975) be repeated.However, a fauna/flora survey of the East Branch of the Finniss River should beconducted in 1993 to establish the effects of rehabilitation. The results should becompared with relevant sections of the pre-rehabilitation survey (Davy 1975). Costshave not yet been estimated.
The above costs for various monitoring programs includes the preparation of annualreports by the three agencies. Costs are summarised in Section 11.6, Table 11.1.
Page 158 Rum Jungle Monitoring Report

The question of who funds the monitoring program should be resolved by negotiationbetween the Commonwealth and Northern Territory Governments. The Rum JungleLiaison Committee noted that "In order to terminate the Agreement, it is almost acondition precedent that some arrangements be put in place relating to funding ofmonitoring and maintenance." Morison has previously suggested a recurring grant orannual appropriation.
11.5 MAINTENANCE
Maintenance entails considering three issues:
The rehabilitation works have a minimum engineered design life of 100 years, andso a certain amount of (unquantified) deterioration is to be expected (Allen &Verhoeven 1986).
A basic amount of regular 'preventative' maintenance is required to preserve theintegrity of rehabilitation (Allen & Verhoeven 1986). The maintenance programis aimed at achieving this, and meeting the minimum requirements imposed by theland use plan described in Section 11.2.
Reinstatement of damaged structures or badly eroded covers, etc resulting fromunusual and/or unforeseen events. These large scale failures threaten the integrityof the rehabilitation works, and would require special, one-off attention by theCommonwealth and Northern Territory Governments.
The program of regular maintenance is to be defined as a result of the annual siteinspections carried out by CCNT staff, described in Section 11.4. The maintenanceprogram will inëlude:
Maintenance of vegetation
The two year period of maintenance to 1988 has not permitted sufficient time toensure site revegetation to the point where maintenance fertilisation and slashingcan cease. One more fertilisation is probably required in 1990 (cost $25,000), theneed for this to be assessed in 1989. Slashing is still required, but can bereduced from half yearly to yearly (cost $3,000). Slashing should be carried outat the end of each wet season, after seed set. The need for slashing should bereviewed annually, for the five years to 1993.
Maintenance of rediversion works
This entails the removal of any accumulated debris from the culverts and weirs.
Fencing and fire breaks
At the end of the wet season, inspect and repair the cattleproof fences around thesite and around the filter cake disposal area. Inspect and maintain the fire breakaround the site perimeter fence. Cost is estimated to be $500 annually. The needfor this work is to be reviewed annually.
Rum Jungle Monitoring Report Page 159
Roadworks
Inspect and repair the designated road pavements to maintain serviceability, to thestandard of gravel all weather roads (cost $1,000 annually).
Fauna control
On completion of repairs to fencing assess the presence of problem fauna such asferal buffalo. Eradicate from within the site if numbers become high.
Weeds
Inspect annually and keep at tolerable levels by the use of herbicides and mowing,weeds including Hyptis sauveolens, Sida acuta and Mimosa pigra (cost $500 in1988/89, to be reviewed annually).
As with monitoring, the Liaison Committee has recognised the need for maintenance,with its funding being by a recurring grant or annual appropriation (Rum Jungle LiaisonCommittee, 1985). Costs are summarised in Section 11.6, Table 11.2.
11.6 CONCLUSIONS AND RECOMMENDATIONS
Future use of the Rum Jungle mine site is subject to determination of the Finniss RiverLand Claim and joint Commonwealth/Northern Territory requirements for appropriate sitemanagement.
To ensure the lasting integrity of the rehabilitation measures it is necessary to properlymanage the site and to maintain the rehabilitation measures by:
Declaring the site a Restricted Use Area as defined in Clause 20 of theConservation and Land Utilisation Act 1980.
Having the site administered by the Conservation Commission of the NT.
Implementing the land uses and restrictions described in Section 11.3.
Monitoring agencies PAWA, Ansto and CCNT carrying out the reduced program ofmonitoring as described in Section 11.4.
CCNT administering the carrying out of the 'preventative' maintenance programdescribed in Section 11.5.
The programs for monitoring and maintenance should be reviewed annually, with theview to further reductions, and possible phasing out the monitoring by 1993.
The total costs (including salaries) are summarised in Table 11.1. Funding of the workis subject to negotiation between the Commonwealth and Northern TerritoryGovernments.
Page 160 Rum Jungle Monitoring Report

Rum
Jungle Monitoring R
eport Page 161
- salaries (A.N.S.LO.) 12 000 12 000 6 000 6 000 6 000(P.A.W.A.) 700 700 700 700 700
- operational (Commonwealth) 12 500 12 500 6 500 6 500 6 500TOTAL 25200 25200 13200 13200 13200
Table 11.1 - Cost sharing for Rum Jungle monitoring and maintenance
programme 1988/89 - 1992/93
ACTIVITY 1988/89 1989/90 1990/91 1991/92 1992/93
* MONITORING
(1) Water quality rainfall -- salaries (P.A.W.A.) 12 300 12 300 12 300 12 300 12 300- operational (Commonwealth 5 200 5 200 5 200 5 200 5 200
TOTAL 17500 17500 17500 17500 17500
(ii) Open Cuts- salaries (P.A.W.A.) 3 400 3 400- operational (Commonwealth) 3 000 -- 3 000 --
TOTAL 6400 6400
(iii) Overburden Heaps
a (iv) Site Integrity- salaries (C.C.N.T.) 1 000 1 000 1 000 1 000 1 000I - operational (Commonwealth)
TOTAL500
1500500
1500500
1500500
1500500
1500
- Agencies 29 400 26000 23400 20000 20000- Commonwealth 21 200 18000 15000 12200 12200
0
(v) Flora & Fauna SurveyC.C.N.T. To be
estimated
TOTAL MONITORING

Page 162 Rum
Jungle Monitoring R
eport
I
a
Table 11.1 Cont'd
Salaries contributed by agencies (P.A.W.A, C.C.N.T., A.N.S.T.O.). Operational costs funded by Commonwealth
All maintenance costs funded by Commonwealth.
ACTIVITY 1988/89 1989/90 1990,91 1991/921992/93
MAINTENANCE
(i) Vegetation- fertilising 25000 -- slashing
(ii) Rediversion works
(iii) Fencing and fire breaks
3000
500
3000
500
3000
500
3000
500
3000
500
(iv) Roadworks
(v) Fauna control
(iv) Weeds
1000
500
1000 1000 1000
7
1000
2
TOTAL MAINTENANCE
- Agencies-Commonwealth 5000 29000 4500 4500 4500
TOTAL
- Agencies 29000 26000 23 400 20000 20000- Commonwealth 26 200 47 700 19 700 16 700 16 700

12. REFERENCES
Allen C.G. & T.J. Verhoeven (1986), "The Rum Jungle Rehabilitation Project, FinalProject Report", Northern Territory Department of Mines and Energy for theCommonwealth Department of Resources and Energy.
Allen C.G. (1986), "Projects Manager's Report to Liaison Committee, March 1986",Internal Report to the Northern Territory Department of Mines and Energy.
Anon. (1978), "Alternatives for Pollution Control and Rehabilitation at Rum Jungle,Third Draft", Internal Report. Department of the Northern Territory.
Ashton, D. M. (1975), "The root and shoot development of Eucalyptus regnans F.Muell", Aust. J. Bot. 23 867-87.
Australian Groundwater Consultants Pty Limited (1987), "Interim report on rehabilitationmonitoring at Rum Jungle, August 1987", Job No. 4030.
Australian Groundwater Consultants Pty Limited (1988), "Rehabilitation monitoring andassessment at Rum Jungle, May 1988". Job No. 4030.
Bennett, J.W., Harries J.R. & Ritchie, A.T.M. (1989), "Chemical Activity and WaterBalance of the Overburden Heaps at Rum Jungle", ANSTO/C84.
Bilan, M. V. (1971), "Some aspects of tree root distribution", in Hacskaylo,"Mycorrhizae", U.S. Gov, Printing Office.
Blackford M. G. & Harries J. R. (1985), "A Heat Source Probe for measuring thermalconductivity in waste rock dumps", AAEC/E609.
Daniel, J.A. Harries, J.R. & Ritchie, A.T.M. (1982), Runoff and seepage from waste rockdumps containing pyritic material. Hydrology and Water Resources SymposiumMelbourne.
Davy, D.R. (1975), Rum Jungle Environmental Studies, AAEC/365.
Dell, B., Bartle, J. R., and Tacey, W. H. (1983), "Root occupation at root channels ofJarrah forest subsoils" Aust. I. Botany 31, 6 15-27.
Department of the Northern Territory (1978), Rehabilitation at Rum Jungle, Report ofthe Working Group, Unpublished confidential report.
Gibson, D. K. (1987), "Mathematical study of a lysimeter," ANSTO/E666.
Gibson, D,K. & Pantelis, G. (1988), Forecasting the effect of mine site rehabilitationworks on local ground water quality. Proc. 1988 Mine Drainage and Surface MineReclamation Conference, Pittsburgh Pen sylvania.
Rum Jungle Monitoring Report Page 163

Hurries, J, R. & Ritchie A, I. M. (1980), "The use of temperature profiles to estimatethe pyritic oxidation rate in a waste rock dump from an opencut mine," Water Air SoilPollut. 15, 405-423.
Harries, J.R. & Ritchie, A.1.M. (1982), Pyritic Oxidation in Mine Wastes: Its incidence,Its Impact on Water Quality and Its Control. Proc. Symp. Prediction in Water Quality,Canberra, 347-377.
Harries, J. R. & Ritchie A. I. M. (1985), "Pore gas composition in waste rock dumpsundergoing pyritic oxidation." Soil Sci. 140, 143-152.
Harries, J. R. & Ritchie A. I. M. (1987), "The effect of rehabilitation on the rate ofoxidation of pyrite in a mine waste rock dump", Environ. Geochem, Health 9, 27-36.
Henkel, C.H.R.F., Alcock, i.E., (l987a) "East Finniss River and Finniss River PollutionStudy 1986-87", Water Resources Division, Department of Mines and Energy.
Henkel, C.H.R.P. & Alcock, J.F. (1987b), Rum Jungle Mine Rehabilitation ProjectWhite's Open Cut and Intermediate Open Cut Water Quality 1985/86, Power and WaterAuthority, Water Directorate Report 2/1987.
Henkel, C.H.R.F. & Alcock, J.F. (1988a), East Finniss River and Finniss River PollutionStudy 1986-87, Power and Water Authority, Water Directorate Report 98/1988.
Henkel, C.H. & Alcock, J.F. (1988b), Rum Jungle Mine White's Open Cut and theIntermediate Open Cut Water Quality 1986-87, Power and Water Authority, WaterDirectorate 97/1988.
Henkel, C. H. R. F. (1989), East Finniss River and Finniss River Pollution Study 1987-1988, Power and Water Authority, Water Directorate 89/..........
Kleppe, J. H. & Olson, R. E. (1985), Dessication cracking of soil barriers" in Johnsonet al,, "Hydraulic Barriers in Soil and Rock", American Society of Testing andMaterials.
Lyr, H. & Hoffman, G. (1967), "Growth of tree roots", International Review of ForestryResearch 2.
Mining and Process Engineering Services (1982), Rum Jungle Rehabilitation Project,Engineering Report, Northern Territory Department of Transport and Works.
Morison, I.W. (1985), Matters For Consideration Prior To Termination Of The RumJungle Rehabilitation Agreement. Unpublished paper prepared for the Fifth Meeting ofLiaison Committee.
O'Donovan, B.J. (1983), Rum Jungle Rehabilitation Project, Memorandum of Agreement,Commonwealth Crown Solicitor.
Pantelis, G. (1987), Modelling water and contaminant transport in the Rum Jungle mineoverburden heaps. AAEC/E653.
Page 164 Rum Jungle Monitoring Report

Pantelis, G. (1988a), "Modelling water and contaminant transport in unconfinedaquifers" Computational Methods in Water Resources 2, 207-211.
Pantelis, 0. (1988b), "Asymptotic theory for saturated-unsaturated flow in a layered andheterogeneous unconfined aquifer", Math. Comp. Model (in press).
Rum Jungle Liaison Committee, (1985), Minutes of the Fifth Liaison CommitteeMeeting.
Ryan, P. (1986), Rum Jungle Rehabilitation Project, Summary of RevegetationMonitoring and Recommendations. Conservation Commission of the Northen Territory.
Ryan, P. (1987), "Rum Jungle Mine Rehabilitation - Northern Territory", J. Soil ConsN.S.W. 43:1, 18-27.
Waldron, L. J. & Dakessian, 5. (1982). "Effect of grass, legume and tree roots on soilshearing resistance", Soil Sci. Soc. Am. J. Vol. 46:5, 894-99.
Rum Jungle Monitoring Report Page 185
APPENDIX A
SURFACE WATER HYDROLOGY(Chapter 4)
FIG URES
Page 167

RA
IN
FA
LL m
m/day
C
-t
10 20 30 40
p
Hi i
50 60-I
DAY
Figure 4.3 1986-87 Mine site rainfall at pluvio R815202A
70 80-L I iiiiliii I i i i i i ''j
120 130 140 150
0-oN
1-J
U-
2:I-
cr1
70
60
50
40
20
10
''
1
V' r -
P1
] -1 tt -T T T-T-j-1-r--1--T- J r
F-
----------------
H
m-i-t-r 1 I I I I I I
d -ii
100 110

RA
INF
ALL
mm
/day
80 cm I F r i- --i--rr rr---r----r---r-- r 11 r r-rr r rT-m r 1 F-ri- V r I- r i-I I I -r-1--r '1! 1r-i- F r
60
>'U
-oN£F
-J 40-JCU-z nI-1C
20
11
0 in in 2 2 Ti Iii rn- liliiiii I 'iii, iii,0 20 40 60 80 100 120 140
hE DAY
Figure 4.4 1987-88 Mine site rainfall at pluvio R815202A

Page 170
>'C
-D600
0
><
-J
4000-JU-
800
200
0
r1T-rTrTrrT I rf r-rcr- ri, fir rr[rrTi tTijli I''
L0 10 20 30 40 50 60 70 80 90 100 110 20 130
DAY
Figure 4.5 1986-87 East Finniss River flow volume at GS8150097
-4
I I I
140 150
1
r

100
00
DAY
Tft20 40 50 80 100 120 140
Figure 4.6 1987-88 East Finniss River flow volume at GS8150097
400 r r-r r r-r-fl---r-r-r---i---r- 1r T r -fir ,-r----rr T r 1r,- r'rh T r r r rrcr fl r r c -T T-T I
300

Page 172
r f ' Tr rr_rrmrrjrrT T T 1 -r T - r-rT---r J1 1 I V rr r Cr r I T
6 r
I0
5
ii p - I - - - - I I-
4 LA-AL IIIIIIIIIII.IIIIIPJPPP .----.-.---.0 10 20 30 40 50 60 70 80 90 100 110 20 130 140 150
DAY
Figure 4.7 1986-87 East Finniss pH at GS8150097

0 10 20 30 40 50 50 70 80
DAY
90 190
Figure 4.8 1986-87 East Finniss River specific conductance at GS8150097
rrrr FT r I -T T rrflr
.J0 120 130 140
I
-J
1200
1000
800
600
400
200
0
r I r -i-i- I r tt -T I
P
flI IT1
L-iII
1
r7rt-r-r
II
fY r I I I T-I-r-cf--1--
H
j
-i

COPPER
CONCENTRATION
m9/L
4
JN3ciiE
7:C
1
H
Hz2uJL)7:0Ucr:w0EL01U
r I I I rrcr-1T -r - F C (ri; I nTr 1
1L
J
C
'r r-rrr1r i -I- I 1 - rrr-1
1
r-I
J
0 10 20 30 40 50 60 70 80 90 100 110 120 130 140 150
DAY
Figure 4.9 1986-87 East Finniss River copper concentration at GS8150097

T1 iir-j-iiii IlilIIII Tj I t-rI--]-1-r-I-i jiriI1irIi1iiiu1iiiiJIiIi
-JN013E
L
1r
0 I lilt It iii I I0 10 20 30 40 50 50 70 80 90 iOU flU 120 130 140 50
- DAY
Figure 4.10 1986-87 East Finniss River manganese concentration at GS8150097

ZINC
CONCENTRATION
4 flr rr-r]- r r I T -T Cr fl I F r r-1 rr rrymrcr1 F T r r Cr CCC F I I I I I
Ut
NIH
11,1 II III5 10 20 30 40 50 60 70 80 90 100 110 120 30 140 150
DAY
Figure 4.11 1986-87 East Finniss River zinc concentration at GS8150097

20 30 40 50 60 70 80 90 100 110 i20 i30 140 150
DAY
Figure 4.12 1986-87 East Finniss River suiphate concentration at GS8150097
600 I'T T I r fl I I I rlr 1111111 I T I I r CT I
-jNci -E
400
cL
200k-
-
Ui
I I I I
I I II U

Page 178
7 TCT 1 I I I m-r-l-rT-r-r1 T 11 r -1 1 -r -i--
Fr, I F 1 t t ri i C! 1 -r--r-I m -r r V
T
-I
1n
Li
1
Li
I0
1
51
-F
4111111 IIIIIIIIIIIIIIIIIIIIIIIIIII
0 20 40 50 80 100 120 140
DAY
Figure 4.13 1987-88 East Finniss River pH at GS8150097

SP
EC
IFIC
C
ON
DU
CT
AN
CE
20 40 60 80 100 120 40
DAY
Figure 4.14 1987-88 East Finniss River specific conductance at GS8150097
2000
1500-
1000-
500
0
rr,IIIII,jIJTlI rr-r I1IIIjr
L.
IIIJrII,II rr II
I rrT 1 1 r T 1 -r r-r-rr 1

5 r1 - I--I--I I Iirrr I it Ii 111! I 11 i 1Iiri i rIiiz
[lAY
IliMinilNi N
Figure 4.15 1987-83 East Finniss River copper concentration at GS8150097
.nUniMIMI
20 40 50 80 100 140

1 F I-ci-r 1T1 1 1 T 1 1 1 Fl I t1TI11 1 ] I 1 I -T 1 11 1 1 1 1 1 T T 1 1 I 1 1T1 TT [I F
zLUL)zCLi2LU01wz(2zxl
LL20 40 60 80 100 120 140
DAY
Figure 4.16 1987-88 East Finniss River manganese concentration at GS8150097

ZINC
CONCENTRATION
mg/L
-J
D)E
zC
Ca:HzwLJ3zCLi
(-3z-INJ
7 inI
j II C -i -r i-r -rT 1 r 1 I VI CT Tr r-r1 1 1 I I r-flrrrTT-r 1 1 r r, Tr-1 mT 1
20 40 60 80 100 120 140
DAY
Figure 4.17 1987-88 East Finniss River zinc concentration at GS8150097
IUINIIflhNIMIMI!IIII I I tuliP IIiiiIiiiiiiIIINhl

SULPHATE
CONCENTRATION
mg/L
200
L1
L.
900
600
400
2000 tt rn r-1r-, 1i1t I I T 1 r-r I r 1 11117111 1 1 1 I 1 1 I 1 1 1 I 11 mr lf r1 T 1 T-rrri r r1 11 1 -1-r 1 -r
0 I I
0 20 40 50 90 100 120 140
DAY
Ce
Figure 4.18 1987-88 East Finniss River sulphate concentration at GS8150097

LOP
PE
R
LOA
D
CT r I I CflTt T
1
0 10 20 30 40 50 60 70 80
DAY
Figure 4.19 1986-87 East Finniss River copper loads at GS8150097
90 100 110 120 130 140 150
400
300
200
100
0 _.I,___I___.I I i i i
I T
I I i i
I I I
i I i
rT-I
i i i
11
I i i i I i
1
I L
T
I i i
I ''
L__1
'
1-k__I

MA
NG
AN
ES
E
LOA
D
k9/day
10 20 30
1
40 50 60 70 80 90 100 110 120 130 140 150
DAY
Figure 4.20 1986-87 East Finniss River manganese loads at GS8150097
500
400
300
200
100
IT Ir I I I ryrrI I I r Ijrri I
[1
rmr r 11111 T I
-4
-1
ii

ZN
C
LOA
D
kg/day
100
80
50
40
20
0
rtr1I i -rrr 1
1
I1;PjII r1[i II r TV{
r
I i ijj LIII10 20 30 40 50 60 70 80 90 100 110 120 130 140 150
DAY
Figure 4.21 1986-87 East Finniss River zinc loads at GS8150097

SU
LPH
AT
E
LOA
D
t/day
-4
200
100
00
I -, n
It-10 20 30 40 50 60 70 80 90 100 110 120 130 140 150
DAY
Figure 4.22 1986-87 East Finniss River sulphate loads at GS8150097
1
1l 4-
rfrrrr1-1-rTi1ipir 1

CO
FF
ER
LO
AD
k9/day
300
200
100'-
0
FIT F rTT V r i T--r-l--r-1--l--j---T-1--r-r-7---r---r F F1 T I FIlIi F iV ri- rr rf F T-UI rr-r rr I r I I iFF
F
IIuIItIn_IIIn___ lijin20
U-
40 50
DAY
80 100
Figure 4.23 1987-88 East Finniss River copper loads at GS8150097
19S 1 40

MA
NG
AN
ESE
L
OA
D
k9/d
400
300
200
100
00
r-rT -T-
L
Li
DAY
Figure 4.24 1987-88 East Finniss River manganese loads at GS8150097
1 1
T
1
L
r I20 49 50 80 190 120 140
I -I--r 1 I F 1 t r 17 I I I 1 -, F T1T r-T--rj
I 1 1 1 I r I I rrT- 1 r r-r-r-1 r - - I I T r 111
1

ZIN
C
LOA
D
kg/dc>'
0
I II
I I I 1 i -r I frr-Y r r I T C CnCT -r r r r r I- r I I F
L
1
1
F
20 40 50 80 100 120 140
DAY
Figure 4.25 1987-88 East Finniss River daily zinc loads at GS8150097
100
80
50
40
20
0
1 I I
E
I
1-
1I r-rr r rr F

SU
LPH
AT
E
LOA
D
t/day
100
90
60
40
20L
L
0
r 1r1-r--r r-r-11 r 1 1 I I I-r-T---rj-r-1-rr r 1 I I I rrT-r-- rr-T--r I I T I j I I r-flti rrI t 1 r F
II I UlMun. n boil I I idA
H
fl 1
20 40 60 90 100 120 140
DAY
Figure 4.26 1987-88 East Finniss River sulphate loads at GS8150097

RADIUM22B
CONCENTRATION
mliii
600
400
200
00 10 20 30 40 50 60 70
DAY
Figure 4.27 1986-87 East Finniss radium-226 concentrations at GS8150097
r
80 90 100 110 120 130 140 150
F -c1r r I 1 I I I -r -- r myIIIIJ'r rTrrrr II I
-T tII I i i i I i i iii

RA
DIU
M-226
CO
NC
EN
TR
AT
ION
m
liii B
q/L
I
300 T rT 1 T T 1 t tf r r tcr rrmrflr Trrrt -T Cr rr T I T T I
200
100 L.fl 1
020 40 60 80 100 120 140
DAY
Figure 4.28 1987-88 East Finniss River radium-226 concentrations at GS8150097

00
rH
DAY
1
Figure 4.29 1986-87 East Finniss River radium-226 loads at GS8150097
-I
iii100 flU 120 130 140 150
100 -'--i' IIIIr -j I 1fl r-1-r
rP-a
I'.80
NC'-1
-Jwcyw
60L
CC LLiuJm
o 40CC-J
C
< 20 V
F 11111 11111 tII 1 I 1 T I T I I I j I 1
10 20 30 40 50 60 80 90-UI IIIltIIIIIILIIII

RADIUM-226
LOAD
8ELOUEREL
X
/day
30
>,'U-oN
C
-j 20uj
LU
CLiLUEn
CC-j(0(\J
CCIt
U0
1
r
I I I ' I I IIV I I I J flrrIrm V I r 1---rr-T-rr 1 1 1 1
DAY
100
Figure 4.30 1987-88 East Finniss River radinm-226 loads at GS8150097
1 20II Phi IIIIIPIPIIINIMIMIflhiirni..__._..
I
I 4J8040 60

FLO
W
L/s
300O-
L
1 0001-
0
1 /
I'
/T:r4. trn4 r
I -r 1 1 I I IJ
I I I rI I t I -r I I t I I
/ %',-/ -%
/ '.-I
/
POINT 5998 1502000 88 150209
- 988150210
40 60 80 100 120 140
DAY
Figure 4.31 1986-87 mine site flow measurements

COPPER
CONCENTRATIONS
10
040
r I I
N
I II
I I -r -i- -r I I r I I
POINT 5098150200098150209058150210
-I.60 80 100
DAY
Figure 4.32 1986-87 mine site copper concentrations
120 140
2
NciE
U)2:C6Hcc
HzwU2:c4U
LU0a-CU

MANGANESE
CONCENTRATIONS
m9/L
-JNmE
z0
CrIF-zU-!C-)z002w(I-)UJzCCDzCl
r r T TC r 1
DAY
Figure 4.33 1986-87 mine site manganese concentrations
T
POINT 5OSS 1502000 58 15 0209@58150210
I I ITT I I T11TT I
V
100
-C----: T- -120 140

Page 199
JNciiE
Lf)zCHCH2:LULi2:Cc-i
Li2:
10 I r
POINT 5098150200058150209098150210
40 60 80 100
DAY
Figure 4.34 1986-87 mine site zinc concentrations
0 I J I I
120 1 40

SULPHATE
CONCENTRATIONS
1500
1000
500
040
\/
tiii T
50I I I
80
POINT 5058150200938150209938 150210
-
100
DAY
Figure 4.35 1986-87 mine site sulphate concentrations
I I I
120 140
m I I I rr-r1r 1 -1r I I I r -r1- 1 C I -r r rr r-r Ir

CO
PP
ER
LO
AD
S
I
040
A
tiN fNI N_/1
/
50
V
80
DAY
Figure 4.36 1986-87 mine site copper loads
IJ 1-i---,- I I I r r Cr
POINT 5@88150200@38 150209@88150210INTER 0/C OUTFLOWPOINT 5 - @38150209
100 120 140

Page 202
(1)
mI:UJc
CczC-jUJ
FU)LUZti'(13z
II
040
A
60
r m r I I T i -z -r z--r
-'I
80
POINT 5988 150200938 150299
- 938150210
3INTER 0/0 OUTFLOWPOINT 5 - 938150209
DAY
Figure 4.37 1986-87 mine site manganese loads
100 1 20 140

Page 203
3
POINT 5038150200038150209038150210INTER 0/L OUTFLOWPOINT 5 - 098150209
40 60 80 100 1 20 140
DAY
Figure 4.38 1986-87 mine site zinc loads

SU
LPH
AT
E
LOA
DS
1000
500
r rvjl DI] I I r r I -rr-r-rrr-r-f t r T r I I -r r II
F r-r I
:1
POINT 5@38150200@58 150209058150210INTER 0/CPOINT 5 -
OUTFLOW
@381502 09
040 60 80 100 120 1 40
DAY
Figure 4.39 1986-87 mine site sulphate loads
1500
I

APPENDIX B
SURFACE WATER HYDROLOGY(Chapter 4)
TABLES
Page 205

Table 4.2 1986-87 Day To Date Conversion Table
Page 206
DAY DATE DAY DATE DAY DATE
1 04/12/86 51 23/01/87 101 14/03/872 05/12/86 52 24/01/87 102 15/03/873 06/12/86 53 25/01/87 103 16/03/874 07/12/86 54 26/01/87 104 17/03/875 08/12/86 55 27/01/87 105 18/03/876 09/12/86 56 28/01/87 106 19/03/877 10/12/86 57 29/01/87 107 20/03/878 11/12/86 58 30/01/87 108 21/03/879 12/12/86 59 31/01/87 109 22/03/87
10 13/12/86 60 01/02/87 110 23/02/8711 14/12/86 61 02/02/87 111 24/03/8712 15/12/86 62 03/02/87 112 25/03/8713 16/12/86 63 04/02/87 113 26/03/8714 17/12/86 64 05/02/87 114 27/03/8715 18/12/86 65 06/02/87 115 28/03/8716 19/12/86 66 07/02/87 116 29/03/8717 20/12/86 67 08/02/87 117 30/03/8718 21/12/86 68 09/02/87 118 31/03/8719 22/12/86 69 10/02/87 119 01/04/8720 23/12/86 70 11/02/87 120 02/04/872! 24/12/86 71 12/02/87 121 03/04/8722 25/12/86 72 13/02/87 122 04/04/8723 26/12/86 73 14/02/87 123 05/04/8724 27/12/86 74 15/02/87 124 06/04/8725 28/12/86 75 16/02/87 125 07/04/8726 29/12/86 76 17/02/87 126 08/04/8727 30/12/86 77 18/02/87 127 09/04/8728 3 1/12/86 78 19/02/87 128 10/04/8729 01/01/87 79 20/02/87 129 11/04/8730 02/01/87 80 21/02/87 130 12/04/8731 03/01/87 81 22/02/87 131 13/04/8732 04/01/87 82 23/02/87 132 14/04/8733 05/01/87 83 24/02/87 133 15/04/8734 06/01/87 84 25/02/87 134 16/04/8735 07/01/87 85 26/02/87 135 17/04/8736 08/01/87 86 27/02/87 136 18/04/8737 09/01/87 87 28/02/87 137 19/04/8738 10/01/87 88 01/03/87 138 20/04/8739 11/01/87 89 02/03/87 139 21/04/8740 12/01/87 90 03/03/87 140 22/04/8741 13/01/87 91 04/03/87 141 23/04/8742 14/01/87 92 05/03/87 142 24/04/8743 15/01/87 93 06/03/87 143 25/04/8744 16/01/87 94 07/03/87 144 26/04/8745 17/01/87 95 08/03/87 145 27/04/8746 18/01/87 96 09/03/87 146 28/04/8747 19/01/87 97 10/03/87 147 29/04/8748 20/01/87 98 11/03/87 148 30/04/8749 21/01/87 99 12/03/87 149 01/05/8750 22/01/87 100 13/03/87 150 02/05/87

Table 4.3 1987-88 Day to Date Conversion Table
Page 207
DAY DATE DAY DATE DAY DATE
21-12-87 48 06-02-88 95 24-03-882 22-12-87 49 07-02-88 96 25-03-883 23-12-87 50 08-02-88 97 26-03-884 24-12-87 51 09-02-88 98 27-03-885 25-12-87 52 10-02-88 99 28-03-886 26-12-87 53 11-02-88 100 29-03-887 27-12-87 54 12-02-88 101 30-03-888 28-12-87 55 13-02-88 102 31-03-889 29-12-87 56 14-02-88 103 01-04-8810 30-12-87 57 15-02-88 104 02-04-8811 31-12-87 58 16-02-88 105 03-04-8812 01-01-88 59 17-02-88 106 04-04-8813 02-01-88 60 18-02-88 107 05-04-8814 03-01-88 61 19-02-88 108 06-04-8815 04-01-88 62 20-02-88 109 07-04-8816 05-01-88 63 21-02-88 110 08-04-8817 06-01-88 64 22-02-88 111 09-04-8818 07-01-88 65 23-02-88 112 10-04-8819 08-01-88 66 24-02-88 113 11-14-8820 09-01-88 67 25-02-88 114 12-04-8821 10-01-88 68 26-02-88 115 13-04-8822 11-01-88 69 27-02-88 116 14-04-8823 12-01-88 70 28-02-88 117 15-04-8824 13-01-88 71 29-02-88 118 16-04-8825 14-01-88 72 01-03-88 119 17-04-8826 15-01-88 73 02-03-88 120 18-04-8827 16-01-88 74 03-03-88 121 19-04-8828 17-01-88 75 04-03-88 122 20-04-8829 18-01-88 76 05-03-88 123 21-04-8830 19-01-88 77 06-03-88 124 22-04-8831 20-01-88 78 07-03-88 125 23-04-8832 21-01-88 79 08-03-88 126 24-04-8833 22-01-88 80 09-03-88 127 25-04-8834 23-01-88 81 10-03-88 128 26-04-8835 24-01-88 82 11-03-88 129 27-04-8836 25-01-88 83 12-03-88 130 28-04-8837 26-01-88 84 13-03-88 131 29-04-8838 27-01-88 85 14-03-88 132 30-04-8839 28-01-88 86 15-03-88 133 01-05-8840 29-01-88 87 16-03-88 134 02-05-8841 30-01-88 88 17-03-88 135 03-05-8842 31-01-88 89 18-03-88 136 04-05-8843 01-02-88 90 19-03-88 137 05-05-8844 02-02-88 91 20-03-88 138 06-05-8845 03-02-88 92 21-03-88 139 07-05-8846 04-02-88 93 22-03-88 140 05-02-8847 05-02-88 94 23-03-88 141 09-05-88

Table 4.4 1986-87 East Finniss River Water Quality at GS8150097
Page 208
DATE FLOW(1 X 10⁶)
pH COND Cu Mn Zn(pS/cm) (mg/I)
SO4 Ra226(mflq/l)
04-12-86 21.3 6.4 88 .05 .37 .56 38 27005-12-86 3.15 6.1 190 .30 1.0 .27 83 35006-12-86 4.3107-12-86 1.66 NO SAMPLE TAKEN08-12-86 .44309-12-86 8.00 4.7 580 2.7 2.9 1.5 290 61010-12-86 3.27 4.6 600 2.6 2.6 1.5 300 41011-12-86 .873 4.5 700 3.4 3.7 3.6 350 42012-12-86 .128 4.6 800 3.2 3.5 3.3 410 53013-12-86 .018 4.6 820 3.4 3.7 3.5 510 56014-12-8615-12-8616-12-8617-12-8618-12-8619-12-8620-12-862 1-12-8622-12-8623-12-8624-12-8625-12-8626-12-8627-12-86 NO FLOW28-12-8629-12-8630-12-863 1-12-8601-01-8702-01-8703-01-8704-01-8705 -0 1-8706-01-8707-01-8708-01-8709-01-8710-01-8711-01-8712-01-8713-01-8714-01-8715-01-87 23.8 1.6 2.1 1.3 35016-01-87 59.7 1.5 1.3 .69 25017-01-87 99.4 5.3 1 120 1.3 1.5 .34 600 11018-01-87 124 5.1 920 1.1 1.4 .33 460 14019-01-87 50.4 5.2 1 020 1.1 1.6 .39 530 9420-01-87 28.3 4.9 860 1.3 1.5 .75 420 8021-01-87 44.2 5.0 800 1.5 1.4 .72 390 8022-01-87 29.9 4.8 740 1.4 1.3 .57 360 110

Page 209
DATE FLOW(I X 106)
pH COND(pS/cm)
Cu Mn Zn(mg/I)
SO4 Ra-226(mBq/l)
23-01-87 18.6 4.7 980 1.8 1.8 .76 510 7824-01-87 13.8 4.8 960 2.1 1.8 1.1 480 11025-01-87 13.9 4.7 790 1.8 1.5 .98 380 10026-01-87 13.2 4.7 860 2.1 1.7 1.4 440 8227-01-87 11.3 4.7 770 1.8 1.5 1.1 370 8028-01-87 99.4 4.9 710 1.4 1.4 1.0 310 8929-01-87 95.9 4.8 590 1.4 1.2 .92 270 8030-01-87 8.90 4.7 600 1.4 1.2 1.1 280 8031-01-87 20.7 4.6 580 1.4 1.1 .98 270 10001-02-87 170 4.9 670 .90 .90 .40 310 9402-02-87 226 5.2 1 010 1.2 1.2 .28 510 6903-02-87 253 5.1 1 090 1.3 1.3 .26 570 7304-02-87 222 5.3 930 1.0 1.1 .26 470 5205-02-87 207 5.2 880 .95 1.1 .26 420 5306-02-87 366 5.3 920 .95 1.1 .22 460 6507-02-87 194 5.6 810 .80 1.0 .24 400 4508-02-87 200 5.0 570 .60 .80 .24 260 8009-02-87 740 5.7 450 .25 .60 .10 200 12010-02-87 353 5.4 630 .50 .80 .18 290 8011-02-87 414 5.4 620 .40 .80 .16 290 5112-02-87 204 5.8 580 .45 .75 .18 260 4213-02-87 154 6.1 490 .45 .70 .22 220 4214-02-87 178 5.9 460 .43 .65 .23 210 5415-02-87 232 5.8 390 .37 .57 .19 180 5816-02-87 261 6.0 450 .38 .62 .18 200 4617-02-87 247 6.0 430 .42 .61 .20 190 3918-02-87 264 6.2 430 .33 .59 .17 190 4919-02-87 351 6.1 310 .24 .43 .15 130 5320-02-87 359 6.2 380 .25 .52 .13 160 5321-02-87 239 6.6 370 .25 .50 .14 160 4422-02-87 524 6.5 330 .15 .40 .10 140 4323-02-87 826 6.7 290 .10 .35 .08 120 6624-02-87 491 6.5 390 .15 .50 .10 170 5325-02-87 275 6.5 410 .25 .55 .14 180 4526-02-87 214 6.4 390 .25 .55 .16 170 3127-02-87 266 6.2 350 .25 .50 .16 150 4728-02-87 284 6.3 350 .25 .50 .12 150 3301-03-87 214 6.3 340 .30 .50 .14 140 3502-03-87 173 6.4 330 .30 .45 .16 140 5203-03-87 148 6.4 330 .30 .45 .18 140 4204-03-87 135 6.3 320 .25 .45 .18 140 3405-03-87 121 6.3 310 .30 .45 .20 130 3906-03-87 111 6.1 320 .35 .45 .20 130 2607-03-87 100 6.0 310 .32 .45 .23 130 3408-03-87 89.9 6.1 310 .32 .44 .24 140 3809-03-87 80.5 6.1 320 .31 .44 .26 140 3810-03-87 73.3 6.3 330 .33 .44 .27 140 3311-03-87 146 5.8 270 .40 .40 .24 120 7912-03-87 232 5.9 270 .27 .43 .15 120 4113-03-87 141 6.2 290 .26 .43 .17 120 3614-03-87 102 6.1 290 .26 .43 .19 120 35

Page 210
Table 4.4 Cont'd
DATE FLOW(I X 106)
pH COND(pS/cm)
Cu Mn Zn(mg/I)
SO4 Ra-226(mBqII)
15-03-87 81.7 6.1 310 .27 .44 .23 130 3116-03-87 71.1 6.1 240 .16 .21 .23 97 3217-03-87 65.0 6.1 310 .31 .44 .26 130 3318-03-87 61.8 6.2 310 .28 .44 .21 130 5419-03-87 56.6 6.2 330 .30 .45 .28 140 2920-03-87 51.9 5.9 340 .35 .46 .31 150 2921-03-87 302 6.0 280 .20 .56 .17 100 5822-03-87 280 6.0 300 .20 .61 .13 110 4822-03-87 130 6,0 310 .19 .64 .15 120 3824-03-87 94.2 5.9 320 .21 .65 .20 120 3825-03-87 84.0 5.8 330 .20 .64 .21 130 3326-03-87 76.2 5.7 320 .19 .63 .20 130 4027-03-87 69.4 5.3 350 .20 .63 .22 130 3028-03-87 65.8 6.1 330 .19 .62 .23 130 3029-03-87 59.3 6.1 330 .17 .62 .23 130 2530-03-87 53.7 6.1 340 .17 .61 .23 130 3031-03-87 47.9 6.0 340 .20 .65 .25 130 31
01-04-87 40.4 5.9 300 .23 .67 .28 140 3102-04-87 35.5 5.7 380 .44 .73 .38 150 3403-04-87 31.9 5.8 380 .38 .76 .35 160 3304-04-87 28.6 6.0 410 .35 .79 .34 170 005-04-87 25.6 5.9 430 .36 .84 .37 180 4306-04-87 22.7 5.9 450 .55 .75 .45 200 4607-04-87 20.0 5.8 470 .69 1.0 .51 210 4608-04-87 17.1 5.8 500 .87 1.1 .55 220 4509-04-87 14.1 5.8 530 1.0 1.1 .61 240 4410-04-87 16.0 5.9 540 1.3 1.2 .68 240 4811-04-87 33.0 5.1 610 1.9 1.0 .84 280 5512-04-87 28.6 5.1 450 .82 .64 .49 200 4613-04-87 18.5 5.4 440 .45 .59 .46 200 3914-04-87 13.1 5.4 520 .65 .56 .69 260 5015-04-87 9.85 5.4 560 .82 .72 .66 290 5016-04-87 7.46 5.3 610 1.1 .89 .77 310 6417-04-87 5.62 5.2 670 1.4 1.0 .90 340 6418-04-87 4.70 5.2 700 1.6 1.1 .98 370 6519-04-87 3.65 5.2 730 1.7 1.1 1.1 400 9220-04-87 2.86 5.1 750 1.9 1.2 1.2 410 8921-04-87 2.23 5.0 790 2.0 1.3 1.2 430 11022-04-87 1.68 4.8 810 2.0 1.4 1.3 440 11023-04-87 1.26 4.8 830 2.1 1.4 1.3 450 14024-04-87 .890 4.8 840 2.2 1.4 1.3 450 15025-04-87 .683 4.8 850 2.2 1.5 1.3 440 16026-04-87 .419 4.8 850 2.3 1.5 1.3 430 16027-04-87 .240 4.9 830 2.2 1.5 1.3 425 20028-04-87 .165 4.9 820 2.2 1.5 1.3 420 15029-04-87 .111 4.9 810 2.2 1.5 1.3 420 19030-04-87 .061 4.9 810 2.2 1.6 1.2 420 19001-05-87 .034 4.9 820 2.2 1.5 1.2 400 21002-05-87 .012 4.8 820 2.3 1.6 1.3 450 240

Page 211
Table 4.5 1987-88 East Finniss River water quality at GS8150097
DATE FLOW(us)
pH COND(ps/cm)
Cu Mn Zn(mg/I)
SO4 Ra-226(mBajl)
21-12-87 257 4.9 400 1.4 1.5 1.9 170 25022-12-87 273 4.9 400 0.91 0.82 1.1 180 12023-12-87 807 4.8 410 0.84 0.75 0.94 180 13024-12-87 408 6.0 360 0.68 0.56 0.78 160 9825-12-87 434 4.5 630 1.7 1.2 1.6 300 19026-12-87 276 5.0 290 0.61 0.55 0.56 120 9127-12-87 108 5.1 430 0.87 0.76 0.93 200 12028-12-87 56 4.6 820 2.2 1.6 2.2 420 15029-12-87 37 4.5 900 2.4 1.9 2.4 470 17030-12-87 28 4.4 960 2.5 2.1 2.7 500 21031-12-87 24 4.5 970 2.6 2.1 2.8 510 24001-01-88 17 4.4 970 2.5 2.1 2.9 510 22002-01-88 12 4.6 970 2.5 2.1 2.7 510 24003-01-88 20 4.5 930 2.5 2.2 2.8 480 21004-01-88 33 4.5 890 2.4 2.1 2.6 470 23005-01-88 18 4.4 950 2.5 2.2 2.8 500 21006-01-88 11 4.6 940 2.5 2.2 2.7 490 24007-01-88 6 4.4 900 2.4 2.1 2.6 470 27008-01-88 3 4.5 930 2.4 2.2 2.7 480 29009-01-88 25 4.4 980 2.6 2.3 2.8 520 28010-01-88 23 4.4 1 000 2.9 2.5 3.3 580 24011-01-88 55 4.4 1 100 3.2 2.7 3.8 640 21012-01-88 38 4.3 1 400 3.9 3.3 5.6 800 24013-01-88 15 4.3 1 600 4.4 3.8 6.6 930 20014-01-88 6 4.2 1 600 4.4 4.0 6.9 950 21015-01-88 2 4.2 1 600 4.3 4.0 6.9 940 21016-01-88 908 4.5 630 1.5 1.5 0.86 300 12017-01-88 564 4.7 730 1.1 1.7 0.35 350 4718-01-88 241 4.7 720 1.2 1.7 0.42 350 5819-01-88 153 4.6 690 1.2 1.6 0.54 330 7020-01-88 412 4.7 600 1.3 1.3 0.66 280 8821-01-88 523 4.7 580 0.84 1.3 0.39 260 7822-01-88 328 4.9 610 0.68 1.4 0.40 280 7623-01-88 214 5.0 590 0.67 1.3 0.42 280 6724-01-88 186 5.2 580 0.69 1.3 0.46 270 7525-01-88 169 5.0 550 0.86 1.2 0.58 260 7426-01-88 205 5.4 500 0.69 0.96 0.54 230 8527-01-88 376 4.4 490 1.! 1.1 0.58 210 8728-01-88 319 4.7 580 0.78 1.3 0.43 270 7329-01-88 211 4.8 570 0.92 1.2 0.46 270 6730-01-88 153 5.2 540 0.64 1.1 0.52 250 5131-01-88 265 5.1 540 0.72 1.2 0.47 250 5401-02-88 405 5.0 541) 0.74 1.2 0.44 260 6102-02-88 307 4.9 570 0.99 1.3 0.45 270 4703-02-88 190 5.1 560 0.85 1.3 0.44 270 6704-02-88 139 5.1 540 0.68 1.2 0.46 250 6305-02-88 133 5.1 530 0.66 1.1 0.47 250 75

Table 4.5 Cont'd
Page 212
DATE FLOW(1/s)
pH COND(ps/cm)
Cu Mn Zn(mg/i)
SO4 Ra-226(mBaJl)
06-02-88 149 5.0 590 1.1 1.2 0.73 290 7907-02-88 126 4.7 620 1.4 1.4 0.81 310 9908-02-88 133 4.9 620 1.0 1.3 0.76 300 6809-02-88 1 270 4.9 430 0.86 0.84 0.44 200 10010-02-88 2 750 5.0 680 1.1 1.4 0.26 330 6811-02-88 1 140 4.0 670 1.2 1.4 0.31 310 5912-02-88 1 180 5.1 540 0.86 1.1 0.29 260 5813-02-88 3 010 5.6 550 0.68 1.1 0.21 260 6214-02-88 1 520 5.2 580 0.89 1.2 0.24 280 5215-02-88 1 060 5.7 520 0.60 0.84 0.45 240 4516-02-88 1 030 5.7 510 0.64 1.1 0.27 230 3617-02-88 880 5.8 470 0.47 0.96 0.25 220 2318-02-88 770 5.8 450 0.39 0.85 0.25 200 3619-02-88 690 6.0 420 0.27 0.75 0.24 190 2720-02-88 1 650 5.8 340 0.24 0.70 0.20 140 7921-02-88 2 340 5.7 440 0.47 0.87 0.18 200 7322-02-88 3 650 5,6 450 0.49 0.90 0.18 200 5623-02-88 1 790 5.8 460 0.41 0.96 0.19 200 4224-02-88 1 250 6.1 410 0.29 0.72 0.21 180 4625-02-88 1 040 6.0 390 0.24 0.68 0.21 170 2926-02-88 921 6.2 380 0.18 0.66 0.20 160 3127-02-88 843 5.9 360 0.12 0.56 0.19 150 2528-02-88 772 6.5 350 0,14 0.65 0.20 150 3529-02-88 702 6.0 340 0.14 0.63 0.22 150 3701-03-88 630 6.2 340 0.09 0.60 0.19 140 2902-03-88 570 6.3 330 0.09 0.59 0.21 140 2903-03-88 500 6.7 330 0.07 0.56 0.22 140 3304-03-88 444 6.4 330 0.08 0.50 0.24 140 3305-03-88 425 6.5 330 0.11 0.51 0.28 140 2706-03-88 449 6.3 360 0.25 0.61 0.36 150 2607-03-88 391 6.7 350 0.15 0.55 0.26 150 2308-03-88 332 6.6 350 0.08 0.52 0.25 150 2609-03-88 273 6.3 370 0.10 0.57 0.33 160 3310-03-88 692 6.0 380 0.78 0.70 0.45 160 5711-03-88 543 6.0 350 0.29 0.70 0.24 150 5712-03-88 301 6.2 360 0.18 0.66 0.26 160 3713-03-88 212 6.2 380 0.18 0.68 0.34 170 4514-03-88 161 6.5 410 0.17 0.73 0.42 180 4715-03-88 224 6.3 400 0.26 0.67 0.43 180 5616-03-88 167 5.8 530 1.5 0.84 0.74 250 8217-03-88 122 5.6 500 1.1 0.79 0.60 230 6218-03-88 88 5.8 480 0.68 0.71 0.55 220 6019-03-88 78 5.8 520 0.78 0.79 0.64 240 7020-03-88 192 5.5 560 1.1 0.93 0.80 270 8621-03-88 189 4.7 660 2.3 1.4 1.03 330 76

Page 218
DATE FLOW(Us)
pH COND(ps/cm)
Cu Mn Zn(mg/I)
SO4 Ra-226(mBq/I)
22-03-88 150 4.8 620 1.4 1.2 0.85 300 6123-03-88 126 5.1 520 0.94 0.91 0.64 250 5524-03-88 420 4.8 560 1.3 1.1 0.79 260 6725-03-88 467 5.6 400 0.38 0.73 0.27 180 4826-03-88 282 5.9 390 0.18 0.66 0.24 170 4127-03-88 209 5.9 410 0.12 0.63 0.27 180 4228-03-88 411 6.1 460 0.35 0.69 0.49 210 4029-03-88 4 030 5.8 330 0.15 0.59 0.19 140 7530-03-88 2 620 5.7 480 0.45 0.96 0.14 220 6331-03-88 1 300 5.7 420 0.29 0.83 0.24 180 4701-04-88 1180 6.2 380 0.18 0.70 0.21 170 4002-04-88 1 670 6.1 390 0.17 0.72 0.21 180 3503-04-88 1 400 6.1 360 0.11 0.66 0.17 160 3904-04-88 1 340 6.5 310 0.07 0.52 0.19 130 3105-04-88 1 060 6.2 330 0.10 0.55 0.16 140 2916-04-88 954 6.4 310 0.07 0.56 0.13 130 2107-04-88 882 5.4 320 0.27 0.27 0.23 140 2808-04-88 792 6.4 290 0.01 0.57 0.13 120 2609-04-88 731 6.6 280 0.04 0.56 0.14 120 2010-04-88 688 6.5 280 0.05 0.52 0.15 110 2111-04.88 643 6.5 280 0.05 0.52 0.16 110 1912-04-88 573 6.7 280 0.04 0.52 0.18 120 1813-04-88 515 6.6 290 0.05 0.55 0.20 120 2114-04-88 465 6.7 290 0.05 0.55 0.21 120 1815-04-88 414 6.6 310 0.05 0.48 0.23 130 2716-04-88 374 6.6 320 0.04 0.51 0.24 130 2417-04-88 345 6.7 330 0.07 0.50 0.23 140 3318-04-88 314 6.4 330 0.07 0.50 0.25 145 3119-04-88 276 6.3 340 0.11 0.50 0,28 150 2920-04-88 234 6.5 360 0.07 0.51 0.28 150 2421-04-88 201 6.2 360 0.10 0.50 0.31 160 3422-04-88 181 6.3 370 0.11 0.46 0.33 150 3323-04-88 157 6.3 380 0.13 0.48 0.34 160 2924-04-88 133 6.6 390 0.09 0.56 0.37 170 2625-04-88 112 6.3 410 0.14 0.50 0.40 180 4126-04-88 94 6.2 430 0.12 0.57 0.52 190 3927-04-88 76 6.4 440 0.34 0.58 0.52 200 5728-04-88 62 6.0 460 0.39 0.63 0.55 200 5429-04-88 51 6.1 470 0.45 0.58 0.57 210 5330-04-88 41 6.2 500 0.52 0.62 0.64 230 5701-05-88 32 6.2 520 0.64 0.65 0.68 240 6402-05-88 24 6.0 530 0.78 0.65 0.69 250 7403-05-88 19 5.9 550 0.81 0.68 0.69 25004-05-88 14 6.1 550 0.73 0.70 0.68 26005-05-88 10 6.0 550 0.76 0.71 0.66 26006-05-88 7 6.0 560 0.74 0.69 0.68 26007-05-88 4 6.0 560 0.76 0.73 0.66 26008-05-88 2 6.1 550 0.71 0.75 0.61 26009-05-88 1 6.1 550 0.67 0.82 0.61 260

Table 4.9 1986-87 East Firniiss River pollutant loads at GS8150097
12-8612-86
17-12-8618- 12-8619-12-8620-12-862 1-12-8622-12-8623-12-86
12-8612-86
Page 214
26-12-8627-12-86 NO FLOW28- 12-8629-12-8630- 12-8631- 12-8601-01-8702-01-8703-01-8704-01-8705 -0 1-8706-01-8707-01 -8708-01-8709-01-8710-01-8711-01-8712-01-8713-01-8714-01-8715-01-87 23.8 38 50 31 8.3
16-01-87 59.7 90 78 41 15
17-01-87 99.4 130 150 34 60 11
18-01-87 124 140 170 41 57 17
19-01-87 50.4 55 81 20 27 4.7
20-01-87 28.3 36 42 21 12 2.3
21-01-87 44.2 66 62 32 17 3.5
DATE FLOW(I X 106)
Cu Mn(kg)
Zn SO,(t)
Ra-226(MBq)
04-12-86 21.3 1.1 7.9 12 .81 5.8
05-12-86 3.15 .95 3.3 .85 .26 1.1
06-12-86 4.3107-12-86 1.66 NO SAMPLE TAKEN08-12-86 .44309-12-86 8.00 21 23 11 2.3 4.9
10-12-86 3.27 8.5 8.5 4.8 .96 1.3
11-12-86 .873 3.0 3.2 3.1 .30 .37
12-12-86 .128 .41 .44 .42 .05 .07
13-12-86 .018 .06 .07 .06 .01 .01
14-12-86

aflsj
c.6 tz cE 001 19 lEt [8-10-ti 11 LI E xc xc 91'! [8-10-11 Il 0! Ui 11 i't E*EL [8-10-01
II ii c c c'os t8-E0-60 11 ii 01' 61 668 L8-E0-80
YE £1 El ci' 11 001 L8-E0-t0 61 Pt 11 oc 61 111 L8-E0-90 L1' 91 P1 Pc 91 Ill L8-EO-0 91' 61 P1 19 P1 EI L8-E0-F0 t9 Il 1% [9 PP 811 L8-E0-E0 06 t'Z 81 St ic ELI [8-10-to ct. 01 OE 011 t'9 HZ [8-10-10 t6 11' P1 (*1 IL P81 [8-tO-St
El OP EP 011 [9 991 t8-t0-LZ 99 9E P1 011 vc P11 [8-10-91 zi oc 61 oct cii [8-to-cl 91 ES 61' oct t'L 161' [8-tO-Pt cc 66 99 061 ES 918 [S-tO-El El EL zc Oil 6L i'zc [8-10-11 II SE El 011 09 611 L8-W-ll 61 IS Li' 061 06 6E LWl0-0l 61 91' Ec oct i's tc [8-10-61 El oc ci' 091 [8 P91 L8-l0-81 96 81' 61' oct 001 LI'Z L8-tO-[J ti ic LI' 091 66 191 [8-10-91 El It' Pt 011 9S tEl [S-tO-cl 96 LI II' 011 LL 8L1 LS-t0-I'I c9 P1 P1 011 69 vci [8-10-11 98 E LI oct 16 P01 [S-tO-li
11 011 99 OlE Ott i'tt tx-to-it St 001 P9 081 081 EE L8-tO-0t 68 oct t't Ott 081 OPt LS-ZO-60 91 tc 81' 091 Ott 001 [8-tO-SO CS St LV 061 091 P61 [8t0-LO
ott 18 001' OE 991 [8-10-90 Ii [8 i'c OIl 001 LOt ts-to-co iT 001 Sc oct 011 111 L8-Z0-ffl 81 011 99 011 011 Ed [8-10-10 91 011 19 Ott 0/2 911 [8-10-tO 91 Ed 89 oct oct ott ts-zo-to 1*1 9 01 11 61 [.01 [8-10-11
1L ct W6 II 11 068 [8-10-01 CL 91 88 Ott 011 6c6 [8-10-61 68 11 66 DPI Ott Y66
6 Vt' it LI 01 Lii [8-10-Li 1*1 8 81 it St VEt [8-10-91 Vt E Pt It ct 6E1 [s-to-ct ci 99 ct cz 61 8E1 L8-1O-Pt ci CS Ft El El 981 L8-T0-Et EE it LI 61 11' 661 t8-1O-tt
(b) 0) (2N) (901 X i) 9il-N tOS 112 tqA,J fl3 MO'ld 3LVU

Table 4.9 Cont'd
Page 216
DATE FLOW Cu Mn Zn SO4 Ra-226(1 X 10⁶) (kg) 0) (MBq)
13-03-87 141 37 61 24 17 5.114-03-87 102 27 44 19 13 3.615-03-87 81.7 22 36 19 11 2.516-03-87 71.1 11 15 16 6.9 2.317-03-87 65.0 20 29 16 8.7 2.218-03-87 61.8 17 27 13 8.2 3.319-03-87 56.6 17 25 16 7.8 1.620-03-87 51.9 18 24 16 7.6 1.5
21-03-87 302 60 170 51 31 1822-03-87 280 56 170 36 31 13
23-03-87 130 25 83 20 15 4.924-03-87 94.2 20 61 19 12 3.625-03-87 84.0 17 54 18 11 2.826-03-87 76.2 14 48 15 9.6 3.127-03-87 69.4 14 44 15 8.7 2.128-03-87 65.8 13 41 15 8.3 2.029-03-87 59.3 10 37 14 7.5 1.530-03-87 53.7 9.1 33 12 6.9 1.631-03-87 47.9 9.7 31 12 6.4 1.501-04-87 40.4 9.3 27 11 5.5 1.302-04-87 35.5 16 26 13 5.5 1.203-04-87 31.9 12 24 11 5.1 1.104-04-87 28.6 10 23 9.7 4.9 1.005-04-87 25.6 9.2 22 9.5 4.6 1.1
06-04-87 22.7 12 17 10 4.4 1.007-04-87 20.0 14 21 10 4.1 .9208-04-87 17.1 15 19 9.4 3.8 .7909-04-87 14.1 15 16 8.6 3.3 .6210-04-87 16.0 21 18 Ii 3.8 .7711-04-87 33.0 63 33 27 9.2 1.812-04-87 28.6 23 18 14 5.7 1.313-04-87 18.5 8.3 11 8.5 3.6 .7214-04-87 13.1 8.5 7.3 9.0 3.4 .6615-04-87 9.85 8.1 7.1 6.5 2.8 .4916-04-87 7.46 8.4 6.6 5.7 2.3 .4817-04-87 5.62 8.0 5.6 5.1 1.9 .3618-04-87 4.70 7.5 4.9 4.6 1.7 .3119-04-87 3.65 6.4 4.1 3.9 1.4 .3420-04-87 2.86 5.5 3.5 3.3 1.2 .2521-04-87 2.23 4.6 2.9 2,7 .96 .2522-04-87 1.68 3.4 2.3 2.1 .73 .1823-04-87 1.26 2.7 1.8 1.7 .57 .1824-04-87 .890 1.9 1.3 1.2 .40 .1325-04-87 .683 1.5 1.0 .92 .30 .1126-04-87 .419 .94 .64 .57 .18 .0727-04-87 .240 .52 .36 .31 .10 .0528-04-87 .165 .36 .25 .21 .07 .0229-04-87 .111 .24 .17 .14 .05 .0230-04-87 .061 .14 .09 .07 .03 .0101-05-87 .034 .08 .05 .04 .01 .0102-05-87 .012 .03 .02 .02 .01 .00

Table 4.10 1987-88 East Finniss River dissolved pollutant loads at GSSISOO97
Page 217
DATE FLOW(IxlO6fd)
Cu Mn(kgfd)
Zn SO4(tjd)
Ra-226(MBq/d)
21-12-87 22.2 31 34 42 19 5.622-12-87 23.6 12 19 25 4.2 2.823-12-87 69.7 59 52 66 13 9.124-12-87 35.2 24 20 28 5.6 3.525-12-87 37.5 63 46 62 11 7.126-12-87 23.8 15 13 13 2.7 2.227-12-87 9.33 8.1 7.1 8.7 1.9 1.128-12-87 4.84 10 7.9 10 2.0 0.7329-12-87 3.20 7.5 6.0 7.6 1.5 0.5430-12-87 2.42 6.1 4.9 6.5 1.2 0.5131-12-87 2.07 5.4 4.4 5.9 1.1 0.5001-01-88 1.47 3.7 3.1 4.2 0.75 0.3202-01-88 1.04 2.6 2.2 2.8 0.53 0.2503-01-88 1.73 4.3 3.8 4.8 0.83 0.3604-01-88 2.85 6.9 5.9 7.4 1.3 0.6605-01-88 1.56 3.9 3.4 4.4 0.78 0.3306-01-88 0.950 2.4 2.1 2.6 0.47 0.2307-01-88 0.518 1.2 1.1 1.3 0.24 0.1408-01-88 0.259 0.63 0.57 0.69 0.12 0.0809-01-88 2.16 5.5 5.0 6.1 1.1 0.6010-01-88 1.99 5.7 4.9 6.6 1.1 0.4811-01-88 4.75 15 13 18 3 1.012-01-88 3.28 13 11 18 2.6 0.7913-01-88 1.30 5.7 5.0 8.6 1.2 0.2614-01-88 0.518 2.3 2.1 3.6 0.49 0.1115-01-88 0.173 0.75 0.69 1.2 0.16 0.0416-01-88 78.4 120 120 67 24 9.417-01-88 48.7 55 84 17 17 2.318-01-88 20.8 24 35 8.8 7.3 1.219-01-88 13.2 15 21 7.1 4.4 0.9320-01-88 35.6 47 48 23 10 3.121-01-88 45.2 38 61 18 12 3.522-01-88 28.3 19 41 11 7.9 2.223-01-88 18 12 24 7.87 5.2 1.224-01-88 1&1 11 21 7.4 4.3 1.225-01-88 14.6 13 18 8.5 3.8 1.126-01-88 17.7 12 17 9.6 4.1 1.527-01-88 32.5 36 35 19 6.8 2.828-01-88 27.6 22 36 12 7.4 2.029-01-88 18.2 17 23 8.4 4.9 1.230-01-88 13.2 8.5 14 6.9 3.3 0.6731-01-88 22.9 16 27 11 5.7 1.201-02-88 35.0 26 42 15 9.1 2.102-02-88 26.5 26 34 12 7.2 1.203-02-88 16.4 15 21 7.2 4.4 1.104-02-88 12.0 8.2 14 5.5 3.0 0.7605-02-88 11.5 7.6 13 5.4 2.9 .86

Page 218
Table 4.10 Cont'd
DATE FLOW(lxlct/d)
Cu Mn(kg/cl)
Zn SO4(tld)
Ra-226(MBq/d)
06-02-88 12.9 14 16 9.4 3.7 1.007-02-88 10.9 16 15 8.8 3.4 1.108-02-88 11.5 12 15 8.7 3.4 0.7809-02-88 109 94 92 48 22 11
10-02-88 238 250 330 62 78 1611-02-88 98.5 110 130 31 31 5.812-02-88 102 88 110 30 27 5.913-02-88 260 180 290 55 68 1614-02-88 131 120 160 32 37 6.815-02-88 91.6 55 77 41 22 4.116-02-88 89.0 57 97 24 20 3.217-02-88 76.0 36 73 19 17 1.818-02-88 66.5 26 57 17 13 2.419-02-88 59.6 16 45 14 11 1.620-02-88 143 34 100 29 20 11
21-02-88 202 95 180 36 40 1522-02-88 315 150 280 57 63 1823-02-88 155 63 150 29 31 6.524-02-88 108 31 78 23 19 5.025-02-88 89.9 22 61 19 15 2.626-02-88 79.6 14 53 16 13 2.527-02-88 72.8 8.7 41 14 11 1.828-02-88 66.7 9.3 43 13 10 2.329-02-88 60.7 8.5 38 13 9.1 2.201-03-88 54.4 4.9 33 10 7.6 1.602-03-88 49.2 4.4 29 10 6.9 1.403-03-88 43.2 3.0 24 9.5 6.1 1.404-03-88 38.4 3.1 19 9.2 5.4 1.305-03-88 36.7 4.0 19 10 5.1 0.9906-03-88 38.8 9.7 24 14 5.8 1.007-03-88 33.8 5.1 19 8.8 5.1 0.7808-03-88 28.7 2.3 15 7.2 4.3 0.7509-03-88 23.6 2.4 13 7.8 3.8 0.7810-03-88 59.8 47 42 27 9.6 3.411-03-88 46.9 14 33 11 7.0 2.712-03-88 26.0 4.7 17 6.8 4.2 0.9613-03-88 18.3 3.3 12 6.2 3.1 0.8214-03-88 13.9 2.4 10 5.8 2.5 0.6515-03-88 19.4 5.0 13 8.3 3.5 1.1
16-03-88 14.4 22 12 11 3.6 1.217-03-88 10.5 11 8.3 6.3 2.4 0.6518-03-88 7.60 5.2 5.4 4.2 1.7 0.4619-03-88 6.74 5.3 5.3 4.3 1.6 0.4720-03-88 16.6 18 15 13 4.5 1.421-03-88 16.3 38 23 17 5.4 1.222-03-88 13.0 19 15 11 3.9 0.7923-03-88 10.9 10 9.9 7.0 2.7 0.60

Page 219
DATE FLOW(1x10⁶/cJ)
Cu Mn(kg/d)
Zn SO4(t/d)
Ra-226(MBq/d)
24-03-88 36.3 48 39 29 9.4 2.425-03-88 40.3 15 29 11 7.3 1.926-03-88 24.4 4.4 16 5.9 4.1 1.027-03-88 18.1 2.2 1.1 4.9 3.2 0.7628-03-88 35.5 12 24 17 7.5 1.429-03-88 348 52 210 66 49 2630-03-88 226 100 220 32 50 1431-03-88 112 33 93 27 20 4.401-04-88 102 18 71 21 17 4.102-04-88 144 25 100 30 26 5.103-04-88 121 13 80 21 19 4.704-04-88 116 8.1 60 22 15 3.605-04-88 91.6 9.2 50 15 13 2.706-04-88 82 5.8 46 11 11 1.707-04-88 76.2 21 21 18 11 2.108-04-88 68.4 0.68 39 8.9 8.2 1.809-04-88 63.2 2.5 35 8.8 7.6 1.310-04-88 59.4 3.0 31 8.9 6.5 1.211-04-88 55.6 2.8 29 8.9 6.1 1.112-04-88 49.5 2.0 26 8.9 5.9 0.8913-04-88 44.5 2.2 24 8.9 5.3 0.9314-04-88 40.2 2.0 22 8.4 4.8 0.7215-04-88 35.8 1.8 17 8.2 4.6 0.9716-04-88 32.3 1.3 16 7.8 4.2 0.7817-04-88 29.8 2.1 15 6.9 4.2 0.9818-04-88 27.1 1.9 14 6.8 3.9 0.8419-04-88 23.8 2.6 12 6.7 3.6 0.6920-04-88 20.2 1.4 10 5.7 3.0 0.4921-04-88 17.4 1.7 8.7 5.4 2.8 0.5922-04-88 15.6 1.7 7.2 5.2 2.4 0.5223-04-88 13.6 1.8 6.5 4.6 2.2 0.3924-04-88 11.5 1.0 6.4 4.2 2.0 0.3025-04-88 9.68 1.4 4.8 3.9 1.7 0.4026-04-88 8.12 0.97 4.6 4.2 1.5 0.3227-04-88 6.57 2.2 3.8 3.4 1.3 0.3728-04-88 5.36 2.1 3.4 3.0 1.1 0.2929-04-88 4.41 2.0 2.6 2.5 0.93 0.2330-04-88 3.54 1.8 2.2 2.3 0.81 0.2001-05-88 2.76 1.8 1.8 1.9 0.66 0.1802-05-88 2.07 1.6 1.4 1.4 0.52 0.1503-05-88 1.64 1.3 1.1 1.1 0.4104-05-88 1.21 0.88 0.85 0.82 0.3105-05-88 0.864 0.66 0.61 0.57 0.2206-05-88 0.605 0.45 0.42 0.41 0.1607-05-88 0.346 0.26 0.25 0.23 0.0908-05-88 0.173 0.12 0.13 0.1! 0.0409-05-88 0.043 0.03 0.04 0.03 0.01

Table 4.16 19S6-87 Finniss River water quality at GS8150204 - general parameters
Page 220
17-01-87 5.2 340 13 29 13 150
19-01-87 6.8 380 33 21 40 130
20-01-87 6.7 390 31 23 44 130
21-01-87 6.7 290 20 18 36 86
22-01-87 6.5 53 24 4 19 25
23-01-87 6.2 75 38 5 11 18
24-01-87 6.4 130 7 8 14 45
26-01-87 6.6 160 7 13 20 62
27-01-87 6.7 99 4 8 30 25
28-01-87 6.8 98 4 7 33 22
29-01-87 6.8 110 5 8 32 38
30-01-87 6.7 110 4 8 26 32
31-01-87 6.7 130 5 10 28 38
02-02-87 6.3 130 3 6 11 44
03-02-87 6.5 220 19 11 12 83
05-02-87 6.5 200 16 9 19 65
07-02-87 6.8 240 20 12 17 87
10-02-87 6.4 110 7 5 17 30
18-02-87 6.5 99 7 5 16 28
24-02-87 6.3 120 8 6 11 40
28-02-87 6.6 90 5 5 21 21
03-03-87 6.9 110 6 7 26 28
07-03-87 6,9 130 6 9 33 33
10-03-87 6.8 140 7 10 36 36
14-03-87 6.9 150 10 39 34 37
17-03-87 6.9 170 8 12 39 44
21-03-87 6.8 120 6 9 40 26
24-03-87 6.9 170 9 12 33 51
28-03-87 7.0 190 9 14 40 54
31-03-87 6.2 220 57
04-04-87 6.4 240 68 68
07-04-87 6.6 260 65
11-04-87 6.2 310 100
14-04-87 6.5 260 65
21-04-87 7.6 300 57
24-04-87 8.1 280 46
DATE pH COND Ca Mg HCO3 SO4(pS/cm) (mg/I)

Page 221
Table 4.17 1986-87 Finniss River water quality at GS81S0204 - heavy metals
DATECu
TotalMn Zn Cu
Filtrate (mg/I)Mn Zn
17-01-87 .95 .92 .53 .85 .80 .5019-01-87 .94 .28 .4720-01-87 .45 .45 .10 .25 .45 .1021-01-87 .40 .35 .14 .20 .30 .1022-01-87 .07 .77 .01 .03 .01 .0123-01-87 .08 .10 .02 .08 .02 .0224-01-87 .20 .16 .08 .09 .13 .0626-01-87 .25 .25 .10 .15 .20 .0827-01-87 .10 .10 .04 .05 .10 .0428-01-87 .05 .10 .04 .05 .05 .0229-01-87 .05 .10 .04 .05 .05 .0230-01-87 .10 .15 .06 .05 .15 .0431-01-87 .15 .20 .07 .12 .15 .0502-02-87 .12 .14 .04 .06 .04 .0303-02-87 .21 .25 .05 .17 .19 .0405-02-87 .15 .21 .05 .09 .15 .0407-02-87 .20 .28 .07 .10 .24 .0510-02-87 .10 .10 .04 .05 .05 .0218-02-87 .07 .14 .03 .05 .09 .0224-02-87 .12 .15 .05 .07 .05 .0428-02-87 .09 .06 .03 .04 .02 .0203-03-87 .15 .09 .10 .08 .08 .0707-03-87 .15 .29 .10 .08 .08 .0910-03-87 .16 .16 .10 .08 .13 .0714-03-87 .15 .18 .08 .09 .14 .0617-03-87 .16 .20 .06 .10 .20 .0521-03-87 .17 .14 .09 .10 .10 .0424-03-87 .10 .23 .10 .07 .20 .0828-03-87 .13 .24 .11 .05 .19 .1031-03-87 .19 .26 .22 .07 .22 .1604-04-87 .15 .26 .14 .10 .24 .1307-04-87 .18 .28 .23 .06 .19 .1211-04-87 .35 .40 .31 .10 .30 .2314-04-87 .16 .24 .11 .05 .14 .1021-04-87 .12 .22 .13 .06 .15 .0924-04-87 .12 .20 .11 .05 .12 .07

Table 4.20 1987-88 East Finniss River water quality at GS8150204 general
parameters
Page 222
30-01-88 770 6.6 240 99 13 17 43
31-01-88 800 6.7 230 61 12 16 4601-02-88 940 6.5 360 130 18 26 31
02-02-88 750 6.6 370 140 21 26 31
03-02-88 510 6.6 180 110 21 23 34
04-02-88 410 6.7 310 105 18 22 39
06-02-88 340 6.9 300 100 16 22 41
07-02-88 310 6.7 300 94 16 22 41
08-02-88 270 6.8 370 135 17 28 34
09-02-88 2 260 6.5 390 135 16 32 32
16-02-88 6 730 6.2 130 38 9 8 16
17-02-88 4 390 6.4 150 49 10 10 17
18-02-88 3 630 6.4 160 50 10 10 19
19-02-88 3 140 6.4 170 50 9 11 21
20-02-88 7 020 6.4 150 38 7 9 28
21-02-88 12 600 6.3 150 41 10 9 20
22-02-88 19 600 6.2 150 48 9 9 14
23-02-88 22 700 6.0 81 23 5 5 10
24-02-88 15 400 6.0 61 18 3 4 8
25-02-88 5 750 6.1 110 33 6 7 12
26-02-88 4 470 6.3 130 39 6 9 15
27-02-88 4 440 6.4 130 36 6 9 19
28-02-88 4 000 6.4 130 36 6 9 22
29-02-88 3 320 6.4 140 38 0 0 0
29-03-88 16 000 6.5 110 29 4 7 17
30-03-88 25 000 6.0 120 28 7 6 16
31-03-88 6 930 6.2 104 29 5 6 13
01-04-88 21 700 5.9 124 36 6 7 16
02-04-88 14 400 5.9 94 18 4 5 21
03-04-88 14 400 5.9 82 19 4 4 12
04-04-88 12 200 6.1 77 18 5 5 17
05-04-88 9 770 6.0 85 21 5 5 15
06-04-88 7 420 6.1 81 19 3 5 17
24-12-87 7 780 5.9 65 10 2 4 12
25-12-87 3 390 6.1 66 13 2 5 13
26-12-87 4 950 5.9 76 10 2 5 19
27-12-87 1 690 6.1 71 12 3 5 16
28-12-87 850 6.2 96 23 4 7 19
29-12-87 540 6.0 130 31 4 10 2030-12-87 400 6.2 130 36 5 11 2231-12-87 350 6.3 130 31 6 10 24
01-01-88 290 6.2 140 33 6 11 2502-01-88 230 6.1 120 32 6 10 27
03-01-88 250 6.2 120 29 5 9 29
DATE FLOW pH Sc SO4 Ca Mg HCO3
(Us) (ps/cm) (mg/I)

Page 223
DATE FLOW(Us)
pH Sc(ps/cm)
504 Ca(mg/I)
Mg HCO3
04-01-88 390 6.3 140 39 6 12 2805-01-88 360 6.7 140 29 N/A06-01-88 460 6.6 120 21 5 9 3207-01-88 470 6.7 170 46 7 14 2608-01-88 410 6.7 110 19 5 9 3309-01-88 730 6.8 97 11 5 8 3710-01-88 2 920 6.3 95 8 5 8 4011-01-88 5 980 6.4 130 10 8 10 6312-01-88 2 800 6.4 130 15 6 10 4713-01-88 2 190 6.4 95 11 4 7 3414-01-88 1 330 7.0 82 8 4 7 3215-01-88 1 910 6.8 240 71 46 18 4616-01-88 3 930 6.5 320 122 19 24 2817-01-88 2 250 6.5 270 95 18 19 2718-01-88 1 190 6.6 300 113 21 21 2819-01-88 800 6.9 280 100 19 20 3320-01-88 1 120 7.1 270 87 16 19 3621-01-88 1 600 6.6 260 88 17 19 3222-01-88 1 010 7.1 280 90 15 20 3623-01-88 680 6.8 240 79 11 19 2724-01-88 570 6.7 82 9 4 6 3625-01-88 530 6.1 260 100 9 23 1728-01-88 720 6.3 370 140 18 29 1929-01-88 750 6.2 310 100 17 22 32

Table 4.21 1987-88 East Finnis River water quality at GS8150204 - heavy metalsconcentrations
Page 224
DATE FLOW(Ifs)
pH Sc(ps/cm)
Cusol
Cutot
Mnsol(mg/I)
Mntot
Znsol
Zntot
SO4
24-12-87 7 780 5.9 65 .07 .11 .01 .04 .01 .06 1025-12-87 3 390 6.1 66 .13 .12 .01 .06 .03 .09 13
26-12-87 4 950 5.9 76 .12 .40 .01 .17 .03 .12 10
27-12-87 1 690 6.1 71 .07 .14 .01 .09 .03 .08 12
28-12-87 850 6.2 96 .09 .18 .01 .13 .05 .10 23
29-12-87 540 6.0 130 .10 .24 .01 .20 .07 .13 31
30-12-87 400 6.2 130 .07 .17 .01 .14 .05 .11 3631-12-87 350 6.3 130 .07 .17 .01 .13 .04 .11 31
01-01-88 290 6.2 140 .08 .17 .01 .16 .05 .11 33
02-01-88 230 6.1 120 .08 .13 .04 .15 .06 .12 32
03-01-88 250 6.2 120 .07 .12 .01 .14 .03 .10 2904-01-88 390 6.3 120 .07 .10 .02 .15 .03 .10 3905-01-88 360 6.7 140 .08 .13 .02 .10 .04 .10 2906-01-88 460 6.6 120 .07 .11 .01 .09 .03 .09 21
07-01-88 470 6.7 170 .07 .19 .01 .21 .05 .16 4608-01-88 410 6.7 110 .05 .08 .02 .11 .02 .08 19
09-01-88 730 6.8 97 .05 .08 .01 .07 .01 .07 11
10-01-88 2 920 6.3 95 .05 .06 .02 .26 .04 .08 8
11-01-88 5 980 6.4 129 .06 .10 .02 .31 .03 .10 1012-01-88 2 800 6.4 129 .06 .08 .02 .05 .04 .11 15
13-01-88 2 190 6.4 95 .07 .07 .03 .05 .04 .09 11
14-01-88 1 330 7.0 82 .05 .05 .03 .09 .03 .09 8
15-01-88 1 910 6.8 240 .10 .32 .03 .38 .05 .44 71
16-01-88 3 930 6.5 320 .07 .20 .01 .25 .10 .23 12017-01-88 2 250 6.5 270 .05 .40 .01 .41 .05 .22 9518-01-88 1 190 6.6 300 .11 .27 .05 .33 .08 .19 11019-01-88 800 6.9 280 .08 .19 .01 .29 .07 .17 10020-01-88 1120 7.1 270 .07 .21 .01 .30 .06 .18 87
21-01-88 1 600 6.6 260 .05 .17 .01 .23 .11 .19 8822-01-88 1 010 7.1 280 .08 .18 .01 .22 .10 .21 9023-01-88 680 6.8 240 .06 .19 .01 .21 .11 .21 7924-01-88 570 6.7 82 .02 .03 .01 .08 .03 .07 925-01-88 530 6.1 260 .17 1.14 .07 .45 .19 .45 10028-01-88 720 6.3 370 .22 .41 .53 .64 .31 .35 14029-01-88 750 6.2 310 .09 .22 .15 .39 .15 .22 10030-01-88 770 6.6 240 .06 .15 .01 .20 .08 .14 9902-02-88 750 6.6 370 .21 .35 .51 .61 .21 .27 14003-02-88 510 6.6 180 .15 .21 .40 .49 .17 .21 110

Page 225
DATE FLOW(L's)
pH Sc(ps/cm)
cuso!
cutot
Mnso!(mg/I)
Mntot
Znsol
Zntot
SO4
09-02-88 2 260 6.5 390 .14 .31 .31 .43 .25 .32 14016-02-88 6 730 6.2 130 .08 .24 .03 .16 .02 .08 3819-02-88 4 390 6.4 150 .10 .31 .11 .26 .05 .10 4918-02-88 3 630 6.4 160 .08 .40 .16 .24 .04 .11 5019-02-88 3 140 6.4 170 .14 .25 .01 .39 .03 .18 5020-02-88 7 020 6.4 150 .03 .25 .01 .29 .04 .11 3821-02-88 12 600 6.3 150 .08 .97 .05 .36 .01 .14 4122-02-88 19 600 6.2 150 .06 .35 .03 .32 .02 .09 4823-02-88 22 700 6.0 81 .01 .07 .04 .24 .02 .60 2324-02-88 15 400 6.0 61 .04 .11 .01 .14 .02 .05 1825-02-88 5 750 6.1 110 .04 .07 .01 .14 .03 .07 3326-02-88 4 470 6.3 130 .01 .19 .02 .35 .04 .10 3927-02-88 4 440 6.4 130 .06 .17 .01 .33 .04 .10 3628-02-88 4 000 6.4 130 .01 .15 .01 .25 .05 .90 3629-02-88 3 320 6.4 140 .07 .15 .01 .28 .05 .90 3829-03-88 16 000 6.5 110 .04 .40 .01 .47 .01 .20 2930-03-88 25 000 6.0 120 .08 .50 .01 .30 .04 .10 2831-03-88 6 930 6.2 100 .05 .10 .01 .42 .04 .22 2901-04-88 21 700 5.9 120 .04 .21 .01 .19 .03 .08 3602-04-88 14 400 5.9 94 .03 .17 .01 .13 .03 .03 1803-04-88 14 400 5.9 82 .05 .13 .01 .26 .03 .08 1904-04-88 12 200 6.1 77 .06 .23 .01 .13 .03 .10 1805-04-88 9 770 6.0 85 .06 .16 .01 .13 .03 .05 2106-04-88 7 420 6.1 81 .05 .12 .0! .11 .03 .05 19

Page 226
Table 4.22 1987-88 East Finniss River water quality at GS8150204
pollutant loadsdissolved
DATE FLOW pH Sc Cu Mn Zn SO4
(1x10⁶/d) (ps/cm) (kg/d)
24-12-87 670 5.9 65 47 6.7 6,7 6 700
25-12-87 290 6.1 66 38 2.9 8.8 3 800
26-12-87 430 5.9 76 51 4.3 13 4 300
27-12-87 150 6.1 71 10 1.5 4.4 1 800
28-12-87 73.4 6.2 96 6.6 .73 3.7 1 700
29-12-87 46.7 6.0 130 4.7 .47 3.3 1 400
30-12-87 34.6 6.2 130 2.4 .35 1.7 1 200
31-12-87 30.2 6.3 130 2.1 .30 1.2 940
01-01-88 25.1 6.2 140 2.0 .25 1.2 830
02-01-88 19.9 6.1 120 1.6 .79 1.2 640
03-01-88 21.6 6.2 120 1.5 .22 .65 630
04-01-88 33.7 6.3 140 2.4 0.67 1.0 1 300
05-01-88 31.1 6.7 140 2.5 .62 1.2 900
06-01-88 40.7 6.6 120 2.8 .40 1.2 840
07-01-88 41.6 6.7 170 2.8 .41 2.0 1 900
08-01-88 35.4 6.7 110 1.8 .71 .71 670
09-01-88 63.1 6.8 97 3.2 .63 .63 690
10-01-88 253 6.3 95 13 5.0 10 2 000
11-01-88 516 6.4 130 31 10 16 5 200
12-01-88 242 6.4 130 15 4.8 9.7 3 600
13-01-88 189 6.4 95 13 5.7 7.6 2 100
14-01-88 115 7.0 82 5.8 3.4 3.4 910
15-01-88 165 6.8 240 16 5.0 8.2 12 000
16-01-88 340 6.5 320 24 3.4 34 41 000
17-01-88 194 6.5 270 9.7 1.9 9.7 18 000
18-01-88 103 6.6 300 11 5.1 8.2 12 000
19-01-88 69.1 6.9 280 5.5 .69 4.8 6 900
20-01-88 96.8 7.1 270 6.8 .97 5.8 8 400
21-01-88 138 6.6 260 6.9 1.4 15 12 000
22-01-88 87.3 7.1 280 7.0 .87 8.7 7 900
23-01-88 58.8 6.8 240 3.5 .59 6.5 4 600
24-01-88 49.2 6.7 82 .98 .49 1.5 440
25-01-88 45.8 6.1 260 7.8 3.2 8.7 4 600
28-01-88 62.2 6.3 370 14 33 19 9 000
29-01-88 64.8 6.2 310 5.8 9.7 9.7 6 500

Page 227
DATE FLOW(1x10⁶/d)
pH Sc(ps/cm)
Cu Mn Zn(kg/d)
SO4
30-01-88 66.5 6.6 240 4.0 .67 5.3 6 60031-01-88 69.1 6.7 230 6.2 1.4 6.2 4 20001-02-88 81.2 6.5 360 12 35 19 11 00002-02-88 64.8 6.6 370 14 33 14 9 10003-02-88 44.1 6.6 180 6.6 18 7.5 4 80004-02-88 35.4 6.7 310 3.2 6.0 5.0 3 70006-02-88 29.4 6.9 300 1.8 2,1 2.1 2 90007-02-88 26.8 6.7 300 1.9 1.3 3.5 2 50008-02-88 23.3 6.8 370 3.5 9.6 6.3 3 10009-02-88 195 6.5 390 27 61 49 26 00016-02-88 581 6.2 130 47 17 12 22 00019-02-88 379 6.4 150 38 42 19 1 90018-02-88 314 6.4 160 25 50 13 16 00019-02-88 271 6.4 170 38 2.7 8.1 14 00020-02-88 607 6.4 150 18 6.1 24 23 00021-02-88 1 090 6.3 150 87 54 11 45 00022-02-88 1 690 6.2 150 100 51 34 81 00023-02-88 1 960 6.0 81 120 78 39 45 00024-02-88 1 330 6.0 61 53 13 27 24 00025-02-88 497 6.1 110 20 5.0 15 16 00026-02-88 386 6.3 130 3.9 7.7 15 15 00027-02-88 384 6.4 130 23 3.8 15 14 00028-02-88 346 6.4 130 3.5 3.5 17 12 00029-02-88 287 6.4 140 20 2.9 14 11 00029-03-88 1 380 6.5 110 55 14 14 40 00030-03-88 2 160 6.0 120 170 22 86 60 00031-03-88 599 6.2 104 29 6.0 24 17 00001-04-88 1 870 5.9 124 75 19 56 67 00002-04-88 1 240 5.9 94 37 12 37 22 00003-04-88 1 240 5.9 82 62 12 37 24 00004-04-88 1 050 6.1 77 63 11 32 19 00005-04-88 844 6.0 85 51 8.4 25 18 00006-04-88 641 6.1 81 32 6.4 19 12 000

Table 4.46(a) GS8150200 - Dissolved pollutant loads
Page 228
02-01-88 .518 2.8 1.9 4.2 .5805-01-88 .350 2.1 1.7 3.5 .4408-01-88 1.38 9.0 7.8 20 2.009-01-88 .518 2.2 1.8 3.7 .4712-01-88 1.21 5.0 4.0 8.2 1.2
19-01-88 8.81 8.3 7.7 16 2.321-01-88 9.42 8.5 7.0 7.7 2.429-01-88 7.34 5.6 5.3 6.7 1.7
02-02-88 8.47 5.6 5.7 7.0 1.805-02-88 8.64 9.4 9.2 11 3.009-02-88 38.9 56 40 35 13
16.02-88 138 230 180 35 5812-02-88 44.9 65 50 26 17
16-02-88 35.2 39 42 17 11
19-02-88 20.6 20 22 14 5.623-02-88 60.5 59 64 23 1626-02-88 29.2 24 26 15 6.701-03-88 17.8 14 15 12 3.904-03-88 11.6 10 9.4 11 2.508-03-88 10.4 7.2 8.3 10 2.311-03-88 16.1 13 16 11 3.515-03-88 11.2 17 14 18 4.318-03-88 7.3 6.8 8.5 10 2.022-03-88 8.81 8.1 10 11 2.725-03-88 15.0 11 14 11 3.629-03-88 195 35 110 31 2931-03-88 46.7 41 44 19 11
05-04-88 36.5 24 28 15 7.308-04-88 22.6 14 15 11 4.412-04-88 14.6 9.6 11 10 3.315-04-88 11.6 7.4 7.5 10 2.219-04-88 10.1 5.4 7.6 10 1.922-04-88 9.07 5.0 6.4 9.4 1.826-04-88 6.91 5.4 6.2 9 1.529-04-88 4.41 5.0 6.1 8.9 1.503-05-88 .864 2.5 3.2 4.7 .6909-05-88 .086 .93 1.3 2.0 .2313-05-88 .086 .91 1.2 1.7 .20
DATE FLOW Cu Mn Zn SO4(1X10⁶/d) (kg/d) (t/d)

Page 229
Table 4.46(b) GS8150209 - Dissolved pollutant loads
DATE FLOW(1X10⁶/d)
Cu Mn(kg/d)
Zn so4(tAt)
05-01-88 .173 2.1 1.9 4.5 .4008-01-88 .518 5.7 5.9 16 1.412-01-88 .613 3.4 2.9 6.9 .8019-01-88 6.91 2.7 2.7 9.1 1.322-01-88 6.91 4.3 5.1 11 1.429-01-88 7.78 3.3 4.2 11 1.402-02-88 8.64 3.3 3.4 5.8 1.505-02-88 7.78 7.8 7.4 9.7 2.809-02-88 13.0 19 14 15 4.410-02-88 11.2 7.3 6.6 8.3 2.412-02-88 10.4 7.7 6.7 8.8 2.516-02-88 9.50 4.5 5.2 7.4 1.819-02-88 9.50 4.9 6.1 8.2 1.823-02-88 8.64 6.9 6.7 8.7 2.826-02-88 8.64 5.7 5.8 7.7 1.601-03-88 9.50 6.5 6.8 9.1 1.804-03-88 8.21 5.4 5.8 8.0 1.608-03-88 7.78 4.8 5.6 7.9 1.611-03-88 7.34 4.6 5.4 7.3 1.515-03-88 9.50 16 14 17 4.518-03-88 9.50 7.6 10 13 2.622-03-88 7.78 7.2 8.7 10 2.125-03-88 8.64 2.9 5.4 7.6 1.829-03-88 86.4 2.6 5.2 6.9 4.031-03-88 13.0 6.9 6.7 10 2.505-04-88 9.50 4.9 5.5 7.6 1.608-04-88 9.07 4.3 4.9 7.3 1.512-04-88 8.47 4.7 5.0 7.5 1.415-04-88 7.78 3.6 4.7 7.1 1.319-04-88 7.78 3.7 4.9 7.5 1.322-04-88 7.78 4.23 5.3 8.1 1.526-04-88 6.05 4.5 5.2 7.9 1.329-04-88 3.89 4.4 5.1 8.0 1.403-05-88 .864 2.6 3.2 5.4 .7309-05-88 .086 1.1 1.5 2.8 .30

Table 4.46(c) GS8150210 - Dissolved pollutant loads
Page 230
DATE FLOW(1X10⁶/d)
Cu Mn(kgld)
Zn SO4(t/d)
05.01-88 .259 .88 .09 .81 .21
08-01-88 .864 3.1 1.2 2.95 .73
12-01-88 .613 1.6 .66 1.54 .40
19-01-88 1.73 4.5 1.7 3.99 .98
22-01-88 1.56 3.5 1.4 3.02 .81
29-01-88 .432 .73 .29 .66 .17
02-02-88 .605 .70 .28 .64 .19
05-02-88 .864 .60 .26 .66 1.9
09-02-88 6.91 4.8 2.3 5.18 1.38
10-02-88 8.64 22 8.5 19.61 4.41
12-02-88 4.75 9.6 3.7 8.22 2.00
16-02-88 4.32 7,5 2.9 6.35 1.56
19-02-88 3.46 5.2 2.0 4.39 1.11
23-02-88 6.91 9.3 3.8 4.29 2.00
26-02-88 4.32 5.5 2.7 2.72 1.25
01-03-88 2.59 2.5 1.1 1.22 .5704-03-88 2.16 1.6 .69 .86 .43
08-03-88 1.73 .98 .40 .60 .31
11-03-88 1.30 .75 .34 .48 .26
15-03-88 1.73 .81 .40 .54 .29
22-03-88 .432 .24 .11 .16 .10
25-03-88 .864 1.1 .44 .53 .25
29-03-88 17.3 2.9 8.0 1.90 5.18
31-03-88 5.18 11 4.3 5.08 2.07
05-04-88 2.77 4.5 1.8 1.94 .77
08-04-88 2.59 3.5 1.4 1.56 .55
12-04-88 1.73 1.5 .64 .73 .35
15-04-88 1.56 1.1 .45 .61 .25
19-04-88 .864 .43 .12 .18 .10
22-04-88 .605 .34 .05 .08 .01
26-04-88 .518 .03 .01 .01 .00
29-04-88 .173 .01 <.01 <.01 <.01

Table 4.46(d) GSSISO211 - Dissolved pollutant loads
Page 231
DATE FLOW(1X10⁶/d)
Cu Mn(kg/d)
Zn so4(tld)
19-01-88 6.74 1.2 .94 1.4 .3822-01-88 9.33 2.2 1.8 2.8 .6529-01-88 6.83 1.5 1.0 .96 .5102-02-88 8.21 1.6 1.4 2.4 .5805-02-88 7.09 2.3 1.4 1.6 .8109-02-88 9.59 2.1 2.5 3.6 1.410-02.88 9.59 3.5 2.4 4.3 .9812-02-88 9.25 3.3 1.4 1.3 .7916-02-88 9.42 3.6 1.8 2.9 .7019-02-88 8.99 2.1 1.8 3.5 .7523-02-88 9.33 2.2 1.3 1.6 .7626-02-88 9.25 1.9 1.0 1.1 .6701-03-88 9.33 2.0 1.2 1.4 .7704-03-88 8.55 1.8 1.7 2.1 .6808-03-88 7.00 1.5 1.4 1.1 .5711-03-88 7.78 1.9 1.5 1.3 .6215-03-88 6.83 2.3 2.3 1.9 .9118-03-88 5.18 1.6 1.7 1.1 .4922-03-88 32 15 22 10 5.225-03-88 7.69 1.6 1.4 1.5 .5529-03-88 170 18 1.67 5.0 3.331-03-88 9.50 2.0 1.1 .86 .6305-04-88 9.50 1.8 1.1 1.1 .5708-04-88 9.25 1.3 .83 1.0 .4912-04-88 8.29 1.1 .91 .83 .3915-04-88 7.78 1.2 1.0 1.0 .4019-04-88 7.86 1.0 .86 .79 .3522-04-88 7.95 .95 .87 .72 .3426-04-88 5.18 .67 .78 .57 .3229-04-88 3.11 .50 .59 .37 .2203-05-88 .778 .44 .47 .34 .16

Page 232
Table 4.46(e) GS8150212 - Dissolved pollutant loads
DATE FLOW(LX 1 06/d)
Cu Mn(kg/d)
Zn SO4(lid)
19-01-88 .086 .15 .06 .02 .04
22-01-88 .173 .30 .29 .04 .08
29-01-88 .086 .14 .14 .02 .04
02-02-88 .259 .47 .44 .06 .12
09-02-88 19 38 30 4.6 9.1
10-02-88 112 200 170 28 48
12-02-88 29.4 49 45 7.6 12
16-02-88 21.6 28 31 5.2 7.8
19-02-88 7.78 8.7 11 1.6 2.4
23-02-88 44.1 48 52 8.8 12.8
26-02-88 16.4 11 18 2.5 3.6
01-03-88 4.32 3.0 4.6 .60 .91
04-03-88 1.21 .96 1.3 .18 .25
08-03-88 .864 .73 1.0 .13 .2011-03-88 1.73 1.5 2.0 .28 .40
25-03-88 3.46 3.3 4.4 .59 .86
29-03-88 125 110 150 20 31
31-03-88 28.5 26 31 5.4 6.8
05-04-88 24.2 11 22 3.1 4.4
08-04-88 12.1 4.5 11 1.5 2.0
12-04-88 4.32 2.1 4.0 .60 .76
15-04-88 .864 .57 .90 .13 .18

Page 233
Table 4.46(1) GS8150213 - Dissolved pollutant loads
DATE FLOW(1X10⁶/d)
Cu Mn(kg/d)
Zn so4(tld)
19-01-88 2.07 .46 .95 .68 .2522-01-88 11.51 1.4 3.7 1.8 .7929-01-88 3.80 1.3 2.7 1.6 .6102-02-88 11.1 1.5 4.6 1.8 .7805-02-88 4.32 .91 1.9 .48 .4309-02-88 95.9 44 59 58 1610-02-88 89.9 22 17 13 7.112-02-88 72.2 8.7 19 17 5.216-02-88 65.3 9.1 14 9.8 3.819-02-88 38.0 4.2 5.3 6.8 1.723-02-88 75.2 14 11 11 5.326-02-88 48.7 8.3 6.3 7.3 3.101-03-88 39.9 4.0 3.2 2.4 1.804-03-88 24.1 2,7 1.5 1.5 1.008-03-88 13.9 1.7 3.2 1.3 .8911-03-88 18.3 2.0 4.0 .92 .8415-03-88 9.76 1.2 1.8 .39 .5225-03-88 2.59 .36 .41 .10 .1329-03-88 259 21 2.6 2.6 2.131-03-88 79.7 10 12 4.0 3.805-04-88 66.1 8.6 2.6 2.0 2.508-04-88 53.1 4.8 4.2 1.6 1.812-04-88 26.9 2.2 1.3 .81 .8615-04-88 17.0 1.4 .85 .51 .5619-04-88 11.4 .91 .91 .34 .4722-04-88 4.667 .42 .61 .23 .2526-04-88 1.30 .22 .86 .31 .19

Page 234
Table 4.46(g) GS8150214 - Dissolved pollutant loads
DATE FLOW(1X10⁶/d)
Cu Mn(kg/d)
Zn SO4(t/d)
16-01-88 .864 .72 1.4 .17 .29
19-01-88 3.45 2.8 6.0 .55 1.1
22-01-88 10.4 7.9 16 1.7 3.0
29-01-88 6.05 5.0 9.4 1.0 1.8
02-02-88 12.1 9.2 18 2.1 3.4
05-02-88 3.02 4.4 5.9 .73 .91
09-02-88 21.6 18 32 3.7 5.8
10-02-88 60.5 43 81 9.1 16
12-02-88 38.9 24 49 5.8 9.3
16-02-88 38.9 16 33 5.8 7.4
19-02-88 32.8 14 24 3.9 5.3
23-02-88 51.8 18 43 5.7 8.3
26-02-88 36.3 13 21 3.6 4.4
01-03-88 27.6 8.0 12 2.5 2.6
04-03-88 19.1 5.4 7.3 1.5 1.7
08-03-88 13.8 4.0 5.7 1.2 1.3
11-03-88 20.7 6.4 8.7 3.7 1.9
15-03-88 4.32 1.0 2.8 .73 .48
18-03-88 .518 .13 .20 .08 .06
22-03-88 .432 .12 .25 .06 .05
25-03-88 25.9 6.2 14 3.4 3.1
29-03-88 69.1 21 48 9.0 9.0
31-03-88 47.5 12 37 5.7 6.7
05-04-88 38.0 12 20 3.4 3.7
08-04-88 32.8 8.2 13 2.6 2.5
12-04-88 27.6 6.4 11 1.9 1.9
15-04-88 17.3 4.7 9.2 1.6 1.7
19-04-88 9.93 2.7 5,8 .99 .99
22-04-88 4.75 1.5 3.0 .52 .48
26-04-88 .432 .10 .38 .06 .06

Page 235
Table 4.47(a) GS8150200 - Dissolved pollutant concentrations
DATE FLOW(us)
pH SC(ps/cm)
Cu Mn(mg/I)
Zn SO,
02-01-88 6 3.1 1 800 5.4 3.6 8.1 1 10005-01-88 4 3.9 2 000 6.0 4.8 10 1 30008-01-88 16 3.6 2 300 6.5 5.7 14 1 50009-01-88 6 3.9 1 500 4.3 3.5 7.1 95012-01-88 14 3.9 1 600 4.2 3.3 6.8 90019-01-88 102 4.9 550 .94 .87 1.8 26021-01-88 109 4.8 540 .90 .74 .82 25029-01-88 85 5.0 500 .76 .72 .91 23002-02-88 98 5.0 450 .66 .67 .83 21005-02-88 100 4.6 700 1.1 1.1 1.3 35009-02-88 450 4.6 690 1.4 1.0 .89 34016-02-88 1 600 4.6 840 1.7 1.3 .25 42012-02-88 520 4.8 740 1.5 1.1 .57 37016-02-88 407 4.7 640 1.1 1.2 .49 32019-02-88 238 4.8 560 .99 1.1 .68 27023-02-88 700 4.9 570 .98 1.1 .38 27026-02-88 338 4.9 490 .84 .90 .51 23001-03-88 206 4.8 470 .79 .86 .68 22004-03-88 134 4.7 450 .87 .81 .95 22008-03-88 120 4.8 460 .69 .80 1.0 22011-03-88 186 4.8 480 .78 .97 .7 22015-03-88 130 4.5 740 1.5 1.3 1.6 38018-03-88 85 4.5 560 .92 1.2 1.4 27022-03-88 102 4.5 610 .92 1.2 1.3 31025-03-88 174 5.1 500 .75 .95 .75 24029-03-88 2 260 5.9 330 .18 .57 .16 15031-03-88 540 5.1 520 .88 .95 .41 24005-04-88 422 5.3 430 .65 .76 .41 20008-04-88 261 5.2 410 .62 .68 .50 19012-04-88 169 5.0 400 .66 .72 .71 19015-04-88 134 4.9 400 .64 .65 .89 19019-04-88 117 4.9 410 .53 .75 1.0 19022-04-88 105 5.0 410 .55 .71 1.0 20026-04-88 80 4.5 460 .78 .90 1.3 22029-04-88 51 4.1 680 1.1 1.4 2.0 34003-05-88 10 3.5 1 400 2.8 3.7 5.5 80009-05-88 1 3.1 3700 11 15 23 270013-05-88 1 3.2 3 400 11 13 20 2 300

Page 236
Table 4.47(b) GS815209 - Dissolved pollutant concentrations
DATE FLOW(us)
pH Sc(ps/cm)
cu Mn Zn(mg/i)
SO4
05-01-88 2 3.2 3 300 12 11 26 2 30008-01-88 6 3.1 3 700 11 11 32 2 60012-01-88 7 3.6 2 100 5.6 4.7 11 1 30019-01-88 80 5.7 420 .39 .39 1.3 190
22-01-88 80 5.2 430 .62 .73 1.6 20029-01-88 90 5.5 410 .43 .54 1.4 180
02-02-88 100 5.6 380 .38 .39 .67 170
05-02-88 90 4.7 710 1.0 .95 1.3 360
09-02-88 150 4.9 680 1.5 1.1 1.2 340
10-02-88 130 5.3 450 .65 .59 .74 21012-02-88 120 5.1 520 .74 .65 .85 240
16-02-88 110 6.0 420 .47 .55 .78 190
19-02-88 110 5.0 410 .52 .64 .86 190
23-02-88 100 4.9 490 .80 .78 1.0 32026-02-88 100 4.9 420 .66 .67 .89 190
01-03-88 110 4.7 430 .68 .72 .96 190
04-03-88 95 4.7 430 .66 .70 .98 200
08-03-88 90 4.8 440 .62 .72 1.0 21011-03-88 85 4.8 450 .62 .74 1.0 21015-03-88 110 4.4 890 1.7 1.5 1.8 47018-03-88 110 4.6 550 .80 1.1 1.4 27022-03-88 90 4.5 600 .92 1.1 1.3 27025-03-88 100 5.7 450 .34 .62 .88 21029-03-88 1 000 5.9 130 .03 .06 .08 4631-03-88 150 5.4 400 .53 .52 .80 190
05-04-88 110 5.3 380 .51 .58 .80 170
08-04-88 105 5,5 370 .47 .54 .80 170
12-04-88 98 5.2 380 .55 .59 .88 170
15-04-88 90 5.1 380 .46 .61 .91 170
19-04-88 90 5.1 380 .48 .63 .97 170
22-04-88 90 5.0 410 .55 .68 1.0 190
26-04-88 70 4.7 460 .74 .86 1.3 22029-04-88 45 4.2 690 1.1 1.3 2.1 35003-05-88 10 3.5 1 500 3.0 3.7 6.2 85009-05-88 1 2.9 4 700 13.3 17 32 3 500

Page 237
Table 4.47(c) GSSISO2IO - Dissolved pollutant concentrations
DATE FLOW(I/s)
pH Sc(ps/cm)
Cu Mn Zn(mg/I)
SO4
05-01-88 3 4.4 1 300 3.4 .34 3.12 80008-01-88 10 4.5 1 500 3.6 1.4 3.42 84012-01-88 7 4.5 1 100 2.5 1.1 2.52 65019-01-88 20 4.5 1 100 2.6 1.0 2.31 57022-01-88 18 4.6 950 2.2 .88 1.94 52029-01-88 5 4.7 780 1.7 .67 1.53 40002-02-88 7 4.7 620 1.2 .46 1.06 31005-02-88 10 5.1 470 .69 .30 .76 22009-02-88 80 4.8 440 .69 .33 .75 20010-02-88 100 4.5 930 2.6 .98 2.27 51012-02-88 55 4.6 790 2.0 .78 1.73 42016-02-88 50 4.6 710 1.7 .68 1.47 36019-02-88 40 4.7 630 1.5 .58 1.27 32023-02-88 80 4.7 570 1.4 .55 .62 29026-02-88 50 4.5 580 1.3 .63 .63 29001-03-88 30 4.8 460 .95 .42 .47 22004-03-88 25 5.2 430 .73 .32 .40 20008-03-88 20 5.6 400 .57 .23 .35 18011-03-88 15 5.5 420 .58 .26 .37 20015-03-88 20 5.5 380 .47 .23 .31 17022-03-88 5 5.6 470 .55 .25 .38 23025-03-88 10 4.8 590 1.2 .51 .61 29029-03-88 200 6.3 290 .17 .46 .11 30031-03-88 60 4.6 770 2.2 .82 .98 40005-04-88 32 4.6 640 1.6 .66 .70 28008-04-88 30 4.7 560 1.3 .53 .60 21012-04-88 20 4.9 470 .87 .37 .42 20015-04-88 18 5.1 440 .69 .29 .39 16019-04-88 10 6.1 361) .50 .14 .21 12022-04-88 7 6.2 190 .56 .08 .14 926-04-88 6 6.2 62 .05 .01 .01 129-04-88 2 6.4 70 .05 .01 .01 1
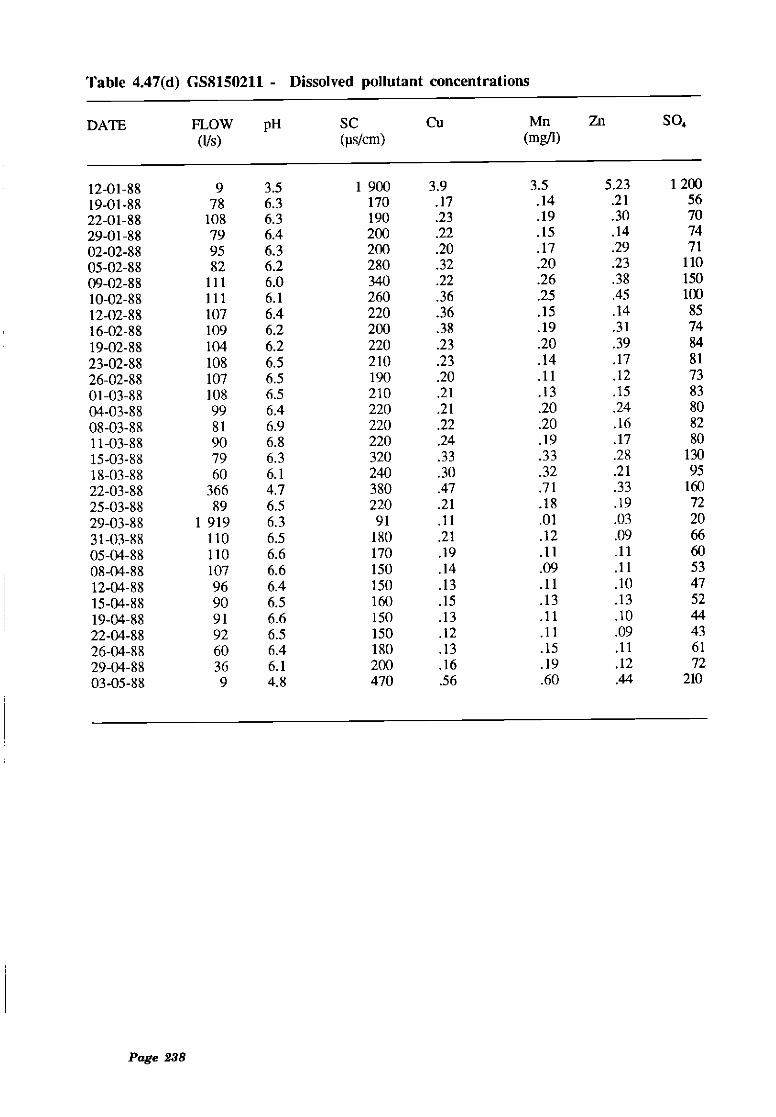
Page 238
Table 4.47(d) GS8150211 - Dissolved pollutant concentrations
DATE FLOW(Us)
pH SC(ps/cm)
Cu Mn(mg/I)
Zn SO4
12-01-88 9 3.5 1 900 3.9 3.5 5.23 1 200
19-01-88 78 6.3 170 .17 .14 .21 56
22-01-88 108 6.3 190 .23 .19 .30 70
29-01-88 79 6.4 200 .22 .15 .14 74
02-02-88 95 6.3 200 .20 .17 .29 71
05-02-88 82 6.2 280 .32 .20 .23 110
09-02-88 111 6.0 340 .22 .26 .38 150
10-02-88 111 6.1 260 .36 .25 .45 100
12-02-88 107 6.4 220 .36 .15 .14 85
16-02-88 109 6.2 200 .38 .19 .31 74
19-02-88 104 6.2 220 .23 .20 .39 84
23-02-88 108 6.5 210 .23 .14 .17 81
26-02-88 107 6.5 190 .20 .11 .12 73
01-03-88 108 6.5 210 .21 .13 .15 83
04-03-88 99 6.4 220 .21 .20 .24 80
08-03-88 81 6.9 220 .22 .20 .16 82
11-03-88 90 6.8 220 .24 .19 .17 80
15-03-88 79 6.3 320 .33 .33 .28 130
18-03-88 60 6.1 240 .30 .32 .21 95
22-03-88 366 4.7 380 .47 .71 .33 160
25-03-88 89 6.5 220 .21 .18 .19 72
29-03-88 1 919 6.3 91 .11 .01 .03 20
31-03-88 110 6.5 180 .21 .12 .09 66
05-04-88 110 6.6 170 .19 .11 .11 60
08-04-88 107 6.6 150 .14 .09 .11 53
12-04-88 96 6.4 150 .13 .11 .10 47
15-04-88 90 6.5 160 .15 .13 .13 52
19-04-88 91 6.6 150 .13 .11 .10 44
22-04-88 92 6.5 150 .12 .11 .09 43
26-04-88 60 6.4 180 .13 .15 .11 61
29-04-88 36 6.1 200 .16 .19 .12 72
03-05-88 9 4.8 470 .56 .60 .44 210

Page 239
Table 4.47(e) GS8150212 - Dissolved pollutant concentrations
DATE FLOW(Us)
pH Sc(ps/cm)
Cu Mn Zn(mg/I)
504
19-01-88 1 4.5 920 1.7 .73 .25 47022-01-88 2 4.5 910 1.8 1.7 .24 46029-01-88 1 4.7 920 1.7 1.6 .26 47002-02-88 3 4.6 930 1.8 1.7 .24 47009-02-88 220 4.5 930 2.0 1.6 .24 49010-02-88 1 300 4.6 860 1.8 1.5 .25 43012-02-88 340 4.6 830 1.7 1.5 .26 42016-02-88 250 4.7 730 1.3 1.4 .24 36019-02-88 90 4.9 660 1.1 1.5 .20 31023.02-88 510 5.1 600 1.1 1.2 .20 29026-02-88 190 5.7 500 .68 1.1 .15 22001-03-88 50 5.6 460 .69 1.1 .14 21004-03-88 14 5.6 460 .79 1.1 .15 21008-03-88 10 5.4 490 .84 1.2 .15 23011-03-88 20 5.3 490 .86 1.2 .16 23025-03-88 40 5.0 530 .95 1.3 .17 25029-03-88 1 450 5.0 530 .88 1.2 .16 25031-03-88 330 5.4 510 .92 1.1 .19 24005-04-88 280 6.0 400 .44 .92 .13 18008-04-88 140 6.1 380 .37 .89 .12 17012-04-88 50 5.9 400 .48 .93 .14 18015-04-88 2 5.7 450 .66 1.0 .15 210

Page 240
Table 4.47(f) GS8150213 - Dissolved pollutant concentrations
DATE FLOW(Ifs)
pH SC(ps/cm)
Cu Mn(mg/I)
Zn SO4
19-01-88 24 5.3 280 .22 .46 .33 120
22-01-88 133 5.8 180 .12 .32 .16 6929-01-88 44 4.5 360 .35 .70 .42 160
02-02-88 129 5.1 180 .13 .41 .16 7005-02-88 50 4.5 250 .21 .44 .11 10009-02-88 1 110 4.6 390 .46 .62 .60 17010-02-88 1 040 6.5 210 .24 .19 .15 7912-02-88 836 6.0 190 .12 .26 .23 7216-02-88 756 6.3 160 .14 .22 .15 5819-02-88 440 6.3 140 .11 .14 .18 4523-02-88 870 6.6 190 .19 .14 .14 71
26-02-88 564 6.6 170 .17 .13 .15 63
01-03-88 462 6.8 130 .10 .08 .06 4404-03-88 279 6.4 120 .11 .06 .06 4208-03-88 161 6.6 170 .12 .23 .09 6411-03-88 212 6.4 130 .11 .22 .05 4615-03-88 113 6.2 150 .12 .18 .04 53
25-03-88 30 6.6 150 .14 .16 .04 5029-03-88 3 000 6.2 48 .08 .01 .01 8
31-03-88 922 6.5 140 .13 .15 .05 4805-04-88 765 6.3 120 .13 .04 .03 3708-04-88 614 6.6 110 .09 .08 .03 3312-04-88 311 6.6 110 .08 .05 .03 3215-04-88 197 6.7 110 .08 .05 .03 3319-04-88 132 6.3 120 .08 .08 .03 41
22-04-88 54 6.2 150 .09 .13 .05 5426-04-88 15 4.5 350 .17 .66 .24 150

Page 241
Table 4.47(g) GS8150214 - Dissolved pollutant concentrations
DATE FLOW(Us)
pH SC(ps/cm)
Cu Mn(mg/I)
Zn 504
16-01-88 10 4,5 710 .83 1.6 .20 34019-01-88 40 4.4 670 .81 1.7 .16 32022-01-88 120 4.5 610 .76 1.5 .16 29029-01-88 70 4.5 610 .83 1.6 .17 29002-02-88 140 4.6 590 .76 1.5 .17 28005-02-88 35 4.2 650 1.5 2.0 .24 30009-02-88 250 4.5 580 .83 1.5 .17 27010-02-88 700 4.8 560 .71 1.3 .15 26012-02-88 450 4.9 520 .62 1.3 .15 24016-02-88 450 5.3 410 .40 .85 .15 18519-02-88 380 6.1 350 .42 .72 .12 16023-02-88 600 5.9 370 .35 .83 .11 16026-02-88 420 6.3 290 .37 .59 .10 12001-03-88 320 6.4 230 .29 .42 .09 9404-03-88 221 6.4 220 .28 .38 .08 8708-03-88 160 6.6 230 .29 .41 .09 9111-03-88 240 6.3 240 .31 .42 .18 9315-03-88 50 6.0 280 .24 .64 .17 11018-03-88 6 5.9 290 .26 .38 .16 12022-03-88 5 5.9 300 .27 .59 .14 12025-03-88 300 6.0 280 .24 .55 .13 12029-03-88 800 5.9 330 .30 .69 .13 13031-03-88 550 5.9 350 .26 .78 .12 14005-04-88 440 6.2 260 .31 .53 .09 9808-04-88 380 6.4 210 .25 .40 .08 7612-04-88 320 6.5 210 .23 .40 .07 7015-04-88 200 6.4 260 .27 .53 .09 9619-04-88 115 6.3 270 .27 .58 .10 10022-04-88 55 6.3 280 .32 .63 .11 10026-04-88 5 5.7 310 .23 .88 .13 130

Number of samples: 32Days of flow: 115Units: Concentration: mg/i
Flow 1/s
Page 242
Copper 3.9 9.0 12/1/88 <.01 1 900 29/3/88 .21
Manganese 3.5 9.0 12/1/88 <.01 1 900 29/3/88 .15
Zinc 5.3 9.0 12/1/88 .03 1 900 29/3/88 .15
Sulphate 1 200 9.0 12/1/88 20 1 900 29/3/88 265
Table 4.48(a) GS8150200 - Water quality
MAX.CONC. FLOW DATE
MIN.CONC. FLOW DATE
MEANCONC.
Copper 10.9 1.0 9/5/88
Manganese 14.7 1.0 9/5/88
Zinc 23.0 1.0 9/5/88
Sulphate 2 700 1.0 9/5/88
.18
.57
.16
150
4 500 29/3/88
4 500 29/3/88
4 500 29/3/88
4 500 29/3/88
.91
.94
.56
265
Number of samples: 38Days of flow: 140Units: Concentration mg/i
Flow I/s
Table 4.48(b) GS815209 - Water quality
MAX.CONC. FLOW DATE
MIN.CONC. FLOW DATE
MEANCONC.

Number of samples: 35Days of flow: 126Units: Concentration mg/I
Flow I/s
Page 243
Copper 12.1 4,0 5/1/88 .03 2 000 29/3/88 .56
Manganese 11.4 4.0 8/1/88 .06 2 000 29/3/88 .60
Zinc 32.0 4.0 8/1/88 .08 2 000 29/3.88 .90
Sulphate 2 600 4.0 8/1/88 46 2 000 29/3/88 190
Table 4.48(c) GS8150210 - Water quality
MAX.CONC. FLOW DATE
MIN.CONC. FLOW DATE
MEANCONC.
Copper 3.6 1.0 8/1/88
Manganese 1.4 1.0 8/1/88
Zinc 3.4 1.0 8/1/88
Sulphate 840 1.0 8/1/88
.05
<.01
<.01
<10
2
2
2
2
29/4/88
29/3/88
29/3/88
29/3/88
1.26
.57
.90
320
Number of samples: 32Days of flow: 110Units: Concentration mg/l
Flow 1/s
Table 4.48(d) GS8150211 - Water quality
MAX.CONC. FLOW DATE
MINCONC. FLOW DATE
MEANCONC.

Page 244
Number of Samples. 27Days of Flow: 94Units: Concentration mg/i
Row I/s
Copper .46 1 110 9/2/88 <.01 610 8/4/88 .15
Manganese .70 44.0 29/1/88 <.01 5 500 29/3/88 .16
Zinc .60 1 100 9/2/88 <.01 610 8/4/88 .05
Sulphate 175 180 22/3/88 8 5 500 29/3/88 55
Table 4.48(e) GS8150212 - Water quality
MAX.CONC. FLOW DATE
MN.CONC. FLOW DATE
MEANCONC.
Copper 1.8 1.0 19/1/88
Manganese 1.7 3.0 22/1/88
Zinc .26 15.0 29/1/88
Sulphate 490 12.0 9/2/88
.37
.89
.12
165
124
124
124
124
8/4/88
8/4/88
8/4/88
8/4/88
1.19
1,29
.20
320
Number of Samples: 35Days of Row: 126Units: Concentration mg/i
Flow 1/s
Table 4.48(1) GS8160213 - Water quality
MAX.CONC. FLOW DATE
MIN.CONC. FLOW DATE
MEANCONC.

Table 4.48(g) GS8150214 - Water quality
Number of samples: 35Days of flow 126Units: Concentration mg/l
Flow 1/s
Page 245
MAX.CONC. FLOW DATE
MN.CONC. FLOW DATE
MEANCONC.
Copper 1.8 1.0 19/1/88 .37 124. 8/4/88 1.19
Manganese 1.7 3.0 22/1/88 .89 124 8/4/88 1,29
Zinc .26 15.0 29/1/88 .12 124 8/4/88 .20
Sulphate 490 12.0 9/2/88 165 124 8/4/88 320

APPENDIX C
WATER QUALITY OF THE OPEN CUTS(Chapter 6)
FIGURES
Page 247

Page 248
I0
6
5
4
3
27/8/861/10/8518/11/8612/2/8725/5/879/11/87
220 30
-C
-d
40 50 60
DEPTH metrGs AHD
Figure 6.2 1986-87 White's Open Cut pH profiles

SPECIFIC
CONDUCTANCE
I
8000
6000
4000
2000
1000
600
400
200
10020
27/8/861/10/8618/11/8612/2/8725/5/879/1 1/87
-7 r I
DEPTH mGtr-s AHD
30 40 50 60
Figure 6.3 1986-87 White's Open Cut specific conductance profiles
m

COPPER
CONCENTRATION
m9/L
0
I60
40
20-J
01E 10z
< 4a:FzuJLi 2z0c-i
a: 1
LU0-.0- .60Li .4
.2
27/8/861 / 10/8618/1 1/8612/2/8725/5/879/11/87
N
r I r r m
"N
N N
Nt'N
N
N-N
20 30 40 50 60
DEPTH mtnes AHD
Figure 6.4 1986-87 White's Open Cut copper profiles

MANGANESE
CONCENTRATION
mg/L
200
100
60
40
20
10
4
2
1
:5
NN
27/8/ 851/10/8618/1 1/8512 / 2//8725/5/879/11/87
605020 30 40
DEPTH rnetrs AHO
Figure 6.5 1986-37 White's Open Cut manganese profiles
I-I

Page 252
r r I
N
NN
NN / '
NN
DEPTH metres AHD
Figure 6.6 1986-87 White's Open Cut zinc profiles
-
50
H
Hzw 27/8/ 86Uz 1/10/ 86C.4U 18/11/86
Uz12/2/87
25/5/87NJ
9/11/87
.1
06
5
4
30 40 50
1 1

SULPHATE
CONCENTRATION
6000-
4000-
2000
1000
600
400
200k
r
27/8/861/10/8618/11/8612/2/8725 / 5 / 879/11/87
1.0020 30
DEPTH metres AHD
Figure 6.7 1986-87 White's Open Cut sulphate profiles
7-
40 50 60

Page 254I
I0
6
5
DEPTH rnQtros AHD
Figure 6.8 1986-87 Intermediate Open Cut pH profiles
'I
26/8/86
1/1D/86 \ "
18/11/8612/2/87
12/5/87
15/9/879/11/87
-a-
4 I I II I p I I I i i i I I i i I I i j i I I
0 10 20 30 40 50 60
T rr C r T 1 I r T

SP
EC
IFIC
C
ON
DU
CT
AN
CE
uS
/cm
5000
4000
2000
I üüü
L
DEPTH rnQtrs AHD
-r m I
49Q I I i I I I i i I
0 10 20 30 40 50 60
Figure 6.9 1986.87 Intermediate Open Cut specific conductance profiles
\'
1 CT-rj1Jj25/8/861/10/86
18/11/85
12/2/87
12/5/87
15/9/87
9/11/87
L I I i I I i I I i

Page 256
G
4
-J
mE
zC'-4F-C .6F-
LULU-4zCLi
w .200CU
1
1
06
- 040
r r
10
N
N'N
'NN'
I ////\
: r--L'- J-/
</ 4 / N.:/, / /
/ --.2" / /\c< I/:/" ,/' 26/8/86
/":/ / '' 1/10/864, / / // / / 18/11/86/7 1N / : / 12/2/87
20
-C I C F
: /N '. :/N - :'( ,I
I i i I t i I I i I I i i I
50 6030 40
DEPTH metrcs AHD
Figure 6.10 1986-87 Intermediate Open Cut copper profiles
r rr
25/5/8715/9/879/11/87
r -r r

MANGANESE
CONCENTRATION
10
\
I, "I' \' r
-II / ._---;-./ / -
-1' 1/' 7 -
'N \'N \ N
'N \\'N\ //\\ "y5/
I I L I I I i I I i I L i i I I
26/8/861 / 10/8618/11/8512/2/8725/5/8715/9/87
- 9/11/87
10 20 30 40 50 60
DEPTH nietrcs AHD
Figure 6.11 1986-87 Intermediate Open Cut manganese profiles

Page 258
-J- 601
E
.4C-IH
H-zw(-3zCLi
.04
02
r
' 7-
0 10
-Tr 1 _7___
17- T ' 7-
c_ -. NN
N
- :-. N
aN -- N ft IN
N ftN
N
H -' -- y. --.
26/8/86 N\- \ -H /r-H.1/10/86 N \18/12/86 \ N- 12/2/87 N25/5/87 H
15/9/879/11/87
DEPTH mtres AH[D
I I I I pI i P_I I
20 30 40 50 60
Figure 6.12 1986-87 Intermediate Open - Cut zinc profiles
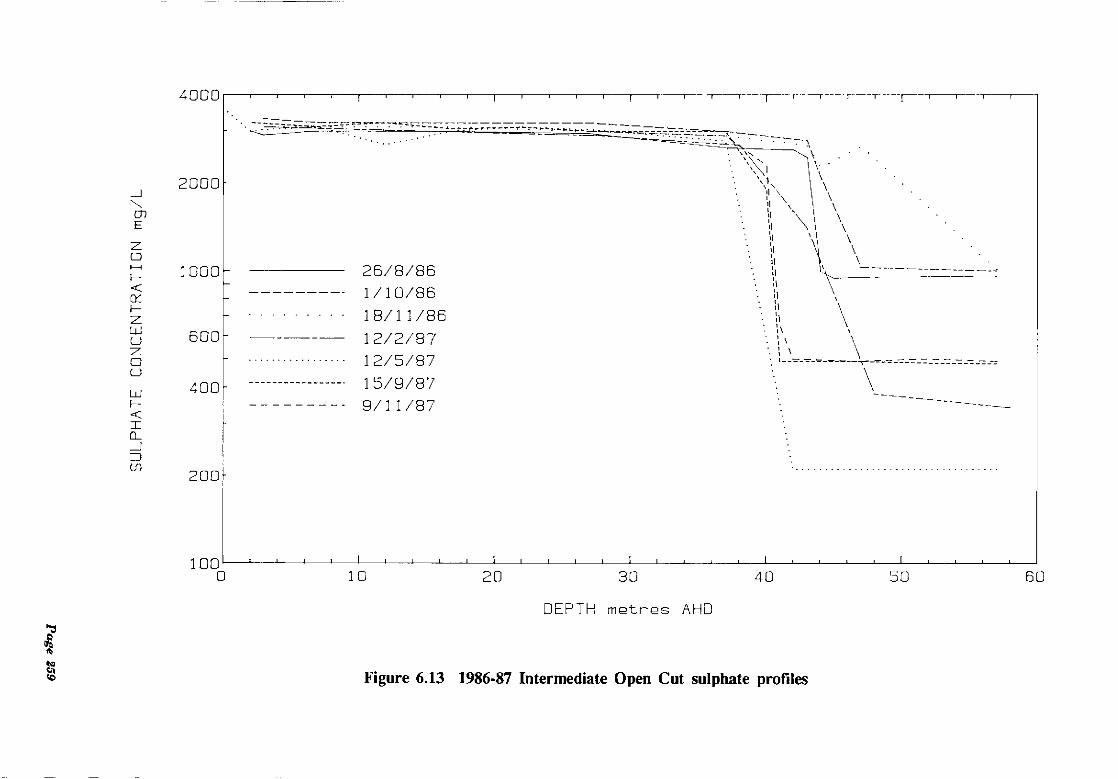
SULPHATE
CONCENTRATION
rng/L
4000
2000
1000
600
400
200
1000
26/8/861 / 10/8619/11/8612/2/8712/5/8715/9/879/11/87
i I I I r -r r T [ I -c
-
I \\\I
;I\ \
"HII '-\ \II \
N\
I--------s- -
I I I I I I i I I I i i I I
10 20 30 40 50 60
DEPTH mtrgs AHD
Figure 6.13 1986-87 Intermediate Open Cut sulphate profiles

DE
PT
H
mtrs
AH
D
I60
50h-
40
30
I -z -I- I I- I
SURFACEFRESH LAYER/MIXED LAYER INTERFACEMIXED LAYER/UNTREATED LAYER INTERFACE
/\ /
NOV DEC JAN FEB MAR APR MAY JUN JUL AUG SEP OCT
87 87 88 88 88 88 88 88 88 88 88 88
Figure 6.14 White's Open Cut 1987-88 profiles

t
90
70
50c-f)wzzCF-
30
10
NN
'N
1
I I I I I I I I I I
30 40I L -1- I
DEPTH mGrtres AHD
Figure 6.15 White's Open Cut 1987.88, cumulative copper & manganese
50
1 1 T
CUMULATIVE COPPER 21/12/87CUMULATIVE COPPER 13/5/88CUMULATIVE MANGNESE 21/12/87CUMULATIVE MANGANESE 12/5/88
60

Page 262
r T r I r I II I T -T I
N
DEPTH mer-trs AHO
c -c r 1 T T -I 7 1 V
CUMULATIVE COFFER 20/4/88
CUMULATIVE COFFER 13/5/88CUMULATIVE MANGANESE 20/4/88
- CUMULATIVE MANGANESE 13/5/88
1 I
Figure 6.16 White's Open Cut 1987-88, comparison of heavy metals 20/4/88 & 13/5/88
90 r rI T
70
b
50U)wzzCF-
30 N
N
10
1030 40 50 - 60

Page 263
60
40
2O0?E
z100F-IF- 5CF- 4zwC-)
U
uj 1
ELI05(-3
.4
.2
-r
9/11/87
21/12/877/1/88
17/2/88
Figure 6.17 White's Open Cut 1987-88, copper concentration start of wet season
30 40 50 60
DEPTH mctres AHD

MANGANESE
CONCENTRATION
rn9/L
I100
50
10
5
1
- - rrcr.
.130 40
DEPTH metres AHO
9/11/872 1/12/877/1/8817/2/88
50
1
Figure 6.18 White's Open Cut 1987-88, manganese concentration start of wet season
1
60

Page 265
60
40
20mE
z10C-4I- 5-
F- 4zwc-i
2-CLi
LU 1:-
IL -o 6-Li -
4-
.2
30 40
DEPTH metr-cs AHD
17/2/889/3/8829/3/88
- 30/3/88
Figure 6.19 White's Open Cut 1987-88, copper concentration middle of wet season
50 60

MANGANESE
CONCENTRATION
m9/L
5
.5
1:
r V
N
r r
17/2/889/3/8829/3/8830/3/88
Figure 6.20 White's Open Cut 1987-88, manganese concentration middle of wet season
30 40 50 60
DEPTH metnes AHD
100:
50
10:

COPPER
CONCENTRATION
rn9/L
I.4
30/3/88
13/4/88
20/4/88
13/5/88
-r I1 I T
60 NN
N
40"N\\
N"
2001 \NE
z 10Ck-
a:
6
F-z 4
LiiLiZ 2Uc-i
a:w I
EiELo 5U
4
.2
30 40 50 60
DEPTH metres AHD
Figure 6.21 White's Open Cut 1987-88, copper concentration end of wet season

MANGANESE
CONCENTRATION
mg/L
-V
100
N
50
30/3/8813/4/88
20/4/88
- 13/5/88
DEPTH rrtr2s AHD
Figure 6.22 White's Open Cut 1987-88, manganese concentration end of wet season
5
1
.5
.1
-
I I I I
30 40 50 60

Page 269
.5
4
.2
30
NN
I
40
DEPTH mGtres AHD
13/5/88
2/6/881/7/88
27/10/88
50
Figure 6.23 White's Open Cut 1987-88, copper concentration dry season
r I
60
60
40
200)E
z 10C

MANGANESE
CONCENTRATION
.5
.130
N
DEPTH metrcs AHD
13/5/882/6/88
/7/88
27/10/88
1 T
Figure 6.24 White's Open Cut 1987-88, manganese concentration dry season
100
50-
10
1
40 51] 60

DE
PT
H
mG
trGs
AH
D
i
60
50
40
30OCT 86
NN
N NN
NN
N
SURFACEFRESH WATER/TREATED WATER INTERFACE
MAY 87 OCT 87
N
Figure 6.25 Intermediate Open Cut 1987-88, profiles
NN NN / NN NN
NN
NN
N
MAY 88 OCT 88

Page 272
02U
I
020
r -r t r r r
-I t I I I I I
30 40
DEPTH metres AHD
Figure 6.26 Jntermediate Open Cut 1987-88, copper concentration
50 60
-J
0)£
uJ
EL
4
-1- I r
9/11/8711/2/8810/3/889/4/8827/4/8812/5/881/7/8827/10/88

Page 278
w -U)w -z
-
(-3z2-cc -
1,: 1A 1.
DEPTH metres AHO
Figure 6.27 Intermediate Open Cut 1987-88, manganese concentration
'/
50 50
9/1 1/8711/2/8810/3/889/4/9827/4/8812/5/88 :1/7/88 I -\
Noi3
- :1I1
-\\27/10/88E
020 30 40

SU
LPH
AT
E
i
5000
4000
2000
000
500
400
200
9/1 1/8711/2/8810/3/889/4/8827/4/8812/5/881/7/887/ 10/88
10020 30
I I L J I I I
40 50 50
DEPTH nietrss AHD
Figure 6.28 Intermediate Open Cut 1987-88, sulphate concentration
I----- -- ----- II -

Page 275
320
-r
9/11/871/2/8810/3/889/4/8827/4/8812/5/881/7/8817/10/89
\ \' \'-c\:
I
DEPTH mtres AHD
/N
Figure 6.29 Intermediate Open Cut 1987-88, pH
1
30 40 50 60
6
0
4
APPENDIX D
WATER QUALITY OF THE OPEN CUTS(Chapter 6)
TABLES
Page 277

Table 6.1 White's Open Cut water quality August 1986-November 1987
Page 278
Date AHD(m)
pH SC(p5/cm)
Cu Mn(mg/I)
Zn 504
27-08-86 59.0 6.0 1340 .33 1.2 .12 720
27-08-86 49.0 6.2 1340 .33 1.2 .12 730
27-08-86 47.0 6.1 1340 .33 1.2 .12 710
27-08-06 46.0 5.7 1620 .40 1.6 .12 920
27-08-86 45.0 5.1 3560 .74 5.3 .17 2250
27-08-86 44.0 5.1 3650 .77 4.7 .16 2290
27-08-86 41.0 5.1 4130 1.2 13 .29 2650
27-08-86 39.0 4.7 4870 4.7 39 1.2 3450
27-08-86 37.0 4.0 5800 18 83 3.5 4550
27-08-86 35.0 3.3 6760 35 122 5.0 5640
27-08-86 33.0 2.9 8190 62 163 6.4 7050
27-08-86 31.0 2.8 8480 64 167 6.5 7170
27-08-86 29.0 2.8 8480 67 174 6.6 7260
01-10-86 59.0 5,8 1360 .40 1.3 .15 720
01-10-86 49.0 5.8 1360 .40 1.3 .15 730
01-10-86 47.0 5.8 1380 .40 1.4 .15 730
01-10-86 46.0 5.8 1420 .40 1.4 .15 810
01-10-86 45.0 5.3 3100 .88 5.2 .20 1920
01-10-86 39.0 4.7 4690 3.5 33 .89 3310
01-10-86 37.0 4.1 5700 14 81 .58 4360
01-10-86 33.0 3.1 8100 60 180 1.4 7300
01-10-86 29.0 3.2 8410 65 190 7.2 8140
18-11-86 59.0 5.3 1390 .56 1.5 .15 753
18-11-86 49.0 5.5 1380 .53 1.5 .16 760
18-11-86 47.0 5.5 1400 .42 1.5 .15 780
18-11-86 46.0 4.9 2420 .74 3.9 .18 1470
18-11-86 45,0 5.1 3290 .81 7.2 .20 2130
18-11-86 39.0 4.4 5000 6.2 51 1.4 3650
18-11-86 37.0 3.7 6000 18 96 3.7 4680
18-11-86 33.0 2.9 8200 56 178 6.4 7500
18-11-86 29.0 2.9 8500 60 191 6.6 7870
12-02-87 60.0 6.0 520 .30 .80 .06 240
12-02-87 55.0 6.0 510 .30 .80 .08 230
12-02-87 50.0 5.9 610 .35 .90 .06 280
12-02-87 45.0 5.7 790 .45 1.3 .10 360
12-02-87 40.0 4.9 4320 2.8 30 .70 2470
12-02-87 30.0 2.8 8300 61 210 3.4 6100

Page 279
Date AHD(m)
pH Sc(pS/cm)
Cu Mn Zn(mg/I)
SO4
25-05-87 59.0 6.6 360 .25 .S9 .07 15025-05-87 54.0 5.0 370 .23 .91 .06 15025-05-87 49.0 5.3 370 .17 .86 .06 15025-05-87 44.0 5.6 360 .17 .96 .07 15025-05-87 39.0 4.6 4700 6.7 61 1.5 3200
09-11-87 59.0 5.3 690 .42 1.9 .20 33009-11-87 58.0 4,5 690 .41 1.9 .19 33009-11-87 54.0 4.7 690 .40 1.9 .18 32009-11-87 49.0 4.7 690 .36 1.9 .17 32009-11-87 44.0 5.0 700 .35 2.0 .16 33009-11-87 42.5 4.4 3300 1.9 19 .74 220009-11-87 42.0 4.6 3740 2.0 22 .89 250009-11-87 40.0 4.4 4740 4.0 59 1.8 330009-11-87 37.0 3.3 6200 21 186 8.9 4800

Table 6.2 Intermediate Open Cut water quality August 1986-November 1987
Page 280
Date AHD(m)
pH SC(p S/cm)
Cu Mn(mg/i)
Zn 504
27-08-86 57.0 4.8 1700 2.7 2.0 .25 960
27-08-86 47.0 4,8 1700 2.7 2,0 .24 950
27-08-86 45.0 4.8 1700 2.6 2.0 .24 940
27-08-86 44.0 4.9 1750 2.5 2.0 .25 1000
27-08-86 43.0 6.1 3600 .84 .82 .10 245027-08-86 42.0 5.8 3750 .65 .33 .06 260027-08-86 37.0 6.1 3800 .60 .32 .06 2650
27-08-86 27.0 6.6 4100 .17 .18 .03 295027-08-86 17.0 6.3 4100 .55 .99 .23 3000
27-08-86 13.0 5.8 4200 1.4 2.1 .78 300027-08-86 12.0 5.9 4200 1.9 2.3 .63 3000
27-08-86 8.0 5.9 4200 2.5 3.0 .80 3000
27-08-86 7.0 5.5 4200 3.0 3.7 .96 3000
27-08-86 3.0 4.6 4100 4.8 8.4 1.9 2900
27-08-86 2.0 5.3 4300 5.4 11 2.4 3000
01-10-86 57.0 4.7 1720 2.9 1.7 .27 1000
01-10-86 47.0 4.7 1730 2.8 1.7 .28 1030
10-10-86 44.0 5.6 2980 1.6 .98 .18 2100
01-10-86 43.0 6.1 3700 .82 .49 .13 2800
01-10-86 37.0 5.9 3950 1.1 .85 .18 3000
01-10-86 27.0 6.7 4100 .17 . 9 .07 3200
01-10-86 17.0 6.1 4160 .80 1.6 .41 3200
01-10-86 7.0 5.5 4200 2.8 5.0 1.1 3200
01-10-86 3.0 4.7 4300 4.6 12 1.9 3300
18-11-86 57.0 4.6 1760 3.2 1.4 .28 1010
18-11-86 47.0 6.0 3900 .73 .24 .11 267018-11-86 44.0 5.4 3400 1.9 .84 .28 2260
18-11-86 43.0 6.1 3900 .76 .23 .10 2700
18-11-86 37.0 5.8 4100 1.4 .56 .23 2900
18-11-86 27.0 6.6 4300 .15 .11 .05 300018-11-86 17.0 6.1 4300 .85 .81 .50 3100
18-11-86 7.0 5.6 4400 2.9 2.7 1.1 310018-11-86 3.0 4.7 4500 4.2 8.9 2.0 3100
12-02-87 58.0 5.6 720 .60 1.1 .10 340
12-02-87 53.0 5.5 750 .60 1.1 .10 360
12-02-87 48.0 5.5 780 .65 1.2 .10 380
12-02-87 43.0 5.3 2200 1.3 1.4 .20 1400
12-02-87 38.0 5.8 3700 1.6 1.2 .20 270012-02-87 28.0 6.6 4000 .05 .25 .06 290012-02-87 3.0 6.0 4200 2.1 12 1.8 3100

t8t dJ%J
OOZE Vt 1 Zi 00ZV !9 O'Z L8-T1-60 001 Vt Z'S Z'Z ocip s'c 0L L81U60 OOZE Zt Li. Zt oozp cc OtT L8-T1-60 ococ CT cc Z8' 0011' (19 0L1 L8-T1-60 001 59' Z.Z IV 0011' o'c Ott L8-IT-60 000 1T £9' tO' 001-P 0i.Z L8-IT-60 000 80' 6' 9W 0011' 09 O'ZE L8-TT-60 000 CC 66' LV 0001' Cc 071 L8-IT-60 0061 98' 6'Z WI O08Z T'c 0O'P L8-!I-60 061' c 9'i VT O6 oc o'it' L2-!T-60 061' PE' L'I 9'T 0c6 91' Ott L8-TT-60 061' cc' 9'! 91 06 91' OLP L8-Ti-60 P81' XC' CT ci Ott 6't' o'zc L8-TT-60 081' LE' CT C! Ot'6 61' oi.c L*1!60
009 c1 ST 61 0001' V9 0' L8-co-cz 000E 91 91 E't 0001' C9 0Z OOTE -P.! c6 ct 0Z6E 0'9 OL ts-co-cz OOLZ I'! (18 Ct 006 6-c Ot! ts-co-ct 000 9' c-c c- 0E8E E'9 (1/A ts-co-cz 001 C Li TV 018 P'9 Ott 0P0E 90' oc LW 018 cc O'LZ Ls-co-cz 06Lt 8Z' Vt 61 09E cc O'LE Ls-co-cz OTt It' 'T 1'! 091' Vc Ott' Ls-co-cz OTt cu ci ti oct Vc o'tc ts-co-cz Ott OT CT Ii occ p'c O'Lc
(j/w) (wa/gil) (Ui) "OS U7 uw OS I-Id (tHY

Table 6.3 White's Open Cut profiling data 1987-88
Page 282
Date AHD(m)
pH SC(ps/cm)
Cu Mn(mg/I)
Zn SO4
09-11-87 59.0 5.3 690 .42 1.88 .20 330
09-11-87 58.0 4.5 690 .41 1.88 .19 330
09-11-87 54.0 4.7 690 .40 1.87 .18 320
09-11-87 49.0 4.7 690 .36 1.88, .17 320
09-11-87 44.0 5.0 700 .35 1.99 .16 330
09-11-87 42.5 4.4 3300 1.90 18.90 .74 220009-11-87 42.0 4.6 3740 1.95 22.00 .89 2500
09-11-87 40.0 4.4 4740 3.95 59.00 1.80 330009-11-87 37.0 3.3 6200 21.01 186.00 8.85 4800
21-12-87 59.2 4.5 690 .60 1.80 .08 320
21-12-87 57.0 4.4 710 .50 1.80 .08 320
21-12-87 55.0 4,6 710 .55 1.80 .08 32021-12-87 53.0 4.6 700 .55 1.80 .08 320
21-12-87 51.0 4.7 700 .60 1.80 .06 320
21-12-87 49,0 4.7 700 .55 1.80 .06 320
21-12-87 47.0 4.7 700 .60 1.80 .06 320
21-12-87 45.0 4.8 720 .45 1.90 .06 330
21-12-87 44.0 4.7 900 .50 2.50 .06 420
21-12-87 43.0 4.2 3800 2.00 21.00 .50 240021-12-87 41.0 4.2 4400 3.30 31.00 .76 286021-12-87 39.0 4.1 5100 8.30 69.00 1.75 350021-12-87 37.0 3.2 6500 28.00 133.00 4.90 480021-12-87 35.0 2.9 8000 56.00 194.00 6.30 660021-12-87 33.0 2.8 8400 64.00 210.00 6.90 710021-12-87 31.0 2.8 8500 64.00 210.00 6.80 7200
07-01-88 59.9 4.2 700 .82 1.83 .07 33007-01-88 58.0 4.5 700 .71 1.77 .06 330
07-01-88 56.0 4.6 700 .69 1.91 .06 33007-01-88 54.0 4.6 700 .75 1.80 .06 330
07-01-88 52.0 4.6 700 .78 1.77 .06 33007-01-88 50.0 4.6 700 .74 1.80 .06 330
07-01-88 48.0 4.7 700 .70 1.78 .06 330
07-01-88 46.0 4.7 700 .73 1.78 .06 70007-01-88 44.0 4.8 740 .44 1.89 .04 740
07-01-88 42.0 4.5 4100 2.73 25.00 .57 280007-01-88 40.0 4.3 4800 4.90 45.00 1.19 330007-01-88 38.0 3.4 5800 14.10 101.00 3.25 440007-01-88 36.0 3.1 6900 37.00 150.00 5.30 560007-01-88 34.0 3.0 8100 61.00 201.00 6.60 720007-01-88 32.0 3.0 8300 66.00 207.00 7.03 7500

Page 283
Date AHD(m)
pH Sc(ps/cm)
Cu Mn Zn(mg/i)
504
13-01-88 59.9 4.7 700 .79 1.75 .15 33013-01-88 58.0 4.6 700 .67 1.72 .14 33013-01-88 56.0 4.6 700 .75 1.77 .14 33013-01-88 54.0 4.6 700 .79 1.72 .13 33013-01-88 52.0 4.6 700 .78 1.74 .14 33013-01-88 50.0 4,6 700 .78 1.73 .14 33013-01-88 48.0 4.6 700 .83 1.75 .13 33013-01-88 46.0 4.7 700 .77 1.72 .13 33013-01-88 44.0 4.7 750 .52 1,87 .12 36013-01-87 42.0 4.5 3800 2.07 22.00 .49 253013-01-88 40.0 4.3 4700 5.00 45.00 1.19 340013-01-88 38.0 3.4 5700 14.40 92.00 5.01 430013-01-88 36.0 3.2 6900 36.00 150.00 6,50 560013-01-88 34.0 3.1 7800 60.00 200.00 7.12 715013-01-88 32.0 3.1 8300 63.00 210.00 7,14 8200
21-01-88 60.0 4.6 600 .72 1.30 .13 28021-01-88 50.0 4.5 670 .72 1.40 .13 32021-01-88 44.0 4.6 720 .54 1.50 .10 35021-01-88 42.0 4.5 3600 1.90 16.00 2.30 240021-01-88 40.0 4.4 4600 4.40 41.00 1.10 330021-01-88 38.0 3.4 5800 17.00 97.00 3.50 450021-01-88 36.0 3.2 6600 31.00 130.00 4.90 5300
28-01-88 60.0 4.8 600 .74 1.20 .13 28028-01-88 50.0 4.7 680 .76 1.40 .12 32028-01-88 44.0 4.7 720 .66 1.50 .11 35028-01-88 42.0 4.5 3700 2.60 17.00 .44 250028-01-88 40.0 4.2 4850 5.90 50.00 1.30 350028-01-88 38.0 3.5 5600 13.00 84.00 1.10 420028-01-88 36.0 3.2 6700 34.00 135.00 5.50 5400
03-02-88 60.0 4.8 600 .75 1.20 .26 27003-02-88 50.0 4.8 690 .69 1.43 .26 32003-02-88 44.0 4.8 750 .57 1.60 .21 36003-02-88 42.0 4.6 3800 2.02 18.00 .92 250003-02-88 40.0 4.3 4800 4.79 50.00 2.21 340003-02-88 38.0 3.5 5700 13.80 93.00 5.95 450003-02-88 36.0 3.2 6900 37.00 133.00 11.05 570003-02-88 34.0 2.9 8200 71.00 182.00 15.00 7300

Table 6.3 Cont'd
Page 284
Date AHD(m)
pH SC(p S/cm)
Cu Mn Zn(mg/i)
SO4
10-02-88 60.6 4.7 570 .69 1.12 .26 260
10-02-88 50.0 4.8 610 .65 1.27 .25 280
10-02-88 44.0 4.8 630 .63 1.37 .24 290
10-02-88 42.0 4.5 3700 1.99 17.00 .87 2400
10-02-88 40.0 4.4 4700 4.77 48.00 2.14 330010-02-88 38.0 3.5 5700 13.00 80.00 5.80 420010-02-88 36.0 3.2 6900 37.00 131.00 11,60 5600
10-02-88 34.0 2.9 8100 69.00 158.00 15.70 7200
17-02-88 60.0 5.9 380 .34 .76 .10 170
17-02-88 56.0 5.7 400 .30 .84 .09 180
17-02-88 54.0 5.4 490 .41 1.09 .10 22017-02-88 46.0 5.3 530 .48 1,26 .11 25017-02-88 44.0 5.3 590 .51 1.52 .11 28017-02-88 42.0 4.8 3900 2.22 22.00 .51 260017-02-88 40.0 4.5 4820 5.60 57.00 1.19 350017-02-88 38.0 3.4 5800 16.00 90.00 3.10 4400
17-02-88 36.0 3.1 7000 39.00 145.00 5.80 560017-02-88 34.0 2.9 8200 70.00 193.00 7.30 7200
17-02-88 32.0 2.8 8500 74.00 203.00 7.50 7400
24-02-88 60.2 6.0 340 .24 .72 .12 140
24-02-88 54.0 5.9 390 .24 .89 .12 170
24-02-88 52.0 5.9 420 .28 .98 .13 180
24-02-88 48.0 5.8 460 .32 1.15 .14 200
24-02-88 46.0 5.9 480 .32 1.25 .13 21024-02-88 44.0 5.6 560 .40 1.55 .14 25024-02-88 42.0 5.5 860 .58 2.81 .18 42024-02-88 40.0 4.8 4500 3.74 34.00 .90 310024-02-88 38.0 3.7 5400 9.72 72.00 2.20 390024-02-88 36.0 3.2 6500 28.00 125.00 4.70 5100
24-02-88 34.0 2.9 7900 65.00 182.00 7.00 670024-02-88 32.0 2.8 8500 76.00 198.00 7.50 760024-02-88 30.0 2.8 8600 79.00 206.00 7.50 7700
02-03-88 40.0 4.8 2800 1.70 14.50 .36 1800
02-03-88 38.0 4.6 4600 4,30 40.00 1.00 330003-02-88 36.0 3.6 5400 11.00 69.00 2.40 400002-03-88 34.0 3.1 6800 41.00 137.00 5.50 560002-03-88 32.0 2.9 8200 65.00 183.00 7.90 730002-03-88 30.0 2.8 8500 69.00 197.00 8.10 7800

Page 285
Date AHD(m)
pH Sc(pS/cm)
Cu Mn Zn(mg/I)
504
09-03-88 60.0 6.1 240 .13 .35 .07 9509-03-88 56.0 5.9 270 .18 .49 .07 11009-03-88 54.0 6.0 330 .28 .71 .07 14009-03-88 50.0 5.7 420 .33 .93 .08 19009-03-88 46.0 4.8 490 .38 1.24 .08 22009-03-88 44.0 5.2 590 .46 1.62 .10 27009-03-88 42.0 4.8 3120 1.88 15.40 .39 200009-03-88 40.0 4.6 4800 5.00 44.00 1.18 330009-03-88 38.0 3.4 5800 15.65 94.00 3.35 430009-03-88 36.0 3.2 6810 39.00 131.00 5.80 540009-03-88 34.0 2.9 8100 58.00 194.00 8.10 720009-03-88 32.0 2.8 8500 63.00 197.00 8,00 770009-03-88 30.0 2.8 8500 63.00 197.00 8.30 7800
16-03-88 60.0 6.1 260 .22 .50 .10 11016-03-88 56.0 5.9 260 .17 .51 .09 11016-03-88 54.0 5.7 330 .27 .74 .10 14516-03-88 52.0 5.6 410 .31 1.97 .11 18016-03-88 50.0 5.6 430 .32 1.06 .11 19016-03-88 48.0 5.6 470 .35 1.20 .11 22016-03-88 46.0 5.4 490 .36 1.33 .14 23016-03-88 44.0 5.5 640 .40 1.95 .13 30016-03-88 42.0 4.8 3600 2.19 20.00 .50 240016-03-88 40.0 4.5 4900 5.88 51.00 1.36 370016-03-88 38.0 3.4 5800 15.90 95.00 3.30 440016-03-88 36.0 3.2 6800 39.00 151.00 5.45 560016-03-88 34.0 3.0 8000 71.00 196.00 7.70 7200
23-03-88 60.0 6.1 286 .29 .58 .14 11923-03-88 54.0 5.7 302 .24 .64 .13 12823-03-88 52.0 5.7 412 .31 .96 .13 18123-03-88 50.0 5.7 436 .33 1.03 .13 19323-03-88 48.0 5.6 471 .34 1.16 .14 22223-03-88 46.0 5.8 508 .41 1.35 .14 23123-03-88 44.0 5.8 630 .43 1.79 .11 29623-03-88 42,0 4.7 3250 2.04 15.85 .41 204823-03-88 40.0 4.6 4790 4.92 43.00 1.12 334923-03-88 38.0 3.5 5710 12.10 82.00 2.70 417723-03-88 36.0 3.1 6930 34.00 143.00 5.30 558623-03-88 34.0 2.9 8200 57.00 196.00 6.80 751123-03-88 32.0 2.9 8470 62.00 208.00 7.10 769523-03-88 30.0 3.0 8500 62.00 209.00 7.10 7774

Table 6.3 Cont'd
Page 286
Date AHD(m)
pH SC(pS/cm)
Cu Mn(mg/I)
Zn 504
29-03-88 60.1 5.7 361 .32 .74 .13 155
29-03-88 48.0 5.8 384 .26 .85 .12 168
29-03-88 46.0 5.8 449 .30 1.07 .13 206
29-03-88 44.0 5.7 499 .33 1.25 .14 232
29-03-88 42.0 4.8 2860 1.77 12,35 .42 1846
29-03-88 40.0 3.4 5770 16.65 77.00 3.25 4389
29-03-88 38.0 3.1 6970 44.00 132.00 5.55 5720
29-03-88 36.0 2.9 8210 63.00 172.00 7.60 774629-03-88 34.0 2.9 8380 66.00 177.00 7.70 7922
29-03-88 32.0 2.8 8480 67.00 177.00 7.70 7900
29-03-88 30.0 2.8 8500 67.00 177.00 8.00 7800
30-03-88 60.1 6.0 371 .24 .81 .13 160
30-03-88 56.0 5.6 380 .25 .82 .13 164
30-03-88 46.0 5.9 510 .25 1.03 .13 192
30-03-88 44.0 5.8 476 .26 1.18 .14 216
30-03-88 42.0 5.4 1000 .56 3.00 .15 517
30-03-88 40.0 4.6 4760 5.42 38.00 1.19 3450
30-03-88 38.0 3.5 5700 14.80 87.00 3.10 4290
30-03-88 36.0 3.2 6800 39.00 127.00 5.30 557030-03-88 30.0 2.8 8500 67.00 177.00 7.70 7850
06-04-88 60.2 6.3 260 .07 .46 .09 9606-04-88 56.0 6.1 290 .11 .58 .09 115
06-04-88 48.0 6.1 420 .13 .99 .13 180
06-04-88 46.0 5.8 4.40 .23 1.07 .14 190
06-04-88 44.0 5.9 490 .29 1.28 .14 220
06-04-88 42.0 5.0 1960 1.21 7.42 .26 1140
06-04-88 40.0 4.6 4810 5.45 47.00 1.18 351006-04-88 38.0 3.4 5750 14.00 83.00 3.05 445006-04-88 36.0 3.1 6920 37.00 144.00 5.70 5540
06-04-88 34.0 2.9 8130 56.00 192.00 7.40 712006-04-88 32:0 2.8 8450 61.00 206.00 7.70 770006-04-88 30.0 2.8 8560 61.00 203.00 7.80 7700

Page 287
Date AHD(m)
pH Sc(pS/cm)
Cu Mn Zn(mg/I)
SO4
13-04-88 60.1 6.3 235 .13 .47 .08 9113-04-88 56.0 6.4 233 .12 .47 .07 9113-04-88 54.0 6.1 300 .16 .66 .09 12313-04-88 52.0 6.0 340 .20 .82 .10 14413-04-88 50.0 6.0 370 .25 .93 .11 16013-04-88 48.0 5.8 420 .30 1.10 .11 19013-04-88 46.0 5.8 430 .30 1.16 .11 19013-04-88 44.0 5.7 400 .35 1.43 .12 22513-04-88 42.0 5.4 930 .67 3.15 .17 48013-04-88 40.0 4.7 4650 4.57 45.00 1.06 336013-04-88 38.0 3.5 5600 13.25 87.00 2.90 425013-04-88 36.0 3.2 6740 36.00 139.00 5.90 540013-04-88 34.0 2.9 8050 68.00 202.00 8.40 705013-04-88 32.0 2.9 8370 77.00 213.00 9.00 7700
20-04-88 60.0 6.3 270 .13 .53 .10 11020-04-88 54.0 6.3 280 .11 .53 .05 11520-04-88 52.0 6.1 360 .17 .79 .07 36020-04-88 46.0 6.1 390 .11 .92 .08 17020-04-88 44.0 6.0 410 .13 1.01 .09 19020-04-88 42.0 5.6 1280 .66 4.30 .17 71020-04-88 40.0 4.7 4780 4.58 48.00 1.16 350020-04-88 38.0 3.5 5700 13.50 87.00 3.05 430020-04-88 36.0 3.2 6800 36.00 129,00 5.70 550020-04-88 34,0 2.9 7860 67.00 177.00 8.20 712020-04-88 32.0 2.9 8400 73.00 188.00 8.80 7750
29-04-88 59.7 6.4 270 .17 .54 .08 11029-04-88 54.0 6.4 280 .13 .55 .07 28029-04-88 52.0 6.2 340 .21 .75 .09 14029-04-88 50,0 6.0 380 .26 .92 .10 17029-04-88 44.0 6.0 400 .24 .98 .10 17529-04-88 42.0 5.6 1000 .67 3.27 .15 52029-04-88 40.0 4.7 4700 4.72 45.00 1.11 156029-04-88 38.0 3.4 5800 16.50 88.00 3.30 207029-04-88 36.0 3.1 7000 42.00 133.00 5.80 550029-04-88 34.0 3.0 8050 73.00 175.00 8.40 700029-04-88 32.0 3.0 8200 73.00 179.00 8.80 7300

Table 6.3 Cont'd
Page 288
Date AHD(m)
pH SC(pS/cm)
Cu Mn(mg/I)
Zn 504
13-05-88 59.9 6.5 340 .23 .73 .11 140
13-05-88 46.0 6.4 340 .17 .70 .10 14013-05-88 44.0 6.4 410 .23 .90 .11 180
13-05-88 40.0 5.8 990 .75 2.81 .19 48013-05-88 38.0 4.6 4700 5.50 49.00 1.34 340013-05-88 36.0 3.5 5600 14.00 89.00 3.50 420013-05-88 34.0 3.1 6800 35.00 146.00 5.80 550013-05-88 32.0 2.8 8400 60.00 228,00 7.70 7600
01-07-88 59.5 6.3 550 .27 1,54 .08 24001-07-88 42.0 6.3 560 .21 1.59 .07 24001-07-88 40.0 4.7 4500 4,10 47.00 1.08 310001-07-88 38.0 4.0 4900 6.10 67.00 1.50 350001-07-88 36.0 3.2 6600 33.00 221.00 5.10 510001-07-88 34.0 2.9 8000 62.00 201.00 7.40 69000 1-07-88 32.0 2.8 8400 69.00 22000 7.80 7400
27-10-88 59.2 5.8 635 .47 2.21 .15 29027-10-88 54.0 5.1 630 .42 2.20 .15 29027-10-88 52.0 5.1 630 .41 2.20 .15 29027-10-88 48.0 5.9 630 .34 2.20 .15 28027-10-88 42.0 5.8 640 .30 2.20 .15 29027-10-88 40.0 4.7 4500 4.70 61.00 1.20 320027-10-88 38.0 3.4 5600 12.90 150.00 3.15 420027-10-88 36.0 3.2 6700 33.00 250.00 6.00 520027-10-88 32.0 2.9 8300 70.00 240.00 8.40 780027-10-88 24.0 2.8 8400 84.00 250.00 8.47 7900

Table 6.4 Intermediate Open Cut profiling data 1987-88
Page 289
Date AHD(m)
pH SC(pS/cm)
Cu Mn Zn(mg/i)
SO4
09-11-87 57.0 4.8 960 1.61 1.68 .35 49009-11-87 52.0 4.5 960 1.59 1,63 .35 50009-11-87 47.0 4.6 960 1.60 1.64 .36 49009-11-87 42.0 4.6 970 1.58 1.69 .38 50009-11-87 41.0 4.6 1200 2.38 2.66 .71 65009-11-87 40.0 4.5 3600 1.67 2.10 .82 230009-11-87 37.0 5.9 4000 .43 .90 .22 290009-11-87 27.0 6,3 4100 .08 .70 .70 3000
07-01-88 57.3 4.5 970 2.01 1.70 .25 50007-01-88 56.0 4.4 970 2.03 1.70 .18 50007-01-88 54.0 4.4 960 2.04 1.67 .17 50007-01-88 52.0 4.5 960 2.08 1.68 .17 50007-01-88 50.0 4.5 960 2.07 1.67 .17 50007-01-88 48.0 4.5 960 2.02 1.66 .18 50007-01-88 46.0 4.5 960 2.20 1.67 .17 50007-01-88 44.0 4.5 960 1.96 1.63 .17 50007-01-88 42.0 4.5 980 2.01 1.71 .17 51007-01-88 40.0 4.4 3540 2.91 3.49 .75 250007-01-88 38.0 4.6 3730 2.11 2.70 .54 270007-01-88 36.0 5.6 4000 .47 .60 .14 300007-01-88 34,0 5.9 4100 .23 .36 .10 2900
21-01-88 58.0 4.5 920 1.77 1.59 .20 47021-01-88 44.0 4.5 970 1.91 .58 .20 50021-01-88 42.0 4.5 1000 1.96 1.73 .23 53021-01-88 40.0 4.4 3500 2.90 3.64 .78 240021-01-88 38.0 4.7 3900 1.79 2.28 .48 275021-01-88 36.0 6.1 4000 .40 .48 .13 2900
28-01-88 57.8 4.5 940 1.89 1.46 .25 48028-01-88 44.0 4.5 970 1.92 1.45 .21 50028-01-88 42.0 4.5 1000 1.98 1.59 .24 52028-01-88 40.0 4.4 3500 3.11 3.27 .88 240028-01-88 38.0 4.7 3900 1.83 1.92 .50 270028-01-88 36.0 5.9 4000 .43 .41 .10 2900

Table 6.4 Cont'd
Page 290
Date AHD(m)
pH Sc(p5/cm)
Cu Mn(mg/i)
Zn SO4
04-02-88 58.0 4.6 950 1.97 1.11 .21 49004-02-88 44.0 4.5 970 1.96 1.06 .22 500
04-02-88 42.0 4.5 1000 2.09 1.60 .26 54004-02-88 40.0 4.5 3500 2.77 2.98 .71 250004-02-88 38.0 4.7 3800 2.01 1.87 .49 2800
04-02-88 36.0 5.5 4000 .70 .44 .05 2900
11-02-88 58.0 4.5 840 1.75 1.31 .17 42011-02-88 46.0 4.5 850 1.71 1.33 .18 42011-02-88 40.0 4.4 3400 3.33 3.59 .83 240011-02-88 38.0 4.7 3900 1.83 1.76 .42 280011-02-88 36.0 5.7 4100 .44 .39 .09 2900
18-02-88 57.9 5.0 680 1,19 1.27 .20 330
18-02-88 54.0 4.6 690 1.09 1.26 .16 330
18-02-88 52.0 4.6 740 1.20 1.32 .17 360
18-02-88 50.0 4.6 770 1.28 1.36 .18 380
18-02-88 42.0 4.6 790 1.34 1.38 .19 390
18-02-88 40.0 4,5 3500 2.90 3.14 .83 240018-02-88 38.0 4.8 3900 1.67 1.88 .47 270018-02-88 36.0 5.7 4000 .45 .47 .11 290018-02-88 34.0 6.0 4100 .23 .27 .09 2900
25-02-88 58.0 5.3 510 .68 1.10 .12 240
25-02-88 50.0 5.0 590 .72 1.23 .14 280
25-02-88 42.0 5.0 610 .84 1.27 .15 29025-02-88 40.0 5.0 680 .99 1.37 .17 33025-02-88 38,0 4.9 3600 2.01 2.42 .49 250025-02-88 36.0 5.9 4000 .44 .62 .13 290025-02-88 34.0 5.9 4000 .33 .45 .13 290025-02-88 32.0 6.4 4100 .13 .29 .08 2900
03-03-88 40.0 4.6 3600 2.77 3.24 .76 250003-03-88 38.0 3.5 4100 1.56 1.87 .43 280003-03-88 36.0 6.0 4100 .40 .45 .15 290003-03-88 34.0 6.2 4100 .20 .33 .09 290003-03-88 32.0 6.4 4100 .11 .25 .06 290003-03-88 30.0 6.4 4100 .08 .26 .05 300003-03-88 28.0 6.4 4100 .10 .34 .07 3000

Page 291
Date AHD(m)
pH Sc(pS/cm)
cu Mn(mg/I)
Zn SO4
10-03-88 52.0 4.8 510 .89 1.23 .18 25010-03-88 50.0 4.9 590 .89 1.25 .19 29010-03-88 46.0 5.0 590 .90 1.26 .18 30010-03-88 46.0 5.0 590 .90 1.26 .18 29010-03-88 44.0 5.0 610 .91 1.31 .17 30010-03-88 44.0 5.0 610 .91 1.31 .17 30010-03-88 42.0 4.9 650 .91 1.35 .17 32010-03-88 40.0 4.6 3400 3.30 4.11 1.01 240010-03-88 38.0 4.9 3800 1.84 2.35 .55 270010-03-88 36.0 6.0 4100 .44 .53 .15 290010-03-88 26.0 6.9 4100 .19 .51 .16 310010-03-88 24.0 6.3 4100 .35 .78 .23 3100
17-03-88 58.0 5.1 520 1.02 1.29 .12 24017-03-88 56.0 4.6 520 .82 1.25 .11 24017-03-88 50.0 4.9 530 .93 1.26 .12 24017-03-88 48.0 4.9 590 .91 1.29 .13 28017-03-88 44.0 5.0 600 .90 1.31 .13 28017-03-88 42.0 4.9 670 1.01 1.46 .16 32017-03-88 40.0 4.7 3500 2.71 3.86 .76 250017-03-88 38.0 5.4 2805 1.00 1.42 .25 280017-03-88 36.0 6.0 4000 .41 .57 .08 290017-03-88 26.0 6.5 4100 .13 .52 .06 2900
24-03-88 58.0 5.7 540 .90 1.17 .17 25024-03-88 46.0 5.9 550 .65 1.07 .15 26024-03-88 44.0 5.6 610 .80 1.21 .17 29024-03-88 42.0 5.9 670 .76 1.30 .19 32024-03-88 40.0 5.2 3600 2.46 3.55 .81 250024-03-88 38.0 5.4 3900 1.48 1.80 .45 280024-03-88 36.0 6.0 4100 .48 .48 .17 2900
31-03-88 58.0 5.5 540 .67 1.00 .15 24031-03-88 48.0 5.1 540 .74 1.15 .15 26031-03-88 42,0 5.4 560 .73 1.13 .17 26031-03-88 40.0 5.0 1100 1.16 1.71 .31 59031-03-88 38.0 5.3 3900 1.47 1.69 .43 280031-03-88 36.0 5,9 4100 .39 .42 .17 29003 1-03-88 24.0 6.2 4200 .00 .00 .23 3000

Table 6.4 Cont'd
Page 292
Date AHD(m)
pH SC(ps/cm)
Cu Mn(mg/i)
Zn 504
07-04-88 58.0 6.0 380 .51 1.05 .15 160
07-04-88 54.0 5.8 380 .42 1.05 .15 17007-04-88 52.0 5.4 450 .56 1,30 .18 20007-04-88 46.0 5.3 500 .72 1.35 .19 23007-04-88 44.0 5.2 520 .75 1.44 .20 24007-04-88 42.0 5.2 550 .85 1.47 .21 25007-04-88 40.0 4.9 1600 1.76 2.90 .52 91007-04-88 38.0 5.2 3900 1.66 2.89 .53 270007-04-88 36.0 6,0 4100 .39 .78 .17 290007-04-88 34.0 6.2 4100 .20 .38 .12 290007-04-88 32.0 6.4 4100 .09 .32 .09 290007-04-88 30.0 6.5 4120 .07 .37 .08 2900
14-04-88 58.0 5.7 470 .64 1.24 .18 22014-04-88 42.0 5.6 460 .61 1.22 .17 22014-04-88 40.0 5.1 820 1.06 1.91 .26 42014-04-88 38.0 5.1 3800 1.87 3.06 .58 280014-04-88 36.0 6.1 4000 .37 1.60 .17 3000
21-04-88 58.0 5.7 490 .71 1.41 .21 23021-04-88 42.0 5.4 480 .68 1.44 .19 24021-04-88 40.0 4.9 3300 2.88 4.76 .94 240021-04-88 38.0 5.3 4000 1.06 2.15 .38 300021-04-88 36.0 5.9 4100 .49 .87 .20 300021-04-88 34.0 6.3 4100 .25 .48 .12 310021-04-88 32.0 6.7 4100 .15 .37 .09 310021-04-88 30.0 6.4 4100 .13 .38 .08 310021-04-88 28.0 6.5 4100 .14 .56 .01 310021-04-88 26.0 6.4 4100 .23 1.17 .23 300021-04-88 24.0 6.4 4100 .36 1.52 .28 300021-04-88 22.0 6.2 4200 .49 2.11 .44 300021-04-88 20.0 6.1 4200 .76 3.13 .65 300021-04-88 16.0 6.0 4200 1.28 14.00 .96 310021-04-88 14.0 6.1 4200 1.63 7.75 1.25 310021-04-88 8.0 6.4 4400 .68 10.90 1.23 320021-04-88 6.0 6.5 4400 .15 11.60 1.02 320021-04-88 4.0 6.8 4500 .12 10.80 .95 330021-04-88 3.0 8.1 4300 .05 .07 .03 3000

Page 293
Date AHD(m)
pH Sc(p S/cm)
cu Mn(mg/I)
Zn SO4
27-04-88 58.8 5.5 480 .95 1.33 .18 22027-04-88 50.0 5.9 480 .65 1.31 .15 22027-04-88 42.0 5.9 480 .61 1.25 .17 23027-04-88 40.0 5.8 520 .72 1.39 .19 25027-04-88 38.0 5.1 3600 1.98 4.00 .75 250027-04-88 33.0 6.5 4100 .23 .45 .11 300027-04-88 28.0 6.5 4100 .15 .64 .11 300027-04-88 23.0 6.3 4100 .48 1.89 .37 310027-04-88 8.0 6.5 4400 .83 9.95 1.05 320027-04-88 6.0 6,8 400 .11 10.70 .88 330027-04-88 4.0 6.8 4500 .11 10.80 .79 330027-04-88 3.0 7.6 4400 .01 11.00 .54 3300
12-05-88 57.7 5.3 530 .78 1.41 .21 25012-05-88 42.0 5.2 540 1.09 1.44 .20 25012-05-88 40.0 5.2 570 .72 1.48 .21 27012-05-88 38.0 5.3 3900 1.66 2.68 .47 280012-05-88 36.0 5.9 4000 .63 .85 .21 2900
02-06-88 57.6 5.4 630 1.12 1.53 .23 30002-06-88 56.0 4.8 630 .94 1.54 .20 30002-06-88 40.0 5.0 640 .91 1.52 .20 31002-06-88 38.0 5.4 3900 1.16 2.09 .32 280002-06-88 36.0 5.9 4100 .38 .84 .15 300002-06-88 32.0 6.3 4100 .11 .33 .05 3000
01-07-88 57.3 5.2 560 1.22 1.61 .06 24001-07-88 56.0 4.8 920 .79 1.33 .19 47001-07-88 54.0 4.8 920 .95 1.32 .20 47001-07-88 52.0 4.9 910 1.07 1.34 .19 47001-07-88 38.0 4.9 920 1.10 1.40 .20 4800 1-07-88 34.0 6.2 3900 .37 .42 .09 280001-07-88 32.0 6.4 3900 .27 .43 .09 280001-07-88 26.0 6.7 4000 .14 .38 .06 2900
27-10-88 57.0 4.7 1040 1.26 1.88 .29 54027-10-88 56.0 4.5 1100 1.09 1.87 .29 54027-10-88 42.0 4.7 1050 1.16 1.17 .26 54027-10-88 40.0 3.7 1130 1.16 1.76 .25 53027-10-88 36.0 4.9 2570 1.31 2.10 .45 174027-10-88 34.0 5.8 3900 .45 .74 .19 280027-10-88 30.0 5.8 3900 .42 .77 .19 280027-10-88 28.0 5.8 3900 .43 .79 .18 280027-10-88 26.0 5.8 3900 .39 .72 .18 280027-10-88 24.0 6.1 3900 .48 1.52 .34 3000

APPENDIX E
Extract from
SOIL CONSERVATION AND LAND UTILIZATION ACT
Page 295

Division 4 - Control of Public Restricted Use Areas
20B. DECLARATION BY COMMISSION
(1) The Council may recommend to the Commission that an area of land bedeclared a Restricted Use Area.
(2) If the Commission is satisfied, on the recommendation of the Council, thatof land is subject to soil erosion through use or continued use of it by thepublic, the Commission may, by notice in the Gazette declare that area tobe a Restricted Use Area.
(3) A person may request the Council to recommend that the Commission makea declaration in accordance with sub-section (2) in relation to -
open land of which that person is a landholder;
public land adjacent to land of which that person is the landholder;or
land vested in or under the control of a proper authority and adjacentto land of which that person is a landholder.
(4) A proper authority may request the Council to recommend that the Ministermake a declaration in accordance with sub-section (2) in relation to -
land vested in, or under the management or control of, that properauthority; or
public land adjacent to land vested in, or under the management orcontrol of, that proper authority.
(5) The Council shall not make a recommendation under sub-section (1) inrespect of land vested in, or under the control of, proper authority except atthe request of that proper authority.
(6) A declaration under sub-section (2) shall -
define the land to which it relates by reference to a map or plan; and
indicate where the map or plan may be inspected.
(7) The map or plan shall be kept and displayed -
at the place indicated in the declaration; and
at all police stations in the vicinity of the area to which thedeclaration relates,
and shall at all reasonable times be available for inspection without fee bymembers of the public.
Page 296

(1)
Page 297
(8) The Commission may exempt from the effect of a declaration made undersub-section (2) such roads in the area of land to which the declaration relates
as the Commission shall define in the declaration, and may in that declaration stipulate -
the persons or classes of persons who may use those roads; or
the types of vehicles that may be used on those roads.
20C. OFFENCE RELATING TO USE OF RESTRICTED USE AREA
Except with and in accordance with the written permission of the properauthority, a person within a Restricted Use Area shall not -
unless he is on an exempted road, have in his possession or use a motorvehicle;
remove or damage any vegetation;
take or remove any sand, gravel, rock, clay or earth;
interfere with any erosion prevention works; or
cause water or other fluid to be drained or to flow over the area.
Penalty: 500 dollars
(2) Where a stipulation has been made under section 20B(8)(a) or (b), in respect ofan exempted road -
a person -
(i) other than a person stipulated; or
(ii) other than one of a class of persons stipulated, in relation tothat road shall not use that exempted road; and
a person shall not have in his possession or use a vehicle other than astipulated type of vehicle on that exempted road.
Penalty: 500 dollars
(3) Where permission is granted under sub-section (1) by the proper authority, thatauthority -
may limit the use to a use of pan of the Restricted Use Area by a motorvehicle, or a class of motor vehicle; or
may impose such other conditions as to the use of the Restricted Use Areaas it sees fit.

Page 298
20D. POWERS OF OFFICERS
(1) A Member of the Police Force or an Officer may require a person who, hereasonable believes, has committed an offence against section 20C to givehis full name and address to that member of the Police Force or Officer.
(2) A person -
shall not refuse to give his name and address;and
shall not give a false name or address,
to a member of the Police Force or to an Officer.
(3) A person shall not obstruct, hinder or molest a member of the Police Forceor an Officer in the exercise of his powers under this Ordinance.
Penalty: 200 dollars