rule of thirds detection from photographweb.cecs.pdx.edu/~fliu/papers/ism2011.pdf · rule of thirds...
TRANSCRIPT
Rule of Thirds Detection from Photograph
Long Mai, Hoang Le, Yuzhen Niu, and Feng LiuDepartment of Computer Science
Portland State UniversityPortland, OR, USA
{mtlong, hoanl, yuzhen, fliu}@cs.pdx.edu
Abstract—The rule of thirds is one of the most importantcomposition rules used by photographers to create high-qualityphotos. The rule of thirds states that placing important objectsalong the imagery thirds lines or around their intersectionsoften produces highly aesthetic photos. In this paper, wepresent a method to automatically determine whether a photorespects the rule of thirds. Detecting the rule of thirds froma photo requires semantic content understanding to locateimportant objects, which is beyond the state of the art. Thispaper makes use of the recent saliency and generic objectnessanalysis as an alternative and accordingly designs a range offeatures. Our experiment with a variety of saliency and genericobjectness methods shows that an encouraging performancecan be achieved in detecting the rule of thirds from photos.
Keywords-Multimedia Quality, Photo Composition, Rule ofThirds
I. INTRODUCTION
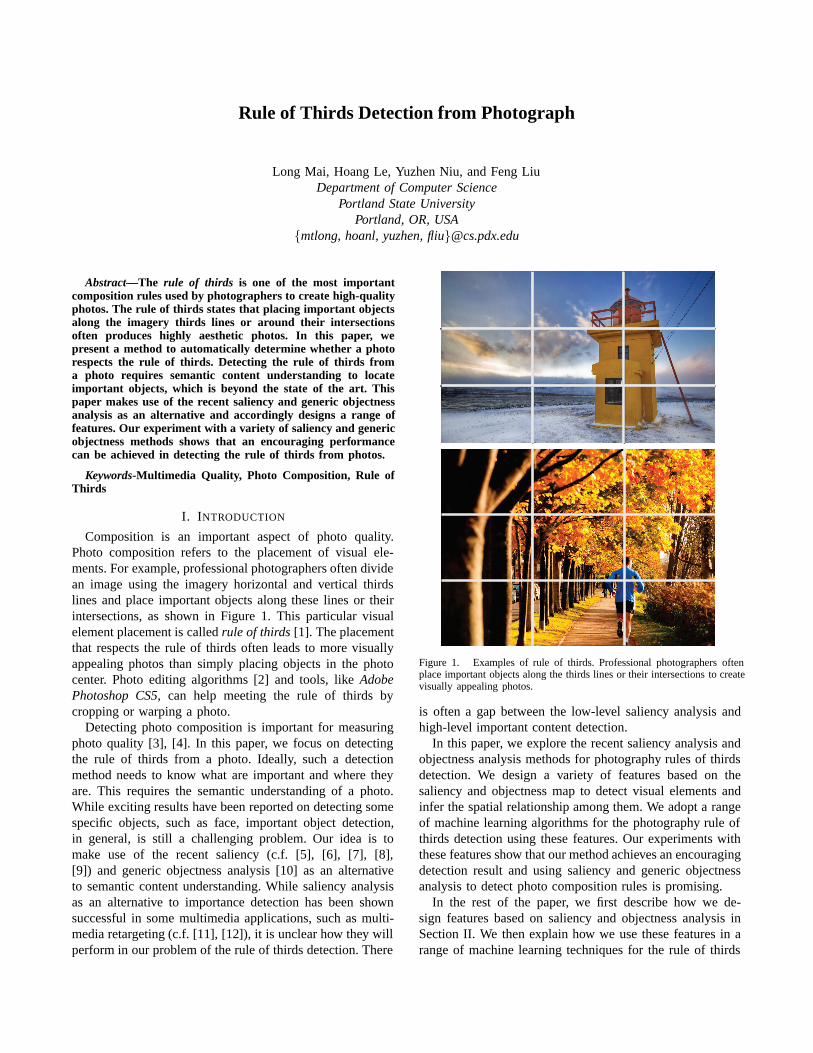
Composition is an important aspect of photo quality.Photo composition refers to the placement of visual ele-ments. For example, professional photographers often dividean image using the imagery horizontal and vertical thirdslines and place important objects along these lines or theirintersections, as shown in Figure 1. This particular visualelement placement is called rule of thirds [1]. The placementthat respects the rule of thirds often leads to more visuallyappealing photos than simply placing objects in the photocenter. Photo editing algorithms [2] and tools, like AdobePhotoshop CS5, can help meeting the rule of thirds bycropping or warping a photo.
Detecting photo composition is important for measuringphoto quality [3], [4]. In this paper, we focus on detectingthe rule of thirds from a photo. Ideally, such a detectionmethod needs to know what are important and where theyare. This requires the semantic understanding of a photo.While exciting results have been reported on detecting somespecific objects, such as face, important object detection,in general, is still a challenging problem. Our idea is tomake use of the recent saliency (c.f. [5], [6], [7], [8],[9]) and generic objectness analysis [10] as an alternativeto semantic content understanding. While saliency analysisas an alternative to importance detection has been shownsuccessful in some multimedia applications, such as multi-media retargeting (c.f. [11], [12]), it is unclear how they willperform in our problem of the rule of thirds detection. There
Figure 1. Examples of rule of thirds. Professional photographers oftenplace important objects along the thirds lines or their intersections to createvisually appealing photos.
is often a gap between the low-level saliency analysis andhigh-level important content detection.
In this paper, we explore the recent saliency analysis andobjectness analysis methods for photography rules of thirdsdetection. We design a variety of features based on thesaliency and objectness map to detect visual elements andinfer the spatial relationship among them. We adopt a rangeof machine learning algorithms for the photography rule ofthirds detection using these features. Our experiments withthese features show that our method achieves an encouragingdetection result and using saliency and generic objectnessanalysis to detect photo composition rules is promising.
In the rest of the paper, we first describe how we de-sign features based on saliency and objectness analysis inSection II. We then explain how we use these features in arange of machine learning techniques for the rule of thirds

(a) Input image (b) FT map (c) GBVS map (d) GC map (e) OBJ map
(f) Input image (g) FT map (h) GBVS map (i) GC map (j) OBJ map
Figure 2. Image saliency map computed using different methods, including FT [8], GBVS [6], and GC [9], as well as objectness map (OBJ) [10]. Theseexamples show that saliency analysis can often be used to infer the important content location. Sometimes, the saliency analysis results are misleading,such as (g) and (i).
detection and report the results in Section III. We finallyconclude this paper in Section IV.
II. SALIENCY-BASED FEATURE DESIGN
Rule of thirds detection requires the knowledge aboutimportant content locations. However, important content de-tection is beyond the state of the art. Inspired by the successof using low-level saliency as alternative in other multime-dia applications, such as multimedia retargeting [12], ourmethod explores the saliency analysis to detect importantcontent. Visual saliency measures the low-level stimuli tothe human visual system. A variety of methods have beenrecently developed to estimate the visual saliency from im-ages. Our method selects three recent algorithms for saliencyestimation as successful salient object detection results arereported using these methods. These three algorithms areGBVS [6], FT [8], and GC [9]. Each of these methods takesan image as input and outputs a map which indicates thesaliency value at each pixel/block. Figure 2 shows severalexamples. We omit the description of these methods. Pleaserefer to their original papers for the detail.
To quickly examine whether saliency analysis is useful forour task, we sum up the saliency map for a positive photocollection with 1000 images that respect the rule of thirdsand a negative photo collection with 1000 images that do notrespect the rule of thirds. We show the summed saliencymap for each method in Figure 3. This figure shows thatfor the summed saliency map for the positive collection,the most salient regions are around the intersections of the
thirds lines, no matter which saliency method we use. Forthe summed saliency map for the negative collection, themost salient regions are around the image center. This showsthat saliency map could be potentially useful for the task ofdetecting the rule of thirds.
As also revealed by the multimedia retargeting research,saliency alone sometimes leads to undesirable results dueto the gap between the low-level stimuli analysis and thehigh-level semantic understanding. This suggests that theremay be necessarily a limit on the performance of usingsaliency for the rule of thirds detection. We design a varietyof features based on saliency analysis to examine thislimit and best use them for the rule of thirds detection.Further more, our method uses generic objectness analysisas a complement to saliency analysis [10]. This objectnessmethod returns a large number of windows that likelycontains an object. Each window comes with a confidencethat it contains an object. Our method sums these windowsweighted by their confidence values into an objectness map.Each element of this objectness map also indicates thelikelihood that it belongs to an object, which is very similarto how our method uses the saliency map to infer the objectlocation. So our method uses the objectness map in the sameway as the saliency maps. For simplicity, we refer to thisobjectness map as a special type of saliency map below.
A. Saliency Map Centroid
A photo that respects the rule of thirds places importantvisual elements around the thirds lines or their intersections.

0.070.080.090.10.110.120.130.140.150.160.17
(a) sum of FT saliency map overpositive set
0.05
0.1
0.15
0.2
0.25
0.3
0.35
(b) sum of GBVS saliency mapover positive set
0.15
0.2
0.25
0. 3
0.35
(c) sum of GC saliency map overpositive set
0
0.1
0.2
0.3
0.4
0.5
0.6
(d) sum of objectness map overpositive set
0.1
0.11
0.12
0.13
0.14
0.15
0.16
0.17
(e) sum of FT saliency map overnegative set
0.050.10.150.2
0.250.3
0.350.40.450.5
(f) sum of GBVS saliency mapover negative set
0.15
0.2
0.25
0.3
0.35
0.4
0.45
0.5
(g) sum of GC saliency map overnegative set
0
0.1
0.2
0.3
0.4
0.5
0.6
0.7
0.8
(h) sum of objectness map overnegative set
Figure 3. Sum of saliency map over positive and negative image set, respectively.
Since our method uses saliency analysis to infer importantcontent, we compute the centroid of the saliency map toapproximate the important object location. However, thecentroid of the whole saliency map or a very large windowof the saliency map is often off the important salient regionof the image, as shown in Figure 4. Instead of using thecentroid of the whole saliency map, our method finds aminimal rectangle that contains at least λ of the total saliencyvalue as follows.
pc =
∑p∈W wp ∗ p∑
p∈W wp(1)
where pc is a two-element vector denoting the centroidlocation and p is a two-element vector denoting a point inthe minimal rectangle W that contains λ of the total saliencyvalues in the image. wp is the saliency value at p. Ourmethod uses the summed area table algorithm to expeditethe search for the minimal rectangle W so that the amountof saliency in each window can be computed in constanttime [13].
λ is an important parameter. On one hand, when itapproaches one, pc becomes the centroid of the wholesaliency map. As shown early, pc is off the important regionof the image. On the other hand, when λ is very small, p c
often suffers from noise. We set the λ value experimentallyby cross validation on a training data set. The performanceof this feature with respect to the λ value is illustrated inFigure 4 (c). This figure shows that the optimal λ valuesfor the GBVS saliency map, FT saliency map, GC saliencymap, and objectness map are 60%, 30%, 30%, and 40%,respectively.
B. Saliency Around Thirds Lines and Their Intersections
A photo that respects the rule of thirds usually has moresaliency around the thirds lines and their intersections. Basedon this observation, our method divides an image into a 5×5grid mesh. This grid mesh is built in a way such that italigns well with the thirds lines. Specifically, we create astrip centered at each thirds line with a width 1/6 of theinput image size and split the image into 5 regions in eachdimension, as shown in Figure 5. We call this grid mesh athirds map. The average saliency value at each grid cell iscomputed as a feature.
wi =
∑p∈Wi
wp
A(Wi), 1 ≤ i ≤ 5 (2)
where A(Wi) is the area of the ith grid cell Wi.
C. Raw Saliency Map
The saliency map centroid and the third map are designedbased on the domain knowledge of the rule of thirds. Itis also interesting to examine using the raw saliency mapitself for the rule of thirds detection. Specifically, our methodresizes each saliency map into a n × n saliency map anduses this re-sampled saliency map as a feature vector. Inour method, we use n = 20. Our experiment shows that ourmethod is pretty stable with regard to n. Our method furtherapplies the Principal Component Analysis (PCA) to reducethe dimensionality of the feature vector [14]. The number ofeigen-vectors used in our method is 15, which is determinedexperimentally via cross-validation. This eigen analysis ofthe raw saliency map gives another feature vector that has15 elements. Figure 6 shows the first 5 eigen-saliency mapsin the order of eigen-values. These eigen-vectors show thefeatures of images that respect rule of thirds or not. For

(a) Input image (b) Saliency map
10 20 30 40 50 60 70 80 9056
58
60
62
64
66
68
70
72
74
λ: percent of salient value captured by the window (%))
clas
sific
atio
n ra
te (%
))
GBVSFTGCOBJ
(c) classification accuracy vs. λ value
Figure 4. When the centroid is computed from a very big region thatcontains almost all the saliency values, it is often off the important contentlocation as indicated by the red rectangle and point. On the other hand,when a window that contains a very small amount of saliency is used,its centroid is not an accurate predication of the important content locationeither, as indicated by the blue rectangle and point. A window that containsan appropriate amount of saliency value is important for inferring theimportant content location.
example, the first eigen-vector highlights the image center,which intuitively shows a fundamental difference betweenrule of thirds images and non-rule of thirds images. Theother eigen-vectors highlights either the thirds lines or theirintersections.
In summary, our method extracts three types of featuresas described in the above subsections, namely the saliencymap centroid, the thirds map, and the eigen coefficients ofsaliency map. These three type of features are extractedfrom each of the four saliency maps. So totally our methodextracts an overall feature vector with 4 × 42 elements foreach image.
III. RULE OF THIRDS DETECTION
Our method applies a range of classic machine learn-ing techniques for the rule of thirds detection, includ-ing the Naı̈ve Bayesian Classifier, Support Vector Ma-chine (SVM) [15], Adaboost [16], and K-Nearest Neigh-bor method (kNN). For SVM, our method uses the RBFkernel. We use the LIBSVM [17] implementation. ForAdaboost, our method uses the Logist Boost method. We
1/6
1/4
1/4
1/61/6
(a) Input image (b) Saliency map (c) Third map
Figure 5. Third map. We split an image into a 5× 5 grid mesh such thatit aligns well with the third lines and each of the third lines intersection isright inside one of its cells, as indicated by the red dots.
use the OpenCV implementation of Adaboost1. For kNN,our method selects k=30 and uses the Euclidean distance asthe distance metric.
We collected a set of 2089 images that respect the ruleof thirds as the positive set and a set of 2051 images thatdoes not respect the rule of thirds as the negative set. Thiscollection includes images from Flickr2 and Photo.net3. Werandomly allocate 75% of this collection into a training setand the rest 25% into a testing set. For each of the followingtests, we repeat the random partition for 10 times and reportthe average result.
In our method, we use four different saliency maps,namely FT [8], GBVS [6], GC [9], and OBJ (objectnessmap) [10]. For each saliency map, we extract three typesof features, namely the (saliency) centroid, third map, andraw saliency map. We test the effectiveness of each featureusing the Naı̈ve Bayesian Classifier. Figure 7(a) shows theprecision-recall curves with different features. For each, wecombine the same type of feature from all the four saliencymaps. We can see that the raw saliency map performs bestand the saliency map centroid is least effective, as alsoshown in the accuracy table (Table I). One reason thatthe saliency map centroid is not as effective as the othertwo features is its difficulty to select a suitable windowto calculate the centroid, as also discussed in Section II-A.While we try to select an optimal window, our method ofpicking a fixed threshold to find the window is still notsatisfactory. Intuitively, different images shall have differentoptimal thresholds (windows). As for the thirds map, onereason for its slightly worse performance than the rawsaliency map is that the rule of thirds only suggests placingimportant content along the thirds lines or their intersections,so in practice important content, especially a big object,often extends to the image center from the thirds lines. Sodividing an image into a third map that aligns well with thethirds lines is sometimes not as effective as expected.
We also test the effectiveness of each saliency map.
1http://opencv.willowgarage.com/wiki2http://www.flickr.com3http://www.photo.net
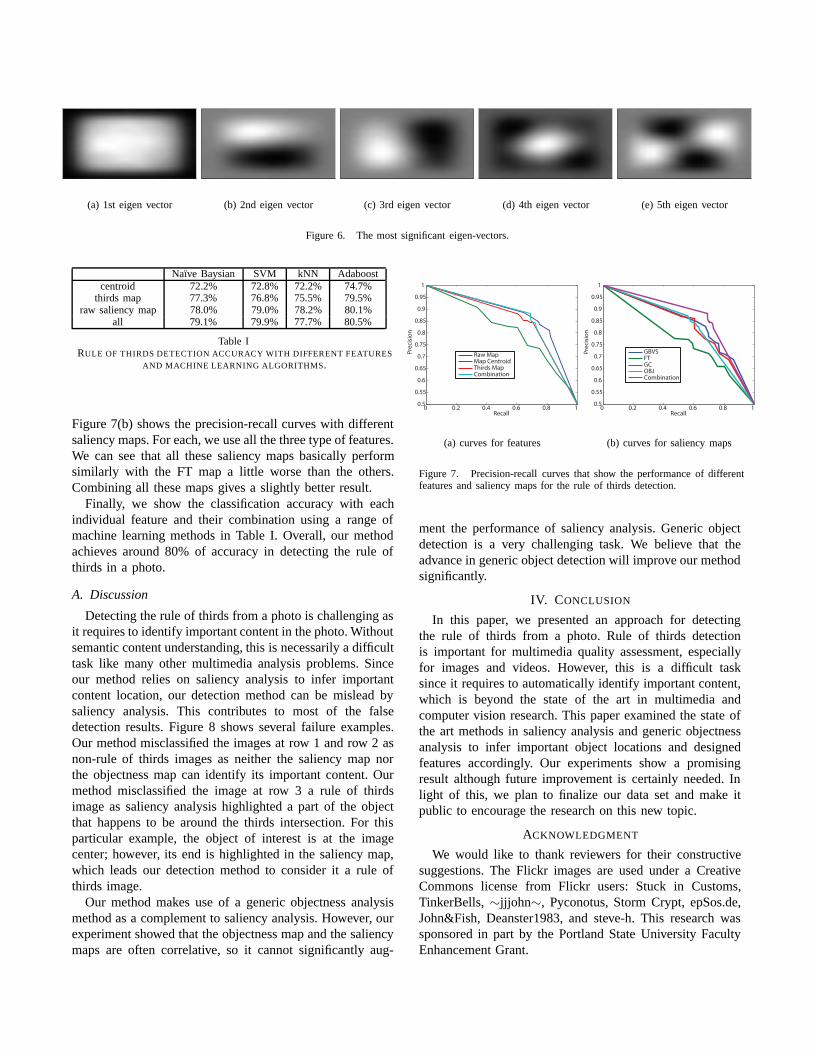
(a) 1st eigen vector (b) 2nd eigen vector (c) 3rd eigen vector (d) 4th eigen vector (e) 5th eigen vector
Figure 6. The most significant eigen-vectors.
Naı̈ve Baysian SVM kNN Adaboostcentroid 72.2% 72.8% 72.2% 74.7%
thirds map 77.3% 76.8% 75.5% 79.5%raw saliency map 78.0% 79.0% 78.2% 80.1%
all 79.1% 79.9% 77.7% 80.5%
Table IRULE OF THIRDS DETECTION ACCURACY WITH DIFFERENT FEATURES
AND MACHINE LEARNING ALGORITHMS.
Figure 7(b) shows the precision-recall curves with differentsaliency maps. For each, we use all the three type of features.We can see that all these saliency maps basically performsimilarly with the FT map a little worse than the others.Combining all these maps gives a slightly better result.
Finally, we show the classification accuracy with eachindividual feature and their combination using a range ofmachine learning methods in Table I. Overall, our methodachieves around 80% of accuracy in detecting the rule ofthirds in a photo.
A. Discussion
Detecting the rule of thirds from a photo is challenging asit requires to identify important content in the photo. Withoutsemantic content understanding, this is necessarily a difficulttask like many other multimedia analysis problems. Sinceour method relies on saliency analysis to infer importantcontent location, our detection method can be mislead bysaliency analysis. This contributes to most of the falsedetection results. Figure 8 shows several failure examples.Our method misclassified the images at row 1 and row 2 asnon-rule of thirds images as neither the saliency map northe objectness map can identify its important content. Ourmethod misclassified the image at row 3 a rule of thirdsimage as saliency analysis highlighted a part of the objectthat happens to be around the thirds intersection. For thisparticular example, the object of interest is at the imagecenter; however, its end is highlighted in the saliency map,which leads our detection method to consider it a rule ofthirds image.
Our method makes use of a generic objectness analysismethod as a complement to saliency analysis. However, ourexperiment showed that the objectness map and the saliencymaps are often correlative, so it cannot significantly aug-
0 0.2 0.4 0.6 0.8 10.5
0.55
0.6
0.65
0.7
0.75
0.8
0.85
0.9
0.95
1
RecallPr
ecis
ion
Raw MapMap CentroidThirds MapCombination
(a) curves for features
0 0.2 0.4 0.6 0.8 10.5
0.55
0.6
0.65
0.7
0.75
0.8
0.85
0.9
0.95
1
Recall
Prec
isio
n
GBVSFTGCOBJCombination
(b) curves for saliency maps
Figure 7. Precision-recall curves that show the performance of differentfeatures and saliency maps for the rule of thirds detection.
ment the performance of saliency analysis. Generic objectdetection is a very challenging task. We believe that theadvance in generic object detection will improve our methodsignificantly.
IV. CONCLUSION
In this paper, we presented an approach for detectingthe rule of thirds from a photo. Rule of thirds detectionis important for multimedia quality assessment, especiallyfor images and videos. However, this is a difficult tasksince it requires to automatically identify important content,which is beyond the state of the art in multimedia andcomputer vision research. This paper examined the state ofthe art methods in saliency analysis and generic objectnessanalysis to infer important object locations and designedfeatures accordingly. Our experiments show a promisingresult although future improvement is certainly needed. Inlight of this, we plan to finalize our data set and make itpublic to encourage the research on this new topic.
ACKNOWLEDGMENT
We would like to thank reviewers for their constructivesuggestions. The Flickr images are used under a CreativeCommons license from Flickr users: Stuck in Customs,TinkerBells, ∼jjjohn∼, Pyconotus, Storm Crypt, epSos.de,John&Fish, Deanster1983, and steve-h. This research wassponsored in part by the Portland State University FacultyEnhancement Grant.

(a) Input image (b) FT map (c) GBVS map (d) GC map (e) OBJ map
Figure 8. Failure examples. The performance of our method depends on saliency analysis. For images at row 1 and row 2, our method mis-classifiedthem as non-rule of thirds images because saliency analysis cannot identify important objects. Our method misclassified the image at row 3 as a rule ofthirds image although the main object is at image center. For this particular example, the left part of the object is highlighted in saliency map instead ofthe whole object.
REFERENCES
[1] B. P. Krages, The Art of Composition. Allworth Communi-cations, Inc., 2005.
[2] L. Liu, R. Chen, L. Wolf, and D. Cohen-Or, “Optimizingphoto composition,” Computer Graphics Forum, vol. 29,no. 2, pp. 469–478, 2010.
[3] Y. Ke, X. Tang, and F. Jing, “The design of high-levelfeatures for photo quality assessment,” in Proceeding of IEEEConference on Computer Vision and Pattern Recognition,2006, pp. 419–426.
[4] R. Datta, D. Joshi, J. Li, and J. Z. Wang, “Studying aestheticsin photographic images using a computational approach,” inProceeding of European Conference on Computer Vision,2006, pp. 288–301.
[5] L. Itti and C. Koch, “Computational modeling of visualattention,” Nature Reviews Neuroscience, vol. 2, no. 3, pp.194–203, 2001.
[6] J. Harel, C. Koch, and P. Perona, “Graph-based visualsaliency,” in Proceedings of Neural Information ProcessingSystems, 2006.
[7] X. Hou and L. Zhang, “Saliency detection: A spectral residualapproach,” IEEE Conference on Computer Vision and PatternRecognition, 2007.
[8] R. Achantay, S. Hemamiz, F. Estraday, and S. Susstrunk,“Frequency-tuned salient region detection,” IEEE Interna-tional Conference on Computer Vision and Pattern Recog-nition, pp. 1597 – 1604, 2009.
[9] M.-M. Cheng, G.-X. Zhang, N. J. Mitra, X. Huang, and S.-M. Hu, “Global contrast based salient region detection,” inProceedings of the IEEE Computer Society Conference onComputer Vision and Pattern Recognition, 2011, pp. 409–416.
[10] B. Alexe, T. Deselaers, and V. Ferrari, “What is an object ?”in Proceeding of IEEE Conference on Computer Vision andPattern Recognition, 2010, pp. 73–80.
[11] F. Liu and M. Gleicher, “Video retargeting: automating panand scan,” in Proceedings of the international conference onMultimedia, 2006, pp. 241–250.
[12] A. Shamir and O. Sorkine, “Visual media retargeting,” inProceedings of ACM SIGGRAPH ASIA 2009 Courses, 2009,pp. 11:1–11:13.
[13] F. C. Crow, “Summed-area tables for texture mapping,” inProceedings of ACM SIGGRAPH ’84, 1984, pp. 207–212.
[14] I. Jolliffe, Principal component analysis. Wiley OnlineLibrary, 2002.
[15] C. Cortes and V. Vapnik, “Support-vector networks,” Machinelearning, vol. 20, no. 3, pp. 273–297, 1995.
[16] Y. Freund and R. Schapire, “A desicion-theoretic generaliza-tion of on-line learning and an application to boosting,” inComputational learning theory. Springer, 1995, pp. 23–37.
[17] C.-C. Chang and C.-J. Lin, “Libsvm: A library for supportvector machines,” ACM Trans. Intell. Syst. Technol., vol. 2,pp. 27:1–27:27, May 2011.