ruff, gary - esd 2019 presentation bay controls · 2019-05-10 · microsoft powerpoint - ruff, gary...
TRANSCRIPT

Bay ControlsBenchmarking Compressor Performance with Continuous Monitoring and Surge TestingESD Conference 2019
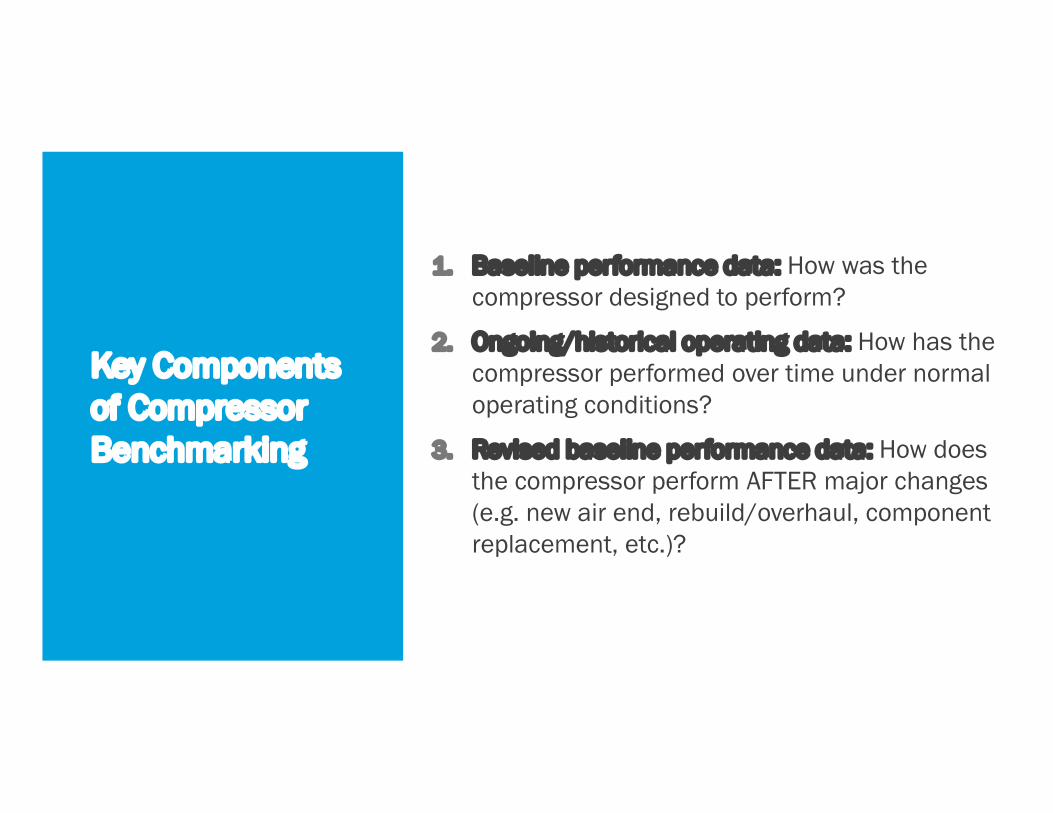
Key Components of Compressor Benchmarking
1. Baseline performance data: How was the compressor designed to perform?
2. Ongoing/historical operating data: How has the compressor performed over time under normal operating conditions?
3. Revised baseline performance data: How does the compressor perform AFTER major changes (e.g. new air end, rebuild/overhaul, component replacement, etc.)?

ExperienceOEM Compressor Design Baseline

ExperienceOEM Compressor Design Baseline

Experience Auto assembly plant with 3
identical centrifugal compressors
10 years worth of performance data from Bay Controls monitoring solution
Regular surge testing/tuning conducted by Bay Controls engineers
Customer Case Study: OEM Automotive Overview

Experience Initial surge
testing/tuning indicated Unit 3 had limited turndown relative to the other compressors
BayWatch monitoring data showed a poorly performing intercooler
Customer Case Study: Unit 3 Monitoring Data
TimeDischarge Pressure
2nd Stage Inlet Temp
3rd Stage Inlet Temp
Discharge Temp
Cooling Water Supply Temp
Drive Motor Current
11:42:55 86.6 100 100 195 74 102.911:42:57 88.4 100 108 195 74 102.911:42:58 89 100 108 195 74 10311:42:59 89.4 100 108 195 74 103.111:43:01 90.3 100 108 195 74 10311:43:02 90.8 101 108 195 74 102.911:43:03 91.2 101 108 195 74 102.911:43:04 91.2 101 108 195 74 10311:43:05 91.3 101 108 195 74 103.111:43:07 91.4 101 108 195 74 102.911:43:08 91.6 101 108 195 74 10311:43:09 91.8 101 108 195 74 103.111:43:12 92.4 101 108 196 74 103
A properly function intercooler should cool the inlet air temperature to within 20 degrees F of the cooling water supply temp
+27℉ +34℉

Experience
Once identified, the poorly performing intercooler was reconditioned and put back in service
Unit 3’s turndown improved significantly
Customer Case Study: Unit 3 Turndown Improvement
9/26/12 7/17/14L M H L M H
Power (Amps) 603 667 776 519 654 753Discharge Pressure (psi) 82.6 92.4 109.2 71.4 94.6 110.2
Before Intercooler Reconditioning After Intercooler Reconditioning

ExperienceUnit 3 Compressor Surge Test Data
Customer Case Study: Historical Turndown/Surge Test Data
12/8/09 9/26/12 7/17/14 11/15/16 3/8/18L M H L M H L M H L M H L M H
Power(Amps) 525 675 771 603 667 776 519 654 753 525 665 789 551 690 790
DischargePressure 69.5 94.9 109.9 82.6 92.4 109.2 71.4 94.6 110.2 69.5 94.8 114.9 72.2 95.9 114.5
L: LowM: MediumH: High
Intercooler reconditioning
Air end overhaul
Increased turndown
Decreased turndown immediately after overhaul; further decline from 2016 to 2018

ExperienceUnit 3 Compressor Surge Test Data Graph
Customer Case Study: OEM Automotive Historical Data
60
70
80
90
100
110
120
500 550 600 650 700 750 800
PSIG
Amps/Kw
12/8/099/26/127/17/1411/15/163/8/18
30 kW

ExperienceCustomer Case Study: OEM Automotive Summary
1. Addressing performance issues in a data-driven way can have big performance impacts
2. Overhaul conducted based on age instead of performance
3. Customer spent ~$150k on new air end for worse performance than they started with

ExperienceCustomer Case Study: OEM Automotive Lessons
1. Data is a better metric than age for compressor asset decisions (overhauls, major maintenance, replacements)
2. Historical performance data can/should be used to guide overhaul or replacement goals (i.e. compressor must perform better than before rebuild) and hold vendors accountable
3. Continuous monitoring can save big $$$
