ruekert & mielke, inc. - squarespace · public comment period ended dec 9, ... waterbodies not...
TRANSCRIPT

RUEKERT & MIELKE, INC.Serving Local People. Solving Local Problems.

Milwaukee River Basin TMDL: What Are Your Community’s Next Steps?
February 15, 2017

Agenda
Introductions & Welcome 10:05-10:20
Sweet Water 10:20-10:35
Case Studies from the Rock River TMDL 10:35-11:00
Lunch 11:00-11:20
Sand County Foundation 11:20-11:40
Funding & Grants 11:40-11:50
Q&A 11:50-12:00

Maureen McBroom
LindaReid
Greg Olson
Meet Your Speakers
Steve Wurster
DaveArnott
Terry Tavera

Welcome to the GWC
R/M opened its
Global Water Center
office in 2015.
Steve Wurster, P.E.Senior Vice President, COO
Ruekert & Mielke, Inc.
Intro to TMDL & DNR

Where’s Waldo?
Completed TMDLs:
Rock River
Lower Fox (GB)
St. Croix Watershed
TMDLs Under
Development:
Wisconsin River
Upper Fox – Wolf
Milwaukee River
Source: WDNR

Where’s Waldo?
3rd Party TMDL
Led by MMSD
Includes 4 Areas:
Milwaukee River
Menomonee River
Kinnickinnic River
Milwaukee Harbor
Estuary
Source: MMSD

MS4s in Watershed
44 Permitted MS4s
13 General Permits
24 Individual - Group
7 Individual – Specific
Pollutants of Concern
Sediment
Phosphorus
Bacteria
Source: MMSD
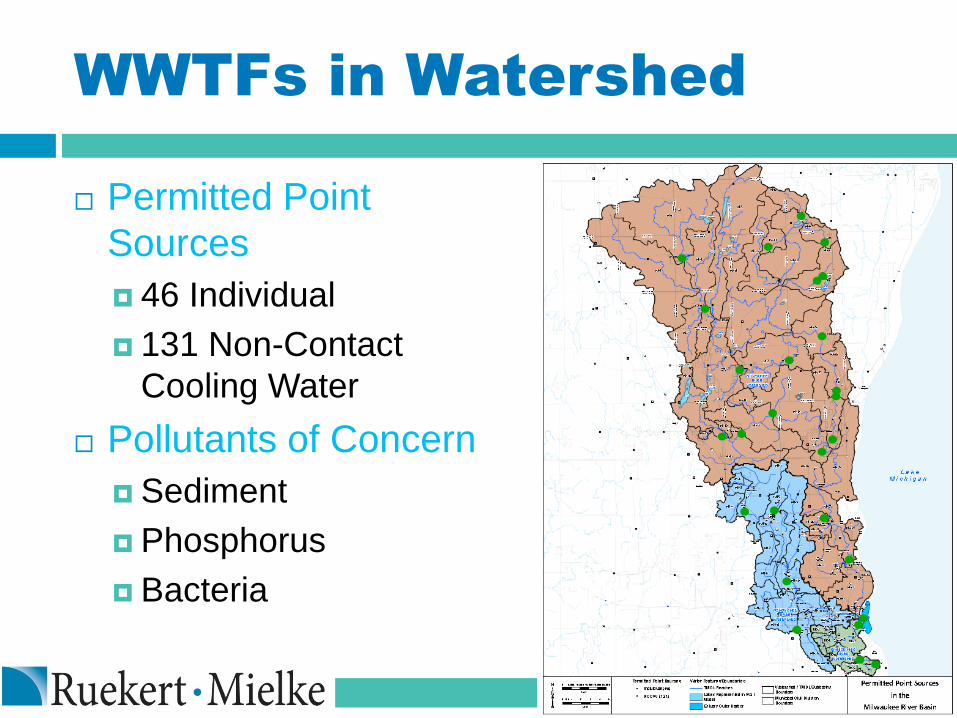
WWTFs in Watershed
Permitted Point
Sources
46 Individual
131 Non-Contact
Cooling Water
Pollutants of Concern
Sediment
Phosphorus
Bacteria

Bacteria Concerns
Eliminate illicit connections
Sample / trace source areas
Human vs. animal source identification (Sandra McLellan)
Source: Milw. Journal
First TMDL in WI to include bacteria
Has growth & die-off = difficult to model

Bacteria Concerns
Source: Milw. Journal

TMDL Next Steps
Public comment period ended Dec 9, 2016
Few number comments received
Lengthy and diverse content
Most were editorial vs technical / modeling
Anticipate quick review by EPA
Once finalized, incorporate results into MS4
and WWTF permits
Compliance = plan, implement and
demonstrate progress

SMART Permitting
Source: WDNR

Compliance Schedule
MS4 Compliance (Benchmarks every 5 years…)
WWTF Compliance (9 years)
Use permit process to negotiate
Compliance achieved on reach by reach basis
Modeling will be used to estimate compliance
Ultimate compliance = in-stream monitoring at compliance point for each reachshed
15 years
10 years
5 years
20 years
30 years
…a while
Linda ReidExecutive Director
Sweet Water
Sweet Water

“Forging partnerships for healthy waters in Southeastern Wisconsin”
Watershed Planning &
9 Key Element Update

Sweet Water is committed to restoring
the Greater Milwaukee watersheds to
conditions that are healthy for
swimming and fishing. We bring diverse
partners together and provide the
leadership and innovation necessary to
protect and restore our shared water
resources.

Kinnickinnic River
Menomonee River
Milwaukee River
Harbor / Estuary
Emerging Issues – TMDLS & GI
5 Key Initiatives

Key Initiative
Outreach / Education
Project Implementation
Policy Advancement

Watershed Area (sq. mi.)
Kinnickinnic River - 24.7
Menomonee River - 135.8
Milwaukee River - 700.0
Lake Michigan - 40.7
Direct Drainage Area
Oak Creek - 28.2
Root River - 197.6
1127 sq. mi.
600+ perennial river miles
9 Counties
83 Municipalities

Degraded Biological
Community
Chronic Aquatic
Toxicity
Low Dissolved
Oxygen
Recreational Use
Restrictions-
Pathogens
Contaminated Fish
Tissue
Elevated Water
Temperature
Impairment Unknown Excess Algal Growth Contaminated
Sediment
Water Quality Use
Restrictions
Degraded Habitat Acute Aquatic Toxicity
waterbodies not meeting their designated uses – fish and aquatic life,
recreation, public health and welfare, wildlife – or water quality criteria, are
impaired
303(d) – Impaired Waters
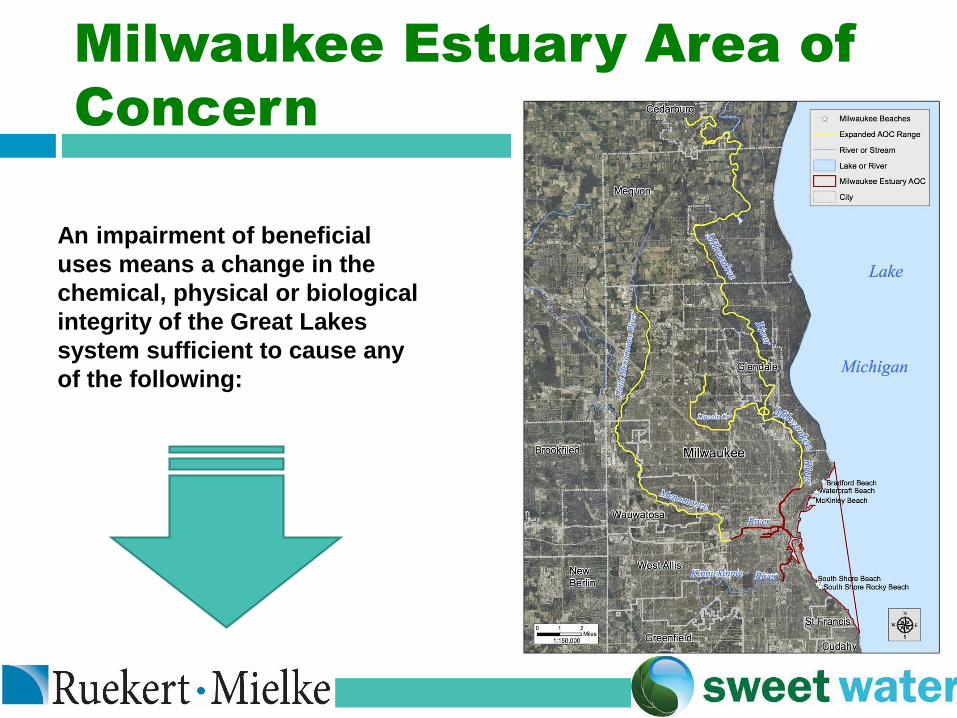
Milwaukee Estuary Area of
Concern
An impairment of beneficial
uses means a change in the
chemical, physical or biological
integrity of the Great Lakes
system sufficient to cause any
of the following:

Restrictions on fish and wildlife consumption*
Eutrophication or undesirable algae
Degradation of fish and wildlife populations*
Beach closings/recreational restoration
Fish tumors or other deformities
Degradation of aesthetics
Bird or animal deformities or reproduction
problems
Degradation of benthos*
Degradation of phytoplankton and zooplankton
populations
Restrictions on dredging activities*
Loss of fish and wildlife habitat*

is committed to restoring the Greater
Milwaukee watersheds

SWWT- led Plans in Progress
Milwaukee River Watershed TMDL Implementation Plan - planning begins
Q2, 2017
Implementation plan and priority project list or the Kinnickinnic River
Watershed (9KE plan) - submitted to WDNR Q1, 2017
Implementation plan and priority project list for the Menomonee River
Watershed (9KE plan) - projected submission to WDNR Q2, 2017
Watershed Restoration and Implementation Plan and Priority Project List
for the Lake Michigan Frontal Watershed HUC 10 (Pigeon, Ulao, and Mole
Creeks) (9KE plan) - planning begins Q3, 2017
Watershed Restoration and Implementation Plan and Priority Project List
for the Cedar Creek HUC 10 (9KE plan) - planning begins Q3, 2017
TMDLs
Phosphorus
TSS
Bacteria

TMDL Implementation
Public Outreach
Information & Education
Codes & Ordinances
9KE Plan development & implementation
Pollutant allocation compliance
Permitting
Infrastructure improvements (traditional methods)
Technology improvements
Adaptive Management and Water Quality Trading

1. Identify Causes and Sources of Impairments
2. Estimate of reductions expected by management practice
3. Management Measures
4. Technical and financial assistance, costs, and leadership team
5. Information and Education
6. Schedule for Implementation
7. Measurable Milestones
8. Criteria to determine if desired reductions are being achieved
9. Monitoring
US EPA Nine Minimum
Elements of a Watershed Plan

The KK 9KE Plan
Water Quality
Water Quantity / Flood Management
Habitat
Recreation

MULTI-Purpose Projects
because
well-planned

are cost-effective
and

Successful Watershed Restoration
lead to
and

Successful Watershed
Restoration
=
Delisting

Sweet Water is committed to restoring the
Greater Milwaukee watersheds to
conditions that are healthy for swimming
and fishing. We bring diverse partners
together and provide the leadership
and innovation necessary to protect
and restore our shared water
resources.
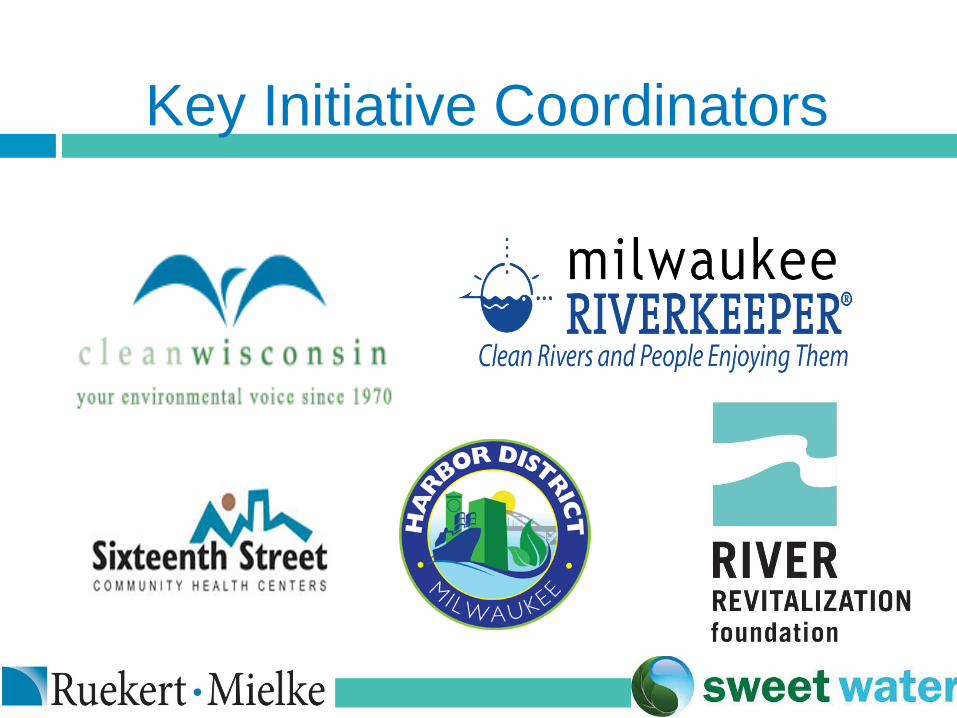
Key Initiative Coordinators

Develop and implement plans for watershed restoration
Forge partnerships that build support for water quality
projects and improvements
Support innovations to advance water quality in a
cost-effective manner
Provide mini-grants to fund small-scale water quality
improvement projects
Raise public awareness about reducing stormwater pollution
Develop and implement policy and regulatory tools
Questions?

(414) 382-1766
Thank you for your attention.
Please let us know how we can
assist your organization.

Dave Arnott, P.E.Team Leader/Project Manager
Ruekert & Mielke, Inc.
Terry Tavera, P.E.Project Manager
Ruekert & Mielke, Inc.
Case Studies from the Rock
River TMDL

Watershed Approach

The City’s Options
TMDL - MS4 Permit and WWTF Permit
Capital Projects WWTF - Filters
Storm Water System ?
Adaptive ManagementWatershed based approach. Partners and stakeholders work collectively to remediate problem areas. Requires documented water quality improvement.
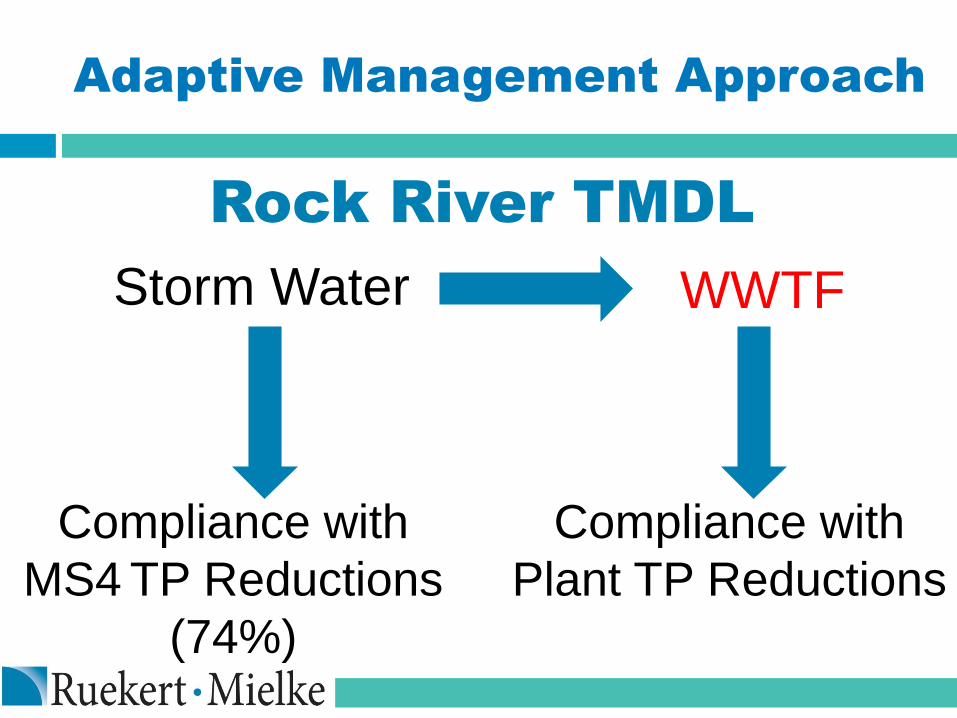
Adaptive Management Approach
Rock River TMDL
Storm Water WWTF
Compliance with
MS4 TP Reductions
(74%)
Compliance with
Plant TP Reductions

Watershed Health at the
Rock River Confluence

Adaptive Management
Advantages
Requires actual water quality improvement.
Addresses the remediation of problem areas
throughout the watershed.
Reduces overall costs and cost per pound of
pollutants removed.

Phosphorus Unit Costs
Agricultural - $60 to $90 per pound
WWTF - $150 to $400 per pound
Storm Water - $800 to $3,000 per
pound

Reductions
Critical Source Areas (Ag land)
Oconomowoc Wastewater Treatment Facility
Urban Storm Water
Where will the P reductions
come from?

Critical Source Areas
Waukesha
and
Jefferson County

Critical Source Areas
Washington
and
Waukesha County

OWPP Progress
Partnerships formed
Farmer Leadership Group Formed
Approval for Adaptive Management Plan
Producer meetings
WWTF Optimization
GIS site to track projects and reductions
Website: www.oconomowocwatershed.com
Projects: filter strips, conservation cover, field border, cover crops

OWPP Lessons Learned
Approach farmers on their terms.
Make use of farming “off season”.
Leverage contacts at County Land and Water
Departments.
Agreements are critical. Details.
Need to enhance existing NRCS programs.
Follow up is important. Genuine interest.

INTRA-MUNICIPAL
POLLUTANT
TRADING

Intra-Municipal Trading
1. MS4 Permit
2. Wastewater Treatment Facility

Wastewater Treatment Facility
1. Discharge to surface water requires permit
2. TMDL-based mass limits for TSS and TP

Origin of Credit
Use Variations in Monthly TMDL-Based Limit
2.00
2.50
3.00
3.50
4.00
4.50
5.00
5.50
Dai
ly L
oad
(lb
s.)
Month
Permit Level
Minimum Permit Level
Operating Level

Origin of Credit
2.00
2.50
3.00
3.50
4.00
4.50
5.00
5.50
Dai
ly L
oad
(lb
s.)
Month
Permit Level Operating Level
Origin of Credit
Advantages to WWTF Operations:
1. Consistency in Treatment.
2. Ease of Treatment.
3. Insurance.

External Trades
1. WWTF to WWTF
2. WWTF to Industrial
3. WWTF to MS4
4. WWTF to Agricultural
5. MS4 to Agricultural
6. MS4 to MS4

Cautions
1. Available Credit Will Shrink with Time.
2. Don’t Trade all Credits.
3. Carefully Consider Length of Trade. Not Too
Short or Too Long.
4. Credits Must be in Place Before They Can be
Traded.

TMDLs vs MS4 Permit
TMDL reaches vs community
Significant jump modeled TSS controls MS4 permit to TMDL
New development since 2004/swale testing
Dousman:
2010: 38% TSS, 24% P
2016: 64% TSS, 63% P
Hartland
2010: 41% TSS, 32% P
2016: 52% TSS, 41% P
Non-traditional alternatives
Goal get waterway off of the impaired waters list

Swales
Communities with swales meet requirements
much easier than those without
In-field testing can lead to better infiltration
rates = better TSS & P control
Fox Point

Alternative Storm Water
Solutions: Dousman

Alternative Storm Water
Solutions: Dousman
55% Reduction in Total Suspended Solids or 3977 LBS
44% Reduction in Total Phosphorus or 8.75 LBS
RESULTS
Biofilter Drainage Basin
Village Wide
2.7% Reduction in Total Suspended Solids
1.7% Reduction in Total Phosphorus

Alternative Storm Water
Solutions: Milwaukee
Permeable Pavers
School of Freshwater Sciences

Alternative Storm Water:
Downers Grove, IL
Triaxial
Geogrid (TX5)
between base
and subbase
in high-traffic
areas
Permeable
Pavers /
Bioretention

Alternative Storm Water
Solutions: Orlando, FL
Green Roof / Cistern
Over sidewalk/plaza

Alternative Storm Water
Solutions
Maintenance Required
Maintenance is a must.
Future owners/users need to understand maintenance
needs
Not all practices are suitable for all sites
Soils, groundwater may dictate options
Needs good design incorporated with purpose/intent
of project

Water Resource
Improvements
In-stream projects and improvements to:
Improve habitat
Protect property / land from erosion due to failing
streambanks and lakeshores
Restore downtown/riverfront areas; draw people in
Offer recreation and enjoyment to citizens
Implement TMDL by addressing impairments, not
just excess pollutants (degraded habitat, low DO,
etc.)

Examples of Water
Resource Improvements
Stream daylighting
Culvert corrections / Aquatic organism
passage
Streambank stabilization projects
Parkland development along rivers
Habitat structures
Native vegetation for stabilization and habitat
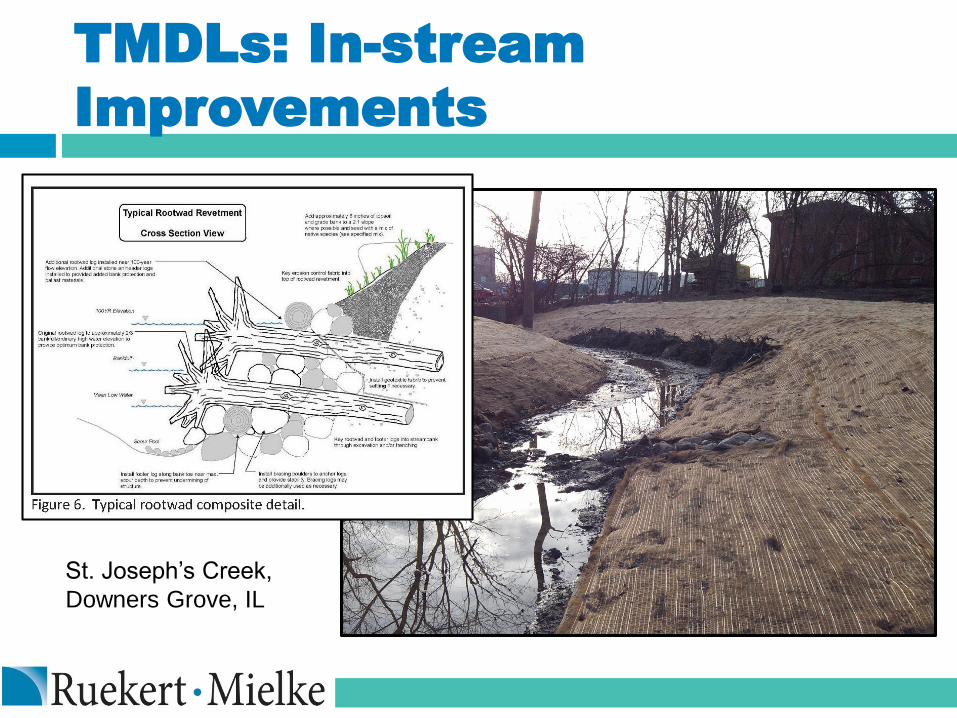
TMDLs: In-stream
Improvements
St. Joseph’s Creek,
Downers Grove, IL
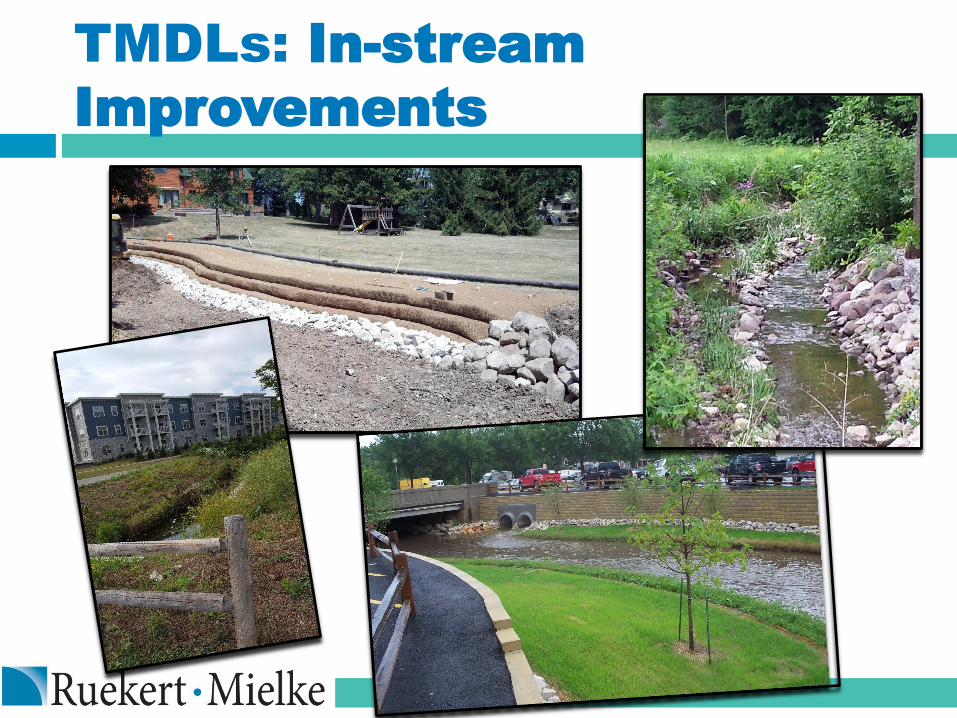
TMDLs: In-stream
Improvements

Taking Advantage CIP
Roadway delayed
implementation expired
January 2017
Stand alone BMP’s are $$$
Controls above regulatory
eligible for grant $

TMDLs: Oconomowoc
City of Oconomowoc Storm Water
Management Plan (2015)
4 TMDL reaches
Reach 25:
59% TSS
74% Phosphorus – Adaptive
Management

TMDLs: Oconomowoc
For TSS:
Evaluated potential storm
water practices
Green infrastructure practices
Evaluate pavement ratings
inclusion storm water practices
on scheduled road projects
Recommended more stringent
pollutant controls in storm
water ordinance

Greg OlsonField Projects Director
Sand County Foundation
Agricultural Efforts for
Healthy Waters

Sand County Foundation
Find Science-based solutions for conservation issues
Primarily concentrate on wildlife and water-related issues
Today we will be concentrating on the following water project types:
Efficacy Studies to quantify BMP nutrient loss capabilities
Agricultural Nutrient Loss Abatement (results based approaches)
Receiving Water Body Conditions Analysis (Watershed & In-Stream Monitoring)
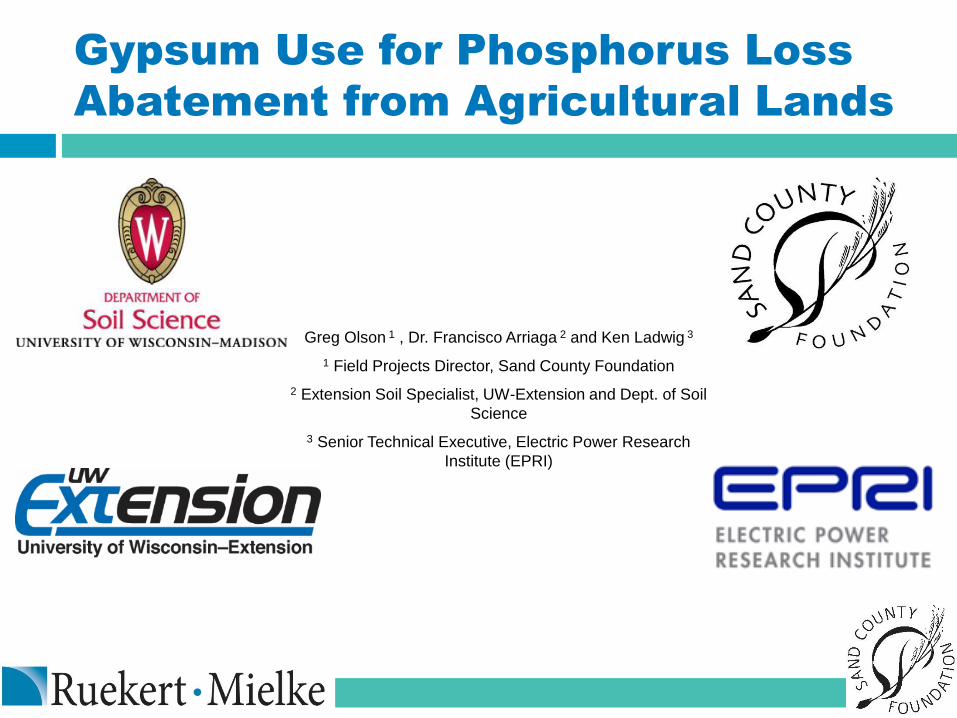
Gypsum Use for Phosphorus Loss
Abatement from Agricultural Lands
Greg Olson 1 , Dr. Francisco Arriaga 2 and Ken Ladwig 3
1 Field Projects Director, Sand County Foundation
2 Extension Soil Specialist, UW-Extension and Dept. of Soil
Science
3 Senior Technical Executive, Electric Power Research
Institute (EPRI)

What is Gypsum?
Gypsum
CaSO4.2H2O
Calcium Sulfate DiHydrate
Sources – Mined gypsum, Flue-Gas Desulfurization (FGD) gypsum, recycled gypsum, phosphogypsum
Analysis
Calcium 20%
Sulfate Sulfur 16%
1 Ton
Calcium 400#
Sulfate Sulfur 320#

Soil Structure
Dispersed Flocculated
Clay particle
Cation+
Water
Which
Is
Better?
(Bad) (Good)
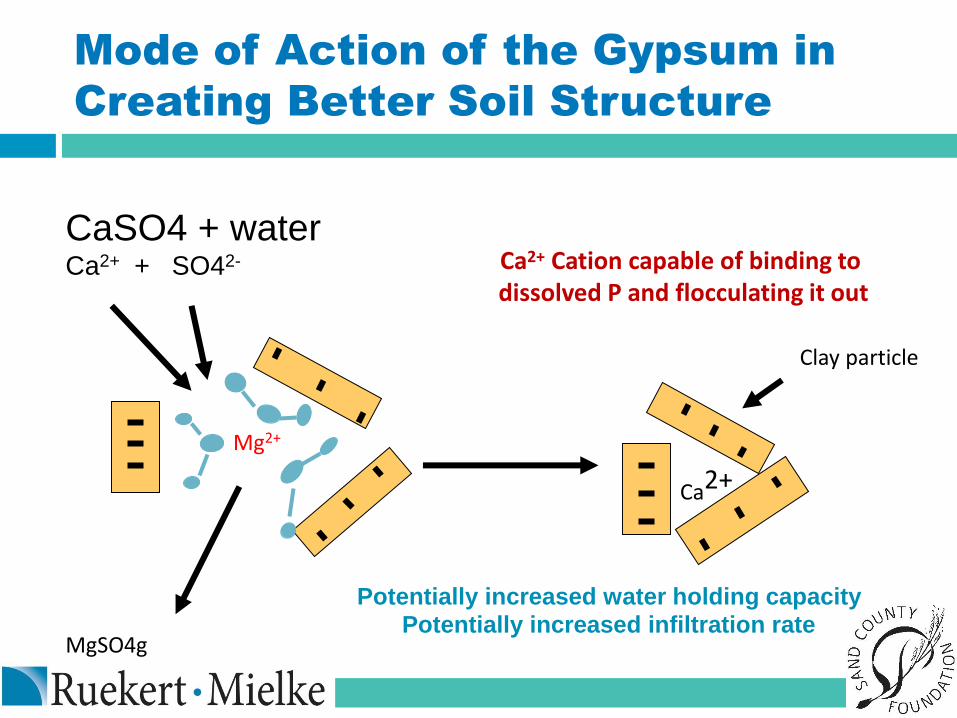
Mode of Action of the Gypsum in
Creating Better Soil Structure
Ca2+
Clay particle
Mg2+
MgSO4g
CaSO4 + waterCa2+ + SO42-
Potentially increased water holding capacity
Potentially increased infiltration rate
Ca2+ Cation capable of binding to dissolved P and flocculating it out


Edge-of-Field Sampling Equipment
sonic depth sensors
HXT-flume
water
sampling
system
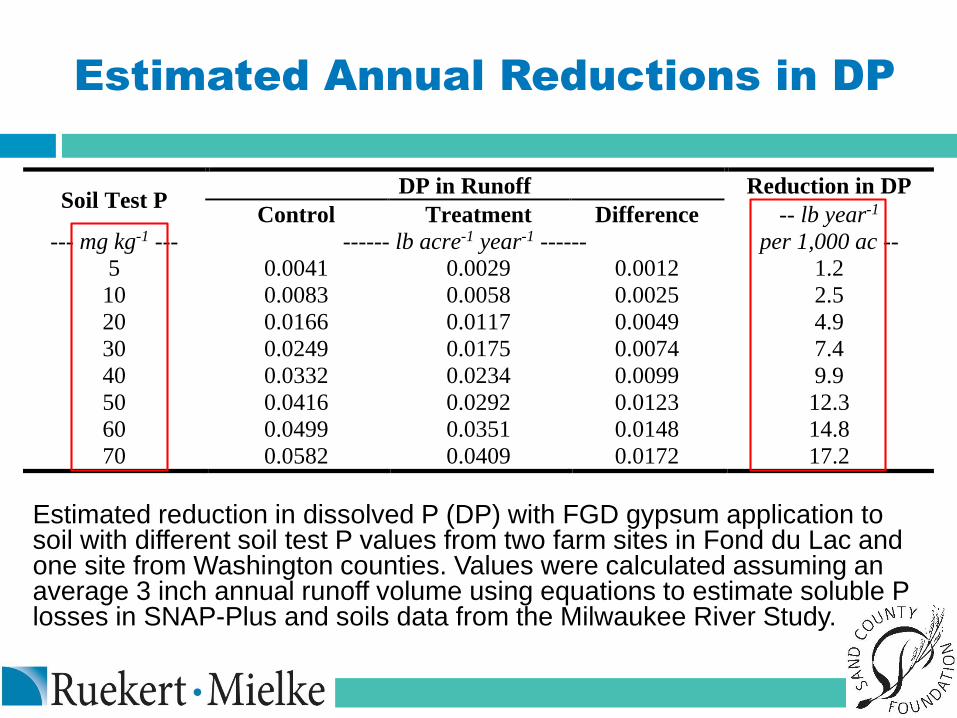
Estimated Annual Reductions in DP
Estimated reduction in dissolved P (DP) with FGD gypsum application to soil with different soil test P values from two farm sites in Fond du Lac and one site from Washington counties. Values were calculated assuming an average 3 inch annual runoff volume using equations to estimate soluble P losses in SNAP-Plus and soils data from the Milwaukee River Study.
Soil Test P DP in Runoff Reduction in DP
Control Treatment Difference -- lb year-1
per 1,000 ac -- --- mg kg-1 --- ------ lb acre-1 year-1 ------
5 0.0041 0.0029 0.0012 1.2
10 0.0083 0.0058 0.0025 2.5
20 0.0166 0.0117 0.0049 4.9
30 0.0249 0.0175 0.0074 7.4
40 0.0332 0.0234 0.0099 9.9
50 0.0416 0.0292 0.0123 12.3
60 0.0499 0.0351 0.0148 14.8
70 0.0582 0.0409 0.0172 17.2

Pay for Performance Project
Goal – Pilot test a results based agricultural P loss abatement system
2013 Grant - Great Lakes Protection Fund
Project Partners – WinrockInternational & Delta Institute
Use SNAP- Plus PTP for P loss abatement quantification
13 farms (various sizes and types) in SE FDL County
9 to 12 P loss abatement options analyzed per farm
Payment based on final whole farm P loss assessment
2010 West Branch-Milwaukee River
Nutrient Reduction Project
2010 NRCS Grant
Project Partners – USDA-NRCS, FDL County Land and Water Conservation Dept., USGS and the Producers in the West Branch Milwaukee River Watershed
Started with outreach to Producers with incentives for NMP development. NMPs used to inventory nutrient use and management.
Detailed watershed assessment monitoring program (USGS)
3 edge of field, 3 in-stream monitoring & a centrally located meteorological sites
Monitoring site data used to look at field to stream to downstream nutrient delivery dynamics
Project was completed in fall of 2015


West Branch-Milwaukee
River Edge of Field
Monitoring Data Collected
for Water Years 2012 –
2015
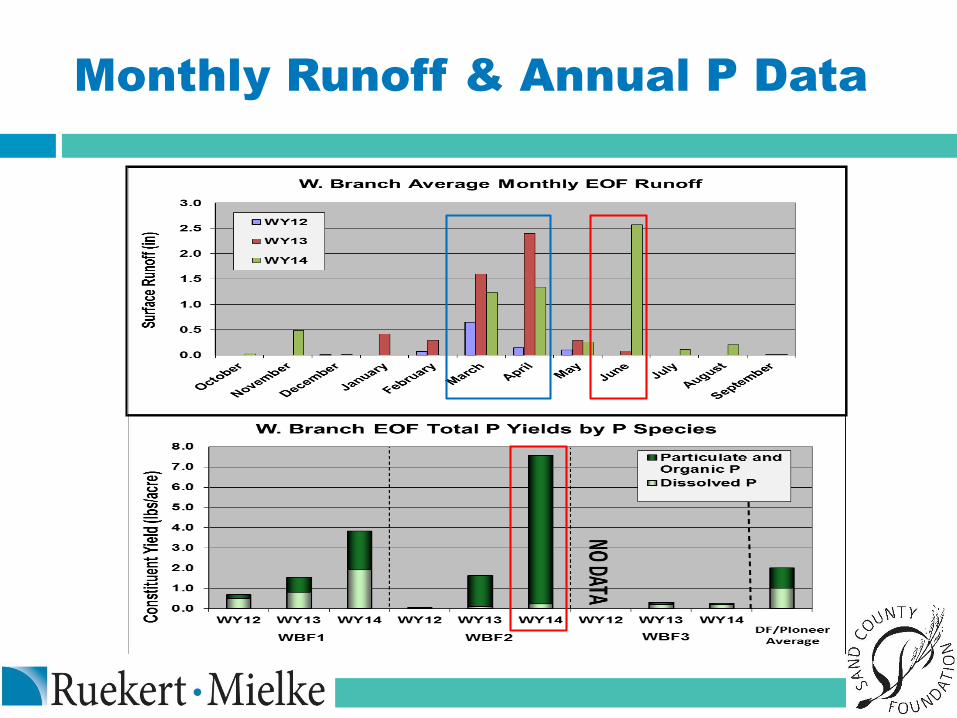
Monthly Runoff & Annual P Data

Example of what a typical runoff event collection used to look like
What more recent runoff events are looking like
Build up Heaviest loss (H) Tapering off
D H D DH H H H H H H H

West Branch-Milwaukee
River In-Stream Event
Based Monitoring Data
Collected for Water Years
2012 Through 2015

M4 Sediment & P DataWater Year 2013

West Branch-Milwaukee
River In-Stream EWI
Sampling Monitoring Data
for Water Years 2011 - 2015

M14 Flow & Monthly Total P Data6/2011 – 2/2014
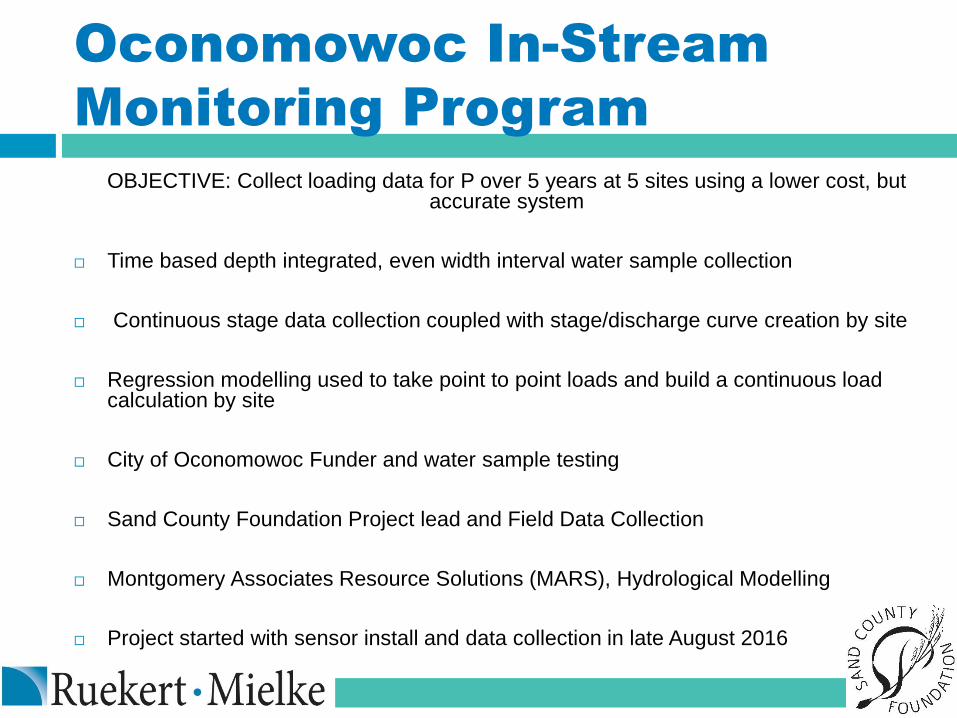
Oconomowoc In-Stream
Monitoring Program
OBJECTIVE: Collect loading data for P over 5 years at 5 sites using a lower cost, but accurate system
Time based depth integrated, even width interval water sample collection
Continuous stage data collection coupled with stage/discharge curve creation by site
Regression modelling used to take point to point loads and build a continuous load calculation by site
City of Oconomowoc Funder and water sample testing
Sand County Foundation Project lead and Field Data Collection
Montgomery Associates Resource Solutions (MARS), Hydrological Modelling
Project started with sensor install and data collection in late August 2016

Oconomowoc In-Stream
Monitoring Program Map


Maureen McBroomEnvironmental Coordinator
Ruekert & Mielke, Inc.
Funding & Grants

Funding Opportunities
Current TSS Control Evaluations
TMDL Wasteload Allocation Analysis and Planning
Storm water facility inventory
Bacteria Monitoring Procedures
Bacteria Source Identification Maps
Erosion Control Enforcement Procedures
Storm Water Plan Review Processes
Illicit Discharge Detection and Elimination (IDDE)
MS4 Mapping / GIS
Storm Water Ordinance Updates
Utility Rate Analyses
WDNR UNPS Storm Water Planning Grants
Funding Opportunities
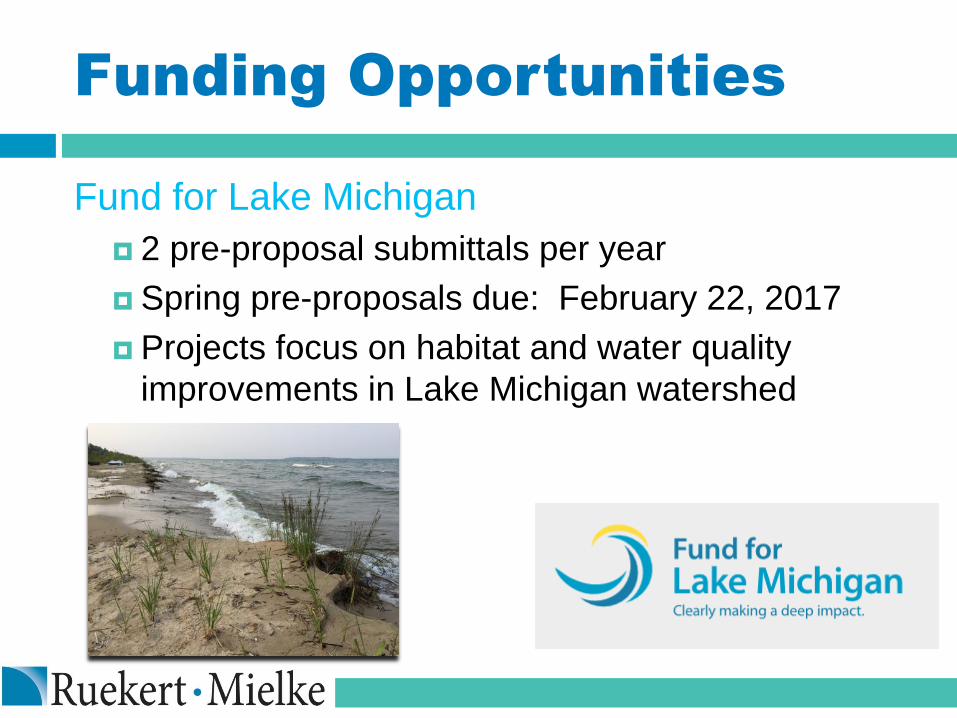
Fund for Lake Michigan
2 pre-proposal submittals per year
Spring pre-proposals due: February 22, 2017
Projects focus on habitat and water quality
improvements in Lake Michigan watershed

Funding Opportunities
Sustain our Great Lakes
Applications due February 21, 2017
3 areas of funding:
Stream / habitat projects
Coastal wetland rehabilitation projects
Green Infrastructure for coastal communities

Funding Opportunities
In the MMSD Service Area:
• MMSD Green Infrastructure
Partnership Program
• MMSD Green Solutions
Green Infrastructure Partnership Program Focus is on projects consistent with MMSD’s 2035 vision of 740
million gallons of storage
Projects in MMSD service area are eligible
Applicants: property owners or developers
Funding is determined by type of project
Up to 50% cost share
Grants awarded in early summer
Funding Opportunities

Funding Opportunities
Green Solutions
Communities in MMSD Service area are eligible
Focus is Green Infrastructure projects
Work plans are submitted to MMSD for review and
approval for funding
Annual allocation by community

Funding Opportunities
Clean Water Fund Loans (WDNR & DOA)
Wastewater Treatment Facilities
Storm Water Practices
Small Loans Program:
> $2,000,000
ITA (Intent to Apply) due October 31 of the year prior
to application submittal
Lower interest rates
Pilot Project Program: offers low interest loans for
adaptive management, pollutant trading & more

Funding Opportunities
Promotes NRCS
conservation practices in a
designated watershed
Local Partnerships /
Private Property Owners
4-year project period
NRCS Regional Conservation Partnership Program
Implementation of conservation measures for soil, water,
wildlife, and natural resources on private property.

Save the Date
March 15th, 2017Road Ratings SeminarWaukesha Office
March 21st, 2017
GIS User GroupHeld at DeForest Village Hall

THANK YOU
We appreciate your
feedback. Watch for the
survey.