ruby and pink sapphire from aappaluttoq, greenland · ruby and pink sapphire from aappaluttoq,...
TRANSCRIPT

Ruby and Pink Sapphire from Aappaluttoq, Greenland
Status of on‐going research
Kamolwan Thirangoon GIA Laboratory, Bangkok
Abstract Twenty‐six ruby and pink sapphire samples from Aappaluttoq, Greenland were analyzed. Spectroscopy showed a typical Cr spectrum with absorption in the UV region indicating high Fe content. Chemical analysis revealed a high Fe content and low V content. Raman spectroscopy on crystals exposed at the surfaces of many of the samples was consistent with materials related to metamorphic origin of this corundum. The results of this examination show that the samples are unheated Non‐classic Locality (NCL) Type I stones according to the GIA corundum classification system.
Introduction Greenland is a self‐governing Danish province located between the Arctic and Atlantic Oceans, East of the Canadian Artic. It is the world’s largest island. Many gemstones have been found in Greenland; these are diamond, ruby, pink sapphire, kornerupine, tugtupite, lapis lazuli, amazonite, peridot, quartz, spinel, topaz and tourmaline. The diamond, ruby and pink sapphire occurrences are concentrated in southern West and West Greenland, respectively. In 1966, ruby was first discovered in Fiskenæsset/ Qeqertarsuatsiaat, West Greenland. Platinomino A/S, a Canadian exploration company, carried out mapping of the ruby‐bearing zones. Several of the ruby‐bearing zones were discovered in Siggartartulik. However, the activity ceased after a few years. In 2004, True North Gems Inc. obtained an exclusive exploration license of a 3600 sq. km. area. Aappaluttoq and Kigutilik are the two most promising ruby localities to date (Secher and Appet. 2007). This preliminary study describes twenty‐six rubies and pink sapphires (Figure 1) from Aappaluttoq, Greenland. These samples were supplied by John L. Emmett of JLE Associates located in Brush Prairie, WA, who obtained them from True North Gems Inc. The samples have been examined using various optical methods and chemical analyses have also been performed. This outline discusses the characteristics gained thus far from these twenty‐six samples.

Materials and Methods
Figure 1: Ruby and pink sapphire slices from Aappaluttoq, Greenland examined in this study. They were cut across the C‐axis. They are ranging from 0.27 to 1.51 cts in weight and 0.53 to 1.55 mm thick. Photo by Suchada Kittayachaiwattana and Adirote Sripradi
Twenty‐six Aappaluttoq, Greenland, ruby and pink sapphire samples were acquired from John Emmett for this study. Prior to acquisition they were fabricated into polished plates cut across the C‐axis by John Emmett. The samples range in size from 0.27 to 1.51 cts and are 0.53 to 1.55 mm thick. Colors may be described as from light pink to red (Figure 1). Refractive indices were measured with a standard gem refractometer using a monochromatic light that simulates the light produced by a sodium arc lamp; Specific Gravity (S.G.), determinations were calculated by the hydrostatic technique using an appropriately fitted Mettler electronic balance with water at room temperature; UV, fluorescence was observed using a UVP, UVLS‐28 EL series, 8 watt,
UV lamp with both 365 and 254nm radiation; Microscopic observations were made using various GIA Gemolite microscopes at between 10 and 65x magnifications; Raman spectra were collected using a Renishaw inVia Raman microscope fitted with a 514nm Argon Ion laser; Infrared spectra were collected using a Thermo Nicolet 6700 FTIR and appropriate accessories; UV/visible/NIR spectra were collected using a Perkin Elmer Lambda 950 spectrophotometer with various bench configurations and dual polarizers; Chemical analysis was performed using an Thermo X‐Series II Laser Ablation Inductive Plasma Mass Spectroscopy (LA‐ICP‐MS) system attached to a New Wave research UP‐213 laser system.
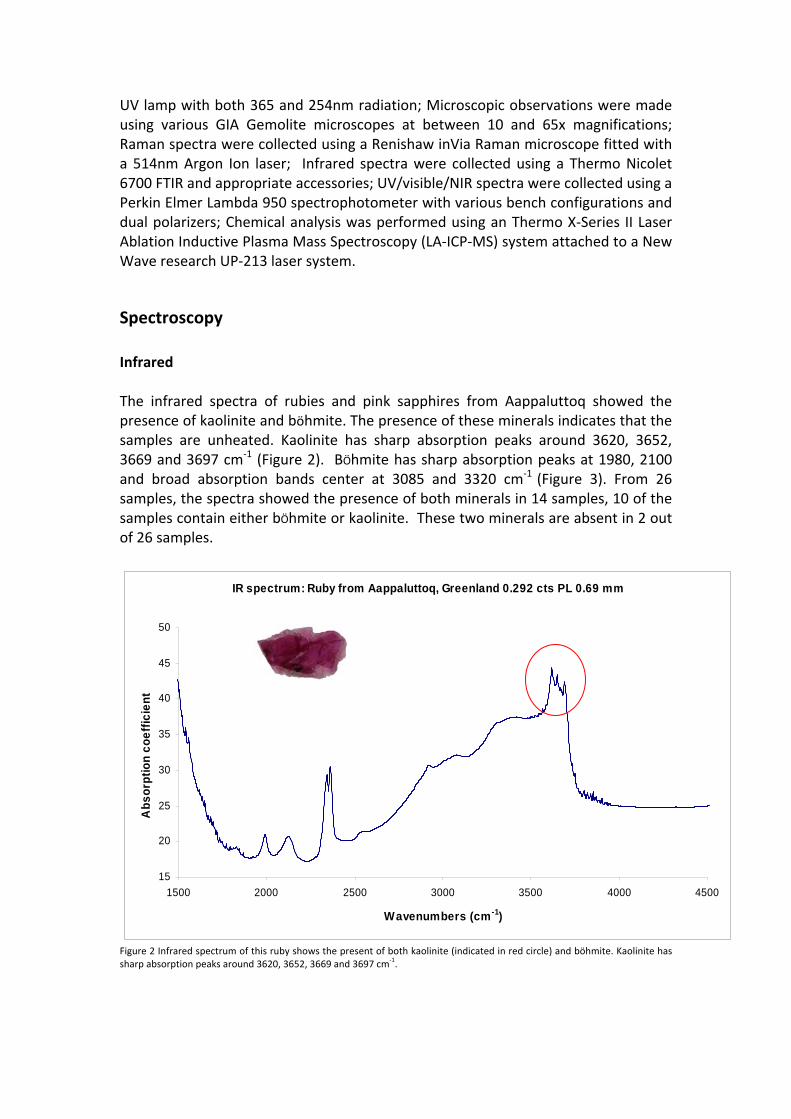
Spectroscopy Infrared The infrared spectra of rubies and pink sapphires from Aappaluttoq showed the presence of kaolinite and böhmite. The presence of these minerals indicates that the samples are unheated. Kaolinite has sharp absorption peaks around 3620, 3652, 3669 and 3697 cm‐1 (Figure 2). BÖhmite has sharp absorption peaks at 1980, 2100 and broad absorption bands center at 3085 and 3320 cm‐1 (Figure 3). From 26 samples, the spectra showed the presence of both minerals in 14 samples, 10 of the samples contain either bÖhmite or kaolinite. These two minerals are absent in 2 out of 26 samples.
IR spectrum: Ruby from Aappaluttoq, Greenland 0.292 cts PL 0.69 mm
15
20
25
30
35
40
45
50
1500 2000 2500 3000 3500 4000 4500
Wavenumbers (cm-1)
Abs
orpt
ion
coef
ficie
nt
Figure 2 Infrared spectrum of this ruby shows the present of both kaolinite (indicated in red circle) and böhmite. Kaolinite has sharp absorption peaks around 3620, 3652, 3669 and 3697 cm‐1.

IR spectrum: Ruby from Aappaluttoq, Greenland 0.67 cts PL 1.15 mm
0
2
4
6
8
10
12
14
16
1500 2000 2500 3000 3500 4000 4500
Wavenumbers (cm-1)
Abs
orpt
ion
coef
ficie
nt
Figure 3: The infrared spectrum of this sample shows the presence of böhmite. The mineral has sharp absorption peaks at 1980, 2100 and broad absorption bands center at 3085 and 3320 cm‐1.
UV/visible
UV /visible spectrum: Ruby from Aappaluttoq, Greenland 0.51 cts PL 1.08 mm
0
20
40
60
275 325 375 425 475 525 575 625 675 725
Wavelength (nm)
Abso
rptio
n co
effic
ient
Figure 4: UV‐visible spectrum of the sample showing typical Cr spectrum. The spectrum is dominated by two large absorption bands centered at approximately 400 and 550 nm. The absorption edge is positioned around 289‐302 nm. There is an absorption in the UV region at approximately 344 nm indicating high Fe content
bÖhmite
UV‐visible spectroscopy showed only the O‐ray as the samples were polished across the C‐axis into thin slices. The spectrum is a typical Cr spectrum. The spectrum is dominated by two large absorption bands centered at approximately 400 and 550 nm, resulting from Cr 3+ ions (Krebs and Maisch. 1971). There is a narrow band at 450 nm caused by Fe3+‐Fe3+ pairs and a Cr band at 690 nm. The absorption edge is positioned around 289‐302 nm. There is an absorption in the UV region of 344 nm indicating a high Fe content.
Chemical analysis Chemical analysis was performed using Laser Ablation‐Inductively coupled Plasma Mass Spectroscopy (LA‐ICP‐MS). Samples were cleaned with acetone and aqua regia in an ultrasonic bath to eliminate surface contamination prior to the analysis. The laser operated at a wavelength of 213 nm with He as the carrier gas. Laser‐ablation parameters were as follows: 55 μm spot diameter, ~9‐10 J/cm2 laser energy density (fluence), 15 Hz repetition rate and 60 second laser dwell time. Spots are 0.7 μm apart. Each sample was ablated between five to twelve spots. NIST SRM 610, 612 ((Pearce. 1996)), synthetic corundums each doped with Ti, V, Cr and Ga including high Fe natural corundum were used as external standards. Al was used as an internal standard.
Table 1: Average concentration of trace elements in oxide percent weight (%WT). Sample TiO2 V2O5 Cr2O3 FeO Ga2O3698 0.03 0.01 1.94 0.43 0.00700 0.04 0.01 0.82 0.21 0.01702 0.03 0.02 0.47 0.27 0.01703 0.04 0.02 0.20 0.26 0.01705 0.03 0.01 0.28 0.24 0.01709 0.04 0.01 0.41 0.25 0.01712 0.03 0.01 0.66 0.26 0.01713 0.02 0.01 0.76 0.15 0.00714 0.04 0.01 0.75 0.19 0.01715 0.03 0.01 0.73 0.27 0.01
716 (lighter zone) 0.03 0.02 0.63 0.26 0.01716 (darker zone) 0.03 0.01 1.08 0.24 0.01
717 0.02 0.01 0.20 0.19 0.0117401896 0.03 0.01 0.24 0.18 0.0117401897 0.03 0.01 0.22 0.18 0.0117401898 0.03 0.01 0.55 0.17 0.0117401899 0.03 0.01 0.25 0.17 0.0117401900 0.07 0.01 1.28 0.36 0.0017401901 0.02 0.01 0.46 0.17 0.0117401902 0.11 0.01 1.12 0.35 0.0017401903 0.03 0.02 0.36 0.27 0.0117401904 0.03 0.01 0.14 0.15 0.0117401905 0.05 0.23 0.40 0.19 0.0117401906 0.05 0.01 0.27 0.18 0.0117401907 0.03 0.01 0.15 0.17 0.0017401908 0.03 0.01 0.31 0.19 0.01

Table 2: Average concentration of trace elements in element oxide ppmw. Sample Ti V Cr Fe Ga698 205.86 57.91 13266.20 3315.42 33.76700 213.31 61.40 5639.20 1610.80 44.15702 207.78 84.65 3181.98 2091.27 43.57703 241.34 88.05 1352.02 1989.12 41.95705 181.39 66.31 1882.25 1865.95 43.17709 234.72 58.92 2828.81 1969.60 45.07712 163.17 64.73 4494.44 1995.88 40.00713 115.82 73.51 5217.69 1167.94 35.44714 253.58 83.18 5109.54 1444.08 42.35715 192.79 69.62 5018.44 2072.95 40.45
716 (lighter zone) 208.09 92.40 4306.42 2051.72 45.88716 (darker zone) 176.01 74.18 7386.03 1888.56 38.61
717 148.32 72.33 1343.18 1488.03 43.0617401896 162.79 54.23 1634.88 1426.70 41.2517401897 197.60 55.29 1491.32 1364.22 41.7817401898 195.54 47.38 3771.74 1358.51 43.8017401899 204.75 57.91 1708.82 1344.04 42.3017401900 432.21 51.96 8789.43 2761.73 29.4517401901 138.58 68.32 3169.13 1292.24 38.5917401902 651.14 51.21 7664.88 2752.00 28.9917401903 209.49 86.37 2477.38 2084.10 42.1217401904 162.35 66.03 930.71 1168.91 38.9217401905 301.37 1572.31 2898.62 1483.92 46.1517401906 285.92 83.73 1874.79 1410.63 42.9517401907 181.46 66.44 997.97 1315.76 35.9917401908 203.02 52.52 2125.44 1482.99 37.46
Table 3: Average concentration of trace elements in element ppma. Sample Ti V Cr Fe Ga698 87.64 23.18 5202.39 1210.53 9.87700 90.81 24.58 2211.43 588.14 12.91702 88.45 33.89 1247.82 763.57 12.74703 102.74 35.25 530.20 726.27 12.27705 77.22 26.55 738.13 681.30 12.63709 99.93 23.58 1109.33 719.14 13.18712 69.46 25.91 1762.51 728.74 11.70713 49.31 29.43 2046.14 426.44 10.37714 107.96 33.30 2003.73 527.26 12.39715 82.07 27.87 1968.00 756.88 11.83
716 (lighter zone) 88.59 36.99 1688.78 749.13 13.42716 (darker zone) 74.93 29.70 2896.46 689.55 11.29
717 63.14 28.96 526.73 543.31 12.6017401896 69.30 21.71 641.12 520.92 12.0717401897 84.12 22.13 584.83 498.11 12.2217401898 83.25 18.97 1479.10 496.02 12.8117401899 87.17 23.18 670.12 490.74 12.3717401900 184.00 20.80 3446.81 1008.36 8.6217401901 58.99 27.35 1242.79 471.82 11.2917401902 277.20 20.50 3005.81 1004.81 8.4817401903 89.18 34.57 971.51 760.95 12.3217401904 69.11 26.43 364.98 426.79 11.3817401905 125.47 617.50 1097.84 538.46 13.5017401906 121.72 33.52 735.21 515.05 12.5617401907 77.25 26.60 391.36 480.41 10.5317401908 86.43 21.02 833.50 541.47 10.96

Similar to rubies from other sources the trace elements Ti, V, Cr, Fe and Ga were found. Concentrations are shown in oxide %WT (Table 1), oxide ppmw (Table 2) and elemental ppma (Table 3). Analyses show that the samples have high Fe concentrations ranging from 430 to 1200 ppma, low V (up to 37 ppma with an exception of a sample that has 617.50 ppma) and low Ga (up to 13.50 ppma) content (Table 3). There is a wide variation in Cr content from 530 to 5200 ppma and this is reflected in the range of body color; from pink to intense red. Sample 716 has distinct color zoning of lighter and more saturated coloration (Figure 1). The two zones exhibit similar levels of Ti, V, Fe and Ga but a large different in Cr concentration (~1200 ppma) (Table 3).
Figure 5: Trace element population field (Ga and Fe).
Figure 6: Ratio of trace element population field (Ti/V and Fe/Ga).

Figure 7: Ratio of trace element population field (Fe/Ga and V/Cr).
It is sometimes useful to plot trace elements to see if any population fields appear. Examples of such plots appear in Figure 5, Figure 6 and Figure 7 and they appear to show a good separation of Aappaluttoq, Greenland rubies and pink sapphires from rubies from several other sources. For example Figure 5 demonstrates a population plot between Ga and Fe; it is clear that the samples cluster at the bottom due to lower Ga content relative to rubies from Vietnam and Tajikistan but are about the same level as rubies from Thailand, while the Fe concentration is shown to be higher than those from Burma and Tajikistan but lower than rubies from Thailand and Kenya. Some of the rubies from Vietnam are shown to have similar level of Fe as rubies from Aappaluttoq, Greenland.
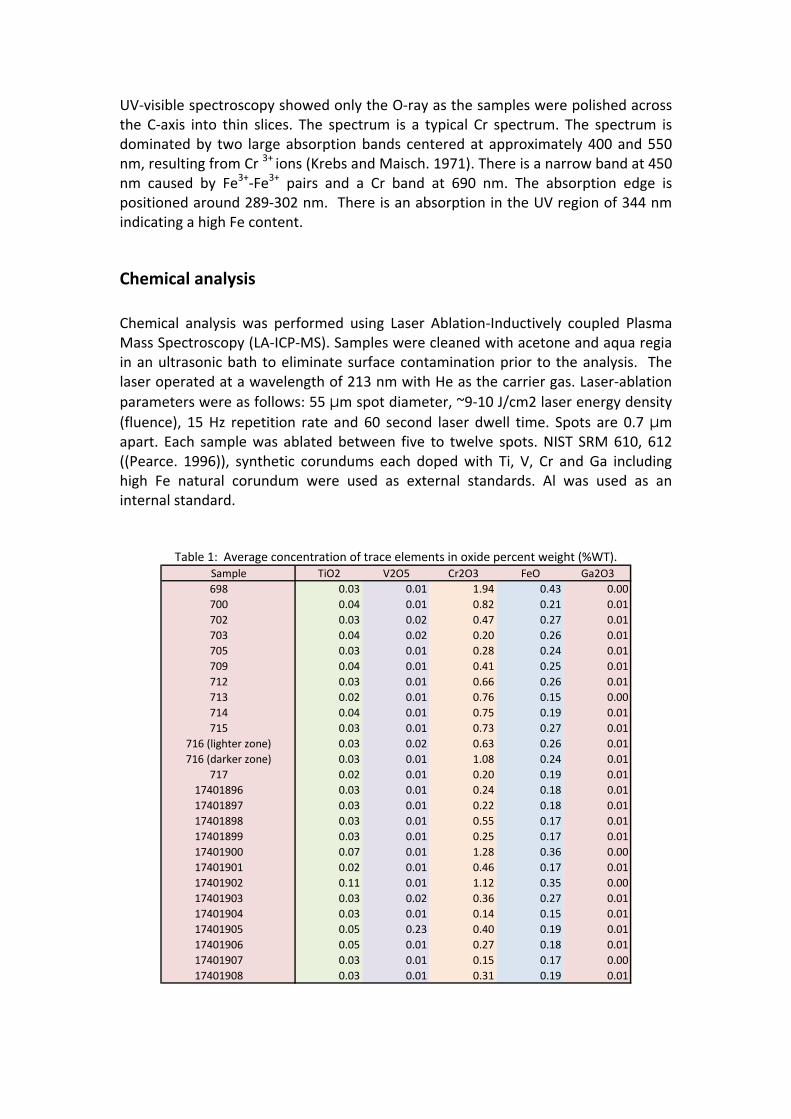
Inclusion suite Photomicrographs of inclusions were taken using Nikon SMZ 1500 system attached to a modified base of GIA Gem microscope and NIS‐Elements D 2.30 application. The photomicrographs were taken under dark‐field, bright‐field and oblique illumination. Inclusions were identified by Raman spectrometry. The minerals identified are bÖhmite, catapleiite, chlorite (Figure 13), cordierite ( ), corundum (Figure 10 Figure 11), cosalite, dolomite, feldspar, magnesite, margarite (Figure 8), mica (Figure 12), pargasite (Figure 14), pyroxene, rutile, sapphirine (Figure 11) and sillimanite (Figure 21). Other inclusions observed were iridescent fine needle‐like inclusions (possibly rutile), intersecting tubes, clouds of reflective thin films (Figure 18) and iridescent platelets. Many of the samples exhibited lamellar twinning, some with accompanying bÖhmite.
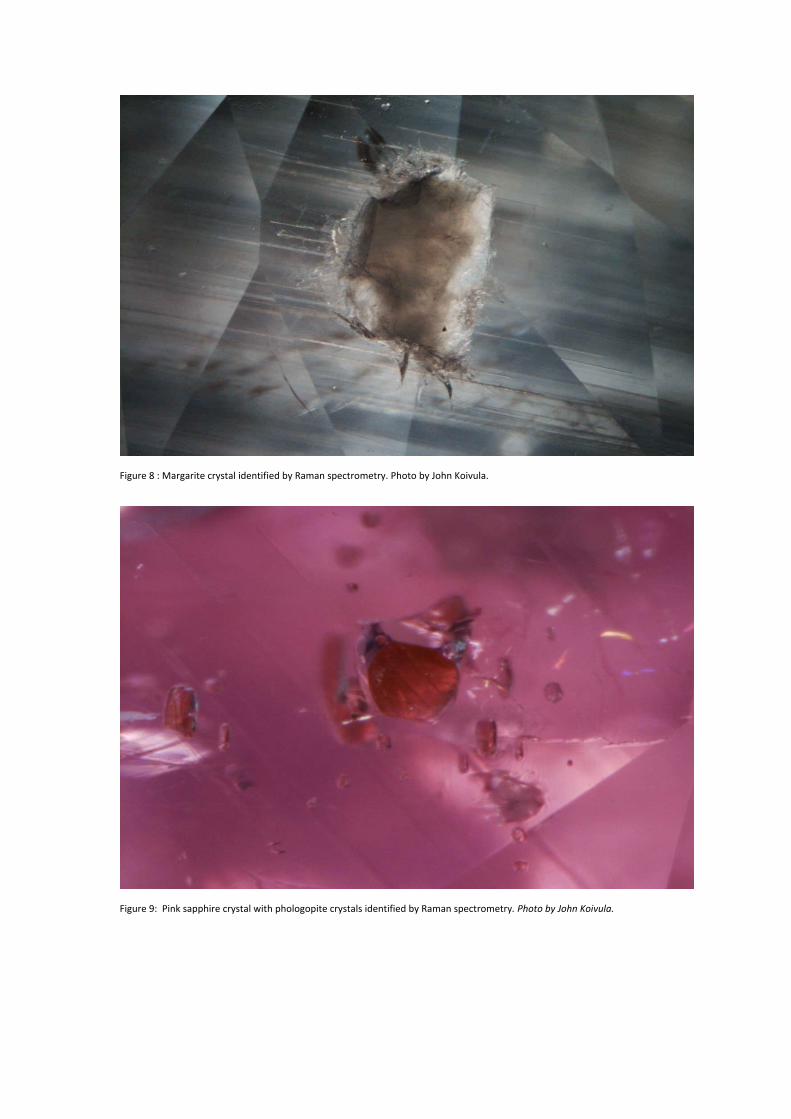
Figure 8 : Margarite crystal identified by Raman spectrometry. Photo by John Koivula.
Figure 9: Pink sapphire crystal with phologopite crystals identified by Raman spectrometry. Photo by John Koivula.

Figure 10: Cordierite crystal identified by Raman spectrometry. Photo by John Koivula
Figure 11: Sapphirine crystal identified by Raman spectrometry.

Figure 12: Mica crystal identified by Raman spectrometry.
Figure 13: Green chlorite crystals on one of the ruby samples identified by Raman spectrometry.
Figure 14: Pargasite crystal identified by Raman spectrometry.
Figure 15: Unidentified transparent crystal with basal cleavage planes

Figure 16 : Parallel separations (parting planes) within lamella twinning secments.
Figure 17 : Unidentified red rounded crystal and intersecting scaffold of acicular inclusions highlighting twin plane junctions.

Figure 18 Ovoid thin films.
Figure 19: Unidentified transparent rounded crystal

Figure 20: Unidentified crystals.
Figure 21: Sillimanite crystal identified by Raman spectroscopy

Figure 22: Iridescent platelets
Figure 23: Unidentified transparent rod‐like crystals.

Preliminary Discussion Examination of the rubies and pink sapphires from Aappaluttoq, Greenland showed that the samples are purplish pink to red in color with a specific gravity of 3.96 to 4.11. Fluorescence ranged from medium to strong red under LWUV and all were inert under SWUV. Some of the samples exhibited irregular pink to red color zoning. The samples are highly fractured and carry many included crystals. Raman spectroscopy of the cut‐through crystals revealed them to be minerals related to metamorphic origin. Samples contain kaolinite and bÖhmite. The presence of these two minerals is an indication that the samples were not subjected to heat treatment. The spectrum is a typical Cr spectrum with an absorption in the UV region indicates high Fe content. Chemistry analysis has shown that the samples have high Fe, low V and low Ga content. There is a wide variation in Cr content which is reflected in the pink to intense red color range of the samples. Population‐field plotting of trace elements shows a good separation of Aappaluttoq, Greenland rubies from rubies from many other sources.
Acknowledgements The author thanks True North Gems and John L. Emmett for the samples, Sudarat Saeseaw for LA‐ICP‐MS analysis, John Koivula for the photomicrograph of cordierite and margarite crystals. Additionally thanks are due to Kenneth Scarratt, Garry Du Toit, Nicholas Sturman and Vincent Pardieu for their suggestions in this study. With the collaboration of John L. Emmett and True North Gems, this study continues and once sufficient data has been collected and studied a joint paper will be published.

References
Secher, K. and Appet, P. (2007) Gemstones of Greenland, Geology and Ore: Exploration and mining in Greenland. 1‐12
Krebs, J. J. and Maisch, W. G. (1971) Exchange effects in the optica‐absorption spectrum of Fe3+ in Al2O3. Physical Review B. 4. 3. 757‐769
Pearce, N. J. G., Perkins, W.T., Westgate, J.A., Gorton, M.P., Jackson, S.E., Neal, C.R., Chenery, S.P. (1996) Application of new and published major and trace elements data for NIST SRM 610 and NIST SRM 612 glass reference materials. Geostandards Newsletter. 20 2. 115‐144
Further reading
Bank, H., Lenzen, G. and Henn, U. (1988) Laboratory notes. Gemmologie Aktuell. 2. 1‐3
Geisler, R. A. (1976) The ruby deposits at Fiskenaesset, Greenland. Canadian Gemmologist. 1. 2. 4
Goodger, W. D. (1976) Ruby with kornerupine and associated minerals from Greenland. Canadian Gemmologist. 1. 2. 2–3
Gübelin, E. J. (1979) Fiskenaesset: Rubinvorkommen auf Grönland. Lapis. 4. 3. 19–26
Gübelin, E. J. (1979) Fiskenässet Rubinvorkommen auf Grönland. Lapis. 4. 3. 19‐26
Petersen, O. V. and Secher, K. (1993) Minerals of Greenland. Mineralogical Record. 24. 2. 1‐65
Rivalenti, G. (1974) A ruby corundum pegmatoid in an area near Fiskenaesset, South‐west Greenland. Bolletino del Servizio Geologico d'Italia. 93. 23‐32