rtu science - riga technical university
TRANSCRIPT
RIGA TECHNICAL UNIVERSITY Faculty of Material Science and Applied Chemistry
Institute of Inorganic Chemistry
Liene Plūduma Doctoral Student of the Doctoral Study Programme “Material Science”
HYDROXYL ION QUANTIFICATION IN HYDROXYAPATITE AND THE EFFECT
ON THE BIOLOGICAL RESPONSE
Summary of the Doctoral Thesis
Scientific Supervisor Assoc. Professor Dr. sc. ing.
KĀRLIS AGRIS GROSS
RTU Press Riga 2017
2
Plūduma L. Hydroxyl Ion Quantification in Hydroxyapatite and the Effect on the Biological Response. Summary of the Doctoral Thesis. – Riga: RTU Press, 2017. – 34 p.
Printed according to the Decision of the Promotion Council of RTU, P-18 of May 31, 2017, Minutes No. 5.
This work has been partly supported by the European Social Fund within the project “Support for the implementation of doctoral studies at Riga Technical University”.
ISBN 978-9934-10-975-1
3
THE DOCTORAL THESIS PROPOSED TO RIGA TECHNICAL UNIVERSITY FOR THE PROMOTION TO THE
SCIENTIFIC DEGREE OF DOCTOR OF ENGINEERING SCIENCES
To be granted the scientific degree of Doctor of Engineering Sciences, the present Doctoral Thesis has been submitted for the defense at the open meeting of RTU Promotion Council on September 29, 2017, 15:00 at the Faculty of Materials Science and Applied Chemistry of Riga Technical University, Paula Valdena iela 3, Room 272. OFFICIAL REVIEWERS
Dr. sc. ing. Dagnija Loča Riga Technical University Dr. biol. Inese Čakstiņa Riga Stradins University Professor Dr. habil. Aivaras Kareiva Vilnius University, Lithuania
DECLARATION OF ACADEMIC INTEGRITY
I hereby declare that the Doctoral Thesis submitted for the review to Riga Technical University for the promotion to the scientific degree of Doctor of Engineering Sciences is my own and does not contain any unacknowledged material from any source. I confirm that this Doctoral Thesis has not been submitted to any other university for the promotion to other scientific degree.
Liene Plūduma ……………………………. Date: ………………………
The Doctoral Thesis has been written in English. It consists of an introduction, 3 chapters,
a conclusion, 46 figures, 16 tables, and 8 appendices. The total volume of the Thesis is 134 pages. The bibliography contains 193 reference sources.
4
ACKNOWLEDGMENTS
I wish to express my sincere gratitude to Prof. Christian Rey from National Polytechnic Institute of Toulouse for his guidance and stimulating discussions. Working in his laboratory gave me the opportunity not only to access the equipment but also to get deeper understanding about the techniques. Thank you for making me welcome and helping me to see the light at the end of the tunnel.
I am deeply grateful to Prof. David Haynes from the University of Adelaide, Medical School, for the opportunity to work with his research group and learn many new skills in the cell and molecular biology. I also wish to thank the rest of the Bone and Joint Laboratory for their friendship and support. A special thanks goes to Kent Algate for explaining everything to me so clearly and answering my silly questions.
I am also very grateful to Prof. Petri Vuoristo from Tampere University of Technology for welcoming me in his laboratory and providing all necessary tools for making the coatings. I would like to express my appreciation to Dr. Heli Koivuluoto and Mikko Kylmälahti for putting up with a long and intense work hours during my visits.
This work would not have been possible without the amazing support from the University of Latvia, especially Prof. Arturs Vīksna for the unlimited access to Fourier transform infrared spectroscopy, as well as for providing me with the inductively coupled plasma mass spectrometry results. I wish to thank Prof. Andris Actiņš and his research group for the access to X-ray diffraction and technical support. I am also thankful to Prof. Arnolds Ūbelis for the training and consultations about the vacuum furnace, and Aleksandrs Kapralovs for making glass components for my experiments in vacuum.
I would also like to thank Prof. Remigijus Juškėnas from Vilnius University for performing grazing angle X-ray diffraction, and Dr. Gundars Lācis from the Clinical Centre “Gaiļezers” for sterilization of the coatings.
I wish to thank my friendly colleagues from Riga Technical University, especially Astrīda Bērziņa for all the late evenings and early mornings at Raman spectrometer, Edijs Freimanis for setting up the polarization furnace and performing Kelvin Probe measurements, Aija Krūmiņa for analyzing some of the samples with X-ray diffraction, Jānis Lungevičs for performing profilometric analysis of the coatings, Agnese Brangule for showing the importance of the deconvolution, and Laura Komarovska and Elīna Rozīte for the cell counts.
My sincere thanks go to my supervisor Assoc. Prof. Kārlis A. Gross for the opportunities he has given to me over the last five years and for introducing me to the right people.
I wish to mention that this work is a partial continuation from my Master’s thesis, which was completed at RTU Rudolfs Cimdins Riga Biomaterials Innovation and Development Centre. Few initial results were supplemented by additional experiments and deeper analysis.
This study was partially supported by the European Social Fund, European Union Student Exchange Program, and the European Council Seventh Framework Program.
I am also very thankful to everyone who motivated me to finally finish my long journey, especially to my family, the Shearer clan, and Nick.
5
CONTENTS ACKNOWLEDGMENTS .......................................................................................................... 4
ABBREVIATIONS .................................................................................................................... 6
1. GENERAL DESCRIPTION OF THE THESIS ..................................................................... 7
1.1. Introduction ..................................................................................................................... 7
1.2. Aim .................................................................................................................................. 8
1.3. Tasks ................................................................................................................................ 8
1.4. Thesis statements to be defended .................................................................................... 8
1.5. Scientific novelty ............................................................................................................. 9
1.6. Practical significance ....................................................................................................... 9
2. SUMMARY OF THE LITERATURE REVIEW .................................................................. 9
3. MATERIALS AND METHODS ......................................................................................... 10
4. MAIN RESULTS OF THE THESIS ................................................................................... 11
4.1. PART 1 Measurement of the hydroxyl ion content in hydroxyapatite ......................... 11
Preparation of standard hydroxyapatite ............................................................................ 11
Thermal gravimetric analysis ........................................................................................... 13
Fourier transform infrared spectroscopy .......................................................................... 16
Raman spectroscopy ......................................................................................................... 22
Guidelines for the quantification of hydroxyl ions in hydroxyapatite ............................. 23
4.2. PART 2 Influence of the hydroxyl ion content on the biological response of the hydroxyapatite coatings ........................................................................................................ 25
Preparation and characterization of hydroxyapatite coatings .......................................... 25
Evaluation of the biological properties of hydroxyapatite coatings ................................. 27
CONCLUSIONS ...................................................................................................................... 31
REFERENCES ......................................................................................................................... 32
APPROBATION OF THE THESIS ........................................................................................ 33
6
ABBREVIATIONS
AFM atomic force microscope a.u. arbitrary unit CaF2 calcium fluoride cHA conventional hydroxyapatite coating Col1a1 collagen type I CPP calcium pyrophosphate c.p.s. counts per second DAPI 4',6-diamidino-2-phenylindole EU European Union FA fluorapatite FTIR Fourier transform infrared spectroscopy GAPDH glyceraldehyde-3-phosphate dehydrogenase HA hydroxyapatite HA_v6 standard hydroxyapatite heated in vacuum at 1000 °C for 20 h HA_v8 standard hydroxyapatite heated in vacuum at 1000 °C for 48 h ht-cHA hydrothermally processed hydroxyapatite coating ICDD International Centre for Diffraction Data ICP-MS inductively coupled plasma mass spectrometry KBr potassium bromide OAp oxyapatite OCN osteocalcin OH− hydroxyl ions OHA oxyhydroxyapatite OPN osteopontin PO4
3− phosphate ions PCR polymerase chain reaction P-value probability value RSD relative standard deviation RUNx2 runt-related transcription factor 2 SEM scanning electron microscope STDEV standard deviation TCP tricalcium phosphate TGA thermal gravimetric analysis TTCP tetracalcium phosphate wt% weight percent XRD X-ray diffraction α-TCP α-tricalcium phosphate β-TCP β-tricalcium phosphate
7
1. GENERAL DESCRIPTION OF THE THESIS
1.1. Introduction
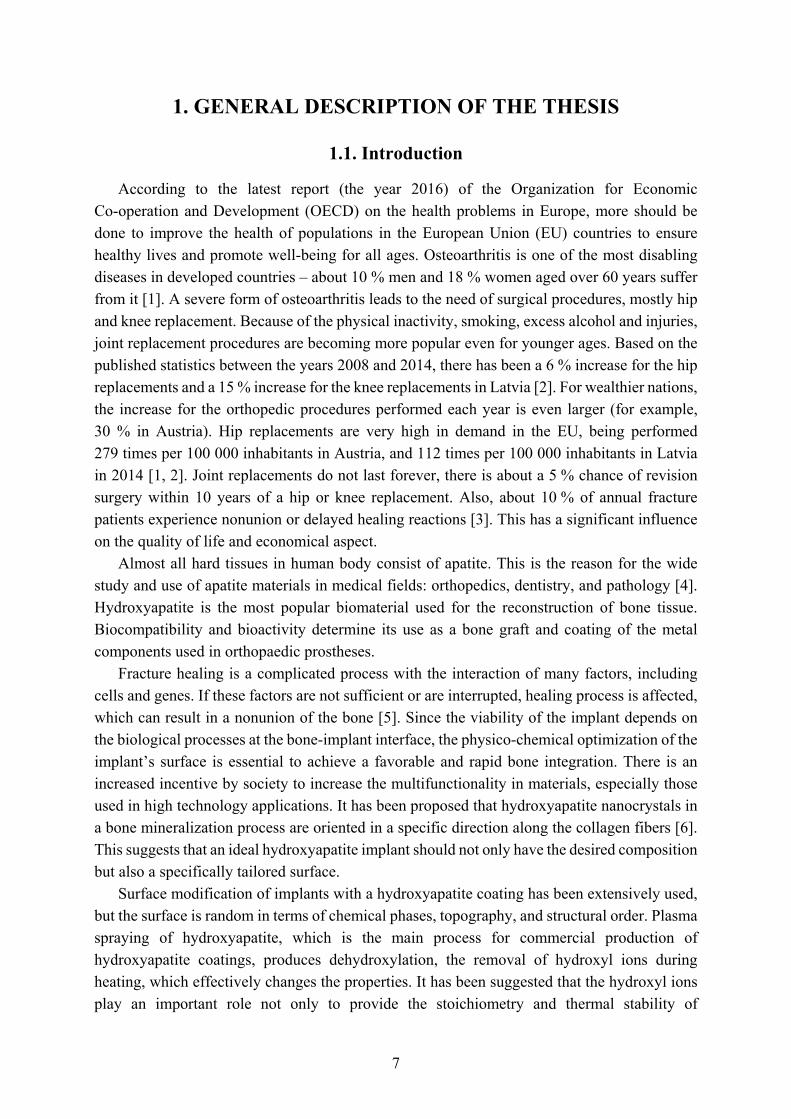
According to the latest report (the year 2016) of the Organization for Economic Co-operation and Development (OECD) on the health problems in Europe, more should be done to improve the health of populations in the European Union (EU) countries to ensure healthy lives and promote well-being for all ages. Osteoarthritis is one of the most disabling diseases in developed countries – about 10 % men and 18 % women aged over 60 years suffer from it [1]. A severe form of osteoarthritis leads to the need of surgical procedures, mostly hip and knee replacement. Because of the physical inactivity, smoking, excess alcohol and injuries, joint replacement procedures are becoming more popular even for younger ages. Based on the published statistics between the years 2008 and 2014, there has been a 6 % increase for the hip replacements and a 15 % increase for the knee replacements in Latvia [2]. For wealthier nations, the increase for the orthopedic procedures performed each year is even larger (for example, 30 % in Austria). Hip replacements are very high in demand in the EU, being performed 279 times per 100 000 inhabitants in Austria, and 112 times per 100 000 inhabitants in Latvia in 2014 [1, 2]. Joint replacements do not last forever, there is about a 5 % chance of revision surgery within 10 years of a hip or knee replacement. Also, about 10 % of annual fracture patients experience nonunion or delayed healing reactions [3]. This has a significant influence on the quality of life and economical aspect.
Almost all hard tissues in human body consist of apatite. This is the reason for the wide study and use of apatite materials in medical fields: orthopedics, dentistry, and pathology [4]. Hydroxyapatite is the most popular biomaterial used for the reconstruction of bone tissue. Biocompatibility and bioactivity determine its use as a bone graft and coating of the metal components used in orthopaedic prostheses.
Fracture healing is a complicated process with the interaction of many factors, including cells and genes. If these factors are not sufficient or are interrupted, healing process is affected, which can result in a nonunion of the bone [5]. Since the viability of the implant depends on the biological processes at the bone-implant interface, the physico-chemical optimization of the implant’s surface is essential to achieve a favorable and rapid bone integration. There is an increased incentive by society to increase the multifunctionality in materials, especially those used in high technology applications. It has been proposed that hydroxyapatite nanocrystals in a bone mineralization process are oriented in a specific direction along the collagen fibers [6]. This suggests that an ideal hydroxyapatite implant should not only have the desired composition but also a specifically tailored surface.
Surface modification of implants with a hydroxyapatite coating has been extensively used, but the surface is random in terms of chemical phases, topography, and structural order. Plasma spraying of hydroxyapatite, which is the main process for commercial production of hydroxyapatite coatings, produces dehydroxylation, the removal of hydroxyl ions during heating, which effectively changes the properties. It has been suggested that the hydroxyl ions play an important role not only to provide the stoichiometry and thermal stability of
8
hydroxyapatite but also to produce a surface charge [7]. The clear effect on material properties and the biological response has not been determined due to the absence of a suitable technique for hydroxyl ion measurement.
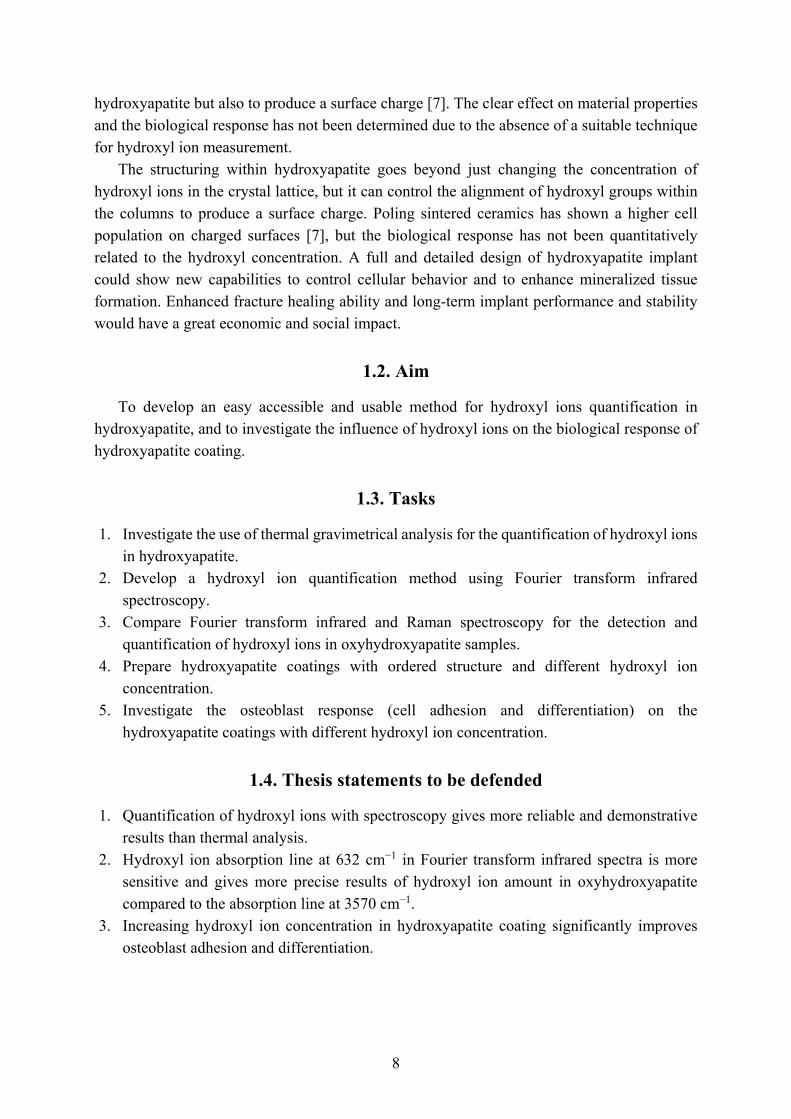
The structuring within hydroxyapatite goes beyond just changing the concentration of hydroxyl ions in the crystal lattice, but it can control the alignment of hydroxyl groups within the columns to produce a surface charge. Poling sintered ceramics has shown a higher cell population on charged surfaces [7], but the biological response has not been quantitatively related to the hydroxyl concentration. A full and detailed design of hydroxyapatite implant could show new capabilities to control cellular behavior and to enhance mineralized tissue formation. Enhanced fracture healing ability and long-term implant performance and stability would have a great economic and social impact.
1.2. Aim
To develop an easy accessible and usable method for hydroxyl ions quantification in hydroxyapatite, and to investigate the influence of hydroxyl ions on the biological response of hydroxyapatite coating.
1.3. Tasks
1. Investigate the use of thermal gravimetrical analysis for the quantification of hydroxyl ions in hydroxyapatite.
2. Develop a hydroxyl ion quantification method using Fourier transform infrared spectroscopy.
3. Compare Fourier transform infrared and Raman spectroscopy for the detection and quantification of hydroxyl ions in oxyhydroxyapatite samples.
4. Prepare hydroxyapatite coatings with ordered structure and different hydroxyl ion concentration.
5. Investigate the osteoblast response (cell adhesion and differentiation) on the hydroxyapatite coatings with different hydroxyl ion concentration.
1.4. Thesis statements to be defended
1. Quantification of hydroxyl ions with spectroscopy gives more reliable and demonstrative results than thermal analysis.
2. Hydroxyl ion absorption line at 632 cm−1 in Fourier transform infrared spectra is more sensitive and gives more precise results of hydroxyl ion amount in oxyhydroxyapatite compared to the absorption line at 3570 cm−1.
3. Increasing hydroxyl ion concentration in hydroxyapatite coating significantly improves osteoblast adhesion and differentiation.
9
1.5. Scientific novelty
1. An easy-to-use method has been developed for the quantification of hydroxyl ions. Guidelines are provided for quantifying the hydroxyl ion content by Fourier transform infrared spectroscopy, Raman spectroscopy, and thermal analysis.
2. The hydroxyl ion content in hydroxyapatite coatings can be used to change the electrical potential and the resulting osteoblast cell response.
1.6. Practical significance
1. An improved quality control method for hydroxyapatite implant materials. 2. Fourier transform infrared spectroscopy is a better hydroxyl ion detection and
quantification tool compared to Raman spectroscopy and thermal analysis. 3. Identification of spectral peak that provides a more reliable indicator of the hydroxyl
content. 4. Small variations in the hydroxyl ion content of hydroxyapatite lead to a noticeable effect
on the in-vitro osteoblast cell response.
2. SUMMARY OF THE LITERATURE REVIEW
Looking at bone at its molecular level, it has been shown that the main mineral component of bone is hydroxyapatite (Ca10(PO4)6(OH)2). This knowledge makes it very attractive to bone substitute researchers. HA as a bone implant material has been studied for many decades, but as for a very complex system, its full potential has not been discovered yet.
The structure of HA supports many different variations in the form of substitutions, inclusions, defects, etc., which makes it possible to vary HA properties in a wide range. Hydroxyl ions in the HA structure are placed in 0.30–0.35-wide channels along c-axis, usually organized as …O-H O-H O-H… columns, and they enable thermal stability of stoichiometric HA even until 1400 °C, improve the structure and surface properties of HA coatings, and might even have a positive effect on the biological response of HA biomaterials. But the amount of OH− in HA is not constant and can change in a wide range: while stoichiometric HA has 100 % OH− in its structure, oxyapatite contains no hydroxyl ions. The main reasons that influence the amount of OH− in HA are ion substitution or incorporation in the structure, crystallite size, and thermal treatment.
For full characterization of apatite, a measurement of two atomic ratios is required: Ca/P and OH/P; however, mostly only the Ca/P ratio is considered. Main reason for that is the lack of easy-to-use method for the determination of OH− content. There have been attempts to quantify the OH− in apatite by different techniques, but the poor explanations of the use of the method, long and complicated procedures, or not easily accessible equipment are the main reasons why the amount of hydroxyl ions is being rarely described. Chemical analyses for the determination of OH− are very long and complicated; also, they cannot be used with a sufficient accuracy, which is why physical techniques are more attractive. Nuclear magnetic resonance is being used to detect the hydroxyl ions in biological apatites, but this method has been described
10
as time consuming and there might be difficulty to distinguish between the signals arising from OH− and water. Several other less traditional methods as X-ray photoelectron spectroscopy, secondary ion mass spectrometry, elastic recoil detection, etc., have also been used, but in order to develop a method that is easy to access and easy to use, in this study conventional methods as thermal analysis, Fourier transform infrared, and Raman spectroscopy were chosen.
Thermal gravimetric analysis can indicate the OH− ion concentration from water loss by heating hydroxyapatite or in a thermal reaction that encourages the release of water at lower temperatures. Spectroscopy allows direct identification of the presence of OH− from the absorption or vibration line. Quantitative analysis requires a calibration curve made from the samples with known OH− content. This requires a sample with the maximum possible OH− content and another sample without OH−.
Because of the low mechanical properties of hydroxyapatite, it cannot be used as a load-bearing implant but it is widely used as a coating on metal (usually Co-Cr alloys or Ti and its alloys) implants. Thermal sprayed HA coatings are widely used in commercial applications, but due to the high temperature, OH− depletion, amorphous phase formation or even partial decomposition can occur. It results in higher dissolution rate and may lead to decrease in the microstructural homogeneity, and poorer mechanical properties. In order to improve the bioactivity, various post-treatments have been studied. Hydrothermal process not only restores the depleted hydroxyl ions but also improves crystallinity, decreases the amount of unstable decomposition phases, and improves the microstructure of the coating. It has also been shown that the surface charge has improved implant fixation by promoting protein adhesion and increased cell activity thereby forming more bone.
This study investigated the role of hydroxyl ion concentration of hydroxyapatite coating on the primary human-derived osteoblast adhesion, proliferation, and bone-related gene expressions. In order to maximize the influence of hydroxyl ions and exclude the interference of some random effects, all coatings were designed to have the highest level of structural order: crystals were aligned during the production of coatings, and OH− were oriented by polarization.
3. MATERIALS AND METHODS
Hydroxyapatite powder was prepared using wet chemical precipitation method by neutralizing a calcium nitrate solution with ammonium hydrogen phosphate solution and ammonium hydroxide solution. The synthesized apatite powder was heated at 1000 °C for 15 h in water vapor to provide a high concentration of hydroxyl ions. Hereafter, the heat-treated hydroxyapatite powder is referred as the “standard hydroxyapatite”.
Standard hydroxyapatite and commercial fluorapatite (Sulzer Metco) was used to prepare mechanical mixtures for the calibration curve. Samples were weighted to an accuracy of ±0.0001 g and mixed in a mortar for about 15–20 min to obtain an intimate mixture.
In order to remove hydroxyl ions from the structure, standard hydroxyapatite was heat-treated in vacuum (1.3 × 10⁻⁴ Pa) at 1000 °C for 20 or 43 hours. To prepare samples with different amounts of hydroxyl ions, the rehydroxylation of oxyhydroxyapatite produced in vacuum at 1000 °C for 43 h was performed. Thermal gravimetric equipment with a setup of
11
90 % humidity and gas flow of 10 ml/min was used. Sample was heated until 350, 400, or 700 °C with a heating rate of 5 °/min for 30 minutes (350, 400, and 700 °C) and 1 h (400 °C).
Impurities in the standard HA were detected by inductively coupled plasma mass spectrometry; calcium and phosphorous were determined by atomic absorption spectroscopy and spectrophotometry, respectively. Crystalline phases were analyzed by X-ray diffraction; functional groups were determined by Fourier transform infrared spectroscopy. Thermal gravimetric analysis, FTIR and Raman spectroscopy were used to quantify the hydroxyl groups.
Hydroxyapatite coatings were produced by flame spray process using commercial HA powder (particle size of 20–40 µm). Commercially pure (grade 1) titanium substrates (12 mm diameter discs, grit blasted with Al2O3) were positioned 12 cm from the torch and preheated to 250 °C. Half of the HA coatings were subjected to hydrothermal post-treatment in water vapour for 20 h at 200 °C. To ensure the alignment of hydroxyl ions, all coatings were polarized in a strong electric field (5 kV/cm) at 400 °C for 3 h. HA coatings were characterized by XRD, FTIR, Kelvin probe AFM, SEM, and profilometry methods.
In-vitro study involved three donors of normal human bone-derived osteoblasts (passage 4) cultured on HA coatings for 1 day, 1 week, and 2 weeks. Cell morphology, attachment, growth and spreading on a material were assessed by SEM imaging after 1-day and 14-day incubation. To visualize nuclei and the actin cytoskeleton, samples were subjected to staining with 4',6-diamidino-2-phenylindole (DAPI) and phalloidin after incubation for 1 and 14 days. Fifteen representative images were taken for each material (three donors, five images per donor). Quantitative real-time PCR was performed to compare the expression levels of cDNA for specific osteoblast genes in cells grown on the HA coatings for 7 and 14 days. The expression of the specific genes encoding osteoblast-related proteins – collagen type I (Col1a1), runt-related transcription factor 2 (RUNx2), osteocalcin (OCN), and osteopontin (OPN) – was compared between the different samples.
4. MAIN RESULTS OF THE THESIS
4.1. PART 1 Measurement of the hydroxyl ion content in hydroxyapatite
Preparation of standard hydroxyapatite To measure hydroxyl ion concentration, a standard hydroxyapatite is required. A wet
chemical precipitation method was used to obtain HA because of its simplicity, relatively inexpensive raw materials, good repeatability, and accessibility to equipment. Analytical grade reagents were chosen to avoid inclusion of unnecessary cations. To prevent calcium deficiency, stoichiometric calcium and phosphate amounts were used, and a high wet-synthesis reaction temperature prevented carbonate inclusion, thereby allocating crystallographic sites for hydroxyl ion inclusion. High reaction temperature also increased the crystal size and the structural order, thereby establishing crystallographic sites for a more defect-free structure. To prepare standard hydroxyapatite with maximum quantity of hydroxyl groups in its structure, water vapor was directly supplied into the furnace during heating. Hereafter, the heat-treated hydroxyapatite is referred as the “standard hydroxyapatite”.
12
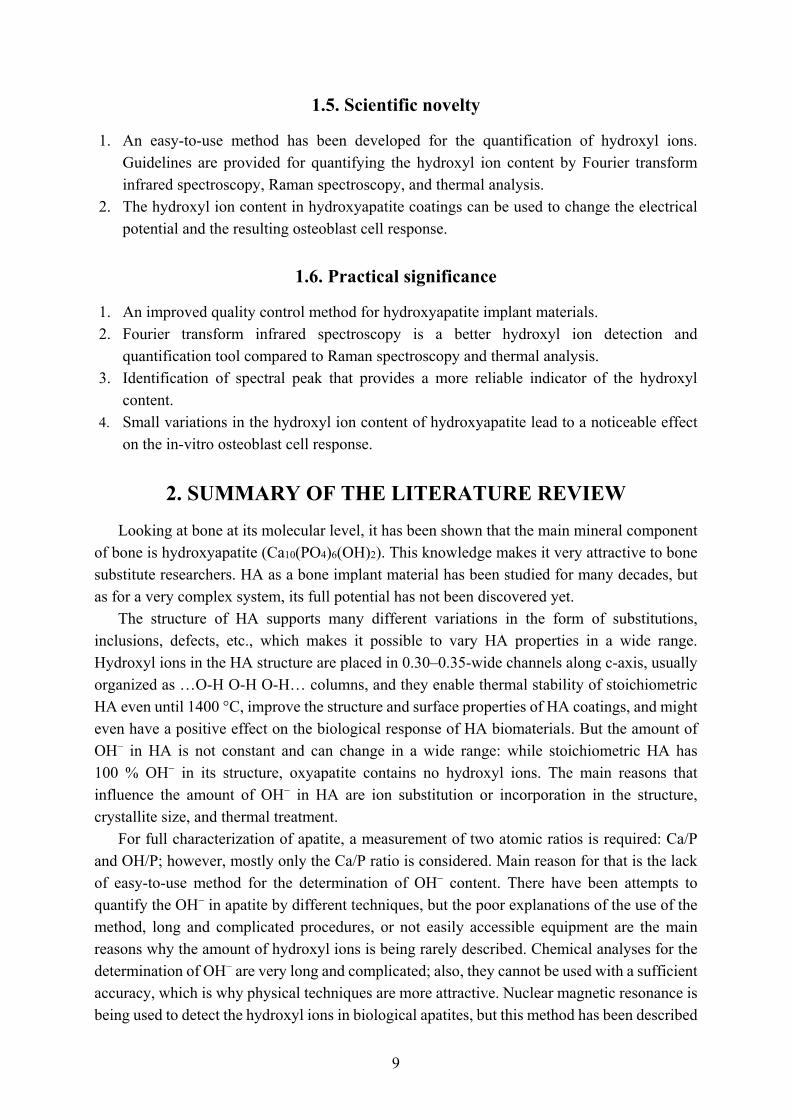
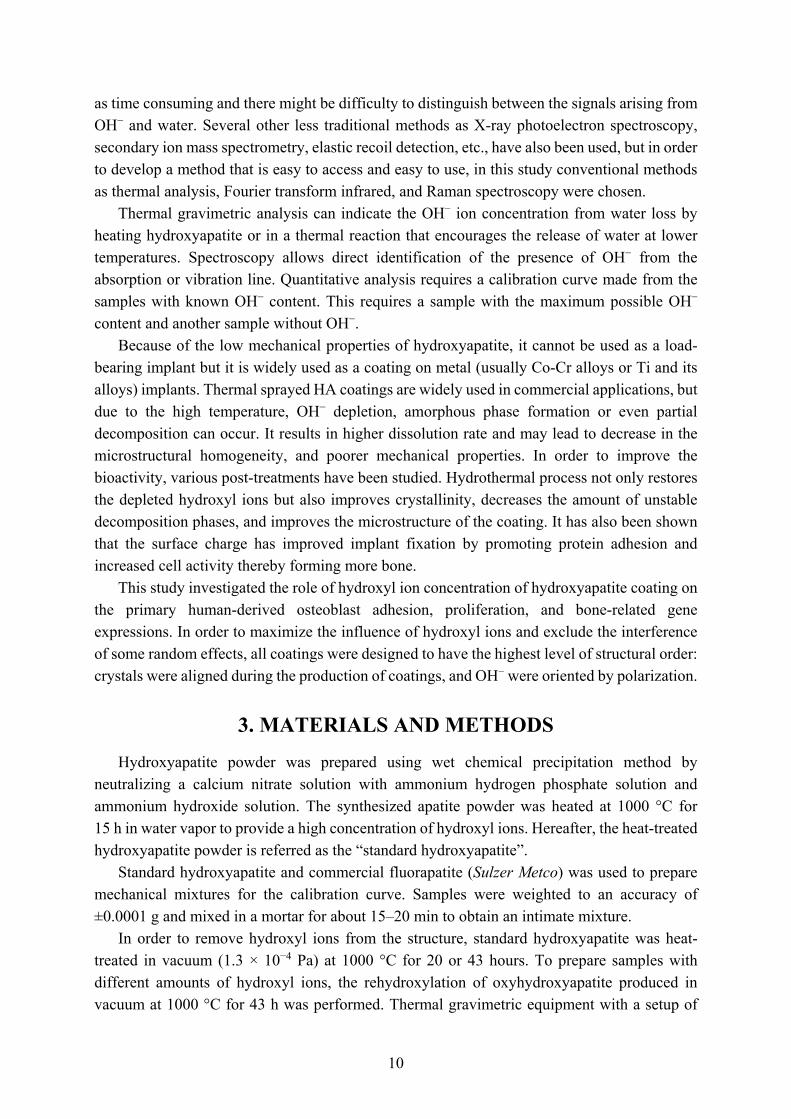
To determine the phase composition of the standard hydroxyapatite, X-ray diffraction was used. The results showed highly crystalline apatite – according to ICDD database all diffraction maximums corresponded to hydroxyapatite phase (Fig. 4.1). The structure of obtained HA was also studied with FTIR spectroscopy. All vibrations of functional groups displayed in the spectra were characteristic to hydroxyapatite phase (Fig. 4.2). Spectra showed a clear hydroxyl vibration peak, at both 631 cm−1 and 3573 cm−1.
Fig. 4.1. XRD pattern of the standard hydroxyapatite.
Fig. 4.2. FTIR spectra of the standard hydroxyapatite.
The measured Ca/P molar ratio was 1.66. ICP-MS results (listed in Table 4.1.) showed a concentration of microelements in the standard hydroxyapatite. Concentration for all impurities detected was smaller than the maximum allowed limit according to the ISO13779-1:2008(E) standard [8].
0
2000
4000
6000
10 15 20 25 30 35 40 45 50 55
Inte
nsity
, c.
p.s.
2 Theta, °
0.0
0.4
0.8
1.2
400100016002200280034004000
Abs
orba
nce,
a.u
.
Wave number, cm−1
13
The obtained standard hydroxyapatite was used for further experiments to develop a method for measuring the quantity of hydroxyl groups in the apatite. Based on the results mentioned above, it is proved that this material is pure, stoichiometric hydroxyapatite.
Table 4.1.
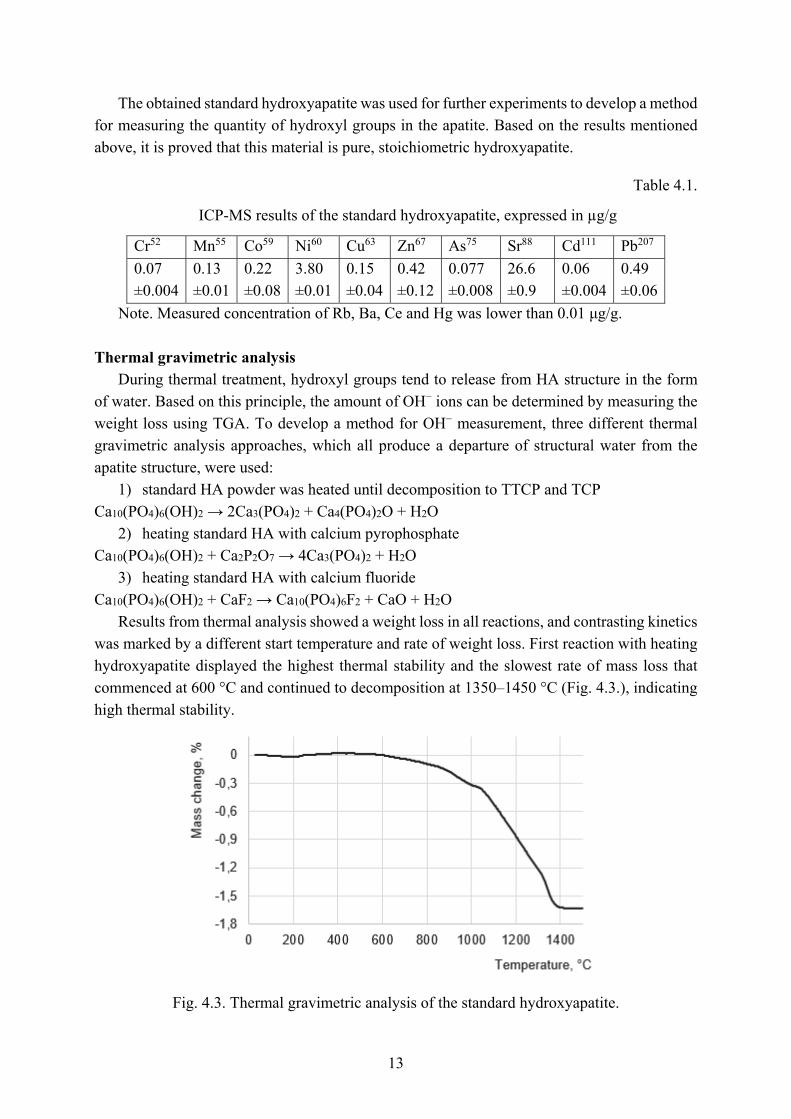
ICP-MS results of the standard hydroxyapatite, expressed in µg/g
Cr52 Mn55 Co59 Ni60 Cu63 Zn67 As75 Sr88 Cd111 Pb207
0.07 ±0.004
0.13 ±0.01
0.22 ±0.08
3.80 ±0.01
0.15 ±0.04
0.42 ±0.12
0.077 ±0.008
26.6 ±0.9
0.06 ±0.004
0.49 ±0.06
Note. Measured concentration of Rb, Ba, Ce and Hg was lower than 0.01 μg/g.
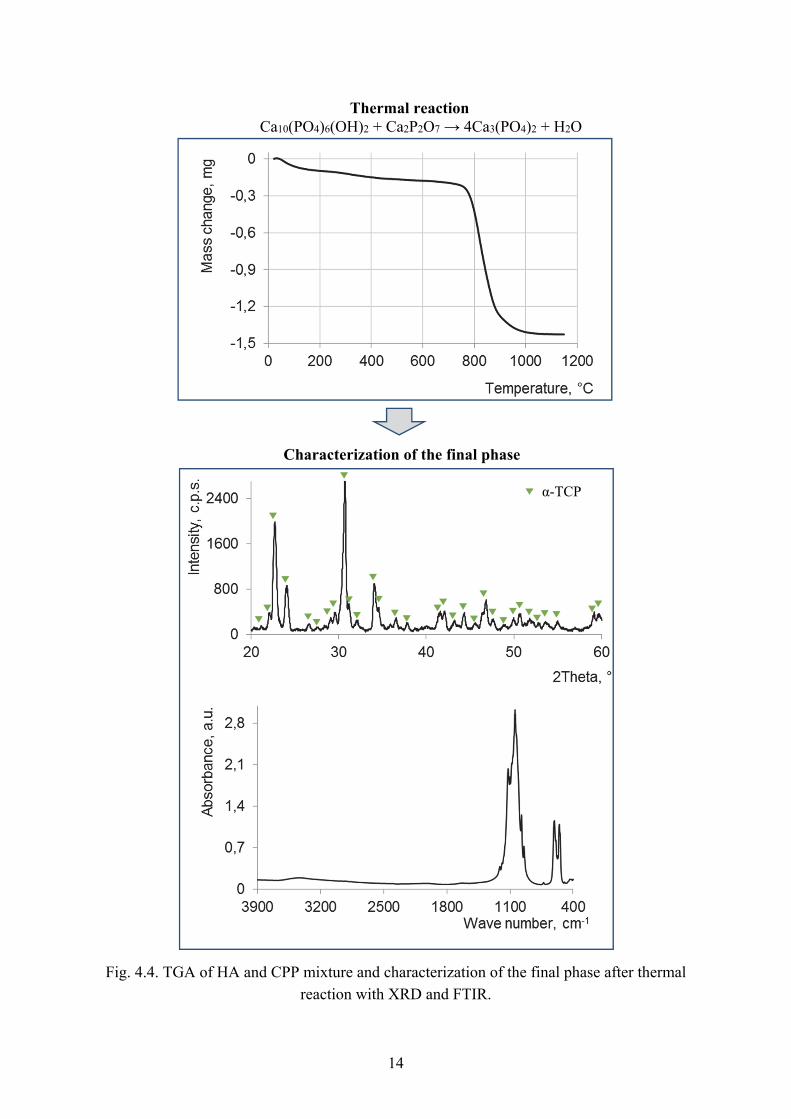
Thermal gravimetric analysis During thermal treatment, hydroxyl groups tend to release from HA structure in the form
of water. Based on this principle, the amount of OH− ions can be determined by measuring the weight loss using TGA. To develop a method for OH− measurement, three different thermal gravimetric analysis approaches, which all produce a departure of structural water from the apatite structure, were used:
1) standard HA powder was heated until decomposition to TTCP and TCP Ca10(PO4)6(OH)2 → 2Ca3(PO4)2 + Ca4(PO4)2O + H2O
2) heating standard HA with calcium pyrophosphate Ca10(PO4)6(OH)2 + Ca2P2O7 → 4Ca3(PO4)2 + H2O
3) heating standard HA with calcium fluoride Ca10(PO4)6(OH)2 + CaF2 → Ca10(PO4)6F2 + CaO + H2O
Results from thermal analysis showed a weight loss in all reactions, and contrasting kinetics was marked by a different start temperature and rate of weight loss. First reaction with heating hydroxyapatite displayed the highest thermal stability and the slowest rate of mass loss that commenced at 600 °C and continued to decomposition at 1350–1450 °C (Fig. 4.3.), indicating high thermal stability.
Fig. 4.3. Thermal gravimetric analysis of the standard hydroxyapatite.
14
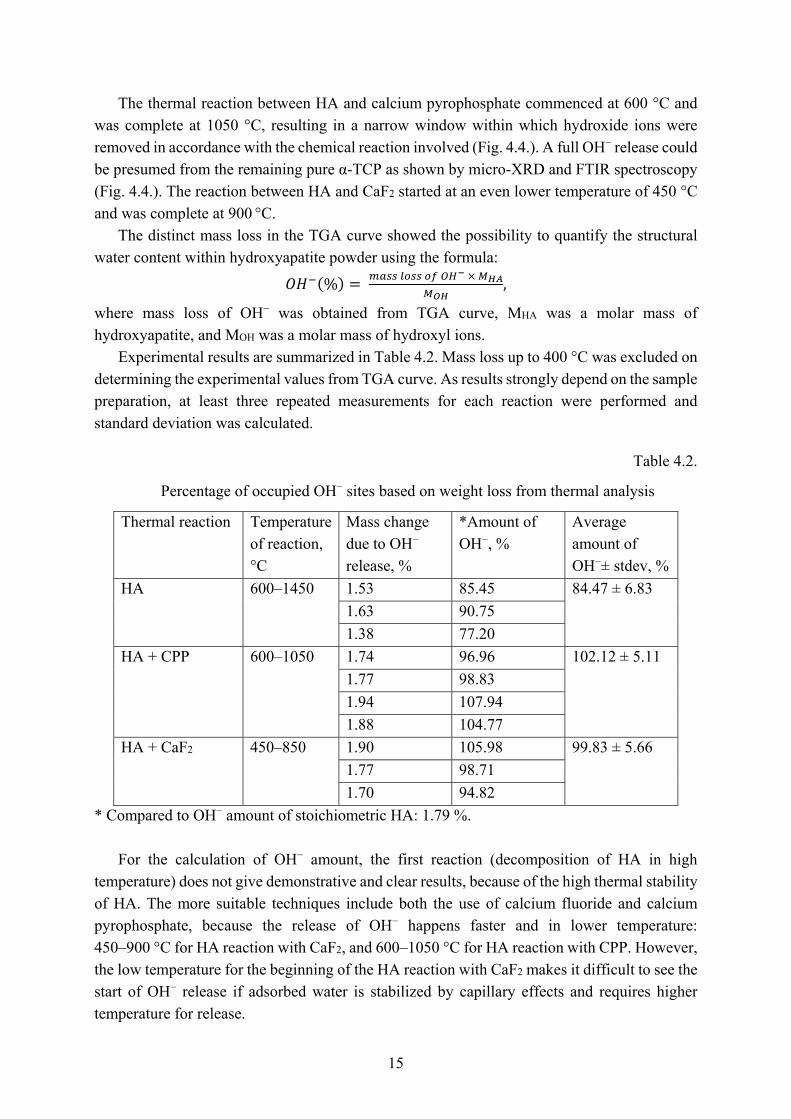
Fig. 4.4. TGA of HA and CPP mixture and characterization of the final phase after thermal reaction with XRD and FTIR.
Characterization of the final phase
α-TCP
Thermal reaction Ca10(PO4)6(OH)2 + Ca2P2O7 → 4Ca3(PO4)2 + H2O
15
The thermal reaction between HA and calcium pyrophosphate commenced at 600 °C and was complete at 1050 °C, resulting in a narrow window within which hydroxide ions were removed in accordance with the chemical reaction involved (Fig. 4.4.). A full OH− release could be presumed from the remaining pure α-TCP as shown by micro-XRD and FTIR spectroscopy (Fig. 4.4.). The reaction between HA and CaF2 started at an even lower temperature of 450 °C and was complete at 900 °C.
The distinct mass loss in the TGA curve showed the possibility to quantify the structural water content within hydroxyapatite powder using the formula:
% ,
where mass loss of OH− was obtained from TGA curve, MHA was a molar mass of hydroxyapatite, and MOH was a molar mass of hydroxyl ions.
Experimental results are summarized in Table 4.2. Mass loss up to 400 °C was excluded on determining the experimental values from TGA curve. As results strongly depend on the sample preparation, at least three repeated measurements for each reaction were performed and standard deviation was calculated.
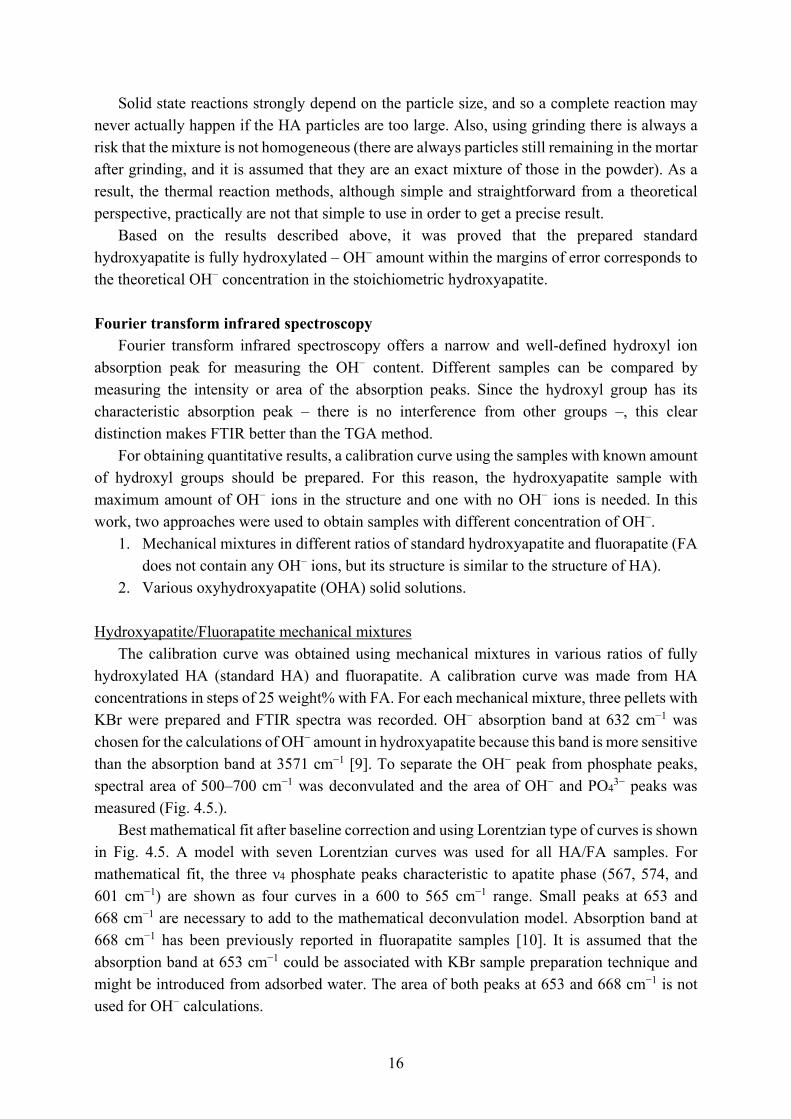
Table 4.2.
Percentage of occupied OH− sites based on weight loss from thermal analysis
Thermal reaction Temperature of reaction, °C
Mass change due to OH− release, %
*Amount of OH−, %
Average amount of OH−± stdev, %
HA 600–1450 1.53 85.45 84.47 ± 6.83
1.63 90.75
1.38 77.20
HA + CPP 600–1050 1.74 96.96 102.12 ± 5.11
1.77 98.83
1.94 107.94
1.88 104.77
HA + CaF2 450–850 1.90 105.98 99.83 ± 5.66
1.77 98.71
1.70 94.82
* Compared to OH− amount of stoichiometric HA: 1.79 %. For the calculation of OH− amount, the first reaction (decomposition of HA in high
temperature) does not give demonstrative and clear results, because of the high thermal stability of HA. The more suitable techniques include both the use of calcium fluoride and calcium pyrophosphate, because the release of OH− happens faster and in lower temperature: 450–900 °C for HA reaction with CaF2, and 600–1050 °C for HA reaction with CPP. However, the low temperature for the beginning of the HA reaction with CaF2 makes it difficult to see the start of OH− release if adsorbed water is stabilized by capillary effects and requires higher temperature for release.
16
Solid state reactions strongly depend on the particle size, and so a complete reaction may never actually happen if the HA particles are too large. Also, using grinding there is always a risk that the mixture is not homogeneous (there are always particles still remaining in the mortar after grinding, and it is assumed that they are an exact mixture of those in the powder). As a result, the thermal reaction methods, although simple and straightforward from a theoretical perspective, practically are not that simple to use in order to get a precise result.
Based on the results described above, it was proved that the prepared standard hydroxyapatite is fully hydroxylated – OH− amount within the margins of error corresponds to the theoretical OH− concentration in the stoichiometric hydroxyapatite.
Fourier transform infrared spectroscopy Fourier transform infrared spectroscopy offers a narrow and well-defined hydroxyl ion
absorption peak for measuring the OH− content. Different samples can be compared by measuring the intensity or area of the absorption peaks. Since the hydroxyl group has its characteristic absorption peak – there is no interference from other groups –, this clear distinction makes FTIR better than the TGA method.
For obtaining quantitative results, a calibration curve using the samples with known amount of hydroxyl groups should be prepared. For this reason, the hydroxyapatite sample with maximum amount of OH− ions in the structure and one with no OH− ions is needed. In this work, two approaches were used to obtain samples with different concentration of OH−.
1. Mechanical mixtures in different ratios of standard hydroxyapatite and fluorapatite (FA does not contain any OH− ions, but its structure is similar to the structure of HA).
2. Various oxyhydroxyapatite (OHA) solid solutions. Hydroxyapatite/Fluorapatite mechanical mixtures
The calibration curve was obtained using mechanical mixtures in various ratios of fully hydroxylated HA (standard HA) and fluorapatite. A calibration curve was made from HA concentrations in steps of 25 weight% with FA. For each mechanical mixture, three pellets with KBr were prepared and FTIR spectra was recorded. OH− absorption band at 632 cm−1 was chosen for the calculations of OH− amount in hydroxyapatite because this band is more sensitive than the absorption band at 3571 cm−1 [9]. To separate the OH− peak from phosphate peaks, spectral area of 500–700 cm−1 was deconvulated and the area of OH− and PO4
3− peaks was measured (Fig. 4.5.).
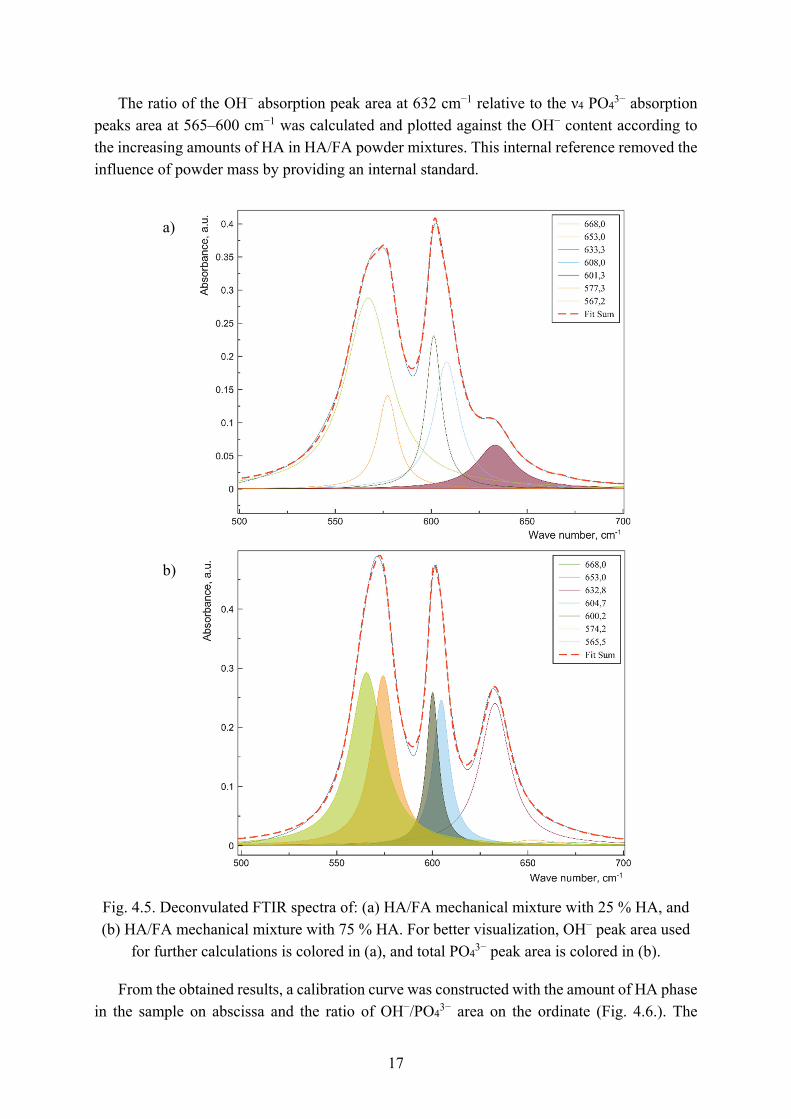
Best mathematical fit after baseline correction and using Lorentzian type of curves is shown in Fig. 4.5. A model with seven Lorentzian curves was used for all HA/FA samples. For mathematical fit, the three ν4 phosphate peaks characteristic to apatite phase (567, 574, and 601 cm−1) are shown as four curves in a 600 to 565 cm−1 range. Small peaks at 653 and 668 cm−1 are necessary to add to the mathematical deconvulation model. Absorption band at 668 cm−1 has been previously reported in fluorapatite samples [10]. It is assumed that the absorption band at 653 cm−1 could be associated with KBr sample preparation technique and might be introduced from adsorbed water. The area of both peaks at 653 and 668 cm−1 is not used for OH− calculations.
17
The ratio of the OH− absorption peak area at 632 cm−1 relative to the ν4 PO43− absorption
peaks area at 565–600 cm−1 was calculated and plotted against the OH− content according to the increasing amounts of HA in HA/FA powder mixtures. This internal reference removed the influence of powder mass by providing an internal standard.
Fig. 4.5. Deconvulated FTIR spectra of: (a) HA/FA mechanical mixture with 25 % HA, and (b) HA/FA mechanical mixture with 75 % HA. For better visualization, OH− peak area used
for further calculations is colored in (a), and total PO43− peak area is colored in (b).
From the obtained results, a calibration curve was constructed with the amount of HA phase in the sample on abscissa and the ratio of OH−/PO4
3− area on the ordinate (Fig. 4.6.). The
a)
b)
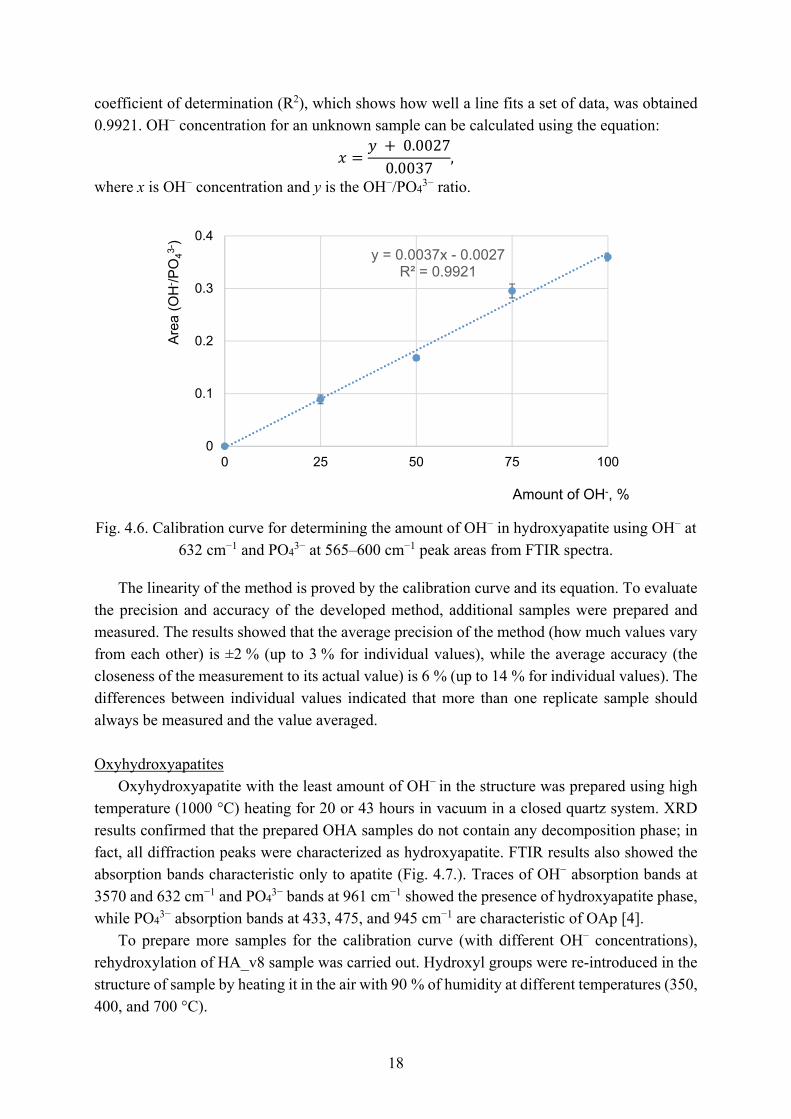
18
coefficient of determination (R2), which shows how well a line fits a set of data, was obtained 0.9921. OH− concentration for an unknown sample can be calculated using the equation:
0.00270.0037
,
where x is OH− concentration and y is the OH−/PO43− ratio.
Fig. 4.6. Calibration curve for determining the amount of OH− in hydroxyapatite using OH− at 632 cm−1 and PO4
3− at 565–600 cm−1 peak areas from FTIR spectra.
The linearity of the method is proved by the calibration curve and its equation. To evaluate the precision and accuracy of the developed method, additional samples were prepared and measured. The results showed that the average precision of the method (how much values vary from each other) is ±2 % (up to 3 % for individual values), while the average accuracy (the closeness of the measurement to its actual value) is 6 % (up to 14 % for individual values). The differences between individual values indicated that more than one replicate sample should always be measured and the value averaged. Oxyhydroxyapatites
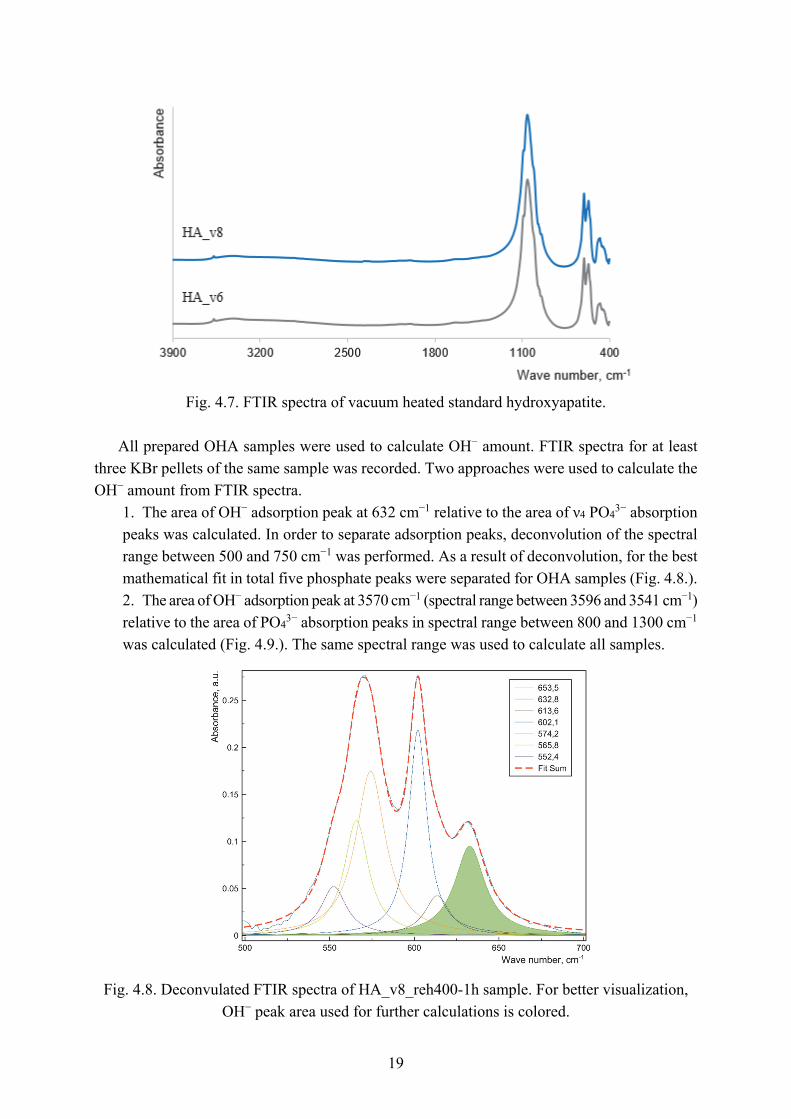
Oxyhydroxyapatite with the least amount of OH− in the structure was prepared using high temperature (1000 °C) heating for 20 or 43 hours in vacuum in a closed quartz system. XRD results confirmed that the prepared OHA samples do not contain any decomposition phase; in fact, all diffraction peaks were characterized as hydroxyapatite. FTIR results also showed the absorption bands characteristic only to apatite (Fig. 4.7.). Traces of OH− absorption bands at 3570 and 632 cm−1 and PO4
3− bands at 961 cm−1 showed the presence of hydroxyapatite phase, while PO4
3− absorption bands at 433, 475, and 945 cm−1 are characteristic of OAp [4]. To prepare more samples for the calibration curve (with different OH− concentrations),
rehydroxylation of HA_v8 sample was carried out. Hydroxyl groups were re-introduced in the structure of sample by heating it in the air with 90 % of humidity at different temperatures (350, 400, and 700 °C).
y = 0.0037x - 0.0027R² = 0.9921
0
0.1
0.2
0.3
0.4
0 25 50 75 100
Are
a (O
H- /P
O43-
)
Amount of OH-, %
19
Fig. 4.7. FTIR spectra of vacuum heated standard hydroxyapatite.
All prepared OHA samples were used to calculate OH− amount. FTIR spectra for at least
three KBr pellets of the same sample was recorded. Two approaches were used to calculate the OH− amount from FTIR spectra.
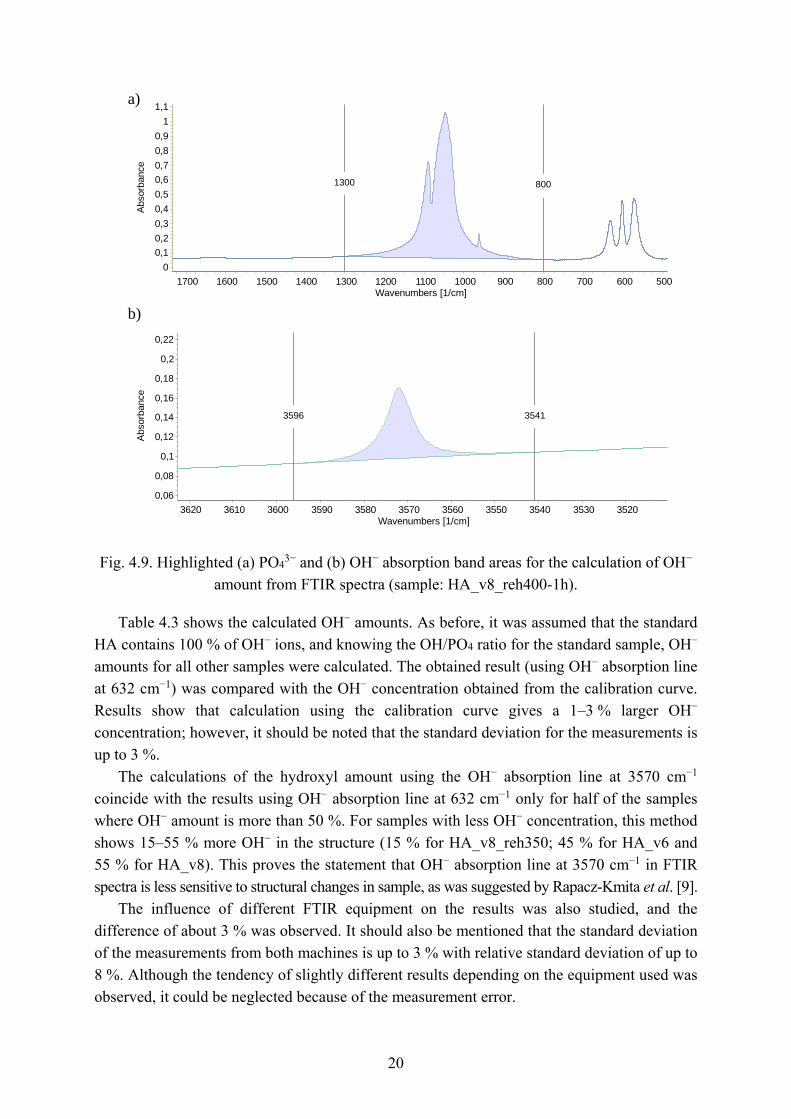
1. The area of OH− adsorption peak at 632 cm−1 relative to the area of ν4 PO43− absorption
peaks was calculated. In order to separate adsorption peaks, deconvolution of the spectral range between 500 and 750 cm−1 was performed. As a result of deconvolution, for the best mathematical fit in total five phosphate peaks were separated for OHA samples (Fig. 4.8.). 2. The area of OH− adsorption peak at 3570 cm−1 (spectral range between 3596 and 3541 cm−1) relative to the area of PO4
3− absorption peaks in spectral range between 800 and 1300 cm−1 was calculated (Fig. 4.9.). The same spectral range was used to calculate all samples.
Fig. 4.8. Deconvulated FTIR spectra of HA_v8_reh400-1h sample. For better visualization, OH− peak area used for further calculations is colored.
20
Fig. 4.9. Highlighted (a) PO43− and (b) OH− absorption band areas for the calculation of OH−
amount from FTIR spectra (sample: HA_v8_reh400-1h).
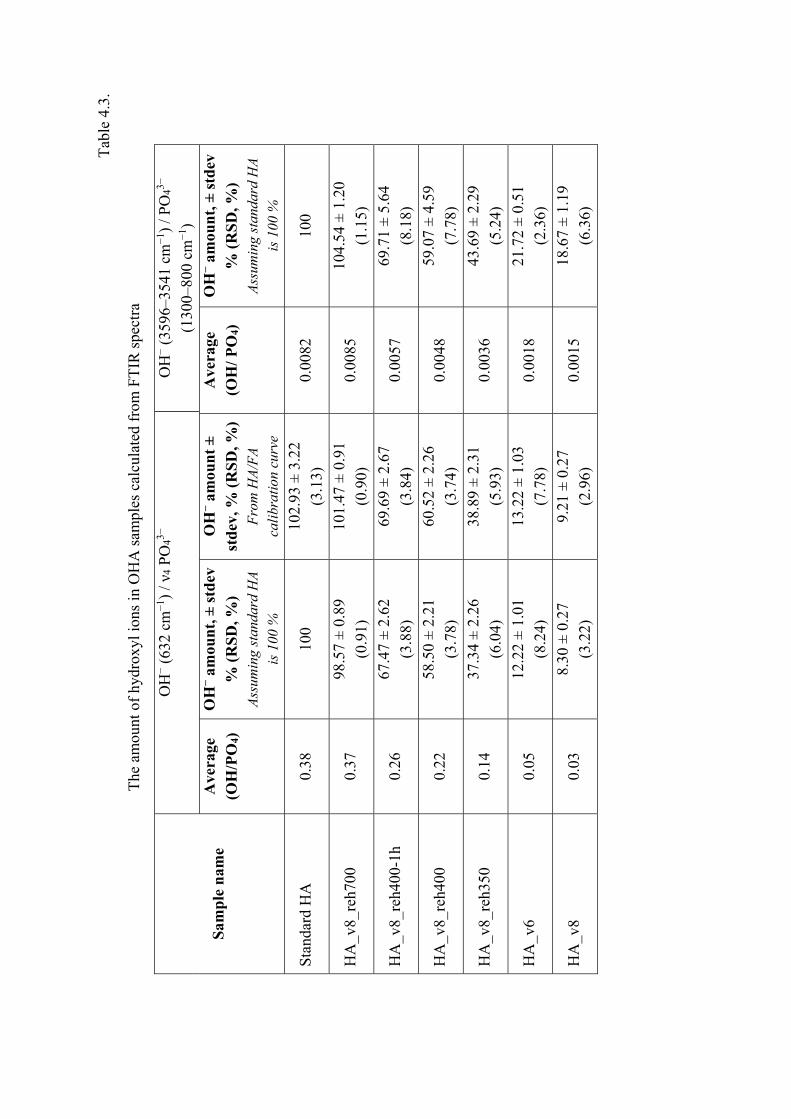
Table 4.3 shows the calculated OH− amounts. As before, it was assumed that the standard HA contains 100 % of OH− ions, and knowing the OH/PO4 ratio for the standard sample, OH− amounts for all other samples were calculated. The obtained result (using OH− absorption line at 632 cm−1) was compared with the OH− concentration obtained from the calibration curve. Results show that calculation using the calibration curve gives a 1–3 % larger OH− concentration; however, it should be noted that the standard deviation for the measurements is up to 3 %.
The calculations of the hydroxyl amount using the OH− absorption line at 3570 cm−1 coincide with the results using OH− absorption line at 632 cm−1 only for half of the samples where OH− amount is more than 50 %. For samples with less OH− concentration, this method shows 15–55 % more OH− in the structure (15 % for HA_v8_reh350; 45 % for HA_v6 and 55 % for HA_v8). This proves the statement that OH− absorption line at 3570 cm−1 in FTIR spectra is less sensitive to structural changes in sample, as was suggested by Rapacz-Kmita et al. [9].
The influence of different FTIR equipment on the results was also studied, and the difference of about 3 % was observed. It should also be mentioned that the standard deviation of the measurements from both machines is up to 3 % with relative standard deviation of up to 8 %. Although the tendency of slightly different results depending on the equipment used was observed, it could be neglected because of the measurement error.
b)
Wavenumbers [1/cm]1700 1600 1500 1400 1300 1200 1100 1000 900 800 700 600 500
Absorb
ance
1,1
1
0,9
0,8
0,7
0,6
0,5
0,4
0,3
0,2
0,1
0
1300 8001300 800
3570 3560Wavenumbers [1/cm]
3620 3610 3600 3590 3580 3550 3540 3530 3520
Absorb
ance
0,22
0,2
0,18
0,16
0,14
0,12
0,1
0,08
0,06
3596 35413541 3596
a)
21
Tab
le 4
.3.
The
am
ount
of
hydr
oxyl
ions
in O
HA
sam
ples
cal
cula
ted
from
FT
IR s
pect
ra
Sam
ple
nam
e
OH
− (
632
cm−
1 ) / ν
4 P
O43−
O
H− (
3596
–354
1 cm
−1 )
/ PO
43−
(130
0–80
0 cm
−1 )
Ave
rage
(O
H/P
O4)
O
H− a
mou
nt,
± s
tdev
%
(R
SD
, %)
Ass
umin
g st
anda
rd H
A
is 1
00 %
OH
− a
mou
nt
± st
dev
, % (
RS
D, %
) F
rom
HA
/FA
ca
libr
atio
n cu
rve
Ave
rage
(O
H/ P
O4)
O
H− a
mou
nt,
± s
tdev
%
(R
SD
, %)
Ass
umin
g st
anda
rd H
A
is 1
00 %
Sta
ndar
d H
A
0.38
10
0 10
2.93
± 3
.22
(3.1
3)
0.00
82
100
HA
_v8_
reh7
00
0.37
98
.57
± 0.
89
(0.9
1)
101.
47 ±
0.9
1 (0
.90)
0.
0085
10
4.54
± 1
.20
(1.1
5)
HA
_v8_
reh4
00-1
h 0.
26
67.4
7 ±
2.62
(3
.88)
69
.69
± 2.
67
(3.8
4)
0.00
57
69.7
1 ±
5.64
(8
.18)
HA
_v8_
reh4
00
0.22
58
.50
± 2.
21
(3.7
8)
60.5
2 ±
2.26
(3
.74)
0.
0048
59
.07
± 4.
59
(7.7
8)
HA
_v8_
reh3
50
0.14
37
.34
± 2.
26
(6.0
4)
38.8
9 ±
2.31
(5
.93)
0.
0036
43
.69
± 2.
29
(5.2
4)
HA
_v6
0.05
12
.22
± 1.
01
(8.2
4)
13.2
2 ±
1.03
(7
.78)
0.
0018
21
.72
± 0.
51
(2.3
6)
HA
_v8
0.03
8.
30 ±
0.2
7 (3
.22)
9.
21 ±
0.2
7 (2
.96)
0.
0015
18
.67
± 1.
19
(6.3
6)
22
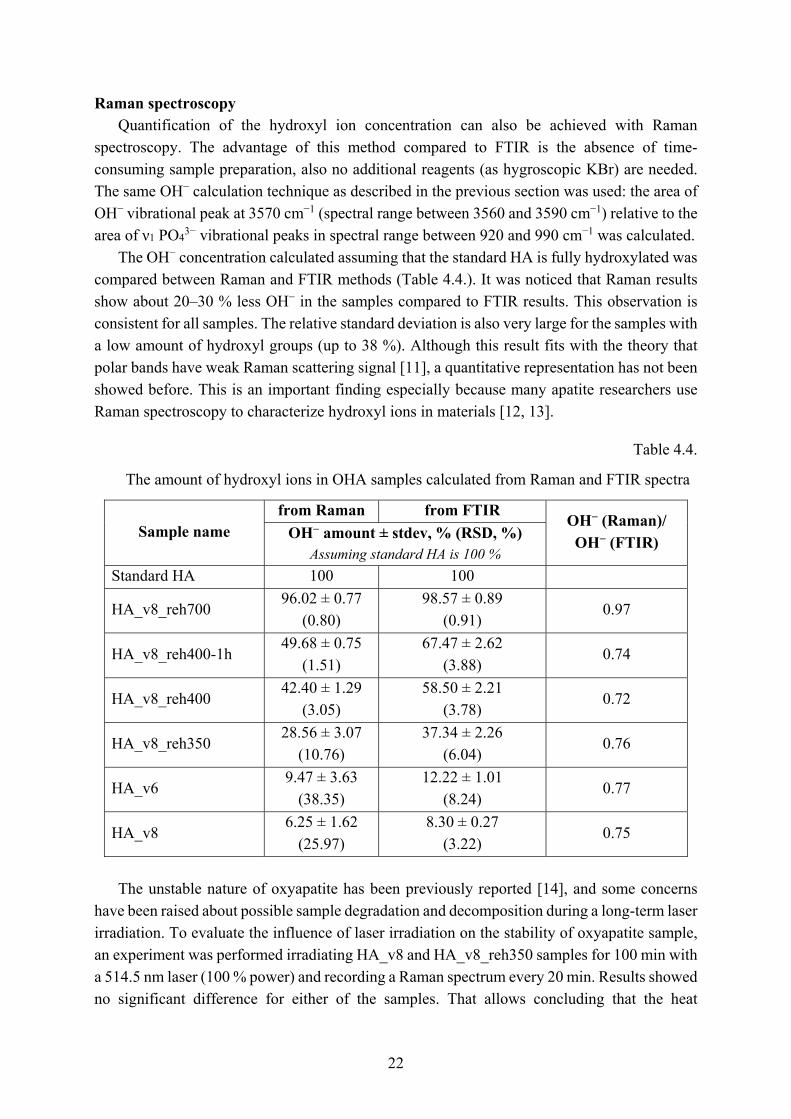
Raman spectroscopy Quantification of the hydroxyl ion concentration can also be achieved with Raman
spectroscopy. The advantage of this method compared to FTIR is the absence of time-consuming sample preparation, also no additional reagents (as hygroscopic KBr) are needed. The same OH− calculation technique as described in the previous section was used: the area of OH− vibrational peak at 3570 cm−1 (spectral range between 3560 and 3590 cm−1) relative to the area of ν1 PO4
3− vibrational peaks in spectral range between 920 and 990 cm−1 was calculated. The OH− concentration calculated assuming that the standard HA is fully hydroxylated was
compared between Raman and FTIR methods (Table 4.4.). It was noticed that Raman results show about 20–30 % less OH− in the samples compared to FTIR results. This observation is consistent for all samples. The relative standard deviation is also very large for the samples with a low amount of hydroxyl groups (up to 38 %). Although this result fits with the theory that polar bands have weak Raman scattering signal [11], a quantitative representation has not been showed before. This is an important finding especially because many apatite researchers use Raman spectroscopy to characterize hydroxyl ions in materials [12, 13].
Table 4.4.
The amount of hydroxyl ions in OHA samples calculated from Raman and FTIR spectra
Sample name from Raman from FTIR
OH− (Raman)/ OH− (FTIR)
OH− amount ± stdev, % (RSD, %) Assuming standard HA is 100 %
Standard HA 100 100
HA_v8_reh700 96.02 ± 0.77
(0.80) 98.57 ± 0.89
(0.91) 0.97
HA_v8_reh400-1h 49.68 ± 0.75
(1.51) 67.47 ± 2.62
(3.88) 0.74
HA_v8_reh400 42.40 ± 1.29
(3.05) 58.50 ± 2.21
(3.78) 0.72
HA_v8_reh350 28.56 ± 3.07
(10.76) 37.34 ± 2.26
(6.04) 0.76
HA_v6 9.47 ± 3.63
(38.35) 12.22 ± 1.01
(8.24) 0.77
HA_v8 6.25 ± 1.62
(25.97) 8.30 ± 0.27
(3.22) 0.75
The unstable nature of oxyapatite has been previously reported [14], and some concerns
have been raised about possible sample degradation and decomposition during a long-term laser irradiation. To evaluate the influence of laser irradiation on the stability of oxyapatite sample, an experiment was performed irradiating HA_v8 and HA_v8_reh350 samples for 100 min with a 514.5 nm laser (100 % power) and recording a Raman spectrum every 20 min. Results showed no significant difference for either of the samples. That allows concluding that the heat
23
produced from the laser does not influence the OH− amount of the sample, and the produced oxyhydroxyapatite samples are stable under normal ambient conditions.
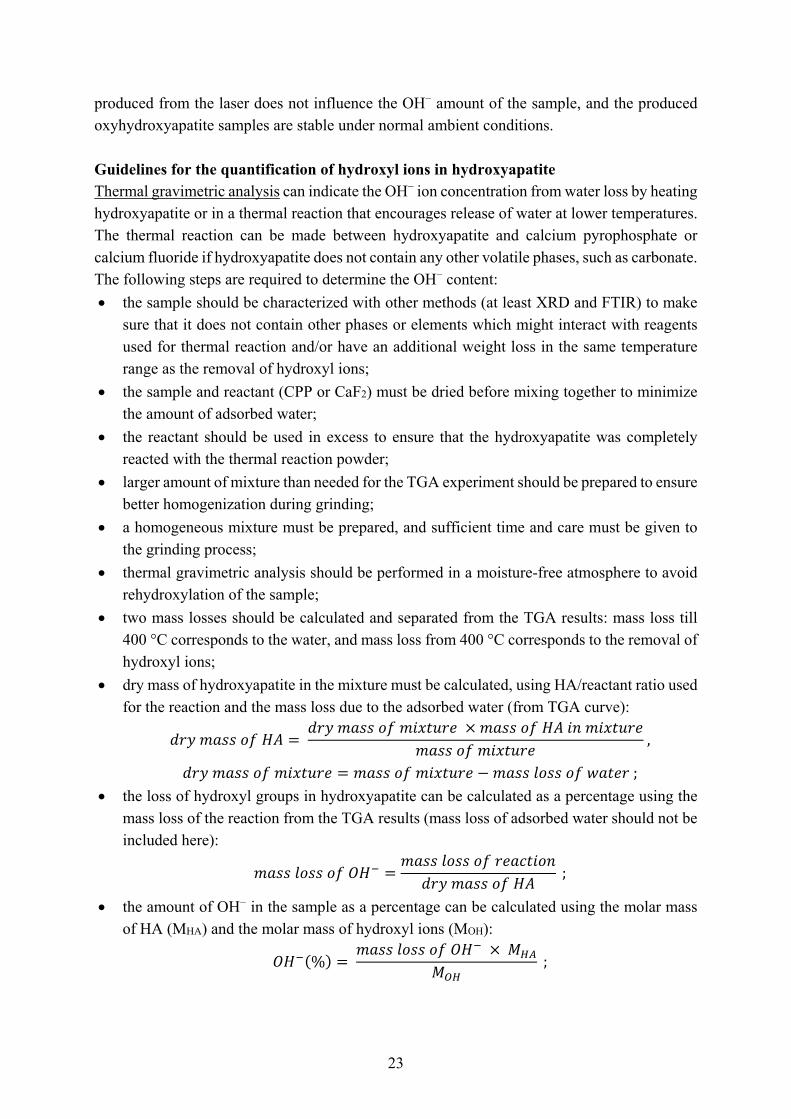
Guidelines for the quantification of hydroxyl ions in hydroxyapatite Thermal gravimetric analysis can indicate the OH− ion concentration from water loss by heating hydroxyapatite or in a thermal reaction that encourages release of water at lower temperatures. The thermal reaction can be made between hydroxyapatite and calcium pyrophosphate or calcium fluoride if hydroxyapatite does not contain any other volatile phases, such as carbonate. The following steps are required to determine the OH− content:
the sample should be characterized with other methods (at least XRD and FTIR) to make
sure that it does not contain other phases or elements which might interact with reagents used for thermal reaction and/or have an additional weight loss in the same temperature range as the removal of hydroxyl ions;
the sample and reactant (CPP or CaF2) must be dried before mixing together to minimize the amount of adsorbed water;
the reactant should be used in excess to ensure that the hydroxyapatite was completely reacted with the thermal reaction powder;
larger amount of mixture than needed for the TGA experiment should be prepared to ensure better homogenization during grinding;
a homogeneous mixture must be prepared, and sufficient time and care must be given to
the grinding process;
thermal gravimetric analysis should be performed in a moisture-free atmosphere to avoid rehydroxylation of the sample;
two mass losses should be calculated and separated from the TGA results: mass loss till 400 °C corresponds to the water, and mass loss from 400 °C corresponds to the removal of hydroxyl ions;
dry mass of hydroxyapatite in the mixture must be calculated, using HA/reactant ratio used
for the reaction and the mass loss due to the adsorbed water (from TGA curve):
,
; the loss of hydroxyl groups in hydroxyapatite can be calculated as a percentage using the
mass loss of the reaction from the TGA results (mass loss of adsorbed water should not be included here):
;
the amount of OH− in the sample as a percentage can be calculated using the molar mass of HA (MHA) and the molar mass of hydroxyl ions (MOH):
%
;
24
the sample after TGA reaction should be tested with other methods (at least XRD and FTIR) to make sure that the reaction was complete (no HA phase should be detected).
Fourier transform infrared spectroscopy will directly identify the presence of OH−. FTIR offers a faster and easier quantification of hydroxyl groups compared to thermal gravimetric analysis. As the hydroxyl ions have a separate absorption line, it is not influenced by other phases. The following steps are recommended to obtain precise results:
the sample and KBr must be dried to minimize the effect of adsorbed water;
the sample should be well ground in a mortar before adding KBr;
small amount of the ground sample should be lightly mixed with KBr (200 mg was used in this research) to form a homogeneous mixture, and the pellet should be made by uniaxial pressing. Mechanical mixing of the sample with KBr should be avoided as it can disturb the crystal lattice of the sample or even change the hydroxyl ion concentration;
the amount of the sample in the KBr pellet should be similar for all measurements, which can be checked by the absorption intensity of the recorded spectra, and the maximum intensity should be within the range of 0.8 to 1.2 a.u.;
at least three replicate samples (three individual samples taken from the ground powder mixture) should be analyzed, and the calculations should be averaged;
the same equipment parameters should be used for all measurements (in this research, a
resolution of 4 cm−1 was used and a total of 64 scans per measurement were taken);
if different equipment is used, additional experiments should be made to understand the differences in the measured values;
hydroxyl ion absorption peak at 632 cm−1 should be used (instead of OH− absorption peak at 3570 cm−1), as it is more sensitive;
to separate the hydroxyl ion absorption peak from the phosphate peaks, the deconvolution
of the spectral range of 500–700 cm−1 should be performed. The same deconvolution model should be used for all samples;
the area of the OH− absorption peak at 632 cm−1 and the sum of ν4 phosphate absorption peaks should be measured;
the ratio of the peak areas (OH−/PO43−) should be calculated;
to calculate the amount of OH− in the sample, a calibration curve should be used or the
calculated value should be compared to the OH−/PO43− ratio of a hydroxyapatite with
100 % OH− (standard hydroxyapatite). In this research:
o the equation from the calibration curve: .
., where x is the concentration of
OH− in the sample (%) and y is the OH−/PO43− ratio;
o OH−/PO43− ratio for a 100 % OH− containing hydroxyapatite is 0.38 ± 0.012;
o the calculated average accuracy of the method is 6 %, while the average precision is 2 %.
25
4.2. PART 2 Influence of the hydroxyl ion content on the biological response of the hydroxyapatite coatings
Preparation and characterization of hydroxyapatite coatings Commercial hydroxyapatite powder was used for the preparation of HA coatings; according
to XRD and FTIR analysis, it contains a small amount of tetracalcium phosphate. Concentration of hydroxyl ions was measured from deconvulated spectral area at 500–750 cm−1; it was 22 ± 2 %. The analysis of the commercial powder confirmed the lack of a good-quality control technique and a detailed characterization of commercial products. Although the product was sold as hydroxyapatite powder for thermal spraying, the analysis showed that it was an oxyhydroxyapatite with a small amount of decomposition phase.
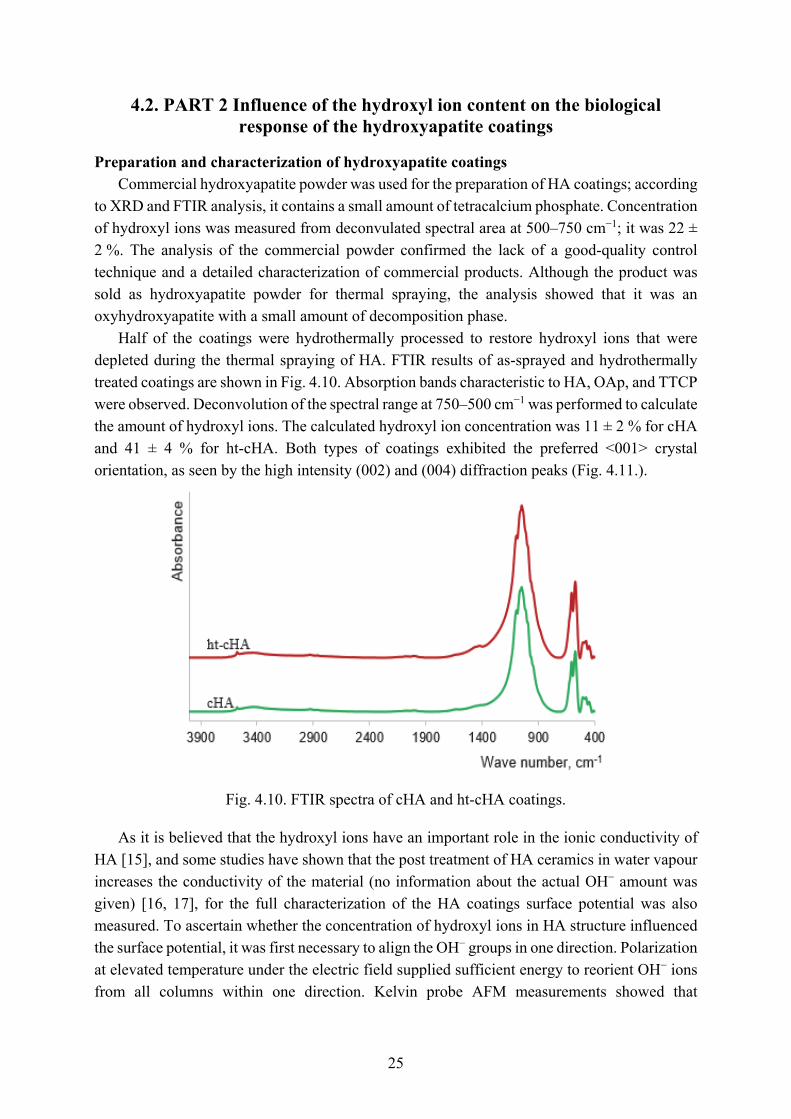
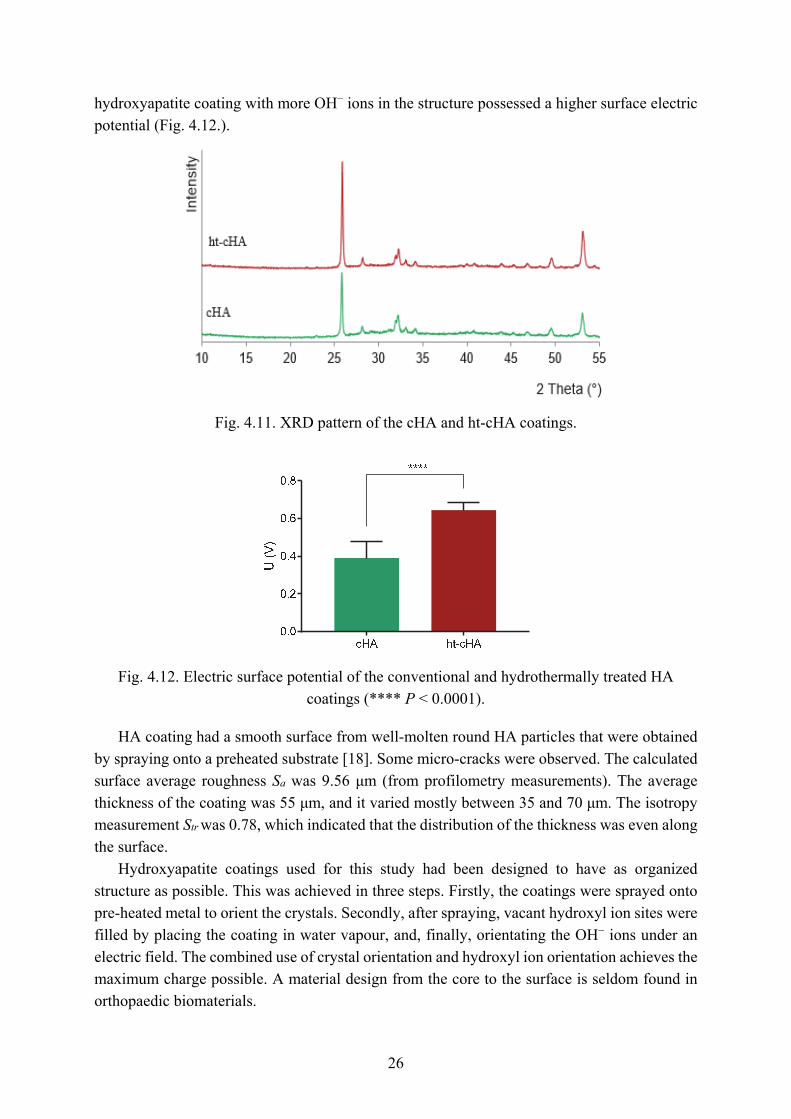
Half of the coatings were hydrothermally processed to restore hydroxyl ions that were depleted during the thermal spraying of HA. FTIR results of as-sprayed and hydrothermally treated coatings are shown in Fig. 4.10. Absorption bands characteristic to HA, OAp, and TTCP were observed. Deconvolution of the spectral range at 750–500 cm−1 was performed to calculate the amount of hydroxyl ions. The calculated hydroxyl ion concentration was 11 ± 2 % for cHA and 41 ± 4 % for ht-cHA. Both types of coatings exhibited the preferred <001> crystal orientation, as seen by the high intensity (002) and (004) diffraction peaks (Fig. 4.11.).
Fig. 4.10. FTIR spectra of cHA and ht-cHA coatings.
As it is believed that the hydroxyl ions have an important role in the ionic conductivity of HA [15], and some studies have shown that the post treatment of HA ceramics in water vapour increases the conductivity of the material (no information about the actual OH− amount was given) [16, 17], for the full characterization of the HA coatings surface potential was also measured. To ascertain whether the concentration of hydroxyl ions in HA structure influenced the surface potential, it was first necessary to align the OH− groups in one direction. Polarization at elevated temperature under the electric field supplied sufficient energy to reorient OH− ions from all columns within one direction. Kelvin probe AFM measurements showed that
26
hydroxyapatite coating with more OH− ions in the structure possessed a higher surface electric potential (Fig. 4.12.).
Fig. 4.11. XRD pattern of the cHA and ht-cHA coatings.
Fig. 4.12. Electric surface potential of the conventional and hydrothermally treated HA
coatings (**** P < 0.0001).
HA coating had a smooth surface from well-molten round HA particles that were obtained by spraying onto a preheated substrate [18]. Some micro-cracks were observed. The calculated surface average roughness Sa was 9.56 μm (from profilometry measurements). The average thickness of the coating was 55 μm, and it varied mostly between 35 and 70 μm. The isotropy measurement Str was 0.78, which indicated that the distribution of the thickness was even along the surface.
Hydroxyapatite coatings used for this study had been designed to have as organized structure as possible. This was achieved in three steps. Firstly, the coatings were sprayed onto pre-heated metal to orient the crystals. Secondly, after spraying, vacant hydroxyl ion sites were filled by placing the coating in water vapour, and, finally, orientating the OH− ions under an electric field. The combined use of crystal orientation and hydroxyl ion orientation achieves the maximum charge possible. A material design from the core to the surface is seldom found in orthopaedic biomaterials.
27
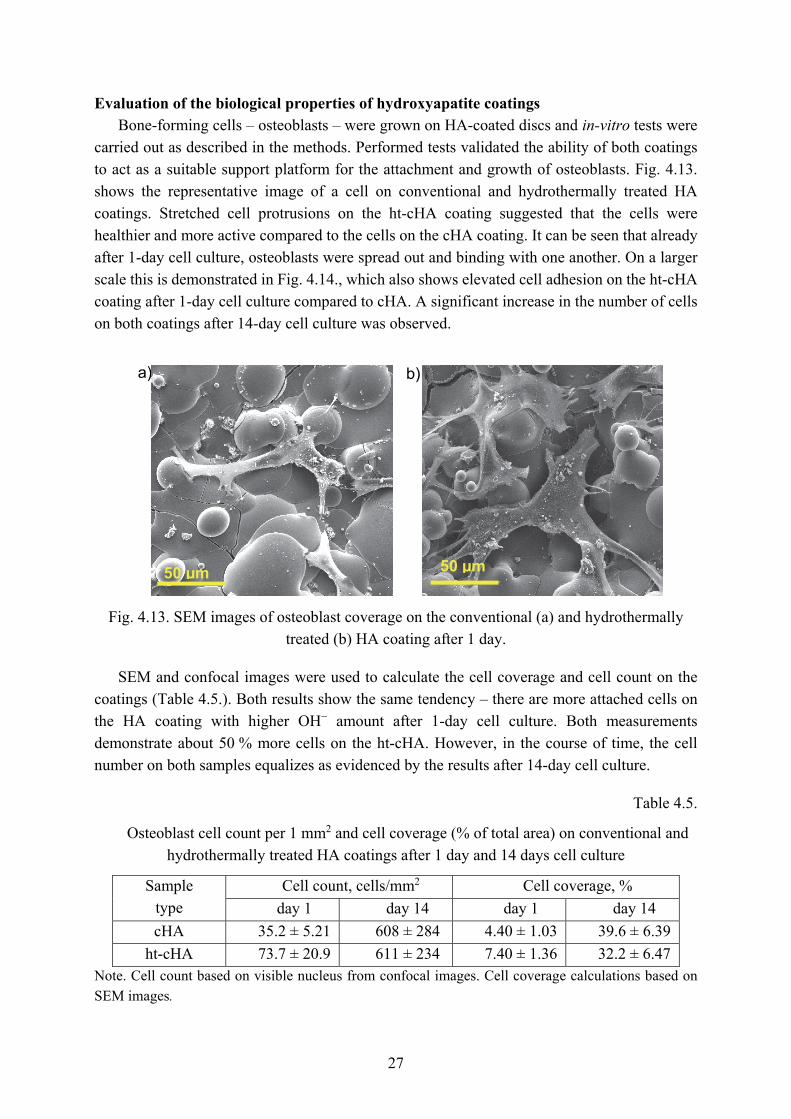
Evaluation of the biological properties of hydroxyapatite coatings Bone-forming cells – osteoblasts – were grown on HA-coated discs and in-vitro tests were
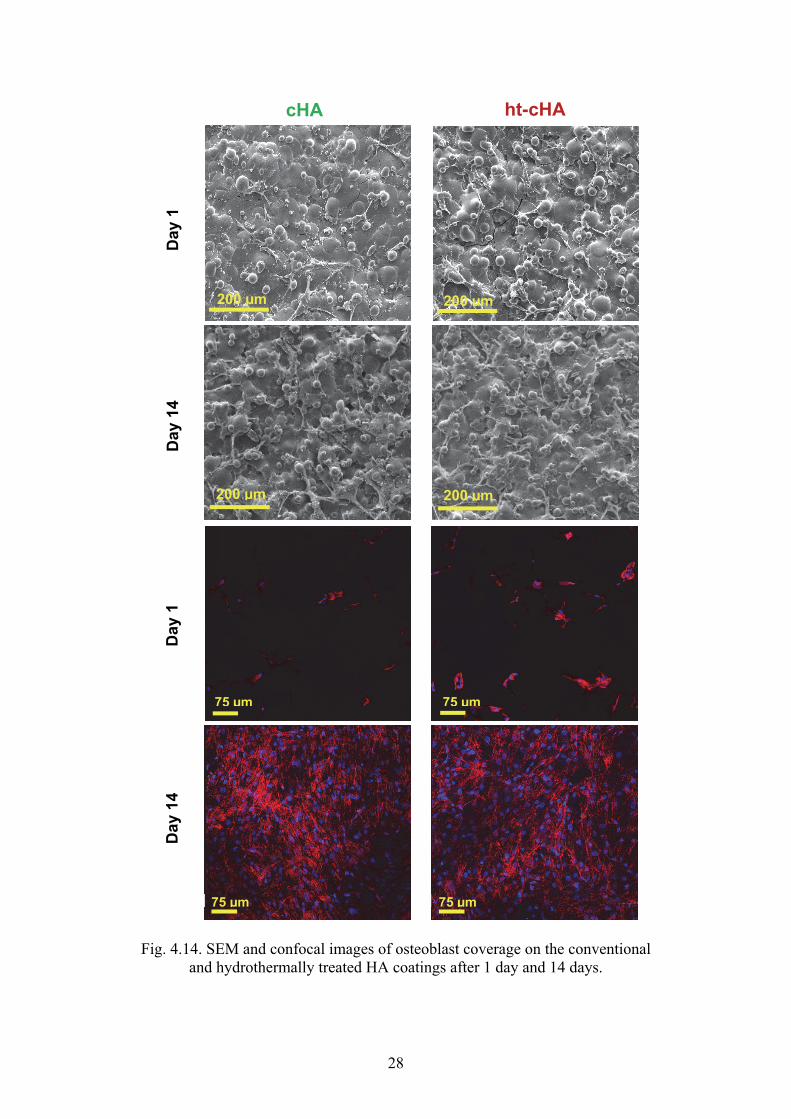
carried out as described in the methods. Performed tests validated the ability of both coatings to act as a suitable support platform for the attachment and growth of osteoblasts. Fig. 4.13. shows the representative image of a cell on conventional and hydrothermally treated HA coatings. Stretched cell protrusions on the ht-cHA coating suggested that the cells were healthier and more active compared to the cells on the cHA coating. It can be seen that already after 1-day cell culture, osteoblasts were spread out and binding with one another. On a larger scale this is demonstrated in Fig. 4.14., which also shows elevated cell adhesion on the ht-cHA coating after 1-day cell culture compared to cHA. A significant increase in the number of cells on both coatings after 14-day cell culture was observed.
Fig. 4.13. SEM images of osteoblast coverage on the conventional (a) and hydrothermally treated (b) HA coating after 1 day.
SEM and confocal images were used to calculate the cell coverage and cell count on the coatings (Table 4.5.). Both results show the same tendency – there are more attached cells on the HA coating with higher OH− amount after 1-day cell culture. Both measurements demonstrate about 50 % more cells on the ht-cHA. However, in the course of time, the cell number on both samples equalizes as evidenced by the results after 14-day cell culture.
Table 4.5.
Osteoblast cell count per 1 mm2 and cell coverage (% of total area) on conventional and hydrothermally treated HA coatings after 1 day and 14 days cell culture
Sample type
Cell count, cells/mm2 Cell coverage, %
day 1 day 14 day 1 day 14
cHA 35.2 ± 5.21 608 ± 284 4.40 ± 1.03 39.6 ± 6.39
ht-cHA 73.7 ± 20.9 611 ± 234 7.40 ± 1.36 32.2 ± 6.47 Note. Cell count based on visible nucleus from confocal images. Cell coverage calculations based on SEM images.
a)
50 µm 50 µm
b)
28
Fig. 4.14. SEM and confocal images of osteoblast coverage on the conventional and hydrothermally treated HA coatings after 1 day and 14 days.
200 µm 200 µm
Day
1
200 µm 200 µm
Day
14
cHA ht-cHA
75 µm 75 µm
75 µm 75 µm
Day
14
Day
1
29
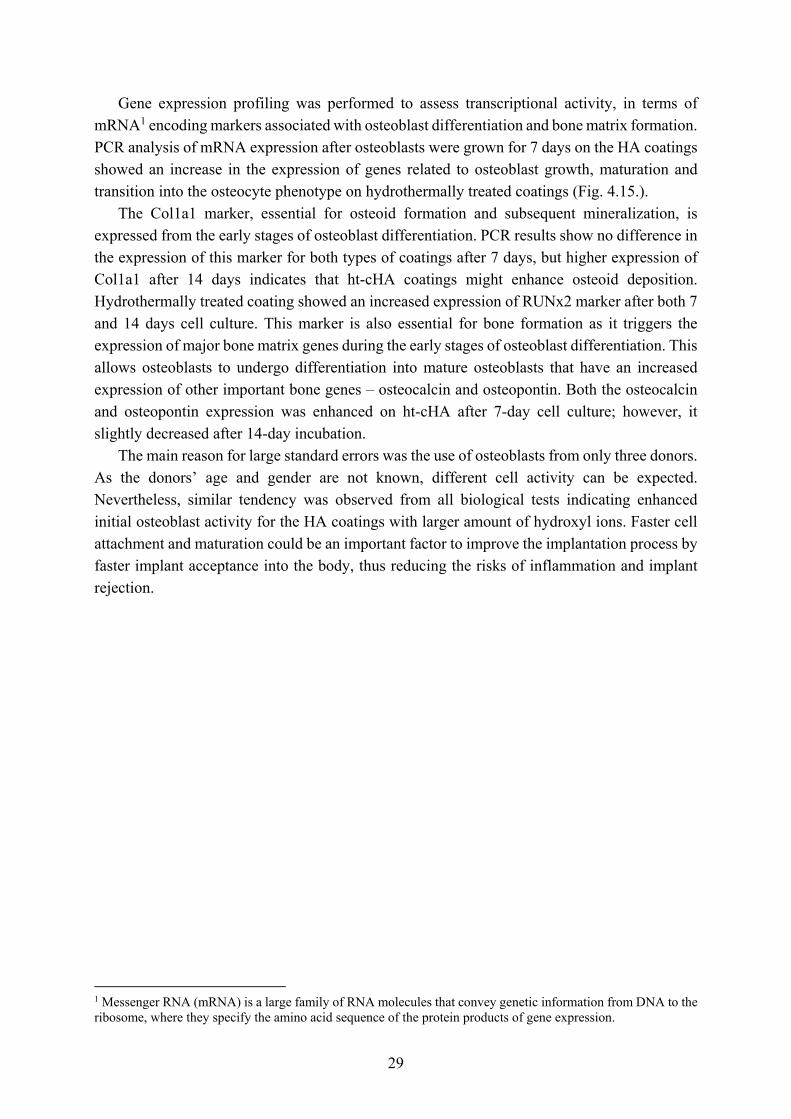
Gene expression profiling was performed to assess transcriptional activity, in terms of mRNA1 encoding markers associated with osteoblast differentiation and bone matrix formation. PCR analysis of mRNA expression after osteoblasts were grown for 7 days on the HA coatings showed an increase in the expression of genes related to osteoblast growth, maturation and transition into the osteocyte phenotype on hydrothermally treated coatings (Fig. 4.15.).
The Col1a1 marker, essential for osteoid formation and subsequent mineralization, is expressed from the early stages of osteoblast differentiation. PCR results show no difference in the expression of this marker for both types of coatings after 7 days, but higher expression of Col1a1 after 14 days indicates that ht-cHA coatings might enhance osteoid deposition. Hydrothermally treated coating showed an increased expression of RUNx2 marker after both 7 and 14 days cell culture. This marker is also essential for bone formation as it triggers the expression of major bone matrix genes during the early stages of osteoblast differentiation. This allows osteoblasts to undergo differentiation into mature osteoblasts that have an increased expression of other important bone genes – osteocalcin and osteopontin. Both the osteocalcin and osteopontin expression was enhanced on ht-cHA after 7-day cell culture; however, it slightly decreased after 14-day incubation.
The main reason for large standard errors was the use of osteoblasts from only three donors. As the donors’ age and gender are not known, different cell activity can be expected. Nevertheless, similar tendency was observed from all biological tests indicating enhanced initial osteoblast activity for the HA coatings with larger amount of hydroxyl ions. Faster cell attachment and maturation could be an important factor to improve the implantation process by faster implant acceptance into the body, thus reducing the risks of inflammation and implant rejection.
1 Messenger RNA (mRNA) is a large family of RNA molecules that convey genetic information from DNA to the ribosome, where they specify the amino acid sequence of the protein products of gene expression.
30
Fig
. 4.1
5. E
xpre
ssio
n of
bon
e ce
ll m
arke
rs in
ost
eobl
asts
gro
wn
on c
onve
ntio
nal (
cHA
, gre
en)
and
hydr
othe
rmal
ly tr
eate
d (h
t-cH
A, r
ed)
HA
co
atin
gs a
fter
7 a
nd 1
4 da
ys c
ell c
ultu
re (
* P
≤ 0
.05)
.
31
CONCLUSIONS
PART 1 MEASUREMENT OF HYDROXYL ION CONTENT IN HYDROXYAPATITE 1. Thermal gravimetric analysis using hydroxyapatite thermal reaction with calcium
pyrophosphate or calcium fluoride can be used for quantification of hydroxyl ions in hydroxyapatite if it does not contain other volatile phases.
2. Calibration curve for determination of hydroxyl ion content in hydroxyapatite has been developed using Fourier transform infrared spectroscopy. This method is linear in the range of the hydroxyl ion concentration of 0 % to 100 % with a coefficient of determination of 0.9921, and allows quantifying the hydroxyl ion amount with precision of 2 % and accuracy of 6 %.
3. Both hydroxyl ion absorption lines in Fourier transform infrared spectra (at 632 and 3570 cm−1) can be used for the quantification of hydroxyl ion amount in hydroxyapatite with more than 50 % hydroxyl ions, but only the absorption line at 632 cm−1 gives precise quantitative results if the sample contains less than 50 % hydroxyl ions.
4. Raman spectroscopy is less sensitive for the detection of hydroxyl ions, and shows about 20–30 % less hydroxyl ions in oxyhydroxyapatite samples compared to FTIR results.
5. Laser irradiation (up to 100 min using 100 % power of 514.5 nm laser) by Raman spectrometer did not influence the hydroxyl ion amount in hydroxyapatite samples.
PART 2 INFLUENCE OF HYDROXYL ION CONTENT ON THE BIOLOGICAL RESPONSE OF HYDROXYAPATITE COATINGS 6. Increasing the hydroxyl ions concentration in hydroxyapatite coating for 30 % increased its
surface electric potential 1.7 times. 7. Hydroxyapatite coatings with more hydroxyl ions increase the initial osteoblast adhesion for
about 50 % (based on the cell count and cell coverage measurements) and promote the initial maturation and differentiation of osteoblasts (based on RUNx2, OCN, OPN gene marker expression after 7-day cell culture).
8. The influence of hydroxyl ions content on the biological response of hydroxyapatite coating decreases over time, and after 2-week cell culture no significant difference can be observed.
32
REFERENCES
[1] OECD/EU. Health at a Glance: Europe 2016 – State of Health in the EU Cycle. OECD Publishing, Paris 2016. p. 200. [2] Eurostat EC. Surgical operations and procedures statistics. http://eceuropaeu/eurostat/ statistics-explained/indexphp/Surgical_operations_and_procedures_statistics (webpage viewed on 18.04.2017.). [3] Victoria G, Petrisor B, Drew B, Dick D. Bone stimulation for fracture healing: Whats all the fuss. Indian Journal of Orthopaedics 2009; 43:117–20. [4] Elliott JC. Structure and chemistry of the apatites and other calcium orthophosphates. Elsevier Inc, Amsterdam 1994:387. [5] Emara KM, Diab RA, Emara AK. Recent biological trends in management of fracture non-union. World Journal of Orthopaedics 2015; 6:623–8. [6] Olszta MJ, Cheng X, Jee SS, Kumar R, Kim Y-Y, Kaufman MJ, et al. Bone structure and formation: A new perspective. Materials Science & Engineering R-Reports 2007; 58:77–116. [7] Baxter FR, Bowen CR, Turner IG, Dent ACE. Electrically active bioceramics: A review of interfacial responses. Annals of Biomedical Engineering 2010; 38:2079–92. [8] 13779-1:2008(E) IsI. Implants for surgery – Hydroxyapatite. Part 1: Ceramic hydroxyapatite. 2008. [9] Rapacz-Kmita A, Paluszkiewicz C, Slosarczyk A, Paszkiewicz Z. FTIR and XRD investigations on the thermal stability of hydroxyapatite during hot pressing and pressureless sintering processes. Journal of Molecular Structure 2005; 744:653–6. [10] Bianco A, Cacciotti I, Lombardi M, Montanaro L, Bemporad E, Sebastiani M. F-substituted hydroxyapatite nanopowders: Thermal stability, sintering behaviour and mechanical properties. Ceramics International 2010; 36:313–22. [11] Peeran M. Comparison of Raman and IR Spectroscopy. http://wwwchemvistaorg/ ramanIR4html (webpage viewed on 15.04.2017). [12] Pasteris JD, Wopenka B, Freeman JJ, Rogers K, Valsami-Jones E, van der Houwen JAM, et al. Lack of OH in nanocrystalline apatite as a function of degree of atomic order: implications for bone and biomaterials. Biomaterials 2004; 25:229–38. [13] Saber-Samandari S, Alamara K, Saber-Samandari S, Gross KA. Micro-Raman spectroscopy shows how the coating process affects the characteristics of hydroxylapatite. Acta Biomaterialia 2013; 9:9538–46. [14] Gross KA, Berndt CC, Stephens P, Dinnebier R. Oxyapatite in hydroxyapatite coatings. Journal of Materials Science 1998; 33:3985–91. [15] Gittings JP, Bowen CR, Dent ACE, Turner IG, Baxter FR, Chaudhuri JB. Electrical characterization of hydroxyapatite-based bioceramics. Acta Biomaterialia 2009; 5:743–54. [16] Nakamura S, Takeda H, Yamashita K. Proton transport polarization and depolarization of hydroxyapatite ceramics. Journal of Applied Physics 2001; 89:5386–92. [17] Bodhak S, Bose S, Bandyopadhyay A. Electrically polarized HAp-coated Ti: In vitro bone cell-material interactions. Acta Biomaterialia 2010; 6:641–51. [18] Gross KA, Muller D, Lucas H, Haynes DR. Osteoclast resorption of thermal spray hydoxyapatite coatings is influenced by surface topography. Acta Biomaterialia 2012; 8:1948–56.
33
APPROBATION OF THE THESIS
Book chapter 1. K. A. Gross, L. Pluduma. Putting oxyhydroxyapatite into perspective: A pathway to
oxyapatite and its applications. Calcium Phosphates: Structure, Synthesis, Properties and Applications (Ed. R. B. Heimann), 2012, pp. 95–120, Nova Science Publishers.
SCOPUS
Journal papers 1. L. Pluduma, E. Freimanis, K. A. Gross, H. Koivuoloto, K. Algate, D. Haynes,
P. Vuoristo. Functionalizing surface electrical potential of hydroxyapatite coatings. Advances in Science and Technology, 102, 2017, pp. 12–17.
2. K. Tonsuaadu, K. A. Gross, L. Pluduma, M. Veiderma. A review on the thermal stability of calcium apatites. Journal of Thermal Analysis and Calorimetry, 110 (2), 2012, pp. 647–659. SCOPUS, Web of Science
3. L. Pluduma, K. Salma, L. Berzina Cimdina. Thermal characterization of Hap/TCP bioceramics with variable phase ratio. European Cells and Materials, 20 (3), 2010, p. 203. SCOPUS
Peer-Reviewed publications in conference proceedings 1. D. Ubele, L. Pluduma, A. Brangule, A. Berzina, H. Koivuluoto, P. Vuoristo,
R. Juskenas, K. A. Gross. Investigations on the tailorability of hard tissue implant surfaces by printing. European Cells and Materials, 33 (1), 2017, p. 203.
2. E. Freimanis, L. Pluduma, K. A. Gross, M. Kylmälahti, Y. Dekhtyar, H. Koivuluoto, P. Vuoristo. Flame sintered HAP adopted to bone properties. European Cells and Materials, 29 (1), 2015, p. 9.
International conference presentations with published abstracts 1. D. Ubele, L. Pluduma, A. Brangule, A. Berzina, H. Koivuluoto, P. Vuoristo,
R. Juskenas, K. A. Gross. Investigations on the tailorability of hard tissue implant surfaces by printing. Scandinavian Society for Biomaterials 10th Annual Meeting, Hafjell, Norway, March 15–17, 2017.
2. D. Haynes, L. Pluduma, K. Algate, D. Menicanin, K. A. Gross. Optimizing surface charge on hydroxyapatite coatings to promote mesenchymal stem cell development. ANZORS, Melbourne, Australia, October 13–15, 2016.
3. L. Pluduma, K. A. Gross, E. Freimanis, I. Daenke. Functionalizing surface electrical potential of hydroxyapatite coatings. 7th Forum on New Materials (CIMTEC 2016), Perugia, Italy, June 5–9, 2016.
4. E. Freimanis, L. Pluduma, K. A. Gross, M. Kylmalahti, Y. Dekhtyar, H. Koivuluoto, P. Vuoristo. Flame sintered HAp adopted to bone properties. Scandinavian Society for Biomaterials 8th Conference, Sigulda, Latvia, May 6–8, 2015.
5. K. Gross, L. Pluduma, A. Ubelis, A. Kapralovs, P. Brangulis, G. Darut, G. Montavon. The unstable hydroxyl content in thermally processed hydroxyapatite. Bioceramics 26, Barcelona, Spain, November 6–8, 2014.
34
6. L. Pluduma, K. A. Gross. Producing a true hydroxyapatite with the necessary OH content. International Symposium on Apatite and Correlative Biomaterials (ISACB 6), Nantes, France, June 5–8, 2013.
7. L. Pluduma, K. A. Gross. Develpment of new analysis tools for thermally sprayed hydroxyapatite. 5th Les Rencontres Internationales sur la Projection Thermique (RIPT), Limoge, France, December 7–9, 2011.
8. L. Pluduma, K. A. Gross, L. Bērziņa-Cimdiņa, C. Rey. Scoping different approaches for the measurement of OH in hydroxyapatite. 23rd Symposium and Annual Meeting of International Society for Ceramics in Medicine, Istanbul, Turkey, November 6–9, 2011. Best Student Podium Award (presented by Acta Biomaterialia).
9. L. Pluduma, K. A. Gross, L. Bērziņa-Cimdiņa. The Effects of Heating Atmosphere on the Stability of HAp. 52nd International Scientific Conference of Riga Technical University, Material Science and Applied Chemistry, Latvia, Riga, October 13–15, 2011.