[email protected] measuring dwelling price changes in poland with the application of the...
TRANSCRIPT

MEASURING DWELLING PRICE CHANGES IN POLAND WITH THE APPLICATION OF THE HEDONIC METHOD
The main aim of this paper is to:
identify price changes in the secondary housing market with the use of simple and hedonic methods in the years 2008-2012 in the five
biggest cities in Poland.
Introduction

Introduction
The subject scope:
Dwellings’ price changes on secondary housing market, involving both property rights and cooperative property rights
for private accommodation. Only dwellings located in multifamily buildings were analyzed.
The time scope:
2008-2012The spatial scope:
Cracow, Lodz, Poznan, Warsaw, Wroclaw
Hedonic methods
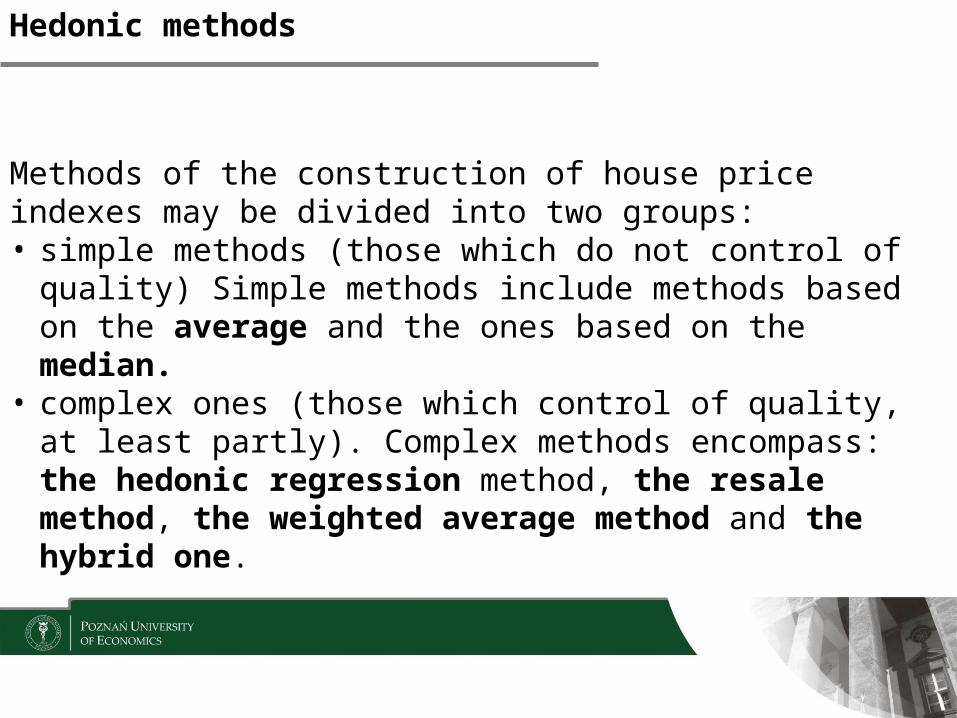
Methods of the construction of house price indexes may be divided into two groups: • simple methods (those which do not control of quality) Simple
methods include methods based on the average and the ones based on the median.
• complex ones (those which control of quality, at least partly). Complex methods encompass: the hedonic regression method, the resale method, the weighted average method and the hybrid one.

Hedonic methods
The essence of the hedonic method lies in the assumption that the price of heterogeneous goods may be described with its attributes. The equation may be recorded in the following way (1):
where:
P – price of a goodβ – regression coefficientX – attribute of a good (value driver)u – random error.
K
iii uXP
10 ; (1)
Hedonic methods
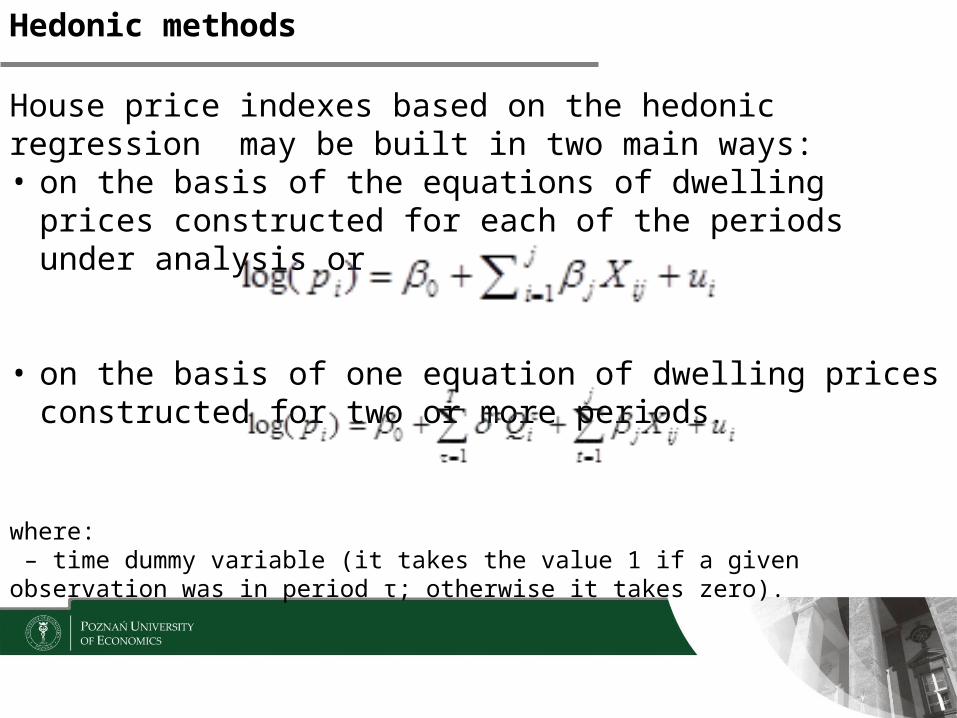
House price indexes based on the hedonic regression may be built in two main ways:• on the basis of the equations of dwelling prices constructed for
each of the periods under analysis or
• on the basis of one equation of dwelling prices constructed for two or more periods.
where: – time dummy variable (it takes the value 1 if a given observation was in period τ; otherwise it takes zero).

Results of the research
The data
• asking prices• originally included over 500,000 offers of dwellings for sale in
the years 2008-2012.• as a result of methodological selection the size of the database
was reduced to 290,000 dwellings for sale (43,296 offers in Cracow, 31,088 offers in Lodz, 33,411 offers in Poznan, 154,559 offers in Warsaw and 30,887 offers in Wroclaw).
Results of the research
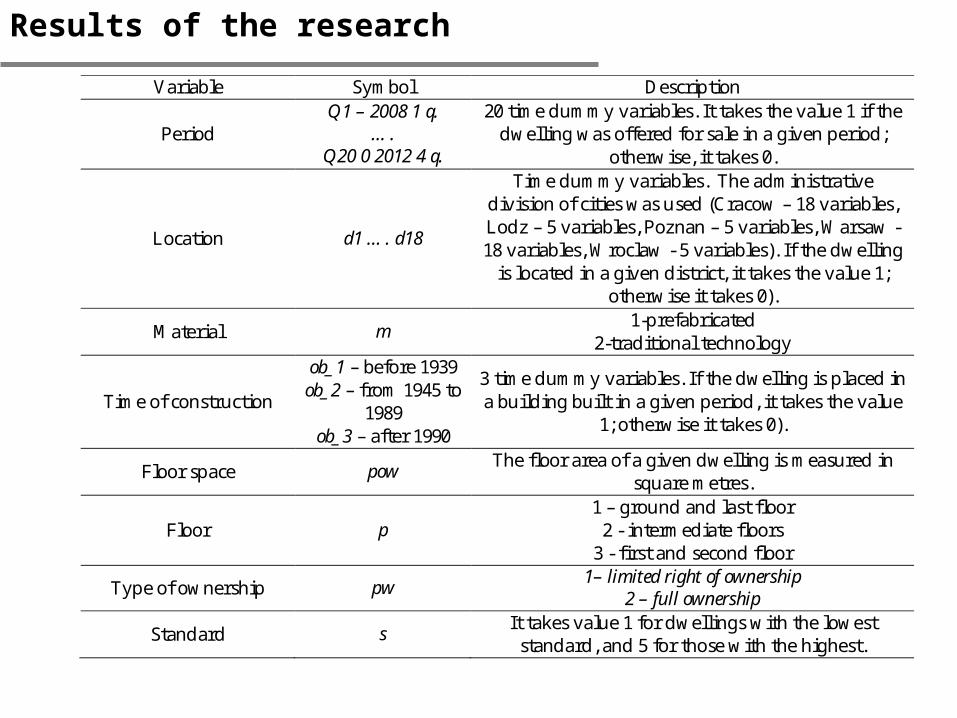
Variable Symbol Description
Period Q1 – 2008 1 q.
…. Q20 0 2012 4 q.
20 time dummy variables. It takes the value 1 if the dwelling was offered for sale in a given period;
otherwise, it takes 0.
Location d1 …. d18
Time dummy variables. The administrative division of cities was used (Cracow – 18 variables, Lodz – 5 variables, Poznan – 5 variables, Warsaw - 18 variables, Wroclaw - 5 variables). If the dwelling
is located in a given district, it takes the value 1; otherwise it takes 0).
Material m 1-prefabricated
2-traditional technology
Time of construction
ob_1 – before 1939 ob_2 – from 1945 to
1989 ob_3 – after 1990
3 time dummy variables. If the dwelling is placed in a building built in a given period, it takes the value
1; otherwise it takes 0).
Floor space pow The floor area of a given dwelling is measured in
square metres.
Floor p 1 – ground and last floor 2 - intermediate floors
3 - first and second floor
Type of ownership pw 1– limited right of ownership
2 – full ownership
Standard s It takes value 1 for dwellings with the lowest standard, and 5 for those with the highest.
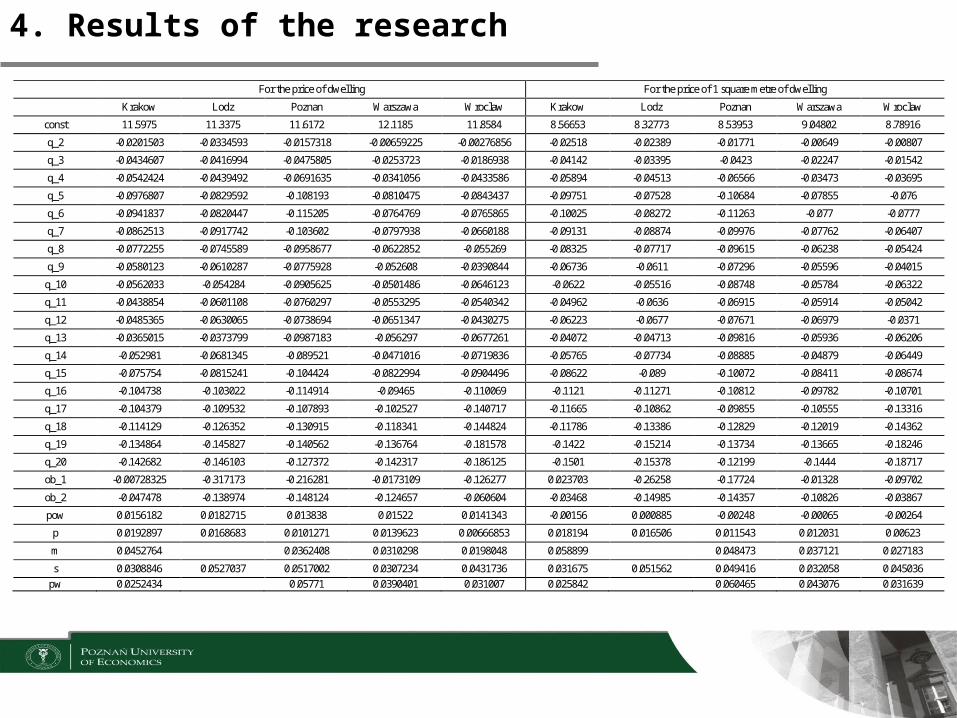
4. Results of the research
For the price of dwelling For the price of 1 square metre of dwelling
Krakow Lodz Poznan Warszawa Wroclaw Krakow Lodz Poznan Warszawa Wroclaw
const 11.5975 11.3375 11.6172 12.1185 11.8584 8.56653 8.32773 8.53953 9.04802 8.78916
q_2 -0.0201503 -0.0334593 -0.0157318 -0.00659225 -0.00276856 -0.02518 -0.02389 -0.01771 -0.00649 -0.00807
q_3 -0.0434607 -0.0416994 -0.0475805 -0.0253723 -0.0186938 -0.04142 -0.03395 -0.0423 -0.02247 -0.01542
q_4 -0.0542424 -0.0439492 -0.0691635 -0.0341056 -0.0433586 -0.05894 -0.04513 -0.06566 -0.03473 -0.03695
q_5 -0.0976807 -0.0829592 -0.108193 -0.0810475 -0.0843437 -0.09751 -0.07528 -0.10684 -0.07855 -0.076
q_6 -0.0941837 -0.0820447 -0.115205 -0.0764769 -0.0765865 -0.10025 -0.08272 -0.11263 -0.077 -0.0777
q_7 -0.0862513 -0.0917742 -0.103602 -0.0797938 -0.0660188 -0.09131 -0.08874 -0.09976 -0.07762 -0.06407
q_8 -0.0772255 -0.0745589 -0.0958677 -0.0622852 -0.055269 -0.08325 -0.07717 -0.09615 -0.06238 -0.05424
q_9 -0.0580123 -0.0610287 -0.0775928 -0.052608 -0.0390844 -0.06736 -0.0611 -0.07296 -0.05596 -0.04015
q_10 -0.0562033 -0.054284 -0.0905625 -0.0501486 -0.0646123 -0.0622 -0.05516 -0.08748 -0.05784 -0.06322
q_11 -0.0438854 -0.0601108 -0.0760297 -0.0553295 -0.0540342 -0.04962 -0.0636 -0.06915 -0.05914 -0.05042
q_12 -0.0485365 -0.0630065 -0.0738694 -0.0651347 -0.0430275 -0.06223 -0.0677 -0.07671 -0.06979 -0.0371
q_13 -0.0365015 -0.0373799 -0.0987183 -0.056297 -0.0677261 -0.04072 -0.04713 -0.09816 -0.05936 -0.06206
q_14 -0.052981 -0.0681345 -0.089521 -0.0471016 -0.0719836 -0.05765 -0.07734 -0.08885 -0.04879 -0.06449
q_15 -0.075754 -0.0815241 -0.104424 -0.0822994 -0.0904496 -0.08622 -0.089 -0.10072 -0.08411 -0.08674
q_16 -0.104738 -0.103022 -0.114914 -0.09465 -0.110069 -0.1121 -0.11271 -0.10812 -0.09782 -0.10701
q_17 -0.104379 -0.109532 -0.107893 -0.102527 -0.140717 -0.11665 -0.10862 -0.09855 -0.10555 -0.13316
q_18 -0.114129 -0.126352 -0.130915 -0.118341 -0.144824 -0.11786 -0.13386 -0.12829 -0.12019 -0.14362
q_19 -0.134864 -0.145827 -0.140562 -0.136764 -0.181578 -0.1422 -0.15214 -0.13734 -0.13665 -0.18246
q_20 -0.142682 -0.146103 -0.127372 -0.142317 -0.186125 -0.1501 -0.15378 -0.12199 -0.1444 -0.18717
ob_1 -0.00728325 -0.317173 -0.216281 -0.0173109 -0.126277 0.023703 -0.26258 -0.17724 -0.01328 -0.09702
ob_2 -0.047478 -0.138974 -0.148124 -0.124657 -0.060604 -0.03468 -0.14985 -0.14357 -0.10826 -0.03867
pow 0.0156182 0.0182715 0.013838 0.01522 0.0141343 -0.00156 0.000885 -0.00248 -0.00065 -0.00264
p 0.0192897 0.0168683 0.0101271 0.0139623 0.00666853 0.018194 0.016506 0.011543 0.012031 0.00623
m 0.0452764 0.0362408 0.0310298 0.0198048 0.058899 0.048473 0.037121 0.027183
s 0.0308846 0.0527037 0.0517002 0.0307234 0.0431736 0.031675 0.051562 0.049416 0.032058 0.045036
pw 0.0252434 0.05771 0.0390401 0.031007 0.025842 0.060465 0.043076 0.031639
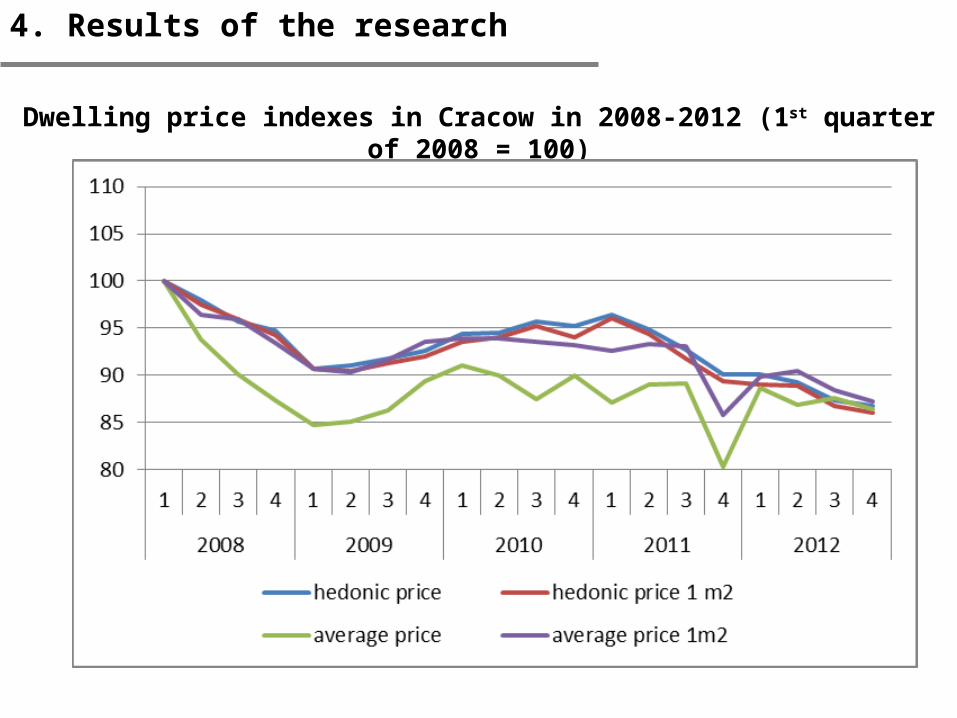
4. Results of the research
Dwelling price indexes in Cracow in 2008-2012 (1st quarter of 2008 = 100)

4. Results of the research
Dwelling price indexes in Lodz in 2008-2012 (1st quarter of 2008 = 100)

4. Results of the research
Dwelling price indexes in Poznan in 2008-2012 (1st quarter of 2008 = 100)
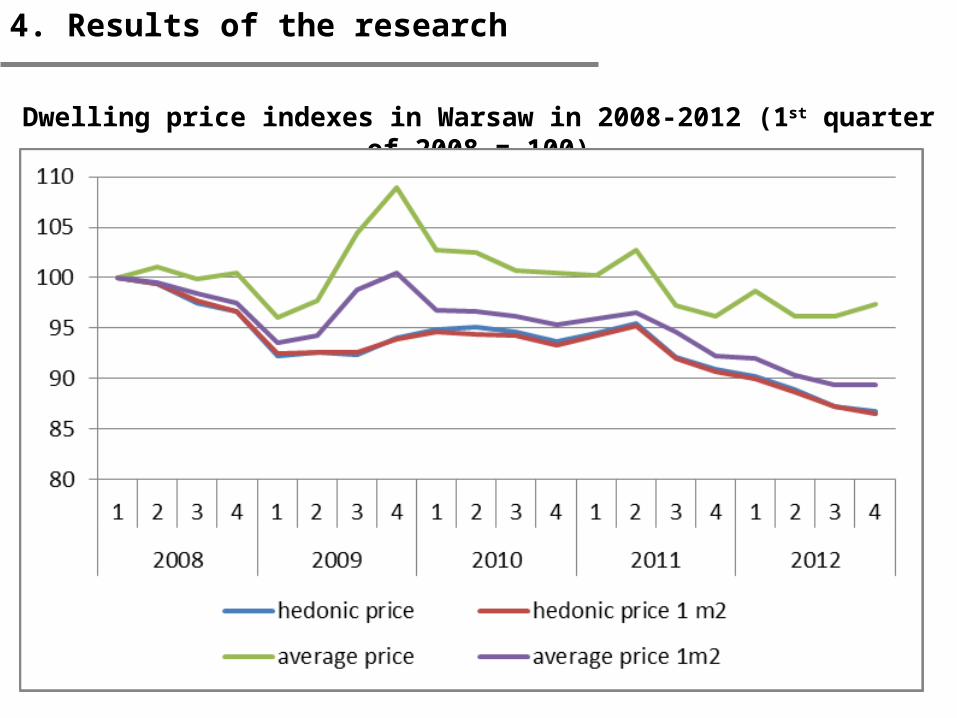
4. Results of the research
Dwelling price indexes in Warsaw in 2008-2012 (1st quarter of 2008 = 100)

4. Results of the research
Dwelling price indexes in Wroclaw in 2008-2012 (1st quarter of 2008 = 100)
4. Results of the research
Conclusion:
• simple methods may bias the results of other research
• hedonic indexes are more stable
• indexes based on these methods, in case of this research, show different results
• if the database does not allow to use complex methods, it is better to estimate
average price or median price of 1 square metre

THANK YOU VERY MUCH FOR YOUR ATTENTION