rtos debugger for symbian os eka1 - lauterbach · rtos debugger for symbian os eka1 1 ©1989-2017...
TRANSCRIPT
RTOS Debugger for Symbian OS EKA1
TRACE32 Online Help
TRACE32 Directory
TRACE32 Index
TRACE32 Documents ......................................................................................................................
RTOS Debuggers ...........................................................................................................................
RTOS Debugger for Symbian OS EKA1 ................................................................................... 1
Overview .................................................................................................................................. 3
Brief Overview of Documents for New Users ....................................................................... 4
Supported Versions ................................................................................................................ 4
Configuration ........................................................................................................................... 5
Manual Configuration 5
Automatic Configuration 6
Quick Configuration Guide 6
Hooks & Internals in Symbian OS 7
Features ................................................................................................................................... 8
Display of Kernel Resources 8
Task Context Display 8
Task Stack Coverage 9
Dynamic Task Performance Measurement 9
Task Runtime Statistics 10
Task State Analysis 11
Function Runtime Statistics 12
Autoloader 13
Static Autoloader 13
Dynamic Autoloader 14
MMU Support 15
Space IDs 15
Scanning System and Processes 16
Symbian OS specific Menu 17
Debugging Symbian OS Kernel and User Processes .......................................................... 18
Symbian OS Kernel 18
Downloading the Kernel 18
Debugging the Kernel Startup 19
Debugging the Kernel 19
User Processes 20
Debugging an .exe Process 21
RTOS Debugger for Symbian OS EKA1 1 ©1989-2017 Lauterbach GmbH

Debugging an .app Application 23
Symbian OS Commands ......................................................................................................... 26
TASK.CHUNK Display chunks 26
TASK.LIBrary Display libraries 27
TASK.PROCess Display processes 27
TASK.TASKState Mark thread state words 28
TASK.THRead Display threads 29
Symbian OS PRACTICE Functions ........................................................................................ 30
Frequently-Asked Questions ................................................................................................. 30
RTOS Debugger for Symbian OS EKA1 2 ©1989-2017 Lauterbach GmbH
RTOS Debugger for Symbian OS EKA1
Overview
Version 06-Nov-2017
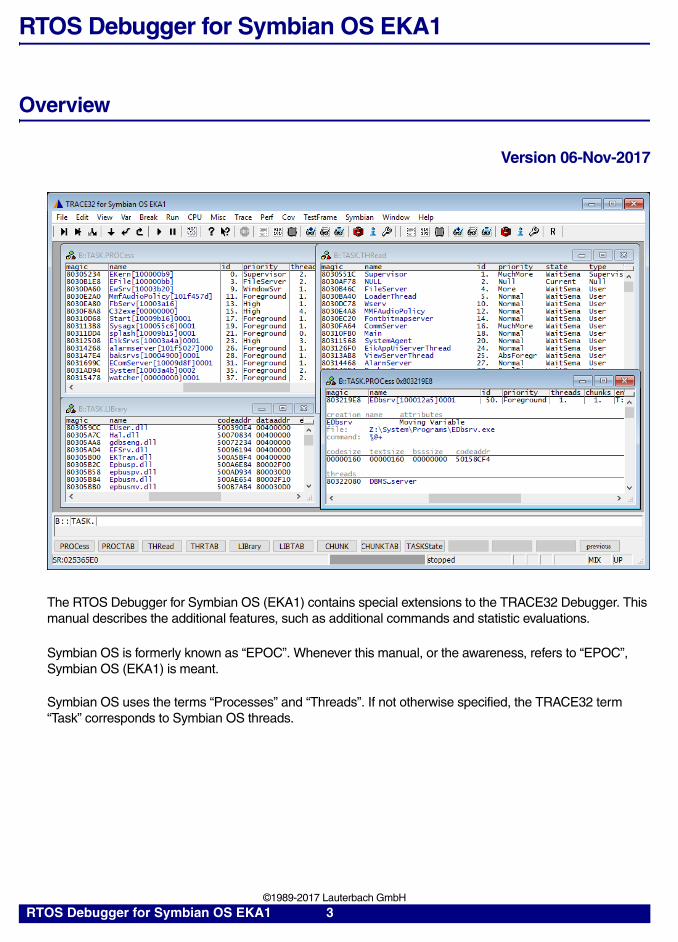
The RTOS Debugger for Symbian OS (EKA1) contains special extensions to the TRACE32 Debugger. This manual describes the additional features, such as additional commands and statistic evaluations.
Symbian OS is formerly known as “EPOC”. Whenever this manual, or the awareness, refers to “EPOC”, Symbian OS (EKA1) is meant.
Symbian OS uses the terms “Processes” and “Threads”. If not otherwise specified, the TRACE32 term “Task” corresponds to Symbian OS threads.
RTOS Debugger for Symbian OS EKA1 3 ©1989-2017 Lauterbach GmbH
Brief Overview of Documents for New Users
Architecture-independent information:
• “Debugger Basics - Training” (training_debugger.pdf): Get familiar with the basic features of a TRACE32 debugger.
• “T32Start” (app_t32start.pdf): T32Start assists you in starting TRACE32 PowerView instances for different configurations of the debugger. T32Start is only available for Windows.
• “General Commands” (general_ref_<x>.pdf): Alphabetic list of debug commands.
Architecture-specific information:
• “Processor Architecture Manuals”: These manuals describe commands that are specific for the processor architecture supported by your debug cable. To access the manual for your processor architecture, proceed as follows:
- Choose Help menu > Processor Architecture Manual.
• “RTOS Debuggers” (rtos_<x>.pdf): TRACE32 PowerView can be extended for operating system-aware debugging. The appropriate RTOS manual informs you how to enable the OS-aware debugging.
Supported Versions
Currently Symbian OS is supported for the following versions:
• Symbian OS EKA1 on ARM/XScale platforms: 6.0, 6.1, 7.0s, 8.0a
RTOS Debugger for Symbian OS EKA1 4 ©1989-2017 Lauterbach GmbH

Configuration
The TASK.CONFIG command loads an extension definition file called “symbian.t32” (directory “~~/demo/<processor>/kernel/symbian”). It contains all necessary extensions.
Automatic configuration tries to locate the Symbian OS internals automatically. For this purpose, the kernel symbols must be loaded and accessible at any time the RTOS debugger is used.
If a system symbol is not available or if another address should be used for a specific system variable then the corresponding argument must be set manually with the appropriate address. In this case, use the manual configuration, which can require some additional arguments.
If you want to have dual port access for the display functions (display ’On The Fly’), you have to map emulation or shadow memory to the address space of all used system tables.
Manual Configuration
Manual configuration is not recommended for the Symbian OS RTOS debugger.
You can set the KDebugger hook address manually.
The KDebugger hook is usually fixed to address 0x40000408. If your image uses another address, specify it as mentioned above.
Format: TASK.CONFIG symbian 0 <kdebuggeraddress>
<kdebuggeraddress> The KDebugger hook is usually fixed to address 0x40000408. If your image uses another address, specify it as mentioned above.
RTOS Debugger for Symbian OS EKA1 5 ©1989-2017 Lauterbach GmbH
Automatic Configuration
For system resource display and trace functionality, you can do an automatic configuration of the RTOS debugger. For this purpose it is necessary, that all system internal symbols are loaded and accessible at any time, the RTOS debugger is used. Each of the task.config arguments can be substituted by '0', which means, that this argument will be searched and configured automatically. For a full automatic configuration, omit all arguments:
If a system symbol is not available, or if another address should be used for a specific system variable, then the corresponding argument must be set manually with the appropriate address (see Manual Configuration).
Quick Configuration Guide
To access all features of the RTOS debugger you should follow the following roadmap:
1. Read carefully the PRACTICE demo start-up script (~~/demo/<processor>/kernel/symbian/symbian.cmm).
2. Make a copy of the PRACTICE script file “symbian.cmm”. Modify the file according to your application.
3. Run the modified version in your application. This should allow you to display the kernel resources and use the trace functions (if available).
Now you can access the Symbian OS extensions through the menu.
In case of any problems, please read carefully the previous Configuration chapters.
Format: TASK.CONFIG symbian
RTOS Debugger for Symbian OS EKA1 6 ©1989-2017 Lauterbach GmbH
Hooks & Internals in Symbian OS
The debugger uses the DPassiveDebugger structures (aka “stop mode debugging” and “KDebugger”) provided by the Symbian OS kernel. You have to ensure, that this module is compiled and linked into the image. In Symbian OS version 6.x and 7.x, this module is called “ka_edbg” and is a part of the e32 kernel. In Symbian OS 8.x, this is an external module called “passivestub”. Ensure, that the include file “src\generic\base\e32\include\u32std.h” defines the macro “__ENABLE_NOTIFY_DEBUGGER__”, and that the passive debugger supports your target. Then build the rom image with _DEBUG (even better: _FULL_DEBUG) and DEBUGGER_SUPPORT defined. An example build command for an intel Lubbock board could be:buildrom -D_FULL_DEBUG -D_SERIAL_DOWNLOAD -DDEBUGGER_SUPPORT lubbock techview
If successfully built, after booting Symbian OS, the address 0x40000408 contains a pointer to the KDebugger structures.
Additionally to the debug tables exported by Symbian OS, the debugger uses several symbols and structures of the kernel. The file “ekern.sym” of the e32 udeb release contains this information. Recompile the e32 module to get the symbol files and load the ekern.sym file into the debugger. See chapter Debugging the Kernel for information how to load the kernel symbols. Please note, that these symbols must be available at any time, the Symbian OS RTOS Debugger is used.
RTOS Debugger for Symbian OS EKA1 7 ©1989-2017 Lauterbach GmbH
Features
The RTOS debugger for Symbian OS supports the following features.
Display of Kernel Resources
The extension defines new PRACTICE commands to display various kernel resources. Information on the following Symbian OS components can be displayed:
For a detailed description of each command refer to the chapter “Symbian OS Commands”.
When working with emulation memory or shadow memory, these resources can be displayed “On The Fly”, i.e. while the target application is running, without any intrusion to the application. If using this dual port memory feature, be sure that emulation memory is mapped to all places, where Symbian OS holds its tables.
When working only with target memory, the information will only be displayed, if the target application is stopped.
Task Context Display
You are able to switch the whole viewing context to a currently not executing task. This means, that all register and stack related information (such as Register, Data.List, Frame etc.) will be shown according to this task. Be aware that this is only for displaying information. When continuing debugging the application (Step or Go), the debugger will switch back to the current context.
For displaying a specific task context, use the command:
Use a magic number, task ID, or task name for <task>. For information about the parameters, see “What to know about Magic Numbers, Task IDs and Task Names” (general_ref_t.pdf).To switch back to the current context, omit all parameters.
For displaying the call stack of a specific task, you can use the following command:
TASK.CHUNK Chunks
TASK.LIBrary Libraries (DLLs)
TASK.PROCess Processes
TASK.THRead Threads
Frame.TASK [<task>] Display task context.
Frame /Task <task> Display call stack of a task.
RTOS Debugger for Symbian OS EKA1 8 ©1989-2017 Lauterbach GmbH
If you’d like to see the application code, where the task was preempted, execute the command Frame /Caller /Task <task> to open a window of the same name. Double click on the line showing the OS service call.
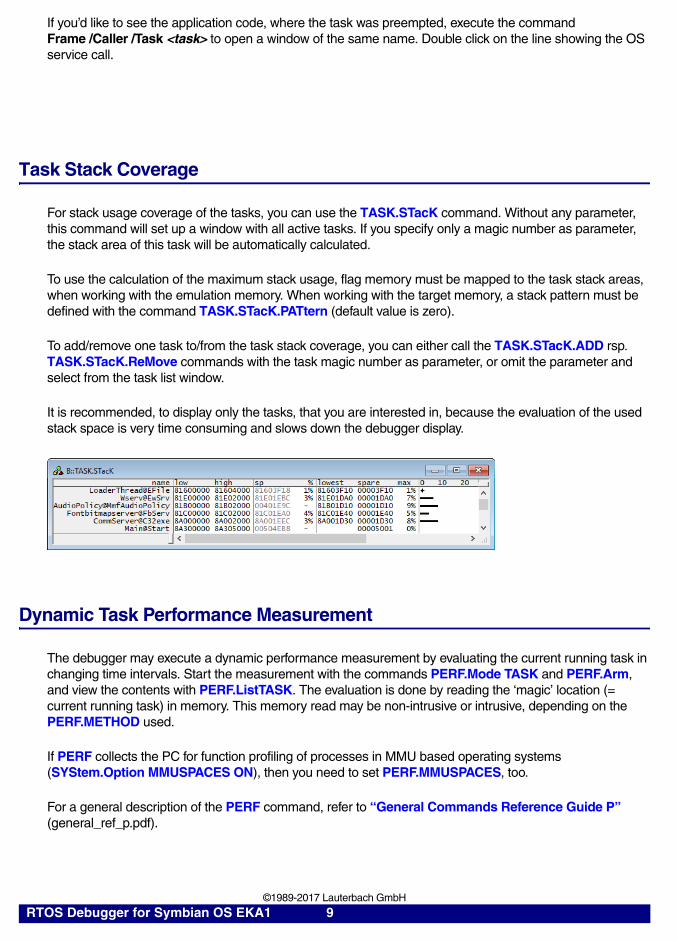
Task Stack Coverage
For stack usage coverage of the tasks, you can use the TASK.STacK command. Without any parameter, this command will set up a window with all active tasks. If you specify only a magic number as parameter, the stack area of this task will be automatically calculated.
To use the calculation of the maximum stack usage, flag memory must be mapped to the task stack areas, when working with the emulation memory. When working with the target memory, a stack pattern must be defined with the command TASK.STacK.PATtern (default value is zero).
To add/remove one task to/from the task stack coverage, you can either call the TASK.STacK.ADD rsp. TASK.STacK.ReMove commands with the task magic number as parameter, or omit the parameter and select from the task list window.
It is recommended, to display only the tasks, that you are interested in, because the evaluation of the used stack space is very time consuming and slows down the debugger display.
Dynamic Task Performance Measurement
The debugger may execute a dynamic performance measurement by evaluating the current running task in changing time intervals. Start the measurement with the commands PERF.Mode TASK and PERF.Arm, and view the contents with PERF.ListTASK. The evaluation is done by reading the ‘magic’ location (= current running task) in memory. This memory read may be non-intrusive or intrusive, depending on the PERF.METHOD used.
If PERF collects the PC for function profiling of processes in MMU based operating systems (SYStem.Option MMUSPACES ON), then you need to set PERF.MMUSPACES, too.
For a general description of the PERF command, refer to “General Commands Reference Guide P” (general_ref_p.pdf).
RTOS Debugger for Symbian OS EKA1 9 ©1989-2017 Lauterbach GmbH
Task Runtime Statistics
Out of the recordings done by the Trace (if available), the debugger is able to evaluate the time spent in a task and display it statistically and graphically. Using this feature requires that the on-chip trace generation logic can generated task information. For details refer to “OS-aware Tracing” (glossary.pdf).
To evaluate the contents of the trace buffer, use these commands:
The start of the recording time, when the calculation doesn’t know, which task is running, is calculated as “(unknown)”.
TRACE32-ICE and TRACE32-FIRE use a completely different mechanism to record task information. See the trigger program below:
Trace.List List.TASK DEFault Display trace buffer and task switches
Trace.STATistic.TASK Display task runtime statistic evaluation
Trace.Chart.TASK Display task runtime timechart
Trace.PROfileSTATistic.TASK Display task runtime within fixed time intervals statistically
Trace.PROfileChart.TASK Display task runtime within fixed time intervals as colored graph
Trace.FindAll Address task.config(magic) Display all data access records to the “magic” location
Trace.FindAll CYcle owner OR CYcle context Display all context ID records
; Mark the magic location with an Alpha breakpointBreak.Set TASK.CONFIG(magic)++(TASK.CONFIG(magicsize)-1) /Alpha
; Program the Analyzer to record only task switchesAnalyzer.ReProgram(
Sample.Enable if AlphaBreak&&Write)
RTOS Debugger for Symbian OS EKA1 10 ©1989-2017 Lauterbach GmbH

Task State Analysis
The time different tasks are in a certain state (running, ready, suspended or waiting) can be evaluated statistically or displayed graphically.
This feature needs recording of all accesses to the status words of all tasks. Additionally, the accesses to the current task pointer (=magic) are needed. Adjust your trace logic to record all data write accesses, or limit the recorded data to the area where all TCBs are located (plus the current task pointer).
To do a selective recording on task states with state analyzers (ICE or FIRE), use TASK.TASKState, if available, to mark the status words with Alpha breakpoints. Run the following PRACTICE script:
To do a selective recording on task states with flow traces (ICD, e.g. ETM and NEXUS trace), just enable the recording of all data write cycles.
To evaluate the contents of the trace buffer, use these commands:
The start of the recording time, when the calculation doesn’t know, which task is running, is calculated as “(unknown)”.
NOTE: This feature is only available, if your debugger equipment is able to trace memory data accesses (program flow trace is not sufficient).
; Mark the magic location with an Alpha breakpointBreak.Set task.config(magic)++(task.config(magicsize)-1) /Alpha
; Mark all task state words with Alpha breakpointsTASK.TASKState
; Program the Analyzer to record task state transitionsAnalyzer.ReProgram(
Sample.Enable if AlphaBreak&&Write)
Trace.STATistic.TASKState Display task state statistic
Trace.Chart.TASKState Display task state timechart
RTOS Debugger for Symbian OS EKA1 11 ©1989-2017 Lauterbach GmbH
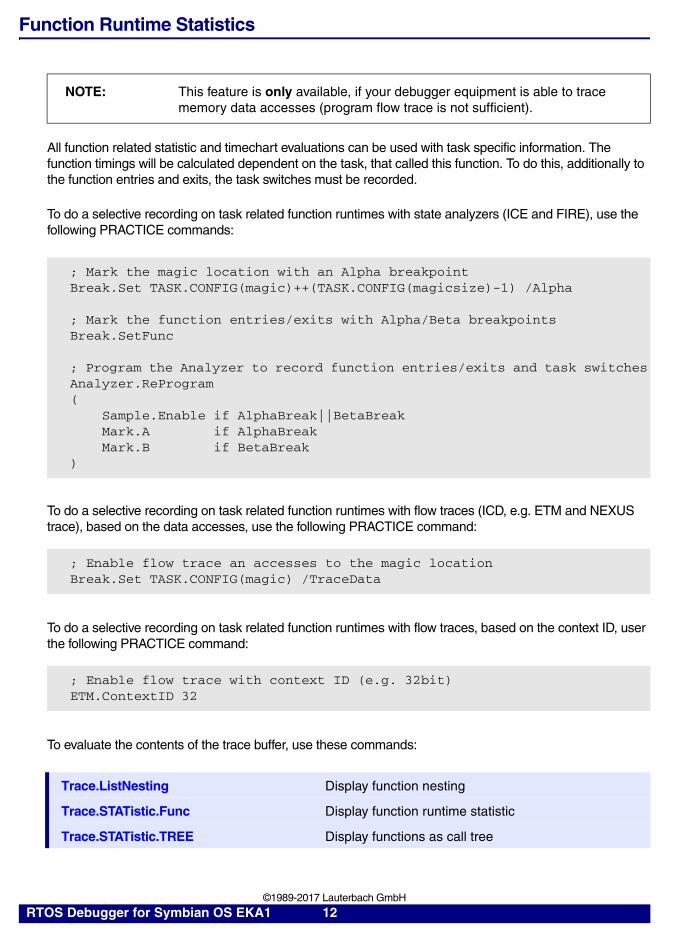
Function Runtime Statistics
All function related statistic and timechart evaluations can be used with task specific information. The function timings will be calculated dependent on the task, that called this function. To do this, additionally to the function entries and exits, the task switches must be recorded.
To do a selective recording on task related function runtimes with state analyzers (ICE and FIRE), use the following PRACTICE commands:
To do a selective recording on task related function runtimes with flow traces (ICD, e.g. ETM and NEXUS trace), based on the data accesses, use the following PRACTICE command:
To do a selective recording on task related function runtimes with flow traces, based on the context ID, user the following PRACTICE command:
To evaluate the contents of the trace buffer, use these commands:
NOTE: This feature is only available, if your debugger equipment is able to trace memory data accesses (program flow trace is not sufficient).
; Mark the magic location with an Alpha breakpointBreak.Set TASK.CONFIG(magic)++(TASK.CONFIG(magicsize)-1) /Alpha
; Mark the function entries/exits with Alpha/Beta breakpointsBreak.SetFunc
; Program the Analyzer to record function entries/exits and task switchesAnalyzer.ReProgram( Sample.Enable if AlphaBreak||BetaBreak Mark.A if AlphaBreak Mark.B if BetaBreak)
; Enable flow trace an accesses to the magic locationBreak.Set TASK.CONFIG(magic) /TraceData
; Enable flow trace with context ID (e.g. 32bit)ETM.ContextID 32
Trace.ListNesting Display function nesting
Trace.STATistic.Func Display function runtime statistic
Trace.STATistic.TREE Display functions as call tree
RTOS Debugger for Symbian OS EKA1 12 ©1989-2017 Lauterbach GmbH

The start of the recording time, when the calculation doesn’t know, which task is running, is calculated as “(unknown)”.
Autoloader
The RTOS Debugger for Symbian OS contains an “Autoloader”, which automatically loads symbol files. The autoloader maintains a list of address ranges, corresponding modules and the appropriate load command. Whenever the user accesses an address within an address range specified in the autoloader, the debugger invokes the according command. The command is usually a call to a PRACTICE script, that handles loading the symbol file to the appropriate addresses.
The command “sYmbol.AutoLoad.List” shows a list of all known address ranges/modules and their symbol load commands.
Static Autoloader
When generating a Symbian OS ROM image (e.g. with “buildrom”), the builder generates a log file as well (usually “rombuild.log”). This log file contains the section addresses of all modules included in the image. The static autoloader reads this log file and fills the autoloader list with the modules found in the log file with it’s appropriate load addresses.
If an address is accessed, that is covered by the autoloader list, the autoloader calls <action> and appends the load addresses of the module to the action. Usually, <action> is a call to a PRACTICE script that handles the parameters and loads the symbols. Please see the example scripts in the demo directory.
NOTE:
• The static autoloader addresses only modules, that are linked into the ROM image. Modules loaded to the target dynamically are not covered.
• The log file does not include the process ID, that a process will get when started. Thus, the static autoloader loads the symbols of a process to space ID zero (see “MMU Support”).
Trace.STATistic.sYmbol /SplitTASK Display flat runtime analysis
Trace.Chart.Func Display function timechart
Trace.Chart.sYmbol /SplitTASK Display flat runtime timechart
Format: sYmbol.AutoLoad.LOADEPOC <logfile> "<action>"
<logfile>: rombuild log file; e.g. “rombuild.log”
<action>: action to take for symbol load, e.g. “do autoload”
RTOS Debugger for Symbian OS EKA1 13 ©1989-2017 Lauterbach GmbH
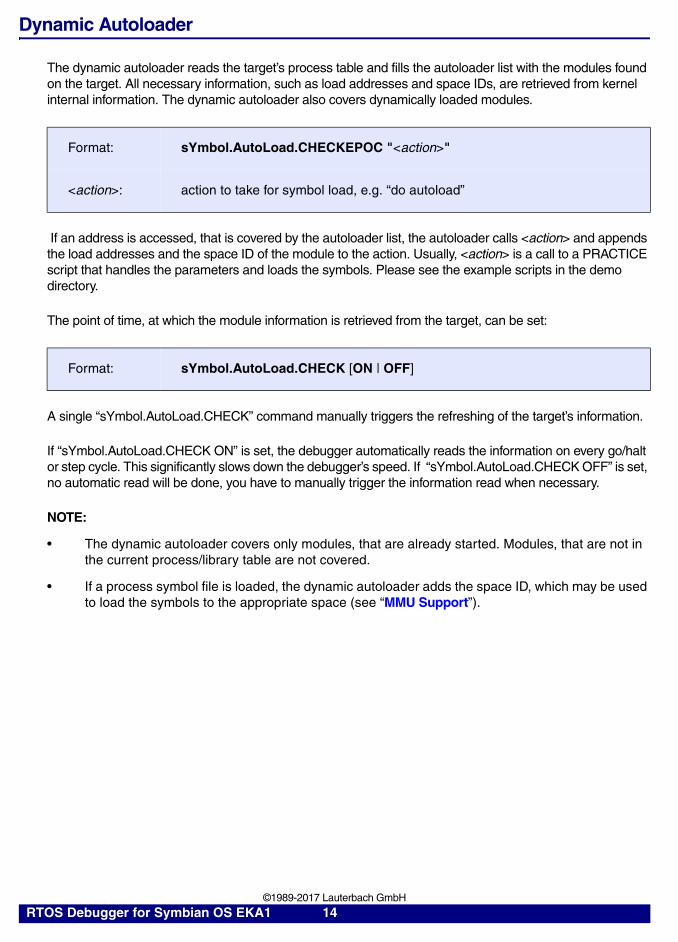
Dynamic Autoloader
The dynamic autoloader reads the target’s process table and fills the autoloader list with the modules found on the target. All necessary information, such as load addresses and space IDs, are retrieved from kernel internal information. The dynamic autoloader also covers dynamically loaded modules.
If an address is accessed, that is covered by the autoloader list, the autoloader calls <action> and appends the load addresses and the space ID of the module to the action. Usually, <action> is a call to a PRACTICE script that handles the parameters and loads the symbols. Please see the example scripts in the demo directory.
The point of time, at which the module information is retrieved from the target, can be set:
A single “sYmbol.AutoLoad.CHECK” command manually triggers the refreshing of the target’s information.
If “sYmbol.AutoLoad.CHECK ON” is set, the debugger automatically reads the information on every go/halt or step cycle. This significantly slows down the debugger’s speed. If “sYmbol.AutoLoad.CHECK OFF” is set, no automatic read will be done, you have to manually trigger the information read when necessary.
NOTE:
• The dynamic autoloader covers only modules, that are already started. Modules, that are not in the current process/library table are not covered.
• If a process symbol file is loaded, the dynamic autoloader adds the space ID, which may be used to load the symbols to the appropriate space (see “MMU Support”).
Format: sYmbol.AutoLoad.CHECKEPOC "<action>"
<action>: action to take for symbol load, e.g. “do autoload”
Format: sYmbol.AutoLoad.CHECK [ON | OFF]
RTOS Debugger for Symbian OS EKA1 14 ©1989-2017 Lauterbach GmbH
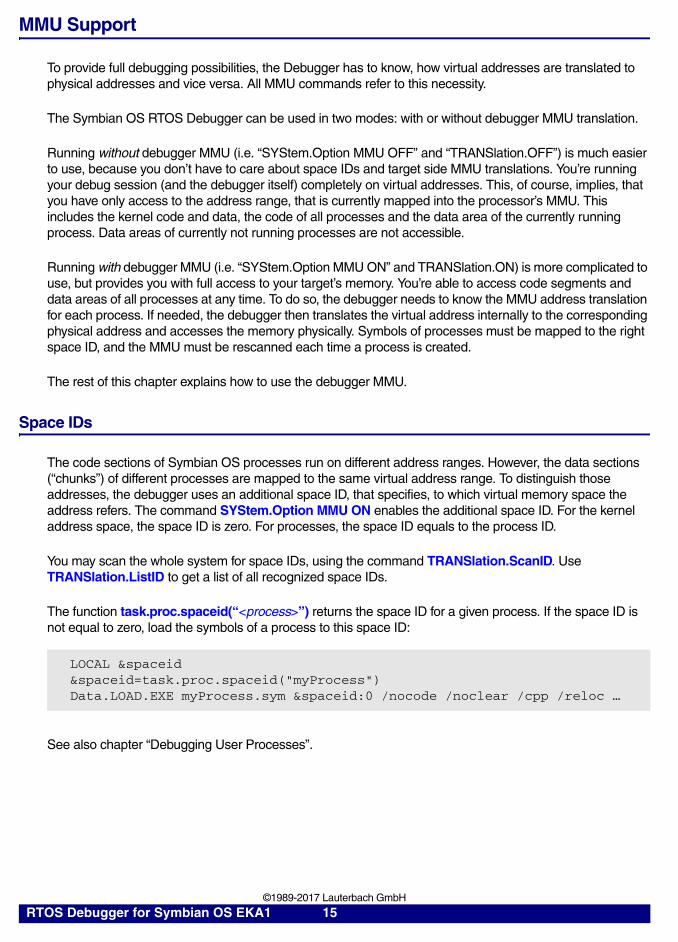
MMU Support
To provide full debugging possibilities, the Debugger has to know, how virtual addresses are translated to physical addresses and vice versa. All MMU commands refer to this necessity.
The Symbian OS RTOS Debugger can be used in two modes: with or without debugger MMU translation.
Running without debugger MMU (i.e. “SYStem.Option MMU OFF” and “TRANSlation.OFF”) is much easier to use, because you don’t have to care about space IDs and target side MMU translations. You’re running your debug session (and the debugger itself) completely on virtual addresses. This, of course, implies, that you have only access to the address range, that is currently mapped into the processor’s MMU. This includes the kernel code and data, the code of all processes and the data area of the currently running process. Data areas of currently not running processes are not accessible.
Running with debugger MMU (i.e. “SYStem.Option MMU ON” and TRANSlation.ON) is more complicated to use, but provides you with full access to your target’s memory. You’re able to access code segments and data areas of all processes at any time. To do so, the debugger needs to know the MMU address translation for each process. If needed, the debugger then translates the virtual address internally to the corresponding physical address and accesses the memory physically. Symbols of processes must be mapped to the right space ID, and the MMU must be rescanned each time a process is created.
The rest of this chapter explains how to use the debugger MMU.
Space IDs
The code sections of Symbian OS processes run on different address ranges. However, the data sections (“chunks”) of different processes are mapped to the same virtual address range. To distinguish those addresses, the debugger uses an additional space ID, that specifies, to which virtual memory space the address refers. The command SYStem.Option MMU ON enables the additional space ID. For the kernel address space, the space ID is zero. For processes, the space ID equals to the process ID.
You may scan the whole system for space IDs, using the command TRANSlation.ScanID. Use TRANSlation.ListID to get a list of all recognized space IDs.
The function task.proc.spaceid(“<process>”) returns the space ID for a given process. If the space ID is not equal to zero, load the symbols of a process to this space ID:
See also chapter “Debugging User Processes”.
LOCAL &spaceid&spaceid=task.proc.spaceid("myProcess")Data.LOAD.EXE myProcess.sym &spaceid:0 /nocode /noclear /cpp /reloc …
RTOS Debugger for Symbian OS EKA1 15 ©1989-2017 Lauterbach GmbH
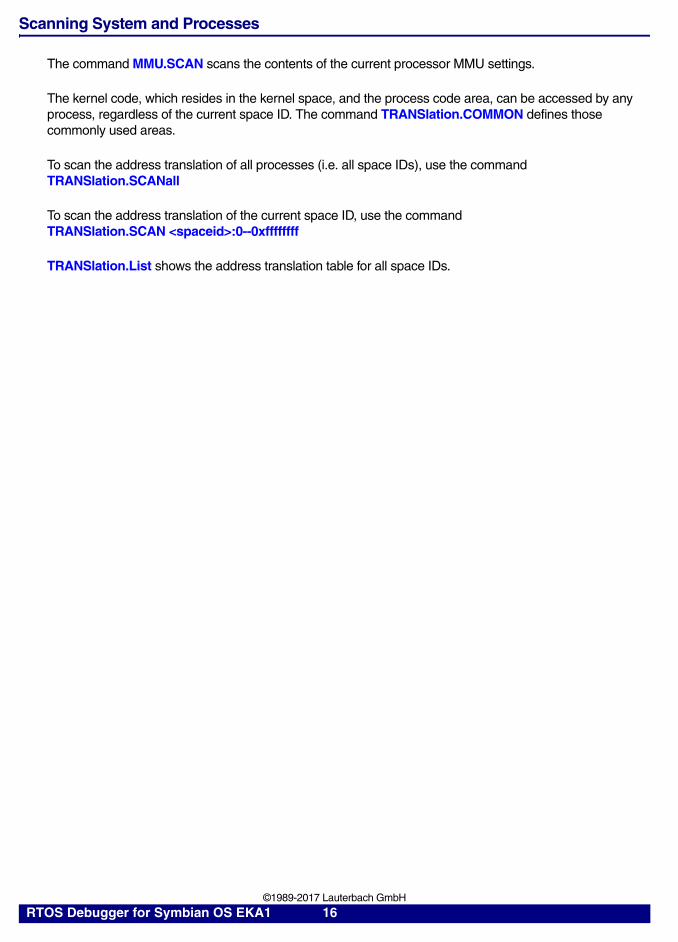
Scanning System and Processes
The command MMU.SCAN scans the contents of the current processor MMU settings.
The kernel code, which resides in the kernel space, and the process code area, can be accessed by any process, regardless of the current space ID. The command TRANSlation.COMMON defines those commonly used areas.
To scan the address translation of all processes (i.e. all space IDs), use the commandTRANSlation.SCANall
To scan the address translation of the current space ID, use the command TRANSlation.SCAN <spaceid>:0--0xffffffff
TRANSlation.List shows the address translation table for all space IDs.
RTOS Debugger for Symbian OS EKA1 16 ©1989-2017 Lauterbach GmbH
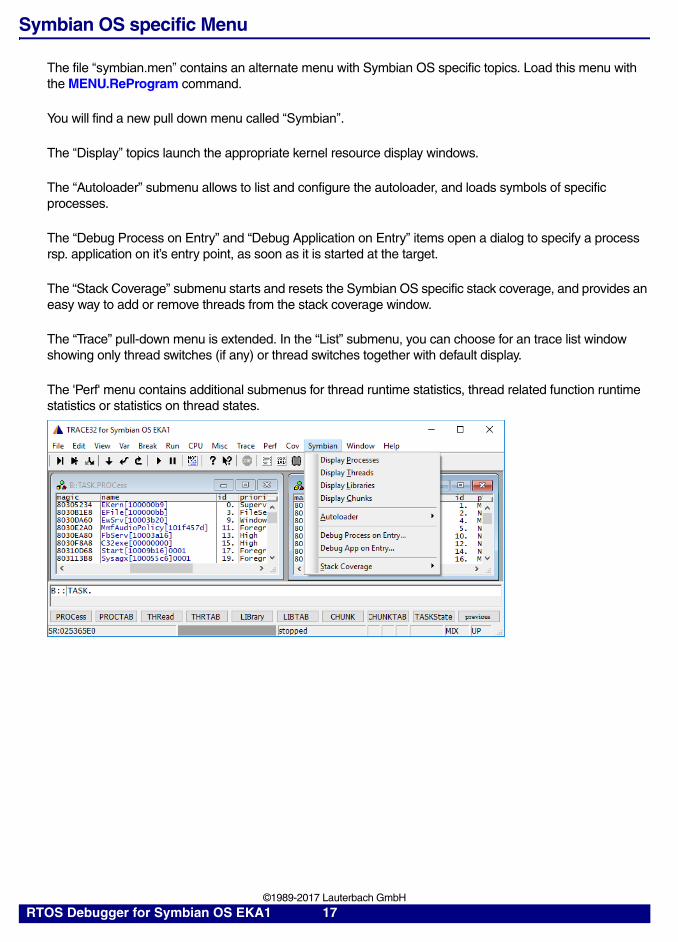
Symbian OS specific Menu
The file “symbian.men” contains an alternate menu with Symbian OS specific topics. Load this menu with the MENU.ReProgram command.
You will find a new pull down menu called “Symbian”.
The “Display” topics launch the appropriate kernel resource display windows.
The “Autoloader” submenu allows to list and configure the autoloader, and loads symbols of specific processes.
The “Debug Process on Entry” and “Debug Application on Entry” items open a dialog to specify a process rsp. application on it’s entry point, as soon as it is started at the target.
The “Stack Coverage” submenu starts and resets the Symbian OS specific stack coverage, and provides an easy way to add or remove threads from the stack coverage window.
The “Trace” pull-down menu is extended. In the “List” submenu, you can choose for an trace list window showing only thread switches (if any) or thread switches together with default display.
The 'Perf' menu contains additional submenus for thread runtime statistics, thread related function runtime statistics or statistics on thread states.
RTOS Debugger for Symbian OS EKA1 17 ©1989-2017 Lauterbach GmbH
Debugging Symbian OS Kernel and User Processes
Symbian OS runs on virtual address spaces. The kernel code and data, and the process code area use a static address translation. The kernel data usually starts at 0x80000000, while the code area (kernel & pro-cesses) usually starts at 0x50000000. Each user process gets its own user data address space when loaded, usually starting from virtual 0x400000, mapped to any physical RAM area, that is currently free. Due to this address translations, debugging the Symbian OS kernel and the user processes requires some set-tings to the Debugger.
To distinguish those different memory mappings, TRACE32 uses “space IDs”, defining individual address translations for each ID. The kernel itself is attached to the space ID zero. Each process that has its own memory space gets a space ID that is equal to its process ID.
See also chapter “MMU Support”.
Symbian OS Kernel
The Symbian OS build process can generates a binary image (usually called “<project>.img”). The Symbian OS awareness additionally needs several kernel symbols, that are stored in the file “ekern.sym”, when com-piling the e32 module. Preserve this file.
Downloading the Kernel
If you start the Symbian OS kernel from Flash, or if you download the kernel via Ethernet, do this as you are doing it without debugging.
If you want to download the kernel image using the debugger, you have to specify, to which address to down-load it. The Symbian OS kernel image is usually located at the physical start address of the RAM (note, that an eventual boot loader may be overwritten).
When downloading a binary image, specify the start address, where to load. E.g., if the physical address starts at 0x0:
Depending on settings of the build process, the image may contain a download header of 0x100 bytes, that is not part of the kernel. When loading such an image, you have to skip this header:
When downloading the kernel via the debugger, remember to set startup options, that the kernel may require, before booting the kernel.
Data.LOAD.Binary project.img 0x0
Data.LOAD.Binary project.img 0x0 /skip 0x100
RTOS Debugger for Symbian OS EKA1 18 ©1989-2017 Lauterbach GmbH
Debugging the Kernel Startup
If you want to debug the kernel startup, right from the bootstrap, load the symbols of your bootstrap image into the debugger, before starting the kernel:
Data.LOAD.EXE rombin.dbg /nocode /noclear /cpp
Note that the kernel image starts with MMU switched off, operating on physical addresses.
Debugging the Kernel
For debugging the kernel itself, and for using the Symbian OS awareness, you have to load the virtual addressed symbols of the kernel into the debugger. The file “ekern.sym”, which resides in your build direc-tory, contains all kernel symbols with virtual addresses.
The symbols have to be relocated to the target’s address configuration. The build process generates a log file called <project>.log in your build directory. This logfile contains all necessary information.
Retrieving the relocation information manually:
Find the "ekern.exe" chapter in your <project>.log file.
Relocate the .text section to the "Code start addr:" and relocate the .data section to "DataBssLinearBase:".
E.g. if your log file contains the following lines:
Then load the kernel symbols with the command (all in one line):
<…>Processing file Epoc32\Release\memupoc\UDEB\ekern.exe[Primary]
Load Address:SizeUids:Entry point:Code start addr:Data start addr:DataBssLinearBase:<…>
5000af9c000432a41000007a 1000008b 100039e2 (ea057669)5000b0205002b0005004d70080000000
Data.LOAD.EXE ekern.sym /nocode /cpp /reloc .text at 5002b000 /reloc .data at 80000000 /reloc .bss after .data
RTOS Debugger for Symbian OS EKA1 19 ©1989-2017 Lauterbach GmbH

Using a script for generating the load command automatically:
The demo directory contains a simple script file called “reloc.cmm” to extract the relocation information from the log file. You may use this script then to load the kernel symbols:
Using the autoloader to load the kernel symbols:
If the autoloader is configured, you can use the autoloader to load the kernel symbols:
Kernel MMU Settings:
(Use only, if debugging with debugger MMU enabled; see chapter “MMU Support”.)
The kernel address space (0x80000000--0xffffffff) and the code areas of the processes (0x50000000--0x7fffffff) are visible to all processes. Specify this address range to be common to all space IDs:
And switch on the debugger MMU translation:
User Processes
Each user process in Symbian OS gets its own virtual memory space. To distinguish the different memory spaces, the debugger assigns a “space ID”, which is equal to the process ID. Using this space ID, it is possi-ble to address a unique memory location, even if several processes use the same virtual address.
The address range of the process differs from the address range given from the symbol file. The addresses of the symbol file must be relocated to the used virtual addresses.
Note, that at every time the Symbian awareness is used, it needs the kernel symbols. Please see the chap-ters above, how to load them. Hence, load all process symbols with the option /noclear, to preserve the kernel symbols.
do reloc rombuild.log ekern.exeentry &codeaddr &dataaddrData.LOAD.EXE ekern.sym /nocode /cpp /reloc .text at &codeaddr /reloc .data at &dataaddr /reloc .bss after .data
sYmbol.AutoLoad.LOADEPOC rombuild.log "do autoload "sYmbol.AutoLoad.TOUCH "*ekern.exe*"
TRANSlation.COMMON 0x50000000--0xffffffff
TRANSlation.ON
RTOS Debugger for Symbian OS EKA1 20 ©1989-2017 Lauterbach GmbH
Debugging an .exe Process
To correlate the symbols of an user process with the virtual addresses of this process, it is necessary to load the symbols into this space ID, relocate them into the appropriate address range and scan the process’ MMU settings.
Manually Load Process Symbols:
For example, if you’ve got a process called “hello”:
See chapter “Symbian OS PRACTICE Functions” for the above used functions.
Additionally, you have to scan the MMU translation table of this process:
It is possible, to scan the translation tables of all processes at once. On some processors, and depending on your number of active processes, this may take a very long time. In this case use the scanning of single processes, mentioned above. Scanning all processes:
Automatically Load Process Symbols:
You can use the autoloader to load the symbols of a process.
To force the autoloader to load a symbol file:
If the dynamic autoloader loaded the symbols, it already loaded it to the right space ID and scanned the MMU. If the symbols were loaded by the static autoloader, you may have to relocate the space ID and scan the MMU manually.
See also chapter “Autoloader”.
&codeaddr=task.proc.codeaddr(“hello”)&dataaddr=task.proc.dataaddr(“hello”)&spaceid=task.proc.spaceid(“hello”)Data.LOAD.EXE hello.sym &spaceid:0 /nocode /noclear /cpp /reloc .text at &codeaddr /reloc .data at &dataaddr /reloc .bss after .data
MMU.SCAN &spaceid:0--0xffffffff ; scan MMU of process
MMU.SCAN ALL ; scan MMU entries of all; processes
sYmbol.AutoLoad.TOUCH “*hello.exe*” ; load symbols
RTOS Debugger for Symbian OS EKA1 21 ©1989-2017 Lauterbach GmbH
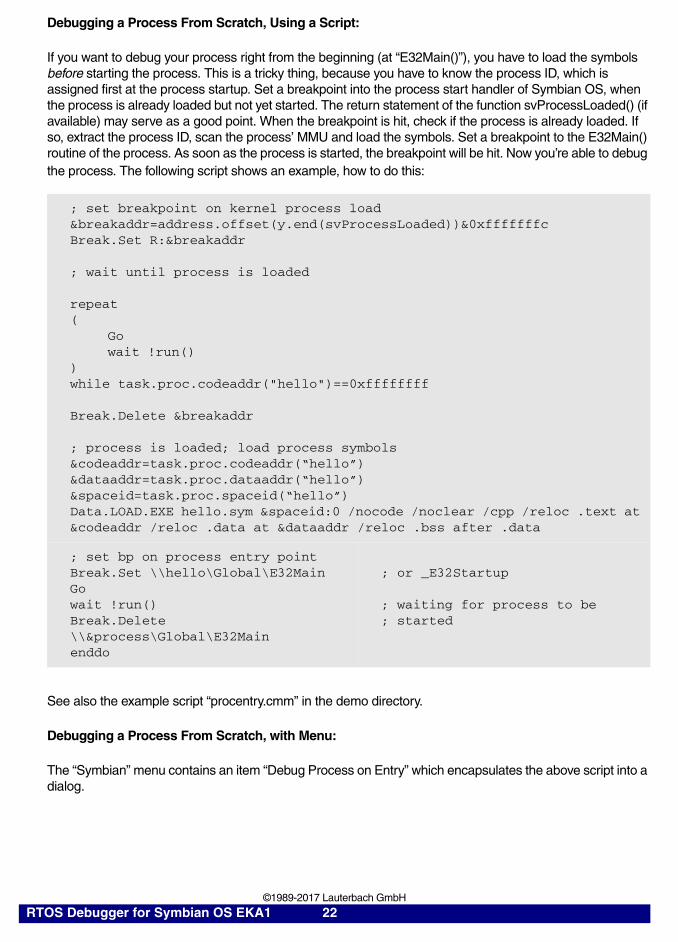
Debugging a Process From Scratch, Using a Script:
If you want to debug your process right from the beginning (at “E32Main()”), you have to load the symbols before starting the process. This is a tricky thing, because you have to know the process ID, which is assigned first at the process startup. Set a breakpoint into the process start handler of Symbian OS, when the process is already loaded but not yet started. The return statement of the function svProcessLoaded() (if available) may serve as a good point. When the breakpoint is hit, check if the process is already loaded. If so, extract the process ID, scan the process’ MMU and load the symbols. Set a breakpoint to the E32Main() routine of the process. As soon as the process is started, the breakpoint will be hit. Now you’re able to debug the process. The following script shows an example, how to do this:
See also the example script “procentry.cmm” in the demo directory.
Debugging a Process From Scratch, with Menu:
The “Symbian” menu contains an item “Debug Process on Entry” which encapsulates the above script into a dialog.
; set breakpoint on kernel process load&breakaddr=address.offset(y.end(svProcessLoaded))&0xfffffffcBreak.Set R:&breakaddr
; wait until process is loaded
repeat(
Gowait !run()
)while task.proc.codeaddr("hello")==0xffffffff
Break.Delete &breakaddr
; process is loaded; load process symbols&codeaddr=task.proc.codeaddr(“hello”)&dataaddr=task.proc.dataaddr(“hello”)&spaceid=task.proc.spaceid(“hello”)Data.LOAD.EXE hello.sym &spaceid:0 /nocode /noclear /cpp /reloc .text at &codeaddr /reloc .data at &dataaddr /reloc .bss after .data
; set bp on process entry pointBreak.Set \\hello\Global\E32MainGowait !run()Break.Delete \\&process\Global\E32Mainenddo
; or _E32Startup
; waiting for process to be; started
RTOS Debugger for Symbian OS EKA1 22 ©1989-2017 Lauterbach GmbH

Debugging an .app Application
To correlate the symbols of an user application with the virtual addresses of this process, it is necessary to load the symbols into this space ID, relocate them into the appropriate address range and scan the process’ MMU settings.
Manually Load Application Symbols:
For example, if you’ve got an application called “hello” with the process ID 12:
See chapter “Symbian OS PRACTICE Functions” for the above used functions.
Additionally, you have to scan the MMU translation table of this application:
It is possible, to scan the translation tables of all applications at once. On some processors, and depending on your number of active applications, this may take a very long time. In this case use the scanning of single applications, mentioned above. Scanning all applications:
Automatically Load Process Symbols:
You can use the autoloader to load the symbols of an application.
To force the autoloader to load a symbol file:
If the dynamic autoloader loaded the symbols, it already loaded it to the right space ID and scanned the MMU. If the symbols were loaded by the static autoloader, you may have to relocate the space ID and scan the MMU manually.
See also chapter “Autoloader”.
&codeaddr=task.lib.codeaddr(“hello”)&dataaddr=task.lib.dataaddr(“hello”)&spaceid=task.proc.spaceid(“hello”)Data.LOAD.EXE hello.sym &spaceid:0 /nocode /noclear /cpp /reloc .text at &codeaddr /reloc .data at &dataaddr /reloc .bss after .data
MMU.SCAN &spaceid:0--0xffffffff ; scan MMU of application
MMU.SCAN ALL ; scan MMU entries of all processes
sYmbol.AutoLoad.TOUCH “*hello*” ; load symbols
RTOS Debugger for Symbian OS EKA1 23 ©1989-2017 Lauterbach GmbH
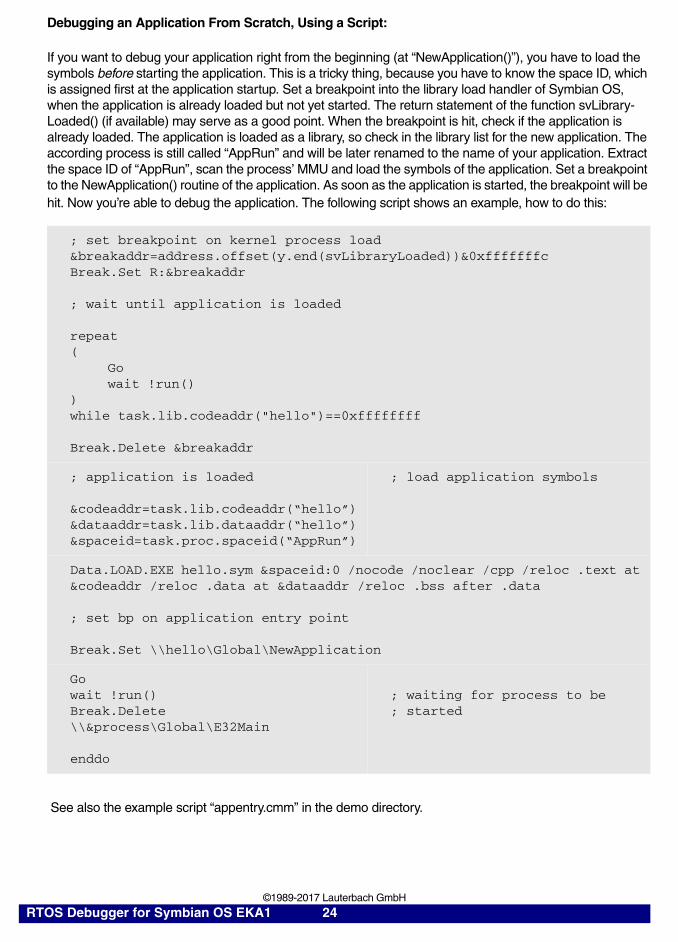
Debugging an Application From Scratch, Using a Script:
If you want to debug your application right from the beginning (at “NewApplication()”), you have to load the symbols before starting the application. This is a tricky thing, because you have to know the space ID, which is assigned first at the application startup. Set a breakpoint into the library load handler of Symbian OS, when the application is already loaded but not yet started. The return statement of the function svLibrary-Loaded() (if available) may serve as a good point. When the breakpoint is hit, check if the application is already loaded. The application is loaded as a library, so check in the library list for the new application. The according process is still called “AppRun” and will be later renamed to the name of your application. Extract the space ID of “AppRun”, scan the process’ MMU and load the symbols of the application. Set a breakpoint to the NewApplication() routine of the application. As soon as the application is started, the breakpoint will be hit. Now you’re able to debug the application. The following script shows an example, how to do this:
See also the example script “appentry.cmm” in the demo directory.
; set breakpoint on kernel process load&breakaddr=address.offset(y.end(svLibraryLoaded))&0xfffffffcBreak.Set R:&breakaddr
; wait until application is loaded
repeat(
Gowait !run()
)while task.lib.codeaddr("hello")==0xffffffff
Break.Delete &breakaddr
; application is loaded
&codeaddr=task.lib.codeaddr(“hello”)&dataaddr=task.lib.dataaddr(“hello”)&spaceid=task.proc.spaceid(“AppRun”)
; load application symbols
Data.LOAD.EXE hello.sym &spaceid:0 /nocode /noclear /cpp /reloc .text at &codeaddr /reloc .data at &dataaddr /reloc .bss after .data
; set bp on application entry point
Break.Set \\hello\Global\NewApplication
Gowait !run()Break.Delete \\&process\Global\E32Main
enddo
; waiting for process to be; started
RTOS Debugger for Symbian OS EKA1 24 ©1989-2017 Lauterbach GmbH
Debugging an Application From Scratch, with Menu:
The “Symbian” menu contains an item “Debug Application on Entry” which encapsulates the above script into a dialog.
RTOS Debugger for Symbian OS EKA1 25 ©1989-2017 Lauterbach GmbH

Symbian OS Commands
TASK.CHUNK Display chunks
Displays the chunk table of Symbian OS or detailed information about one specific chunk.
Without any arguments, a table with all created chunks will be shown. Specify a chunk magic number or a chunk name to display detailed information on that chunk.
“magic” is a unique ID, used by the RTOS debugger to identify a specific chunk.
The fields “magic”, “name” and “owner” are mouse sensitive, double clicking on them opens appropriate windows.
Format: TASK.CHUNK <chunk>
RTOS Debugger for Symbian OS EKA1 26 ©1989-2017 Lauterbach GmbH

TASK.LIBrary Display libraries
Displays the library table of Symbian OS or detailed information about one specific library.
Without any arguments, a table with all created libraries will be shown. Specify a library magic number or a library name to display detailed information on that library.
“magic” is a unique ID, used by the RTOS debugger to identify a specific library.
The fields “magic”, “name”, “codeaddr”, “dataddr” end “entry” are mouse sensitive, double clicking on them opens appropriate windows.
TASK.PROCess Display processes
Displays the process table of Symbian OS or detailed information about one specific thread.
Format: TASK.LIBrary <library>
Format: TASK.PROCess <process>
RTOS Debugger for Symbian OS EKA1 27 ©1989-2017 Lauterbach GmbH
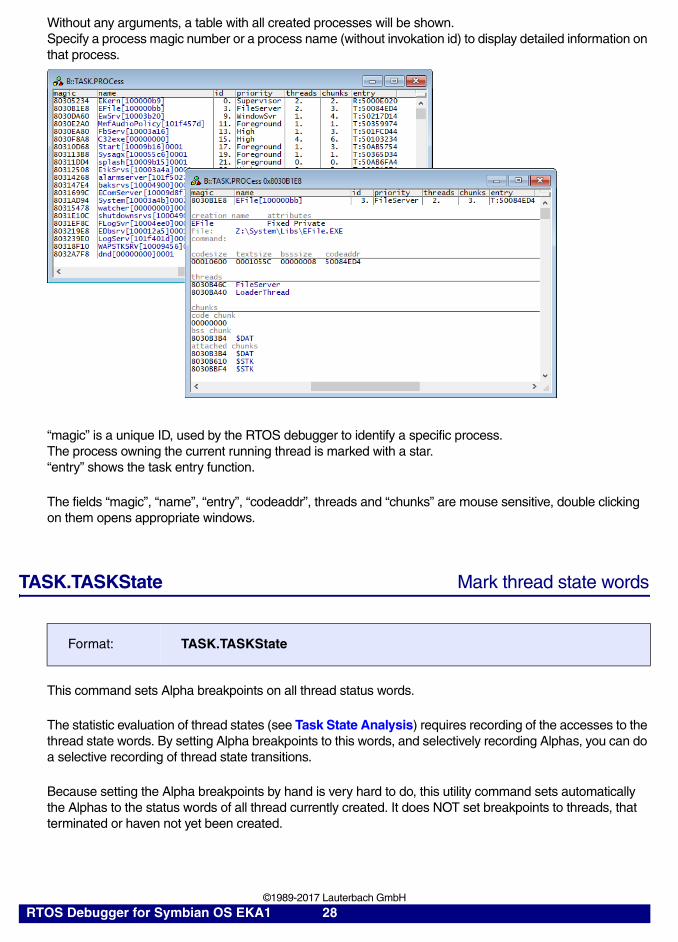
Without any arguments, a table with all created processes will be shown. Specify a process magic number or a process name (without invokation id) to display detailed information on that process.
“magic” is a unique ID, used by the RTOS debugger to identify a specific process.The process owning the current running thread is marked with a star.“entry” shows the task entry function.
The fields “magic”, “name”, “entry”, “codeaddr”, threads and “chunks” are mouse sensitive, double clicking on them opens appropriate windows.
TASK.TASKState Mark thread state words
This command sets Alpha breakpoints on all thread status words.
The statistic evaluation of thread states (see Task State Analysis) requires recording of the accesses to the thread state words. By setting Alpha breakpoints to this words, and selectively recording Alphas, you can do a selective recording of thread state transitions.
Because setting the Alpha breakpoints by hand is very hard to do, this utility command sets automatically the Alphas to the status words of all thread currently created. It does NOT set breakpoints to threads, that terminated or haven not yet been created.
Format: TASK.TASKState
RTOS Debugger for Symbian OS EKA1 28 ©1989-2017 Lauterbach GmbH
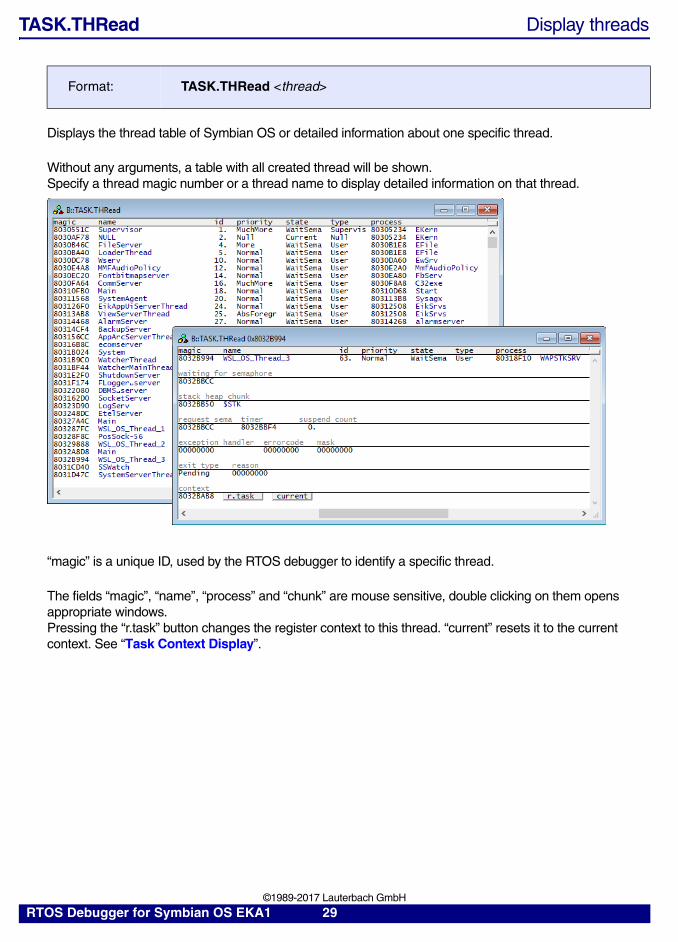
TASK.THRead Display threads
Displays the thread table of Symbian OS or detailed information about one specific thread.
Without any arguments, a table with all created thread will be shown. Specify a thread magic number or a thread name to display detailed information on that thread.
“magic” is a unique ID, used by the RTOS debugger to identify a specific thread.
The fields “magic”, “name”, “process” and “chunk” are mouse sensitive, double clicking on them opens appropriate windows.Pressing the “r.task” button changes the register context to this thread. “current” resets it to the current context. See “Task Context Display”.
Format: TASK.THRead <thread>
RTOS Debugger for Symbian OS EKA1 29 ©1989-2017 Lauterbach GmbH
Symbian OS PRACTICE Functions
There are special definitions for Symbian OS specific PRACTICE functions.
Frequently-Asked Questions
No information available
TASK.CONFIG(magic) Returns the address for the magic number
TASK.CONFIG(magicsize) Returns the size of the magic number (1, 2 or 4)
TASK.LIB.CODEADDR(<libname>) Returns the code address of the library
TASK.LIB.DATAADDR(<libname>) Returns the data address of the library
TASK.LIB.ENTRY(<libname>) Returns the entry point of the library
TASK.LIB.LIST(<magic_number>) Returns next library in list.Specify zero for the first library.
TASK.LIB.NAME(<magic_number>) Returns the name of the library
TASK.PROC.CODEADDR(<procname>) Returns the code address of the process
TASK.PROC.DATAADDR(<procname>) Returns the data address of the process
TASK.PROC.ENTRY(<procname>) Returns the entry point of the process
TASK.PROC.LIST(<magic_number>) Returns next process in list.Specify zero for the first process
TASK.PROC.NAME(<magic_number>) Returns the name of the process
TASK.PROC.SPACEID(<procname>) Returns the space ID of the process
RTOS Debugger for Symbian OS EKA1 30 ©1989-2017 Lauterbach GmbH