r.t the phoenix ,..,-mills limited - amazon s3
TRANSCRIPT

August 7, 2019
BSE Limited Phiroze Jeejeebhoy Towers Dalal Street, Fort, Mumbai- 400 001
Securi code: 503100
Dear Sir(s),
� r.t THE PHOENIX ,..,- MILLS LIMITED Corp. Office : Shree Laxmi Woolen Mills Estate, 2nd Fir., R.R Hosiery, Off. Dr. E. Moses Rd. Mahalaxmi, Mumbai - 400 011Tel: (022) 3001 6600 Fax: (022) 3001 6601 www.thephoenixmills.co1n
National Stock Exchange of India Limited Exchange Plaza, Bandra-Kurla Complex, Bandra East, Mumbai- 400051
Symbol: PHOENIXL TD
Sub: lnve tors' Pres ntati non Unaudited Standalone and Consolidated Financial Results
for first quarter ended lune 30, 2019
Pursuant to Regulation 30 and Para A of Part A of Schedule Ill of the SEBI (Listing Obligations and Disclosure Requirements) Regulations, 2015, we enclose herewith the presentation on Unaudited Standalone and Consolidated Financial Results for the first quarter ended on June 30, 2019, to be made to investors and analysts.
The same is also being uploaded on the Company's website http://www.thephoenixmHls.com in compliance with regulation 46(2) of the Listing Regulations.
You are requested to take the aforesaid information on your record and acknowledge the receipt.
��v,�.Gajendra Mewara Company Secretary and Compliance Officer
Regd. Office : The Phoenix Mills Ltd., 8th Floor, Palladium, 462, Senapati Bapat Marg, Lower Parel, Mumbai 400 013. Tel: (022) 2496 4307 / 8 / SJ.Jax: l()22) 2493 8388'\·

Investor Presentation
Q1 FY20 Results
Phoenix MarketCity Chennai

Certain statements in this communication may be ‘forward looking statements’ within the meaning of applicable
laws and regulations. These forward-looking statements involve a number of risks, uncertainties and other factors
that could cause actual results to differ materially from those suggested by the forward-looking statements.
Important developments that could affect the Company’s operations include changes in the industry structure,
significant changes in political and economic environment in India and overseas, tax laws, import duties, litigation
and labour relations.
The Phoenix Mills Ltd. (PML) will not be in any way responsible for any action taken based on such statements and
undertakes no obligation to publicly update these forward-looking statements to reflect subsequent events or
circumstances.
Disclaimer
2

Q1 FY20 Highlights Overview and Strategy Financial ResultsBusiness Performance Annexure
High Street Phoenix & Palladium

Q1 FY20 Operational Highlights
Operational
Retail consumption increased by 5% yoy to Rs. 17,815 mn in Q1 FY20
Retail rental Income is up 7% yoy in Q1 FY20 at Rs. 2,596 mn; Retail EBITDA came in
strong at Rs. 2,556 mn, up 8% yoy for Q1 FY20
PMC Mumbai, PMC Pune, PMC Bangalore were the top performing retail assets
demonstrating strong consumption and rental income growth
Commercial Offices reported income of Rs. 250 mn in Q1 FY20, up 68% yoy;
The St. Regis reported EBITDA of Rs. 253 mn, up 5% yoy in Q1 FY20 while Courtyard
by Marriott reported a strong growth in revenues, up 36% led by robust occupancy
during the quarter
We received occupation certificate for Tower 6 in our One Bangalore West residential
development (saleable area of 0.26 msft) in Q1 FY20. We received a very positive
response to the launch of Tower 7 at One Bangalore West in July 2019.
4
Retail Rental Rs. 2,596 mn
ConsumptionRs. 17,815 mn 5%
7%
Retail EBITDARs. 2,566 mn 8%

Q1 FY20 ConsolEBITDARs. 2,927 mn
Q1 FY20 Financial Highlights
Financial
5
Q1 FY20 RevenueRs. 6,150 mn 49%
Q1 FY20 Consol PATRs. 1,304 mn 118%
Q1 FY20 Consolidated Income from operations is up 49% YoY to Rs. 6,150 mn
Q1 FY20 Consolidated Profit after tax & minority interest is up 118% YoY to Rs. 1,304 mn
Our residential business contributed revenue recognition of Rs. 2,071 mn and PAT of Rs.
496 mn (after minority interest; this is majorly on account of receipt of Occupation
Certificate for Tower 6 at One Bangalore West)
Excluding the contribution from the residential business, PAT from our core annuity
income generating businesses of retail, hospitality & commercial offices was at Rs. 808
mn in Q1 FY20, up 40% yoy
50%

Q1 FY20 Highlights Overview and Strategy Financial ResultsBusiness Performance Annexure
High Street Phoenix & Palladium, Mumbai

Our Annuity Income-Generating Portfolio
MALL PORTFOLIO(5.93 MSF)
HSP & Palladium Mumbai 0.74
Phoenix MarketCity Chennai 1.00
Palladium Chennai 0.22
Phoenix MarketCity Pune 1.19
Phoenix MarketCity Bangalore 1.00
Phoenix MarketCity Mumbai 1.14
Phoenix United Lucknow 0.33
Phoenix United Bareilly 0.31
HOTEL PORTFOLIO(588 KEYS)
The St. Regis Mumbai 395
Courtyard by Marriot Agra 193
OFFICE PORTFOLIO (0.96 MSF)
Fountainhead – Tower 2 & 3
Pune 0.54
Phoenix MarketCity Chennai 0.42
OFFICE PORTFOLIO (1.80 MSF)
Phoenix Paragon Plaza Mumbai 0.42
The Centrium Mumbai 0.28
Art Guild House Mumbai 0.80
Phoenix House Mumbai 0.14
Fountainhead – Tower 1 Pune 0.16
OPERATIONAL PORTFOLIO PORTFOLIO UNDER DEVELOPMENT
MALL PORTFOLIO (4.90 MSF)
Phoenix MarketCityWakad
Pune 1.1
Phoenix MarketCityHebbal
Bengaluru 1.2
Phoenix MarketCity Indore 1.0
Phoenix MarketCity Lucknow 0.9
Palladium Ahmedabad 0.7
7Diversified annuity revenue streams ensuring robust long term cashflow visibility

Our Portfolio under Development & Planning
PROJECT NAME Retail OfficeBalance
Development Potential
Total
Portfolio Under Planning
High Street Phoenix (Project Rise) 0.50 1.10+ - 1.60
Phoenix Marketcity Bangalore, Whitefield 0.35 1.00 0.40 1.75
Phoenix Marketcity Pune, Wakad - 0.50 0.30 0.80
Phoenix Marketcity Bangalore, Hebbal - 0.60 - 0.60
Total 0.85 3.20 0.70 4.75
8
PROJECT NAME Retail OfficeBalance
Development Potential
Total
Retail Portfolio Under-development 4.90 -See table on
previous page4.90
Office Portfolio Under-development
Fountainhead Towers 2-3, Pune - 0.55 - 0.55
Commercial offices on top of Palladium Chennai
- 0.42 - 0.42
Total 4.90 0.96 - 5.86

Portfolio Summary
Particulars Retail (msf) Office (msf) Hotel Total
Current Operational Assets 5.90 1.32 588 keys 7.22
Under development Portfolio 4.90 0.96 - 5.86
Portfolio under Planning 0.85 3.00 - 3.85
Total 11.65 5.28 588 keys 16.93
9
Retail Office
2.0x 4.0xAsset-wise portfolio
growth post completion of all under-construction & planned developments

Our Residential Development Portfolio
Kessaku One Bangalore West RESIDENTIAL PORTFOLIO
10
ProjectTotal Area
(msf)
Area launched
(msf)
Balance area (msf)
Launched in July 2019
One Bangalore West - Towers 7
0.24 0.24 -
Under Planning
One Bangalore West - Towers 8-9
0.48 - 0.48
ProjectTotal area
(msf)
COMPLETED
One Bangalore West - Towers 1-5 1.23
One Bangalore West - Tower 6 0.26
Kessaku, Bengaluru 0.99
Crest A,B,C 0.53
Total 3.01
Grand Total 3.72
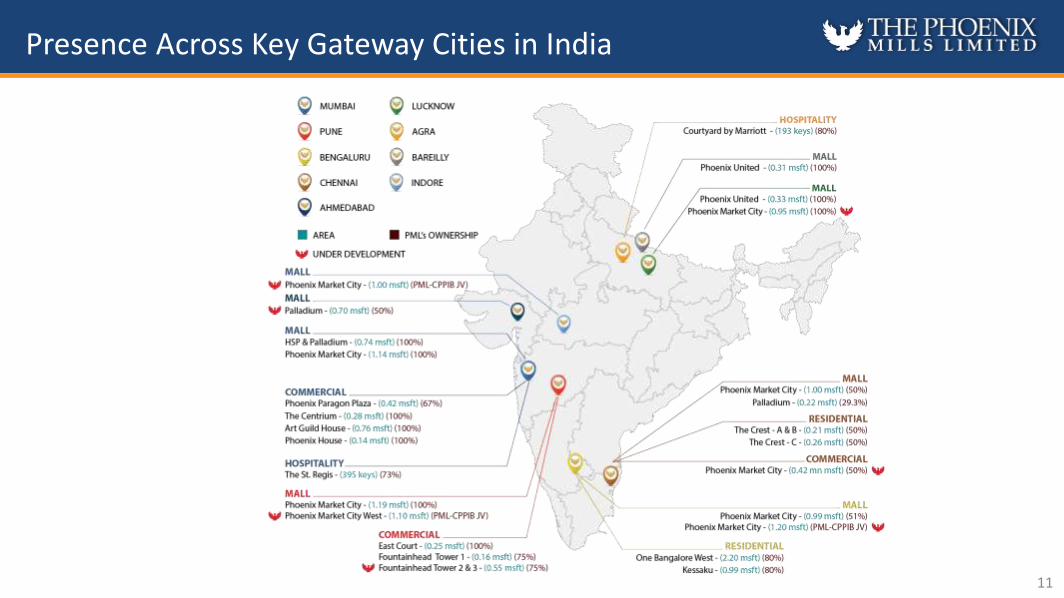
Presence Across Key Gateway Cities in India
11

• Experienced management team with track record of successful execution• Financial flexibility to execute marquee deals, securing future growth
The PML Advantage
Annuity-led Business Model
• 81% of FY19 revenues from annuity-led businesses: Retail, Commercial and Hotel• 19% of FY19 revenues from Residential development
Active Mall Management
• Attract right brand mix and locate them in right zones• Partner with retailers to optimal consumption, rentals and growth• Constantly upgrading the mall by changing the lights, flooring, décor, creating special zones.
Synergies from Mixed-use
Development
• Retail-led mixed use developments, in tune with modern consumer lifestyles (work-life-play)• Synergies of a sticky consumer base within the catchment area of our malls
‘Go-to’ Destination
Malls
• Large format retail-led developments with focus on creating ‘go-to’ destinations for entertainment,shopping and dining
• Complete experience enables more time spent in the mall, driving higher consumption
Execution Capabilities
12

Q1 FY20 Highlights Overview and Strategy Financial ResultsBusiness Performance Annexure
High Street Phoenix & Palladium

Q1 FY20 Standalone P&L
(Rs. mn) Q1 FY20 Q1 FY19YoY %
Change FY19
Income from operations 1,133 1,092 4% 4,403
EBITDA 700 688 2% 2,686
EBITDA Margin (%) 62% 63% 61%
Profit Before Tax and exceptional item
458 447 3% 2,093
Profit after tax & before comprehensive income
356 347 3% 1,731
Diluted EPS (Rs.) 2.32 2.26 3% 11.26
14
Q1 FY20 PATRs. 356 mn
Q1 FY20 EBITDARs. 700 mn
3%
2%

Q1 FY20 Consolidated P&L
(Rs. mn) Q1 FY20 Q1 FY19YoY %
Change FY19
Income from operations 6,150 4,132 49% 19,816
Retail 3,046 2,905 5% 11,551
Residential 2,071 281 637% 3,795
Commercial 250 149 68% 881
Hospitality & Others 783 797 -2% 3,589
EBITDA 2,927 1,953 50% 9,931
EBITDA Margin (%) 48% 47% 50%
Profit after tax 1,469 543 170% 4,617
PAT after minority interest & before other comprehensive income
1,304 597 118% 4,210
PAT after minority interest & after other comprehensive income
1,077 889 21% 4,379
Diluted EPS (Rs.) 8.48 3.89 118% 27.40
15
Q1 FY20 PATRs. 1,304 mn
Q1 FY20 EBITDARs. 2,927 mn
118%
50%
Note: Revenue from Hospitality & Others is down on a y-o-y basis on account of sale of Restaurant Business operating under Bellona Finvest in Q3FY19
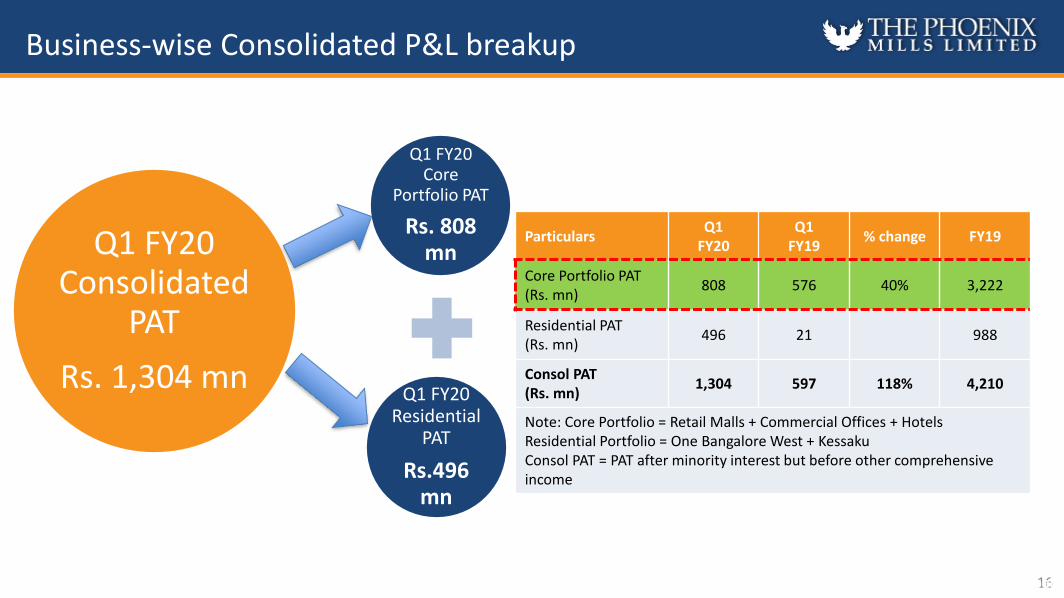
Business-wise Consolidated P&L breakup
16
Q1 FY20 Residential
PAT
Rs.496 mn
Q1 FY20 Core
Portfolio PAT
Rs. 808 mnQ1 FY20
Consolidated PAT
Rs. 1,304 mn
High Street Phoenix & Palladium, Mumbai
ParticularsQ1
FY20Q1
FY19% change FY19
Core Portfolio PAT (Rs. mn)
808 576 40% 3,222
Residential PAT (Rs. mn)
496 21 988
Consol PAT (Rs. mn)
1,304 597 118% 4,210
Note: Core Portfolio = Retail Malls + Commercial Offices + HotelsResidential Portfolio = One Bangalore West + KessakuConsol PAT = PAT after minority interest but before other comprehensiveincome

Debt Profile as on 30th June 2019
Credit RatingsAs on June 30, 2019
Ratings Agency
PML Standalone A+
PMC Bangalore A
The St. Regis, Mumbai A-
PMC Pune A-
PMC Mumbai A-
Status Asset Class Amount (Rs. mn)
Operational
Retail 31,872
Hospitality 5,409
Commercial 2,761
Residential 1,119
Sub-total (A) 41,162
Under-development
Retail 3,005
Commercial 737
Sub-total (B) 3,741
Grand Total (A+B) 44,903
17
Average cost of borrowing up marginally to 9.36%
89% of Debt is long-term. Debt on the operationalportfolio is primarily lease-rental discounting for retail and commercial or backed by steady Hotel revenues
Strong credit ratings maintained for the SPV’s, inthe A+ to A- range.
Strong interest coverage across the groupcompanies as on 31st March 2019:
HSP : 3.8x
PMC Bangalore: 3.4x
The St. Regis: 2.8x
PMC Chennai: 2.5x
PMC Pune: 2.5x
Offbeat (PMC Mumbai + AGH): 2.2x
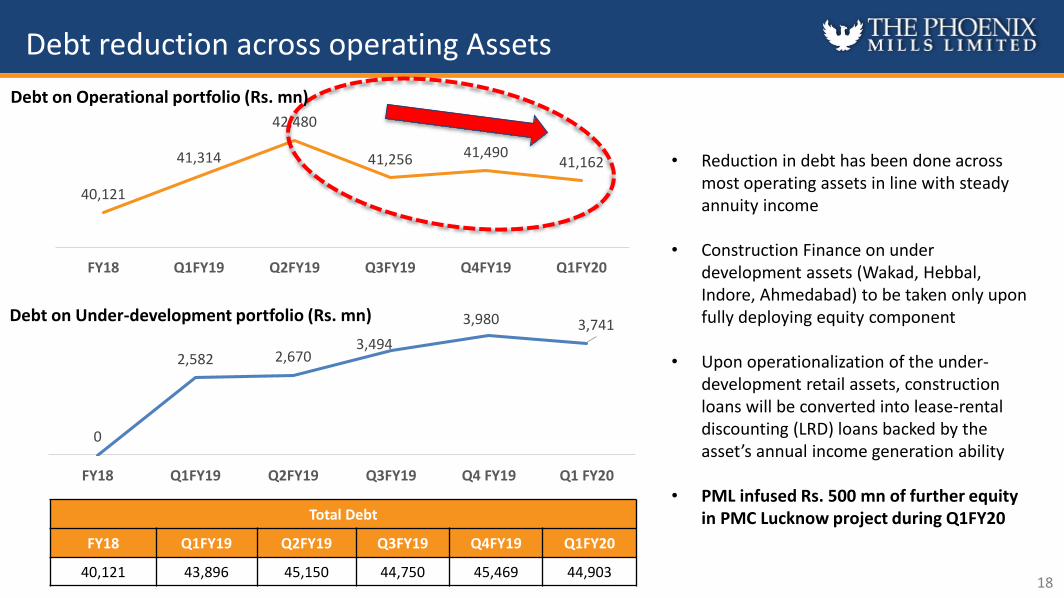
Debt reduction across operating Assets
18
40,121
41,314
42,480
41,256 41,49041,162
FY18 Q1FY19 Q2FY19 Q3FY19 Q4FY19 Q1FY20
• Reduction in debt has been done acrossmost operating assets in line with steadyannuity income
• Construction Finance on underdevelopment assets (Wakad, Hebbal,Indore, Ahmedabad) to be taken only uponfully deploying equity component
• Upon operationalization of the under-development retail assets, constructionloans will be converted into lease-rentaldiscounting (LRD) loans backed by theasset’s annual income generation ability
• PML infused Rs. 500 mn of further equityin PMC Lucknow project during Q1FY20
0
2,582 2,6703,494
3,980 3,741
FY18 Q1FY19 Q2FY19 Q3FY19 Q4 FY19 Q1 FY20
Total Debt
FY18 Q1FY19 Q2FY19 Q3FY19 Q4FY19 Q1FY20
40,121 43,896 45,150 44,750 45,469 44,903
Debt on Operational portfolio (Rs. mn)
Debt on Under-development portfolio (Rs. mn)

Q1 FY20 Highlights Overview and Strategy Financial ResultsBusiness Performance - RetailAnnexure
Phoenix MarketCity Mumbai

20
40.3
49.054.0
57.863.2
16.9 17.8
FY14 FY15 FY16 FY17 FY18 FY19 Q1FY19 Q1FY20
Consumption (Rs. bn)
5% 5.76.5
7.17.7
8.6
9.9
2.4 2.6
FY14 FY15 FY16 FY17 FY18 FY19 Q1FY19 Q1FY20
Rental Income (Rs. bn)
** Average for quarter ended June 2019 * As of end-June 2019
FY14-19 CAGR – 11%
FY14-19 CAGR – 12%
Operational Update – Retail Portfolio
HSP & Palladium
Phoenix MarketCity Phoenix United Palladium
Mumbai Bangalore Chennai^ Mumbai Pune Bareilly Lucknow Chennai
Retail Leasable/Licensable Area (msf ) 0.74 1.00 1.00 1.14 1.19 0.31 0.33 0.22
Total No. of Stores 270 296 263 311 352 139 128 86
Average Rental (Rs. psf)** 406 124 139 101 125 67 77 130
Trading Occupancy %** 93% 97% 99% 93% 98% 88% 89% 85%
Leased Occupancy %* 99% 99% 100% 97% 99% 91% 94% 90%
7%
68.9

4,2283,364 3,331
2,589 2,677
283 814 529
HSP & Palladium PMC Bengaluru PMC Pune PMC Mumbai PMC Chennai PalladiumChennai
Phoenix UnitedLucknow
Phoenix UnitedBareilly
Consumption (Rs. mn)
21
Q1 FY20 – Retail Key Highlights
Total Consumption – Rs. 17,815 mn, up 5% yoy
14%-1% 9% 4% 16%36%9%
3,025
1,749 1,441 1,222 1,435 770 1,186822
HSP & Palladium PMC Bengaluru PMC Pune PMC Mumbai PMC Chennai PalladiumChennai
Phoenix UnitedLucknow
Phoenix UnitedBareilly
Trading Density (Rs. per sq. ft pm)
7%3% 9% 17% 2%6%-8%8%

780
385 440323
437
59 72 60
HSP & Palladium PMC Bengaluru PMC Pune PMC Mumbai PMC Chennai PalladiumChennai
Phoenix UnitedLucknow
Phoenix UnitedBareilly
EBITDA (Rs. mn) Total EBITDA – Rs. 2,556 mn, up 8% yoy
881
359 432323 394
73 77 57
HSP & Palladium PMC Bengaluru PMC Pune PMC Mumbai PMC Chennai PalladiumChennai
Phoenix UnitedLucknow
Phoenix UnitedBareilly
Rental Income (Rs. mn)
Q1 FY20 – Retail Key Highlights
Total Rental Income – Rs. 2,596 mn, up 7% yoy
10% 4% 6% 12%
3% 16% 14% 4%
22
6%5% 13%
11%
20%
4% 8%6%

713 776 803 839 839 886 868 881
Q2 FY18 Q3 FY18 Q4 FY18 Q1 FY19 Q2 FY19 Q3 FY19 Q4 FY19 Q1 FY20
PML owned Assets incl. High Street Phoenix & Palladium
23
3,6174,574 4,057 4,251 4,025
4,7554,013 4,228
Q2 FY18 Q3 FY18 Q4 FY18 Q1 FY19 Q2 FY19 Q3 FY19 Q4 FY19 Q1 FY20
Co
nsu
mp
tio
n (
Rs.
mn
)R
enta
l In
com
e (
Rs.
mn
)
Down 1% yoy
Up 5% yoy
• Rental Income was up 5% yoy to Rs. 881 mn
• Consumption of Rs. 4,228 mn in Q1FY20, down 1% yoy
Stable Performance at High Street Phoenix
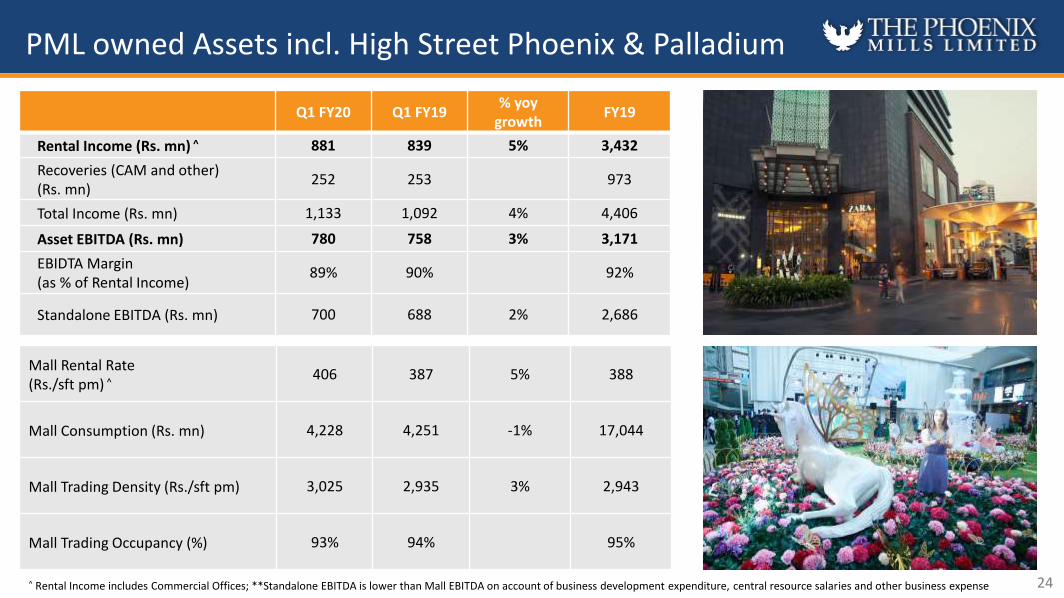
Q1 FY20 Q1 FY19 % yoy
growthFY19
Rental Income (Rs. mn) ^ 881 839 5% 3,432
Recoveries (CAM and other) (Rs. mn)
252 253 973
Total Income (Rs. mn) 1,133 1,092 4% 4,406
Asset EBITDA (Rs. mn) 780 758 3% 3,171
EBIDTA Margin (as % of Rental Income)
89% 90% 92%
Standalone EBITDA (Rs. mn) 700 688 2% 2,686
Mall Rental Rate (Rs./sft pm) ^
406 387 5% 388
Mall Consumption (Rs. mn) 4,228 4,251 -1% 17,044
Mall Trading Density (Rs./sft pm) 3,025 2,935 3% 2,943
Mall Trading Occupancy (%) 93% 94% 95%
^ Rental Income includes Commercial Offices; **Standalone EBITDA is lower than Mall EBITDA on account of business development expenditure, central resource salaries and other business expense
PML owned Assets incl. High Street Phoenix & Palladium
24

25
Project Name FY2017 FY2018 FY19 Q1 FY20
Commercial Asset
Phoenix House 175 154 147 48
Centrium 81 69 96 20
Art Guild House 29 119 168 45
Retail Asset High Street Phoenix 2,532 2,659 3,021 769
Total Rental Income reported by PML Standalone
2,837 3,022 3,432 881
PML owned Assets Income Split– Commercial & Retail
PML (Standalone entity) owns the following assets:
• Retail – High Street Phoenix & Palladium: Leasable area of 0.74 msf
• Phoenix House: Leasable area of 0.14 msf
• Centrium: Leasable area of 0.12 msf
• Art Guild House: Leasable area of 0.16 msf

311329 322
339 345361
347359
Q2 FY18 Q3 FY18 Q4 FY18 Q1 FY19 Q2 FY19 Q3 FY19 Q4 FY19 Q1 FY20
Phoenix MarketCity Bangalore
26
3,030 3,2992,859 3,100 3,183 3,514
3,048 3,364
Q2 FY18 Q3 FY18 Q4 FY18 Q1 FY19 Q2 FY19 Q3 FY19 Q4 FY19 Q1 FY20
Co
nsu
mp
tio
n (
Rs.
mn
)R
enta
l In
com
e (
Rs.
mn
)
Up 9% yoy
Up 6% yoy
• Rental Income at Rs. 359 mn for Q1, up 6% yoy
• Consumption was up 9% to Rs. 3,364 mn while trading density was up 8% to Rs. 1,749 psf pm during this
quarter
Steady improvement in Rental Income and EBITDA

Q1FY20 Q1FY19 % yoy
growthFY19
Rental Income (Rs. mn) 359 339 6% 1,392
Recoveries (CAM and other)(Rs. mn)
184 171 8% 678
Total Income (Rs. mn) 543 510 6% 2,070
EBITDA (Rs. mn) ^ 385 346 11% 1,418
EBIDTA Margin (as % of Rental Income)
107% 102% 102%
Rental Rate (Rs./sft pm) 124 116 7% 119
Consumption (Rs. mn) 3,364 3,100 9% 12,843
Trading Density (Rs./sft pm) 1,749 1,622 8% 1,680
Trading Occupancy (%) 97% 98% 98%
Phoenix MarketCity Bangalore
27^ EBITDA is before fees paid to MarketCity Resources Pvt. Ltd (PML’s 100% subsidiary) and interest income earned on liquid mutual fund investments and fixed deposits

332 357 360 380 387 416 406 432
Q2 FY18 Q3 FY18 Q4 FY18 Q1 FY19 Q2 FY19 Q3 FY19 Q4 FY19 Q1 FY20
Phoenix MarketCity Pune
28
2,4952,969 2,616 3,045 2,937
3,4052,820
3,331
Q2 FY18 Q3 FY18 Q4 FY18 Q1 FY19 Q2 FY19 Q3 FY19 Q4 FY19 Q1 FY20
Co
nsu
mp
tio
n (
Rs.
mn
)R
enta
l In
com
e (
Rs.
mn
)
Up 9% yoy
Up 13% yoy
• Rental Income was Rs. 432 mn in Q1FY20 , up 13% yoy while Consumption was up 9%
• Strong Consumption & Rental income growth led to sustained growth in EBITDA, up 16% for Q1 FY20 at Rs.
440 mn
Strong rental Income growth contributed to superior EBITDA growth

Phoenix MarketCity Pune
Q1 FY20 Q1 FY19% yoy
growthFY19
Rental Income (Rs. mn) 432 382 13% 1,589
Recoveries (CAM and other) (Rs. mn)
206 232 793
Total Income (Rs. mn) 638 613 4% 2,382
EBITDA (Rs. mn) 440 381 16% 1,566
EBIDTA Margin (as % of Rental Income)
102% 100% 99%
29
Rental Rate (Rs./sft pm) 125 111 13% 116
Consumption (Rs. mn) 3,331 3,045 9% 12,207
Trading Density (Rs./sft pm) 1,441 1,320 9% 1,334
Trading Occupancy (%) 98% 97% 96%

271 284 281 295 300 311 310 323
Q2 FY18 Q3 FY18 Q4 FY18 Q1 FY19 Q2 FY19 Q3 FY19 Q4 FY19 Q1 FY20
Phoenix MarketCity Mumbai
30
1,8012,320
1,970 2,266 2,2832,654 2,356 2,589
Q2 FY18 Q3 FY18 Q4 FY18 Q1 FY19 Q2 FY19 Q3 FY19 Q4 FY19 Q1 FY20
Co
nsu
mp
tio
n (
Rs.
mn
)R
enta
l In
com
e (
Rs.
mn
)
Up 14% yoy
Up 10% yoy
• PMC Mumbai continues to be amongst the fastest growing assets
• Consumption growth of 14% resulted in a strong EBITDA Margin of 100% for Q1FY20
• EBITDA for Q1 FY20 was up 14% yoy to Rs. 323 mn
PMC Mumbai continues strong performance, establishing itself as a premium destination mall

Phoenix MarketCity Mumbai
Q1FY20 Q1FY19 % yoy
growthFY19
Rental Income (Rs. mn) 323 295 10% 1,216
Recoveries (CAM and other) (Rs. mn)
181 183 751
Total Income (Rs. mn) 504 478 6% 1,967
EBITDA (Rs. mn) 323 284 14% 1,188
EBIDTA Margin (as % of Rental Income)
100% 96% 98%
Rental Rate (Rs./sft pm) 101 98 3% 98
Consumption (Rs. mn) 2,589 2,266 14% 9,599
Trading Density (Rs./sft pm) 1,222 1,143 7% 1,174
Trading Occupancy (%) 93% 89% 95%
31The total leasable area in PMC Mumbai has gone up from 1.11 msf to 1.14 msf on account of addition of new area

343 351 357 380 376 388 384 394
Q2 FY18 Q3 FY18 Q4 FY18 Q1 FY19 Q2 FY19 Q3 FY19 Q4 FY19 Q1 FY20
Phoenix MarketCity Chennai
32
2,706 2,747 2,4782,857 2,867 2,898
2,446 2,667
Q2 FY18 Q3 FY18 Q4 FY18 Q1 FY19 Q2 FY19 Q3 FY19 Q4 FY19 Q1 FY20
Co
nsu
mp
tio
n (
Rs.
mn
)R
enta
l In
com
e (
Rs.
mn
)
Down 6% yoy
Up 4% yoy
• PMC Chennai reported a 4% growth in Rental Income, EBITDA was up 4%
• Consumption and Trading density were impacted on account of certain high consumption stores being
under renovations
Category changes in the retail product mix have had a positive impact on rental income

Phoenix MarketCity Chennai
Q1 FY20 Q1 FY19 % yoy
growthFY19
Rental Income (Rs. mn) 394 380 4% 1,529
Recoveries (CAM and other) (Rs. mn)
206 201 3% 878
Total Income (Rs. mn) 600 581 3% 2,407
EBITDA (Rs. mn) 437 420 4% 1,642
EBIDTA Margin (as % of Rental Income)
111% 110% 107%
Rental Rate (Rs./sft pm) 139 137 1% 137
Consumption (Rs. mn) 2,677 2,857 -6% 11,071
Trading Density (Rs./sft pm) 1,435 1,561 -8% 1,505
Trading Occupancy (%) 99% 96% 97%
33

Palladium Chennai
Q1FY20 FY19
Rental Income (Rs. mn) 73 248
Recoveries (CAM and other) (Rs. mn)
29 163
Total Income (Rs. mn) 102 411
EBITDA (Rs. mn) 59 158
EBIDTA Margin (as % of Total Income)
81% 64%
Rental Rate (Rs./sft pm) 130 126
Consumption (Rs. mn) 283 1,039
Trading Density (Rs./sft pm) 769 773
Trading Occupancy (%) 85% 77%
34

Under-construction asset update
4.9 msf of strong cash-generating retail space to become operational between FY20 to FY23
ProjectPartnership /
ownedLand Size Development Potential Comments
PMC Wakad, Pune
ISML – alliance with CPPIB
(PML stake: 51%)
15 Acres1.6 msf
(1.1 msf retail)
All approvals received. Construction commenced in Feb 2019; Excavation is 95% complete at end of June 2019, foundation work is on
PMC Hebbal, Bengaluru
13 Acres1.8msf
(1.2 msf retail)
All approvals received. Construction commenced in Feb 2019. Excavation is 70% complete as on end of June 2019, foundation work is on
PMC Indore 19 Acres 1.0 msf retail All approvals received, construction commenced in June 2019
PMC Lucknow 100% owned 13.5 Acres 0.9 msf retailConstruction is complete. Shops being handed over for fit-outs. Expect operations to commence during H2 FY20
Palladium, Ahmedabad
50:50 alliance with BSafal group
5.2 Acres 0.7 msf retailConstruction in Progress. Excavation is complete and foundation work is on
We have closed 5 acquisitions – land parcels in Pune, Bangalore and Ahmedabad, under-construction retail assets in Lucknow
and Indore – between Aug 2017 & July 2018
These acquisitions take our under-development retail leasable portfolio to c.4.9 million sft
We have further mixed-use development potential on most of these assets
35

Phoenix MarketCity Hebbal, Bengaluru - Site Pictures
36
Excavation is 70% complete, foundation work is on in parallel

Phoenix MarketCity Wakad, Pune - Site Pictures
37
Excavation is 95% complete, foundation work is on in parallel

Phoenix MarketCity Indore - Site Pictures
38
Construction in Progress

Phoenix MarketCity Lucknow - Site Pictures
39
Construction of the mall is complete; façade, interiors & fit-outs in progress

Phoenix MarketCity Lucknow - Site Pictures
40
Mall targeted to operationalize in H2FY20

Palladium, Ahmedabad - Site Pictures
41
Excavation in complete, foundation work is currently on

Commercial asset update
Fountainhead Pune
Remarks
Tower 1Leasable area: 0.17 msf - 0.16 msf (94%) area has been leased. 0.08 msf is currently operational as of June 2019
Tower 2Leasable area: 0.22 msf. Construction completed upto 10th floor of this 16 floor tower
Tower 3Leasable area: 0.35 msf. Construction commenced in Q1FY20 and completed till 7th floor of this 15 floor tower
42Fountainhead Tower 2 - Side Fountainhead Tower 1 - Side
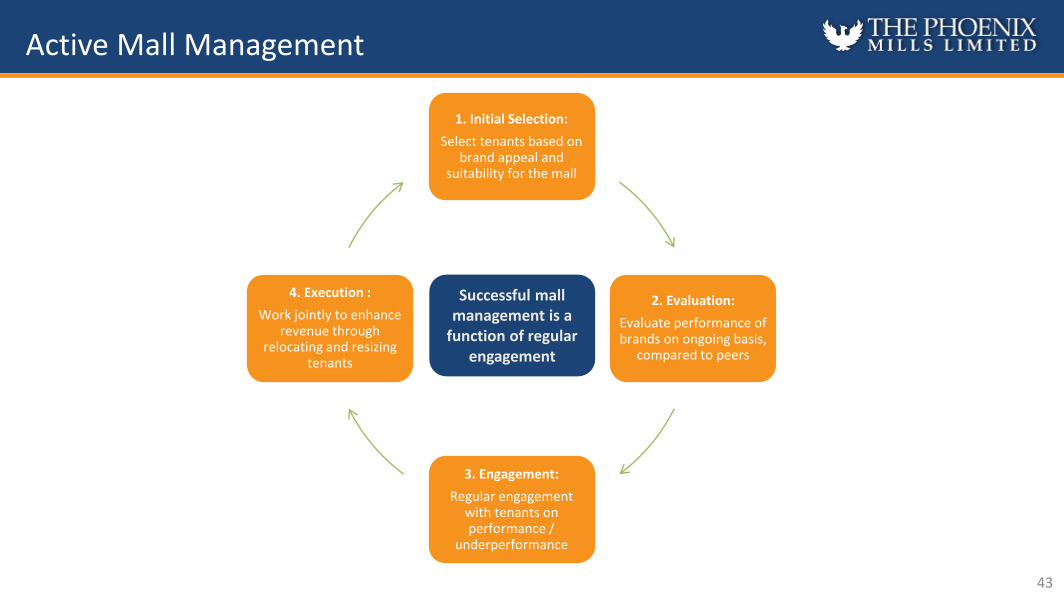
Active Mall Management
1. Initial Selection:
Select tenants based on brand appeal and
suitability for the mall
2. Evaluation:
Evaluate performance of brands on ongoing basis,
compared to peers
3. Engagement:
Regular engagement with tenants on performance /
underperformance
4. Execution :
Work jointly to enhance revenue through
relocating and resizing tenants
Successful mall management is a
function of regular engagement
43

Revenue Cycle of a Mall
100
120
140
160
180
200
Year 1 Year 2 Year 3 Year 4 Year 5 Year 6 Year 7 Year 8
Ren
t P
SF (
Reb
ase
d t
o 1
00
)
Annual rent escalation in mid-single digits
Rent escalation of mid to high teens in 3rd year
Majority of retail lease agreements at PML pay higher of minimum guarantee (MG) rents and revenue share (% of consumption)
Generally MG escalates by mid-double digits at the end of 3 years and mid-to-high single digits annually in the interim
Typically a lease is renewed at the end of 5th year and the renegotiated MG / revenue share is significantly higher
Lease renewal at significantly higher rates
44
PMC malls are currently in second leg of this growth
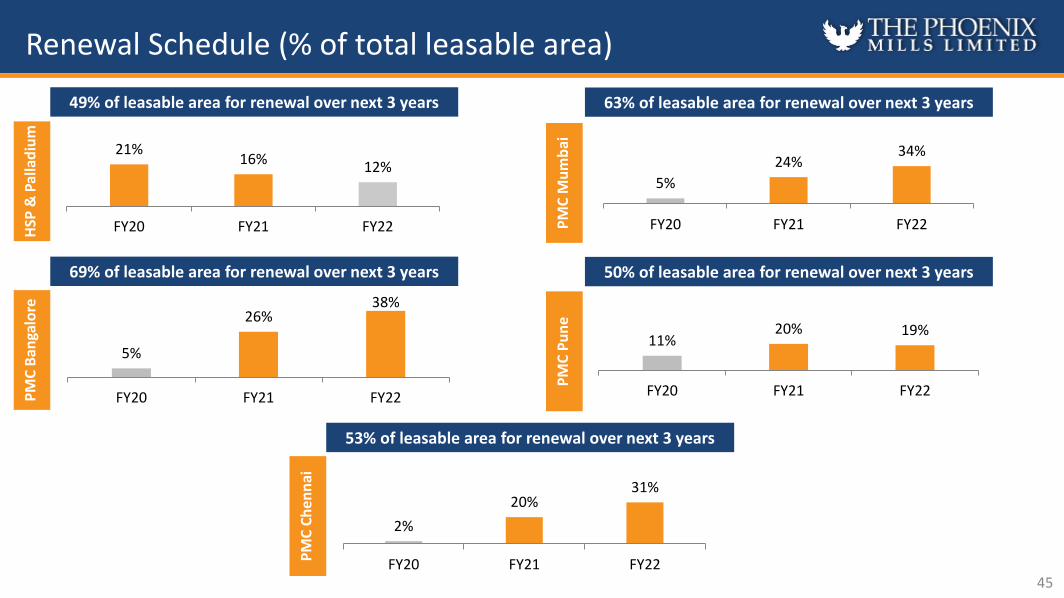
5%
26%38%
FY20 FY21 FY22
5%
24%34%
FY20 FY21 FY22
11%20% 19%
FY20 FY21 FY22
Renewal Schedule (% of total leasable area)
21%16% 12%
FY20 FY21 FY22
2%
20%31%
FY20 FY21 FY22
HSP
& P
alla
diu
mP
MC
Ban
galo
re
PM
C C
he
nn
ai
PM
C M
um
bai
PM
C P
un
e
49% of leasable area for renewal over next 3 years
69% of leasable area for renewal over next 3 years
53% of leasable area for renewal over next 3 years
63% of leasable area for renewal over next 3 years
50% of leasable area for renewal over next 3 years
45

HSP (2019)
0
500
1,000
1,500
2,000
2,500
3,000
3,500
4,000
0 1,000 2,000 3,000
In 2010, trading density and consumption at HighStreet Phoenix was at Rs 1,055 psf pm and Rs 4,371mn, respectively today, has grown 3-4x since 2010
All MarketCity malls are in similar position (in terms oftrading density) as HSP was in 2010; poised to followsimilar growth path as HSP over next few years
Marketcity Malls Poised to follow HSP’s growth path
FY
19 R
en
tals
(R
sm
n)
Trading Density(Rs Psf pm)
HSP (2010)
Bubble size represents consumption
MarketCity malls to follow similar growth trajectory at HSP & Palladium
Long Term Sustainable Growth Delivered Through The Cycle
Trading density(psf)
Rental(INR mn)
Consumption(INR mn)
HSP – 2010 1,055 827 4,371
HSP (FY19) 2,981 3,432 17,044
HSP growth (FY10 – 19) 2.82x 4.14x 3.89x
PMC Mumbai (FY19) 1,174 1,216 9,599
PMC Pune (FY19) 1,334 1,589 12,207
PMC Bangalore (FY19) 1,680 1,392 12,843
PMC Chennai (FY19) 1,505 1,592 11,071
Marketcity Malls are attractively poised to exhibit similar long-term growth as HSP
46

Q1 FY20 Highlights Overview and Strategy Financial ResultsBusiness Performance -CommercialAnnexure

Project Name
Total Area (msf)
Area Sold (msf)
Net Leasable Area (msf)
Area Leased (msf)
Phoenix House 0.14 - 0.14 0.13
Centrium 0.28 0.16 0.12#
0.10
Art Guild House 0.80 0.20@
0.60@
0.54
Phoenix Paragon Plaza 0.41 0.12 0.29 0.17
Fountainhead – Tower 1 0.17 0.00 0.17 0.16
Total 1.80 0.48 1.32 1.10
@Total Area sold is 0.38 msf out of which PML owns 0.17 msf – this area is also counted in area available for lease^Rental Income from Phoenix House is part of Standalone results #Area owned by PML
Our Annuity Income Generating Commercial Portfolio
48
OPERATIONAL OFFICE PORTFOLIO (1.80 MSF) OFFICE PORTFOLIO UNDER DEVELOPMENT (0.96 MSF)
OFFICE PORTFOLIO ( 0.96 MSF)
Fountainhead – Tower 2 &3 Pune 0.54
Phoenix MarketCity Chennai 0.42
Total 0.96

Total Area (msf)
Area Sold (msf)
Net Leasable
Area (msf)
Area Leased (msf)
Average Rate
(Rs./sq.ft)
Art Guild House
0.80 0.20@
0.60@
0.54 97
@Total Area sold is 0.38 msf out of which PML owns 0.17 msf – this area is also counted in area available for lease
Art Guild House has a trading occupancy of 89% as of June2019
Operational Update – Art Guild House
49
Q1 FY20 Q1 FY19 FY19 FY18
Total Income (Rs. mn)
148 140 582 396
EBITDA (Rs. mn)
78 87 335 157
% of Total Income 53% 62% 58% 40%

Total Area (msf)
Area Sold (msf)
Net Leasable
Area (msf)
Area Leased (msf)
Average Rate
(Rs./sq.ft)
Phoenix Paragon Plaza
0.41 0.12 0.29 0.16 95
Operational Update – Phoenix Paragon Plaza
50
Q1 FY20 Q1 FY19 FY19 FY18
Total Income (Rs. mn)
72 57 358 219
EBITDA (Rs. mn) 44 37 213 91
% of Total Income 61% 65% 59% 42%

Total Area (msf)
Area Sold (msf)
Net Leasable
Area (msf)
Area Leased (msf)
Average Rate
(Rs./sq.ft)
Fountainhead –Tower 1
0.17 0.00 0.17 0.16 79
Fountainhead –Tower 2
0.54Part of Commercial Portfolio under Development
– Construction to commence for Tower 3 in Q1FY’20Fountainhead –
Tower 3
Operational Update – Fountainhead Towers 1,2 & 3
51
Q1 FY20 FY19
Total Income (Rs. mn) 30 32
EBITDA (Rs. mn) 22 (8)
% of Total Income 73% NA

4%12% 9% 7%
FY20 FY21 FY22 FY23
Renewal Schedule (% of total leasable area)
0% 1%
42%35%
FY20 FY21 FY22 FY23
Art
Gu
ildH
ou
seP
ho
en
ix
Par
ago
n P
laza
78% of leasable area for renewal over next 4 years
39% of leasable area for renewal over next 4 years
52

Q1 FY20 Highlights Overview and Strategy Financial ResultsBusiness Performance -HotelsAnnexure
XXO, The St. Regis, Mumbai

#For Q1 FY20 54
The St. Regis, Mumbai
Courtyard by Marriott, Agra
Keys 395 193
Restaurants & Bar 10 4
Occupancy (%)# 82% 64%
Average room rent (Rs. / room night) #
10,913 3,353
The St. Regis, Mumbai
82% room occupancy in Q1 FY20 vs 74% in Q1 FY19
Total Income grew by 5% to Rs. 698 mn
ARR for the quarter was at Rs. 10,913
Courtyard by Marriott, Agra
Total Revenue was at Rs. 76 mn for Q1 FY20, up 36% led by
improvement in occupancy
Q1 FY20 room occupancy at 64%, up from 47% in Q1 FY19
ARR was Rs.3,353, up 5%
Operational Update – Hospitality

Q1 FY20 Q1 FY19% yoy
growthFY19
Revenue from Rooms (Rs. mn)
318 294 8% 1,352
Revenue from F&B and Banqueting (Rs. mn)
316 295 7% 1,424
Other Operating Income (Rs. mn)
64 72 267
Total Income (Rs. mn)
698 662 5% 3,042
Operating EBITDA(Rs. mn)
253 242 5% 1,234
EBITDA margins 36% 37% - 41%
Occupancy (%) 82% 74% 8 pps 80%
ARR (Rs.) 10,913 11,295 -3% 11,776
The St. Regis, Mumbai
55

Q1 FY20 Q1 FY19% yoy
growthFY19
Revenue from Rooms (Rs. mn) 37 26 42% 188
Revenue from F&B and Banqueting (Rs. mn)
35 28 25% 163
Other Operating Income(Rs.mn)
4 3 33% 19
Total Income (Rs. mn) 76 56 36% 370
Occupancy (%) 64% 47% 17 pps 67%
ARR (Rs.) 3,353 3,181 5% 3,908
Courtyard by Marriott, Agra
56

Q1 FY20 Highlights Overview and Strategy Financial ResultsBusiness Performance -ResidentialAnnexure
Kessaku, Bengaluru

• Premium and upscale, large-scale residential developments
• Product design, quality and location in or around mixed-usedestinations have established the project as a market leader
• Expect substantial free cash flows from residential projects in thecoming years:
• Cash flows from sold inventory sufficient to cover constructioncost to complete project
• Selling prices for the projects more than doubled in the last 5years (CAGR of 18-20% over the last 5 years) whileconstructions costs have increased by only c5-10%
• Residual inventory (both ready and under-construction) atcurrent prices represents significantly higher profit margins
• Bengaluru (One Bangalore West and Kessaku):• Construction of Towers 1-6 at One Bangalore West is complete• Received OC for five towers of Kessaku in March 2019• Received OC for Tower 6 in OBW in April 2019
Residential Portfolio: High Margin, Cash Flow Business
One Bangalore West and Kessaku
The Crest
Residential portfolio to aid in significant free cash flow generation
58

## Note that of the nine towers in One Bangalore West (OBW), only Towers 1-6 have been launched and completed. Tower 7 was launched in July 2019
59
Project Name (operational)
Saleable area (msf) Cumulative Area Sold
(msf)
Sales Value (Rs. mn)
Collections in Q1 FY20 (Rs. mn)
Revenue recognized (Rs. mn)
Total Area
Area launchedBalance
Area in Q1 FY20 Cumulative
One Bangalore West, Bengaluru
2.20 1.49 0.71## 1.30 13,173 416 1,954 14,462
Kessaku, Bengaluru 0.99 0.52 0.47 0.25 3,756 337 117 3,290
Total 3.21 2.01 1.18 1.55 16,929 753 2,071 17,752
Q1 FY20 Revenue recognition of Rs. 2,071 mn from One Bangalore West & Kessaku
One Bangalore West Tower 6 received occupation certificate in April 2019
Collections from One Bangalore West & Kessaku were Rs. 753 mn
Key highlights
Operational Update – Residential Portfolio

One Bangalore West, Bangalore
60

Tower 7 Launched at One Bangalore West
61
• Launched Tower 7 in July 2019• Received positive response from customers for this
launch• Construction of Tower 7 is completed upto 5th floor

Q1 FY20 Highlights Overview and Strategy Financial ResultsBusiness Performance Annexure
Palladium, Chennai

Sr. No Top Institutional Investors % Shareholding
1 Nordea Bank 5.36%
2 Schroder 3.37%
3 TT Funds 2.60%
4 Fidelity 2.54%
5 DSP Mutual Fund 1.95%
6 Reliance Mutual Fund 1.65%
7 Van Eck 1.47%
8 Vanguard 1.42%
9 UTI Mutual Fund 1.41%
10 Mondrian 1.20%
Total – Top 10 Institutional Investors 22.97%
Shareholding Pattern
62.75%
26.92%
5.88%
3.22% 1.23%
Promoters
FII
DII
Public
Corporate bodies
Shareholding Pattern as on 30th June 2019
63

2,0392,293
2,6012,837 3,022
3,432
FY14 FY15 FY16 FY17 FY18 FY19
Rental Income (Rs.mn)
13,18514,403 15,438 16,264 16,456 17,044
FY14 FY15 FY16 FY17 FY18 FY19
Consumption (Rs.mn)
2,2632,553 2,741 2,894 3,034 2,943
FY14 FY15 FY16 FY17 FY18 FY19
Average Trading Density (Rs./sft pm)FY14-19 CAGR – 5%
FY14-19 CAGR – 11%
High Street Phoenix & Palladium Mall
64

858
1,1091,196
1,2861,394
1,529
FY14 FY15 FY16 FY17 FY18 FY19
Rental Income (Rs.mn)
65
6,938
10,48111,289 10,699 10,742 11,071
FY14 FY15 FY16 FY17 FY18 FY19
Consumption (Rs.mn)FY14-19CAGR – 10%
FY14-19 CAGR – 12%
Phoenix MarketCity Chennai
1,2261,480 1,572 1,553 1,489 1,505
FY14 FY15 FY16 FY17 FY18 FY19
Average Trading Density (Rs./sft pm)
Note: PML owns 50.0% of CMDCPL and CMDCPL has been classified as an Associate of the Company effective 31 March 2017. Hence, it's income from operations and expenses (including taxes) have not been consolidated in PML's results

768876
9581,090
1,2751,392
FY14 FY15 FY16 FY17 FY18 FY18
Rental Income (Rs.mn)
66
6,5737,753
8,85910,200
12,361 12,843
FY14 FY15 FY16 FY17 FY18 FY19
Consumption (Rs.mn)
9751,131
1,2871,444
1,694 1,680
FY14 FY15 FY16 FY17 FY18 FY19
FY14-19 CAGR – 13%
FY14-19 CAGR – 14%
Phoenix MarketCity Bangalore
Average Trading Density (Rs./sft pm)

789941
1,0351,202
1,3861,589
FY14 FY15 FY16 FY17 FY18 FY19
Rental Income (Rs.mn)
67
6,2217,650
8,6599,629
10,82812,207
FY14 FY15 FY16 FY17 FY18 FY19
Consumption (Rs.mn)
812975
1,0771,208 1,224
1,334
FY14 FY15 FY16 FY17 FY18 FY19
Average Trading Density (Rs./sft pm)
FY14-19 CAGR – 15%
FY14-19 CAGR – 14%
Phoenix MarketCity Pune
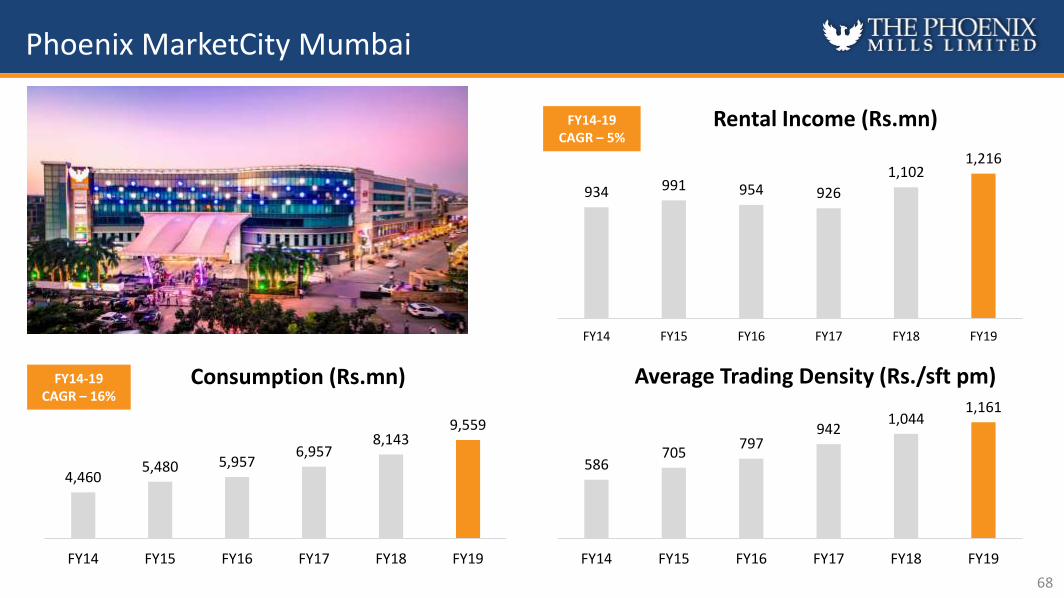
934 991 954 926
1,1021,216
FY14 FY15 FY16 FY17 FY18 FY19
Rental Income (Rs.mn)
68
4,4605,480 5,957
6,9578,143
9,559
FY14 FY15 FY16 FY17 FY18 FY19
Consumption (Rs.mn)
586705
797942
1,0441,161
FY14 FY15 FY16 FY17 FY18 FY19
Average Trading Density (Rs./sft pm)
FY14-19 CAGR – 5%
FY14-19 CAGR – 16%
Phoenix MarketCity Mumbai

Asset Type SPV Asset Name PML OwnershipQ4FY19 Debt
(Rs.mn)Q1FY20 Debt
(Rs.mn)
Retail & Mixed-Use
PML Standalone High Street Phoenix, Mumbai 100% 7,970 8,245Classic Mall Development
Phoenix MarketCity, Chennai 50% 6,926 6,794
The Crest C (Residential)
Vamona DevelopersPhoenix MarketCity, Pune
100% 6,372 6,244East Court (Commercial)
Island Star Mall Developers
Phoenix MarketCity, Bangalore 51% 3,823 3,721
Offbeat DevelopersPhoenix MarketCity, Mumbai
100% 6,827 6,767Art Guild House (Commercial) Centrium (Commercial)
Blackwood Developers Phoenix United, Bareilly 100% 980 959
UPAL Developers Phoenix United, Lucknow 100% 768 723Graceworks Realty & Leisure
Phoenix Paragon Plaza (Commercial) 67% 1,160 1,180
Hotel & Residential
Palladium ConstructionsOne Bangalore West & Kessaku (Residential)Courtyard by Marriott, Agra (Hotel)*
80% 1,883 1,747
Pallazzio Hotels & Leisure
The St. Regis, Mumbai 73% 4,781 4,781
Retail Destiny Hospitality Phoenix MarketCity, Lucknow 100% 3,255 3,005
Office Alliance Spaces Fountainhead 75% 725 737
Total Total 45,470 44,903
Q1 FY20 Debt Across Subsidiaries
69
Operational
Under Development

Varun ParwalContact: +91 22 3001 6737Email: [email protected]
Saket Somani /Rohan RegeContact: +91 22 6169 5988Email: [email protected]
Website: http://www.thephoenixmills.com/investordesk.html
70
Advait PhatarfodContact: +91 22 3001 6804Email: [email protected]