r’s version if you wish to cite from it. -...
TRANSCRIPT

Cotter, G. et al. (2016) Predictors and associations with outcomes of length
of hospital stay in patients with acute heart failure: results from
VERITAS. Journal of Cardiac Failure, 22(10), pp. 815-822.
(doi:10.1016/j.cardfail.2015.12.017)
This is the author’s final accepted version.
There may be differences between this version and the published version.
You are advised to consult the publisher’s version if you wish to cite from
it.
http://eprints.gla.ac.uk/129521/
Deposited on: 06 December 2016
Enlighten – Research publications by members of the University of Glasgow
http://eprints.gla.ac.uk33640

Elsevier Editorial System(tm) for Journal of Cardiac Failure Manuscript Draft Manuscript Number: Title: Predictors and associations with outcomes of length of hospital stay in patients with acute heart failure: Results from VERITAS Article Type: Clinical Trials Keywords: Keywords: heart failure, length of stay, prognosis Corresponding Author: Mrs. Olga Milo, M.D. Corresponding Author's Institution: Momentum Research Inc. First Author: Olga Milo, M.D. Order of Authors: Olga Milo, M.D.; Gad Cotter, M.D.; Beth A Davison, Ph.D.; Robert C Bourge, M.D.; John G Cleland, M.D.; Guilliaume Joundeau, M.D.; Henry Krum, M.D.; Christopher M O'Connor, M.D.; Marco Metra, M.D.; John D Parker, M.D.; Guillermo Torre-Amione, M.D.; Dirk J van Veldhuisen, M.D.; Isaac Kobrin, M.D.; Maurizio Rainisio, M.D.; Stefanie Senger, Ph.D.; Christopher Edwards, Ph.D.; John J McMurray, M.D.; John R Teerlink, M.D. Abstract: Abstract Background: The length of hospital stay (LOS) is important in patients admitted for acute heart failure (AHF) as it prolongs an unpleasant experience for the patients and adds substantially to health care costs. Methods and Results: We examined the association between LOS and baseline characteristics, 10-day post-discharge HF readmission, and 90-day post-discharge mortality in 1,347 patients with AHF enrolled in the VERITAS program. Longer LOS was associated with greater HF severity and disease burden at baseline; however, most of the variability of LOS could not be explained by these factors. LOS was not associated with readmissions during the first days after discharge. However, LOS was a significant predictor of 90-day mortality (Hazard ratio for 1 day increase: 1.05; 95% C.I. 1.02, 1.07, p=0.00004), although the association is partially explained by concurrent end organ damage and worsening heart failure (WHF) during the first days of admission. Conclusions: In patients who have been admitted for Acute HF; longer length of hospital stay is associated with a higher rate of short-term mortality. Clinical Trial Registration: VERITAS-1 and -2:Clinicaltrials.gov identifiers NCT00525707 and NCT00524433. https://clinicaltrials.gov/ct2/results?term=NCT00525707&Search=Search

LOS in VERITAS Page 1
Predictors and associations with outcomes of length of hospital stay in patients with acute heart failure: Results from VERITAS
Gad Cotter, MD‡, Beth A. Davison, PhD‡, Olga Milo, MD ‡, Robert C. Bourge, MD\, John G. F. Cleland MD ,
Guillaume Jondeau, MD#, Henry Krum, MD , Christopher M. O’Connor, MD††, Marco Metra, MD§, John D.
Parker, MD¶, Guillermo Torre-Amione, MD PhD‡‡, Dirk J. van Veldhuisen, MD§§, Isaac Kobrin, MD# #; Maurizio
Rainisio, PhD **; Stefanie Senger, PhD‡, Christopher Edwards ‡, John J. V. McMurray, MD\\, John R. Teerlink, MD†,
for the VERITAS Investigators
‡Momentum Research, Inc., Durham, NC, USA, [email protected]; [email protected];
[email protected]; [email protected]; [email protected];
\University of Alabama at Birmingham, Birmingham, Alabama, USA, [email protected] ; University of Hull, Kingston upon Hull, UK, National
Heart & Lung Institute, Royal Brompton and Harefield Hospitals NHS Trust, Imperial College, London, UK., [email protected]; #Service de
cardiologie, Hôpital Bichat, 75877 Paris Cedex 18, France, [email protected]; Monash Centre of Cardiovascular Research and
Education in Therapeutics, Department of Epidemiology and Preventive Medicine, Alfred Hospital, Monash University, Melbourne, Australia,
[email protected]; ††Duke Clinical Research Institute, Duke University Medical Center, Durham, NC, USA,
[email protected] ; §University of Brescia, Piazza Spedali Civili, Brescia, Italy, [email protected]; ¶Division of Cardiology,
Mount Sinai Hospital, Toronto, Ontario, Canada, [email protected]; ‡‡Methodist DeBakey Heart & Vascular Center, The Methodist
Hospital, Houston, Texas, USA, [email protected]; §§University Medical Centre, Groningen, The Netherlands, [email protected]; ##
Kobrin Associates, GmbH, Basel, Switzerland, [email protected]; ** Abanovus srl, Italy, [email protected]; \\University of
Glasgow, Glasgow, United Kingdom, [email protected]; †University of California San Francisco and the San Francisco Veterans
Affairs Medical Center, San Francisco, CA, USA [email protected]
Address for correspondence: Dr. Gad Cotter, Momentum-Research Inc., 3100 Tower Blvd, Suite 802, Durham, NC, 27707, USA. Phone: 1-9192871824 Fax: 1-9192871825
Email: [email protected]
Total word count: 4288
Disclosures:
Dr. Kobrin served as a head of clinical development in Actelion during the VERITAS trials. Dr. Teerlink received research grants/ consulting fees from: Actelion, Amgen, Bayer, Cytokinetics, Novartis, and Trevena. Dr. Cotter, Dr. Davison, Dr. Milo, Senger, Edwards- are employees of Momentum Research, which has provided consulting services to NovaCardia, Merck, Corthera, Novartis, Singulex, ChanRx, Laguna Pharmaceuticals, Sorbent Therapeutics, Celyad SA, Trevena , Amgen and Anexon. Dr. Metra- has received consulting honoraria from Bayer, Novartis, Servier. Dr. Cleland - have received research funding and personal honoraria from Actelion, Amgen, Novartis and Trevena. Dr. Jondeau- received consulting fees from Novartis, ResMed. Dr. Krum- Paid- member VERITAS steering committee Actelion. The other authors report no conflicts.
ManuscriptClick here to view linked References
LOS in VERITAS Page 2
Abstract
Background: The length of hospital stay (LOS) is important in patients admitted for acute heart failure
(AHF) as it prolongs an unpleasant experience for the patients and adds substantially to health care
costs.
Methods and Results: We examined the association between LOS and baseline characteristics, 10-day
post-discharge HF readmission, and 90-day post-discharge mortality in 1,347 patients with AHF enrolled
in the VERITAS program. Longer LOS was associated with greater HF severity and disease burden at
baseline; however, most of the variability of LOS could not be explained by these factors. LOS was not
associated with readmissions during the first days after discharge. However, LOS was a significant
predictor of 90-day mortality (Hazard ratio for 1 day increase: 1.05; 95% C.I. 1.02, 1.07, p=0.00004),
although the association is partially explained by concurrent end organ damage and worsening heart
failure (WHF) during the first days of admission.
Conclusions: In patients who have been admitted for Acute HF; longer length of hospital stay
is associated with a higher rate of short-term mortality.
Clinical Trial Registration: VERITAS-1 and -2:Clinicaltrials.gov identifiers NCT00525707 and
NCT00524433. https://clinicaltrials.gov/ct2/results?term=NCT00525707&Search=Search
Keywords: heart failure, length of stay, prognosis

LOS in VERITAS Page 3
Hospitalization for acute heart failure (AHF) is a major cause of morbidity and mortality and a significant
burden on healthcare systems worldwide (1.2). A hospitalization for AHF represents an important
clinical event with significant consequences for the patient, including disruption of the patient’s normal
home life, a relatively high risk of in-hospital mortality and a post-discharge period of increased re-
admission and death. The relationship between hospital length-of-stay (LOS) and post-discharge
outcomes is of considerable interest. Although LOS has recently been suggested as a surrogate measure
of hospital performance (3), LOS varies widely between countries and geographic regions (4-7), and
neither studies nor guidelines provide criteria for determining the optimal LOS for patients. This absence
of recommendation is driven by the paucity of data examining determinants of LOS and its relationship
with outcomes after discharge. Indeed, the few studies that have examined LOS as a marker of disease
severity reported conflicting results; on the one hand, some studies showed that longer LOS is
associated with higher readmission rates and mortality (8), while on the other hand, regions with longer
LOS have lower rates of short-term readmission up to day 30 (9), claimed to be mostly due to very early
“rebound” admissions with days of discharge. Importantly, local medical practice and health system
operation is also relevant. In some regions, a stringent system-based strategy to shorten LOS operates,
while in others, extended hospital stays are widely accepted. These cultural disparities may have
implications for developing strategies to prevent readmission, defining quality measures, and designing
clinical trials in AHF. To better understand the implications of differences in LOS across different
countries, we studied patient outcomes in hospital and up to 90 days after admission, adjusted for
regional LOS disparities, among the 1347 patients with AHF enrolled within 24h of admission into the
Value of Endothelin Receptor Inhibition With Tezosentan in Acute Heart Failure Studies (VERITAS;
10,11).

LOS in VERITAS Page 4
Methods:
This study is a post-hoc analysis of the VERITAS program, the design and results of which have been
published (10). Briefly, VERITAS-1 and -2 (Clinicaltrials.gov identifiers NCT00525707 and NCT00524433)
were concurrent, identical, double-blind, randomized, placebo-controlled, parallel-group studies
designed to evaluate tezosentan in the treatment of acute heart failure (AHF). Patients > 18 years old
who had been admitted for AHF within the previous 24 hours, with persistent dyspnea at rest and
respiratory rate of > 24 breaths per minute, and who had received at least one dose of intravenous
diuretic 2-24 hours prior to study drug initiation were potentially eligible for enrollment. Eligible
patients had to meet at least two of the following four additional criteria: 1) elevated B-type natriuretic
peptide (BNP) or NT-pro BNP, 2) pulmonary edema on physical examination, 3) radiologic pulmonary
congestion or edema, and 4) either left ventricular ejection fraction [LVEF] < 0.40 or wall motion index ≤
1.2. For patients monitored with a pulmonary artery catheter, a cardiac index ≤ 2.5 L/min/m2 and
pulmonary capillary wedge pressure ≥ 20 mmHg were required. Patients were excluded if they had
cardiogenic shock, ST segment elevation myocardial infarction, administration of a thrombolytic agent
or ongoing ischemia, systolic blood pressure < 100 mg if not receiving a vasodilator or < 120 mmHg if
receiving a vasodilator, hemoglobin < 10 g/dL or hematocrit < 30%, or creatinine > 2.5 mg/dL.
After obtaining informed consent, patients were randomized to receive an intravenous infusion of either
placebo or tezosentan, in addition to conventional care. A total of 1435 patients were enrolled and
treated between April 2003 and November 2005. Medical history was taken and routine clinical
laboratory measures assayed locally at baseline. Plasma samples were obtained immediately prior to
study drug initiation (baseline) and stored at -20oC locally and shipped to a core laboratory for analysis
(BioProof AG, Munich, Germany) (12). BNP and troponin I were measured using commercially-available
ELISA kits: Peninsula Laboratories, San Carlos, USA for BNP and Labmaster, Turku, Finland for troponin I.
LOS in VERITAS Page 5
Troponin T was measured using an electrochemiluminescence immunoassay (Roche, Germany). The
lower limit of quantification (LLOQ) was 0.041 ng/mL for BNP, 0.01 ng/mL for troponin T and reported
by the laboratory as not applicable for troponin I. Because troponin I and T were highly correlated
(r=0.87, p<0.0001) and troponin T was more often missing; only troponin I was considered. Non-
detectable values were set to 0.5 times the LLOQ for BNP and to 0.5 times the minimum reported value
for troponin I prior to log transformation. In-hospital WHF, which was reported through day 7, was
defined as either the development of pulmonary edema, cardiogenic shock or other evidence of WHF,
or failure of the patient's HF condition to improve with treatment, which required the initiation,
reinstitution, or increase in intravenous therapy for HF or use of mechanical circulatory or ventilatory
support or the use of hemodialysis, hemofiltration or ultrafiltration.
Rehospitalizations through 30 days and vital status through 180 days from baseline were collected.
Given that the time at risk for rehospitalization in patients with longer LOS is reduced, creating possible
bias - they spend more of the first 30 days in the hospital and hence they have no time to be readmitted
up to day 30 when the collection of information was truncated, we examined the association between
LOS and the risk of HF readmission during the first 10 days post-discharge in patients discharged before
day 20. For the same considerations, 90 days post-discharge mortality was assessed and modeled (see
below).
Statistical Methods
Patients were excluded if they were enrolled more than 24 hours after admission, or if missing the
discharge date such that the LOS could not be calculated. Each patient’s LOS was categorized as short,
medium, or long based on the first and third tertiles within geographic region, which were 5 and 8 days
in North America/Australia, 4 and 7 days in Israel, 8 and 14 days in Western Europe, and 8 and 11 days
in Eastern Europe. Baseline characteristics are presented by short, medium and long LOS. Means and
LOS in VERITAS Page 6
standard deviations, medians and first and third quartile, or geometric means for log-transformed
variables are presented for continuous variables; groups were compared using ANOVA F-tests. Absolute
and relative frequencies are presented for discrete variables, and were compared between groups using
chi-square tests.
Associations between baseline characteristics and LOS and between LOS and i) 90-day post-discharge
mortality and ii) 10-day post-discharge HF readmission were examined using linear regression, Cox
proportional hazards, and logistic regression models, respectively. Because rehospitalizations were
captured only through day 30 from baseline in VERITAS, analyses of 10-day post-discharge readmissions
were limited to patients discharged by day 20. Multivariable models were developed for length of stay
(LOS), 10-day post-discharge HF readmission, and 90-day post-discharge mortality using a common
approach. Non-linearity of the association between each continuous predictor and the outcome was
assessed through testing the significance of non-linear components of a restricted cubic spline
transformation. Plots of the predicted outcome against the value of the predictor and values of Akaike’s
Information Criterion (AIC) and adjusted R2 were used to select transformations where needed. Multiple
imputation assuming multivariate normality was used for missing predictors; the proportion missing
each covariate is given in Table 2. The final multivariable model included the predictors selected in the
majority of the 10 imputation datasets using backwards selection at a 0.05 significance level for linear
regression and a 0.10 significance level for Cox and logistic regression models. Estimated effect sizes,
confidence intervals and p-values were obtained by averaging across the imputation datasets using
Rubin’s algorithm (13). C-statistics were computed using Harrell’s method (14, 15). A multivariable-
adjusted estimate of the association between LOS and the outcome of interest was obtained by adding
the LOS as a predictor in the multivariable model. The occurrence of in-hospital WHF was then added to
evaluate whether any association between LOS and the outcome might be explained by in-hospital
WHF. Days in the intensive care unit (ICU) up to day 30 were collected. Unadjusted and multivariable-
LOS in VERITAS Page 7
adjusted associations between days in the ICU and 90-day post-discharge mortality were also examined.
All models were either adjusted or stratified by geographic region. SAS® version 9.3 (SAS Institute, Cary,
NC, USA) software was used for all analyses.
Results:
Of the 1449 patients eligible for analysis, 102 (7.0%) were excluded because they were enrolled more
than 24 hours after admission and 10 patients because of missing LOS data. Of the remaining 1337
patients, 55 (4.1%) died during the initial hospitalization. The LOS by region in patients who survived to
discharge and those who did not are presented in Table 1, and the distributions by geographic region in
those who survived are presented in Figure 1. Patient characteristics by short, medium and long LOS
within region are presented in Table 2. Univariable and multivariable models for LOS are presented in
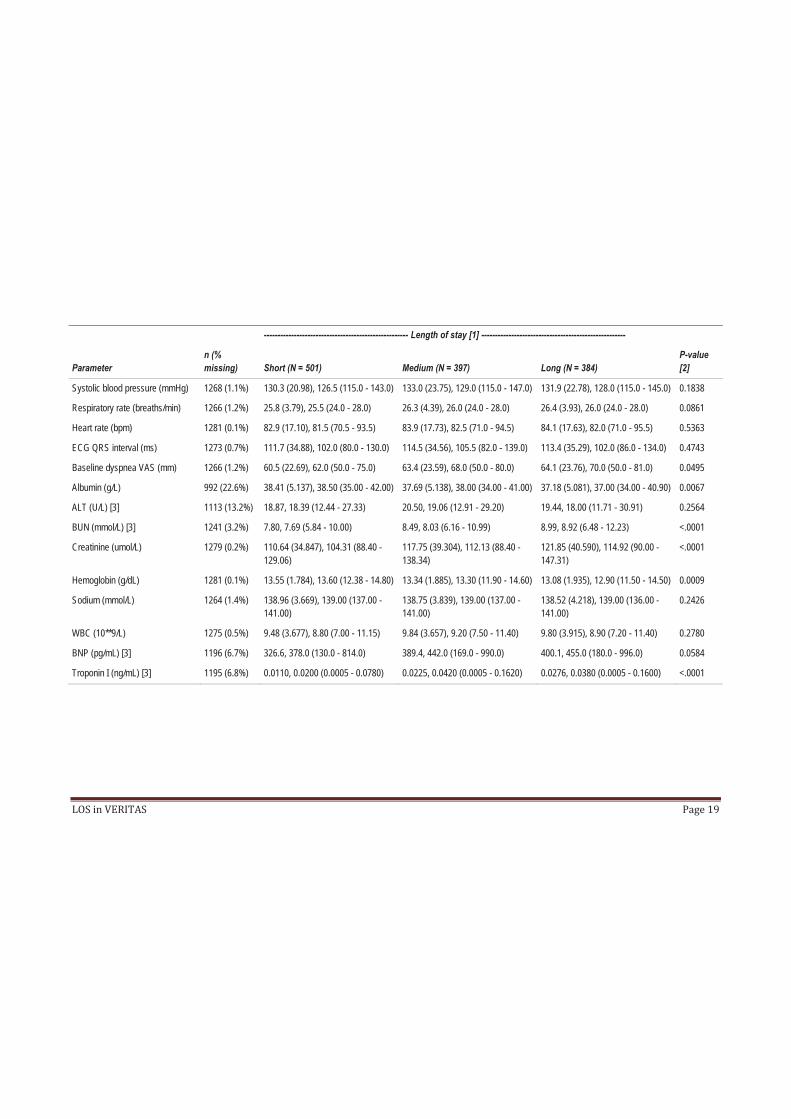
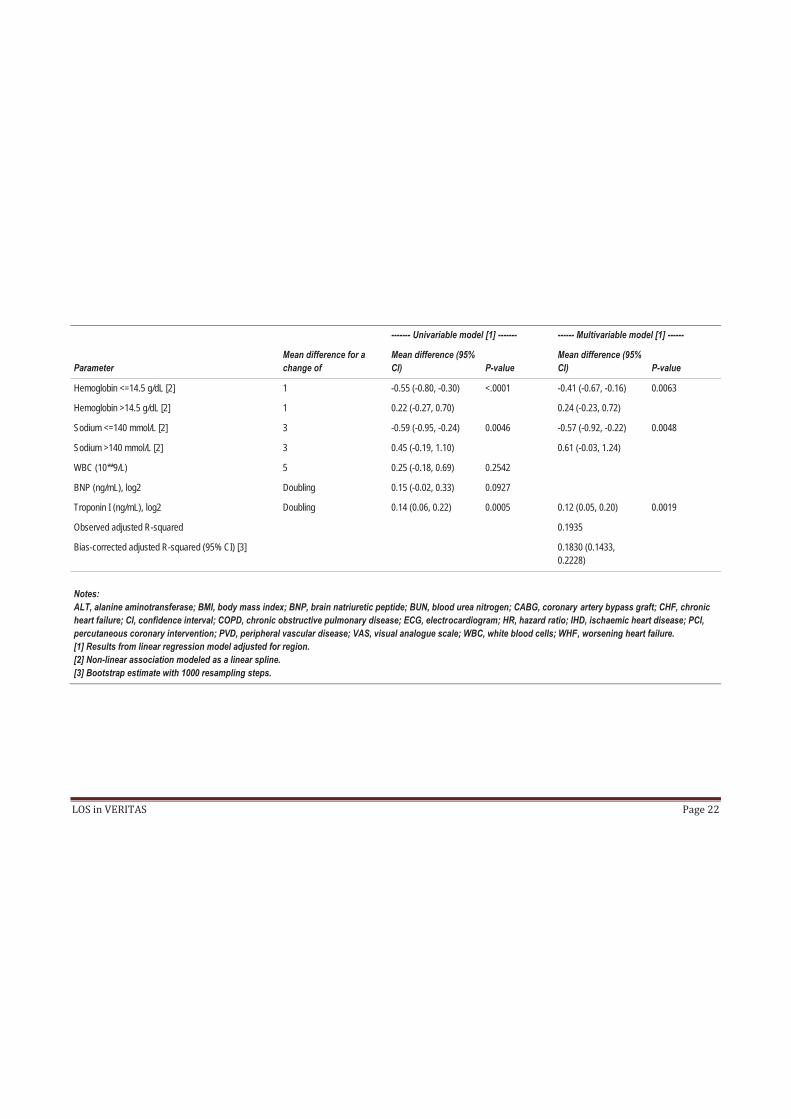
Table 3. After multivariable adjustment, more severe dyspnea at randomization, history of diabetes
mellitus or valvular heart disease, higher creatinine or troponin I, and lower hemoglobin (up to 14.5
g/dL) or sodium (up to 140 mmol/L) were associated with longer LOS. Higher systolic BP (up to 145
mmHg) was associated with shorter LOS.
With adjustment for region, longer LOS was not associated with the risk of HF readmission from
randomization to day 30 (OR 1.01, 95% CI 0.97-1.06, p=0.5768) in patients who were alive and
discharged before day 30. As described above, to further examine the associations of LOS with early
readmissions, taking into account that during the 30 days after randomization patients with longer LOS
had less days at risk for readmission, we examined the association between LOS and the risk of HF
readmission during the first 10 days post discharge (early “rebound” re-admissions) in the 1199 patients
discharged before day 20. Univariable associations between baseline characteristics and 10-day post-
discharge HF readmission are presented in supplemental Table 1. Each additional day of LOS was
associated with an OR for 10-day readmission of 1.08 (95% CI 1.01-1.16); p=0.0189. However, after

LOS in VERITAS Page 8
multivariable adjustment for baseline characteristics, the association became non-significant [Table 4;
OR 1.06 (0.99 -1.14); p=0.0961]. Introducing both LOS and WHF into the model diminished the
association further [OR = 1.05 (0.97 – 1.13); p = 0.2336].
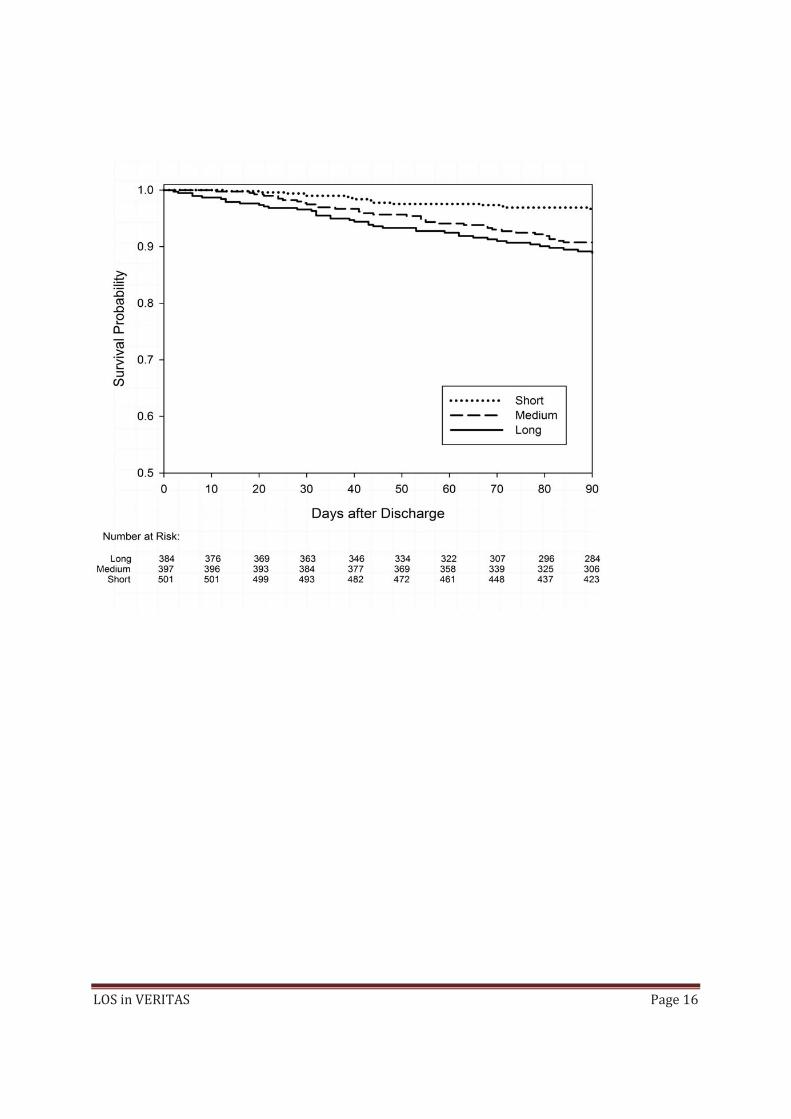
Univariable associations with 90-day post-discharge mortality are presented in supplemental Table 2,
and the cumulative risk by LOS category is presented in Figure 2. With adjustment only for region, longer
LOS was associated with a higher rate of 90-day post-discharge mortality (HR for 1-day increase 1.05,
95% CI 1.02-1.07, p=0.0004). After multivariable adjustment for baseline characteristics (Table 4), the HR
for each additional day of LOS was reduced to 1.04 (1.01-1.07), p=0.0166. After further adjustment for
the occurrence of in-hospital worsening heart failure (WHF), the association between LOS and 90-day
post-discharge mortality was further reduced and became non-significant: 1.03 (1.00-1.06), p=0.0629,
while the association between WHF and 90-day post-discharge mortality remained highly significant [HR
1.59 (1.02-2.48), p= 0.0396]. Further adjustment for changes from baseline to 24 hours in albumin,
creatinine, BUN, and ALT did not change the estimated HR for LOS, although further reduced statistical
significance (1.03, 95% CI 0.99-1.06, p=0.0997). There was no interaction between LOS and tezosentan
treatment (p=0.5482).
Adjusted only for geographic region, days in the ICU were not significantly associated with 90-day post-
discharge mortality (HR 1.04, 95% CI 0.99-1.09, p=0.0823). After multivariable adjustment for baseline
characteristics, the association was nearly statistically significant (HR 1.05, 95% CI 1.00-1.11, p=0.0577);
however, after adjustment for overall hospital LOS, association with ICU days was significantly reduced
and became non-significant (HR 1.03, 95% CI 0.98-1.09, p=0.2717).

LOS in VERITAS Page 9
Discussion
Hospital length of stay is increasingly used as a measure of quality of care in patients admitted for acute
heart failure (2) both from the perspective of the patients, who perceive time in the hospital as an
unpleasant experience and would in some cases trade years of life for less time in the hospital (16) and
health systems for which HF admissions represent an ever-growing financial burden (17). We examined
the predictors and associations between LOS and outcomes in the VERITAS study. First, as noted
previously (3-6), we found that LOS varied substantially by geographical region and hence all analysis
performed here were adjusted for geographical region. Adjusted for region, longer LOS was associated
with some measures of more severe HF, including worse dyspnea and greater end organ dysfunction/
damage (elevated troponin, creatinine/ BUN), as well as co-morbidities (age, diabetes, chronic kidney
disease, anemia)(Table 2). However, BNP was not a predictor of LOS, in either the univariable or
multivariable analyses. The adjusted r-square (0.19) from a multivariable model suggests that most of
the variability of LOS is not explained by heart failure severity or co-morbidities, even after adjustment
for region. Conceivably some of this variability may be related to other factors such as hospital bed
availability and patients’ socioeconomic status and availability of social support (18), factors that were
not captured in the VERITAS program.
Data on the association of LOS and outcomes is scarce. From the one hand it was suggested (4) that
longer LOS is associated with lower short-term (up to day 30) readmissions rates, mostly due to quick
post discharge readmissions in the days after discharge while on the other hand a recent US based
health care provider analysis suggested that longer LOS is associated with more early (“rebound”) and
late readmissions and death (8)In both analysis, readmission and death were measured from
presentation, hence patients with shorter LOS have “more time” to be readmitted since they are
discharged earlier and have therefore “more days” at risk given the fixed follow-up period from
LOS in VERITAS Page 10
randomization and admission, potentially biasing the analysis of the association between LOS and short-
term readmission. To clarify this issue we have undertaken an analysis in which a fixed period of days
post discharge was examined. As the vast majority of patients had a LOS < 20 days and readmission
information was available in VERITAS for only 30 days, we examined the rate of HF readmissions during
the vulnerable period of the first 10 days post-discharge. This approach towards analyzing readmissions
in early vulnerable period after discharge and their association with LOS was also supported by a recent
analysis suggesting that post-discharge readmissions during the first few days after discharge are
common and potentially associated with LOS, while readmissions occurring later during the post-
discharge period are not (18). In VERITAS, longer LOS was associated with a higher (and not lower) rate
of short-term readmission, although this association was diminished by adjustment for severity of heart
failure at baseline, and further diminished when adjusted for the occurrence of in-hospital WHF (Table
4).
The univariable and multivariable associations of post discharge 90-day mortality are presented in
supplemental table 2 and table 5. Overall baseline characteristics alone were moderately predictive of
post discharge 90-day mortality (c-index = 0.7421). Longer LOS was associated with greater risk of 90-
day mortality. This association remained significant even after adjustment for baseline characteristics
(Table 4). The significance of the association of LOS and 90-day post discharge mortality was reduced
after further adjustment for changes from baseline to 24 hours in albumin, creatinine, BUN, and ALT,
suggesting that changes in end organ function during the first day of admission may herald the adverse
outcomes associated with longer LOS. Similarly, the association of LOS with 90-day post discharge
mortality was significantly reduced after adjustment for in-hospital worsening heart failure (WHF). The
association between in-patient WHF, longer LOS and adverse outcomes in VERITAS has been previously
described (19). Indeed, in the current analysis the introduction of both in-patient WHF and LOS into the
multivariable model diminished the association between LOS and 90-day mortality but not that of WHF
LOS in VERITAS Page 11
and 90 day mortality. This suggests that some of the risk of mortality associated with longer LOS is
attributable to the occurrence of in-hospital WHF.
We observed a trend towards association between ICU days and 90-days post discharge mortality,
however this trend did not reach statistical significance, and was further reduced by adjustment for total
in hospital LOS. As ICU days were captured in the VERITAS database only in full days it did not allow for
granular determination of the time spent in the ICU and hence, full analysis of the contribution of ICU to
the associations of LOS and outcomes will require further analysis in larger studies where LOS and ICU
days are captured in more detail.
Therefore, the analysis of the associations between LOS and 90-day mortality and LOS and 10-day
readmission rates demonstrates concordance, i.e., longer LOS is associated with higher risk of short-
term mortality and HF readmission.
Limitations
This analysis is a retrospective analysis of the VERITAS program and is hence limited by the data
collected in the study, the relatively small sample size, and especially with regard to post-discharge
readmissions which were only collected during the first 30 days after randomization regardless of the
discharge date.
Conclusions:
Longer LOS is an important outcome in AHF both from the perspective of the patient experience and
healthcare systems. Longer LOS is only partially explained by severity of HF and co-morbidities at
baseline. Longer LOS is associated with a higher risk of adverse outcomes post-discharge; both 10-day
HF readmission and 90-day death, although the association with readmission was significantly reduced
after adjustment for baseline characteristics. The association between longer LOS and mortality may be
LOS in VERITAS Page 12
heralded by worsening end organ function in the first day of admission and importantly, mediated by in-
hospital WHF. The finding that WHF is associated with longer LOS and higher mortality raises the
possibility that therapies that prevent in-hospital WHF could improve outcomes.
References:
1. Mozaffarian D, Benjamin EJ, Go AS, et al. American Heart Association Statistics C, Stroke
Statistics S. Heart disease and stroke statistics--2015 update: a report from the American Heart
Association. Circulation 2015; 131: e29-322.
2. Bueno H, Ross JS, Wang Y, et al. Trends in length of stay and short-term outcomes among Medicare
patients hospitalized for heart failure, 1993-2006. JAMA. 2010; 303: 2141-7.
3. Heidenreich PA, Sahay A, Kapoor JR, et al. Divergent trends in survival and readmission following a
hospitalization for heart failure in the Veterans Affairs health care system 2002 to 2006. J Am Coll
Cardiol. 2010; 56: 362-8.
4. Eapen ZJ, Reed SD, Li Y, Kociol RD, et al. Do countries or hospitals with longer hospital stays for acute
heart failure have lower readmission rates?: Findings from ASCEND-HF. Circ Heart Fail. 2013; 6: 727-32.
5. Mentz RJ, Cotter G, Cleland JG, et al. International differences in clinical characteristics, management,
and outcomes in acute heart failure patients: better short-term outcomes in patients enrolled in Eastern
Europe and Russia in the PROTECT trial. Eur J Heart Fail. 2014; 16: 614-24.
6. Khan H, Greene SJ, Fonarow GC, et al.; EVEREST Trial Investigators. Length of hospital stay and 30-day
readmission following heart failure hospitalization: insights from the EVEREST trial. Eur J Heart Fail. 2015
May 9.

LOS in VERITAS Page 13
7. Di Tano G, De Maria R, Gonzini L, et al.; on the behalf of the IN-HF Outcome Investigators. The 30-day
metric in acute heart failure revisited: data from IN-HF Outcome, an Italian nationwide cardiology
registry. Eur J Heart Fail. 2015 May 27.
8. Reynolds K, Butler MG, Kimes TM, et al. Relation of Acute Heart Failure Hospital Length of Stay to
Subsequent Readmission and All-Cause Mortality. Am J Cardiol. 2015; 116:400-405.
9. Kaboli PJ1, Go JT, Hockenberry J, Glasgow JM, et al. Associations between reduced hospital length
of stay and 30-day readmission rate and mortality: 14-year experience in 129 Veterans Affairs hospitals.
Ann Intern Med. 2012; 157: 837-45.
10. McMurray JJ, Teerlink JR, Cotter G, et al.; VERITAS Investigators. Effects of tezosentan on symptoms
and clinical outcomes in patients with acute heart failure: the VERITAS randomized controlled trials.
JAMA. 2007; 298: 2009-19.
11. Teerlink JR, McMurray JJ, Bourge RC, et al.; VERITAS Investigators. Tezosentan in patients with acute
heart failure: design of the Value of Endothelin Receptor Inhibition with Tezosentan in Acute heart
failure Study (VERITAS). Am Heart J. 2005; 150: 46-53.
12. Milo-Cotter O, Cotter-Davison B, Lombardi C, et al. Neurohormonal activation in acute heart failure:
results from VERITAS. Cardiology 2011; 119: 96-105.
13. Rubin DB, Schenker N. Multiple imputation in health-care databases: an overview and some
applications. Stat Med 1991; 10: 585–598.
14. Kremers WK. Concordance for Survival Time Data: Fixed and Time-Dependent Covariates and
Possible Ties in Predictor and Time. Technical Report Series No. 80. Rochester, MN: Department of
Health Science Research, Mayo Clinic; 2007. http://www.mayo.edu/research/documents/biostat-
80pdf/doc-10027891. Assessed May 1, 2015.
LOS in VERITAS Page 14
15. Harrell FE Jr, Lee KL, Mark DB. Multivariable prognostic models: issues in developing models,
evaluating assumptions and adequacy, and measuring and reducing errors. Stat Med 1996; 15: 361–387.
16. Lewis EF, Johnson PA, Johnson W, et al. Preferences for quality of life or survival expressed by
patients with heart failure. J Heart Lung Transplant. 2001; 20: 1016-24.
17. Heidenreich P.A., Trogdon J.G., Kavjou O.A. Forecasting the future of cardiovascular disease in the
United States: a policy statement from the American Heart Association. Circulation. 2011; 123: 933-944.
18. Graham KL, Wilker EH, Howell MD, et al. Differences between early and late readmissions among
patients: a cohort study. Ann Intern Med. 2015; 162: 741-9.
19. Cotter G, Metra M, Davison BA, et al.; VERITAS Investigators. Worsening heart failure, a critical event
during hospital admission for acute heart failure: results from the VERITAS study. Eur J Heart Fail. 2014;
16: 1362-71.
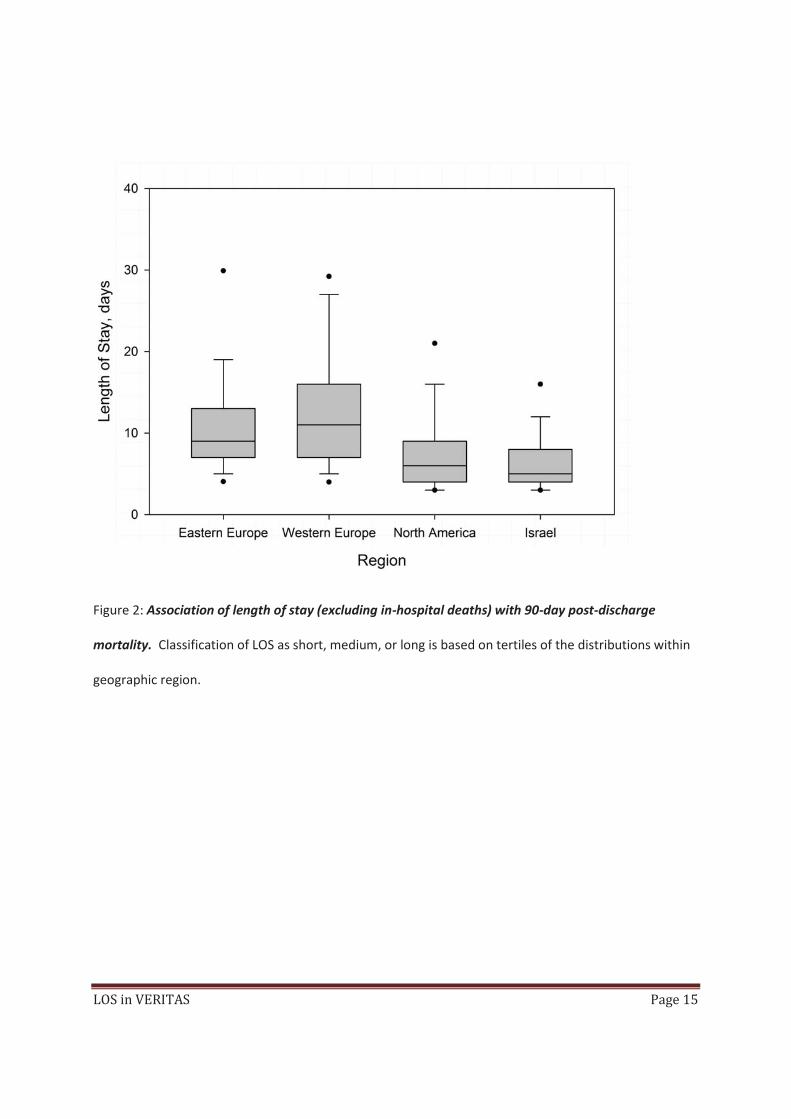
Figure 1: Distribution of length of stay (excluding in-hospital deaths) by geographic region. Lines on
the box represent the 25th, 50th, and 75th percentiles, whiskers the 10th and 90th percentiles, and dots the
5th and 95th percentiles of the distributions.
LOS in VERITAS Page 15
Figure 2: Association of length of stay (excluding in-hospital deaths) with 90-day post-discharge
mortality. Classification of LOS as short, medium, or long is based on tertiles of the distributions within
geographic region.
LOS in VERITAS Page 16

LOS in VERITAS Page 17
Table 1: Length of stay by patient status and region
---- Subjects who survived to discharge ----
(N = 1282) Subjects who died during initial hospital stay
(N = 55) ------------------------ Total ------------------------
(N = 1337)
Region Number of subjects Length of stay [1]
Number of subjects Length of stay [1]
Number of subjects Length of stay [1]
North America and Australia
346 (27.0%) 7.8 (5.90), 6.0 (4.0 - 9.0) 8 (14.5%) 17.6 (13.88), 14.5 (6.0 - 26.0) 354 (26.5%) 8.0 (6.33), 6.0 (4.0 - 9.0)
Israel 454 (35.4%) 6.7 (4.39), 5.0 (4.0 - 8.0) 12 (21.8%) 24.1 (30.10), 11.5 (7.5 - 31.0) 466 (34.9%) 7.2 (6.91), 5.0 (4.0 - 8.0)
Western Europe 294 (22.9%) 12.8 (7.39), 11.0 (7.0 - 16.0) 23 (41.8%) 29.8 (43.35), 9.0 (7.0 - 31.0) 317 (23.7%) 14.0 (14.18), 11.0 (7.0 - 16.0)
Eastern Europe 188 (14.7%) 10.9 (6.05), 9.0 (7.0 - 13.0) 12 (21.8%) 35.8 (49.20), 10.0 (5.0 - 52.0) 200 (15.0%) 12.4 (14.26), 9.0 (7.0 - 13.0)
Overall 1282 (100%) 9.0 (6.33), 7.0 (5.0 - 11.0) 55 (100%) 28.1 (38.76), 10.0 (6.0 - 31.0) 1337 (100%) 9.8 (10.66), 7.0 (5.0 - 11.0)
Notes: [1] Results shown are mean (standard deviation), median (25th - 75th percentile).

LOS in VERITAS Page 18
Table 2: Baseline characteristics by length of stay categories (excluding in-hospital deaths)
----------------------------------------------------- Length of stay [1] -----------------------------------------------------
Parameter n (% missing) Short (N = 501) Medium (N = 397) Long (N = 384)
P-value [2]
Age (years) 1282 (0.0%) 68.3 (12.67), 70.0 (60.0 - 78.0) 71.4 (12.06), 74.0 (65.0 - 81.0) 70.7 (11.93), 73.0 (64.0 - 79.0) 0.0004
Gender: Male 1282 (0.0%) 303 (60.5%) 226 (56.9%) 228 (59.4%) 0.5544
Race: White 1282 (0.0%) 409 (81.6%) 353 (88.9%) 343 (89.3%) 0.0008
Time to randomization (hours) 1282 (0.0%) 10.8 (6.88), 9.3 (4.5 - 16.9) 10.8 (6.69), 8.9 (4.7 - 15.8) 11.1 (7.01), 9.3 (4.7 - 17.1) 0.6996
BMI (kg/m2) 1215 (5.2%) 29.2 (6.45), 28.0 (24.5 - 32.5) 28.7 (5.78), 27.7 (24.9 - 31.8) 28.7 (6.48), 27.4 (24.5 - 31.2) 0.4866
Atrial fibrillation on admission 1272 (0.8%) 124 (24.9%) 103 (26.1%) 110 (28.9%) 0.4191
History of CHF 1272 (0.8%) 376 (75.4%) 286 (73.1%) 272 (71.2%) 0.3811
History of COPD 1281 (0.1%) 89 (17.8%) 74 (18.6%) 82 (21.4%) 0.3767
History of diabetes 1281 (0.1%) 218 (43.5%) 190 (47.9%) 205 (53.5%) 0.0128
History of hyperlipidemia 1281 (0.1%) 186 (37.1%) 146 (36.8%) 125 (32.6%) 0.3313
History of hypertension 1281 (0.1%) 393 (78.4%) 316 (79.6%) 309 (80.7%) 0.7151
History of smoking 1281 (0.1%) 45 (9.0%) 31 (7.8%) 23 (6.0%) 0.2589
History of IHD, PVD, stroke 1281 (0.1%) 333 (66.5%) 282 (71.0%) 275 (71.8%) 0.1679
History of mitral/aortic valve disease
1281 (0.1%) 69 (13.8%) 64 (16.1%) 73 (19.1%) 0.1055
History of renal impairment 1272 (0.8%) 157 (31.6%) 158 (40.1%) 155 (40.7%) 0.0064
History of liver disease 1272 (0.8%) 35 (7.0%) 30 (7.6%) 36 (9.4%) 0.4082
Previous PCI or CABG 1281 (0.1%) 186 (37.1%) 137 (34.5%) 129 (33.7%) 0.5274
LOS in VERITAS Page 19
----------------------------------------------------- Length of stay [1] -----------------------------------------------------
Parameter n (% missing) Short (N = 501) Medium (N = 397) Long (N = 384)
P-value [2]
Systolic blood pressure (mmHg) 1268 (1.1%) 130.3 (20.98), 126.5 (115.0 - 143.0) 133.0 (23.75), 129.0 (115.0 - 147.0) 131.9 (22.78), 128.0 (115.0 - 145.0) 0.1838
Respiratory rate (breaths/min) 1266 (1.2%) 25.8 (3.79), 25.5 (24.0 - 28.0) 26.3 (4.39), 26.0 (24.0 - 28.0) 26.4 (3.93), 26.0 (24.0 - 28.0) 0.0861
Heart rate (bpm) 1281 (0.1%) 82.9 (17.10), 81.5 (70.5 - 93.5) 83.9 (17.73), 82.5 (71.0 - 94.5) 84.1 (17.63), 82.0 (71.0 - 95.5) 0.5363
ECG QRS interval (ms) 1273 (0.7%) 111.7 (34.88), 102.0 (80.0 - 130.0) 114.5 (34.56), 105.5 (82.0 - 139.0) 113.4 (35.29), 102.0 (86.0 - 134.0) 0.4743
Baseline dyspnea VAS (mm) 1266 (1.2%) 60.5 (22.69), 62.0 (50.0 - 75.0) 63.4 (23.59), 68.0 (50.0 - 80.0) 64.1 (23.76), 70.0 (50.0 - 81.0) 0.0495
Albumin (g/L) 992 (22.6%) 38.41 (5.137), 38.50 (35.00 - 42.00) 37.69 (5.138), 38.00 (34.00 - 41.00) 37.18 (5.081), 37.00 (34.00 - 40.90) 0.0067
ALT (U/L) [3] 1113 (13.2%) 18.87, 18.39 (12.44 - 27.33) 20.50, 19.06 (12.91 - 29.20) 19.44, 18.00 (11.71 - 30.91) 0.2564
BUN (mmol/L) [3] 1241 (3.2%) 7.80, 7.69 (5.84 - 10.00) 8.49, 8.03 (6.16 - 10.99) 8.99, 8.92 (6.48 - 12.23) <.0001
Creatinine (umol/L) 1279 (0.2%) 110.64 (34.847), 104.31 (88.40 - 129.06)
117.75 (39.304), 112.13 (88.40 - 138.34)
121.85 (40.590), 114.92 (90.00 - 147.31)
<.0001
Hemoglobin (g/dL) 1281 (0.1%) 13.55 (1.784), 13.60 (12.38 - 14.80) 13.34 (1.885), 13.30 (11.90 - 14.60) 13.08 (1.935), 12.90 (11.50 - 14.50) 0.0009
Sodium (mmol/L) 1264 (1.4%) 138.96 (3.669), 139.00 (137.00 - 141.00)
138.75 (3.839), 139.00 (137.00 - 141.00)
138.52 (4.218), 139.00 (136.00 - 141.00)
0.2426
WBC (10**9/L) 1275 (0.5%) 9.48 (3.677), 8.80 (7.00 - 11.15) 9.84 (3.657), 9.20 (7.50 - 11.40) 9.80 (3.915), 8.90 (7.20 - 11.40) 0.2780
BNP (pg/mL) [3] 1196 (6.7%) 326.6, 378.0 (130.0 - 814.0) 389.4, 442.0 (169.0 - 990.0) 400.1, 455.0 (180.0 - 996.0) 0.0584
Troponin I (ng/mL) [3] 1195 (6.8%) 0.0110, 0.0200 (0.0005 - 0.0780) 0.0225, 0.0420 (0.0005 - 0.1620) 0.0276, 0.0380 (0.0005 - 0.1600) <.0001

LOS in VERITAS Page 20
Notes: ALT, alanine aminotransferase; BMI, body mass index; BNP, brain natriuretic peptide; BUN, blood urea nitrogen; CABG, coronary artery bypass graft; CHF, chronic heart failure; COPD, chronic obstructive pulmonary disease; ECG, electrocardiogram; IHD, ischaemic heart disease; PCI, percutaneous coronary intervention; PVD, peripheral vascular disease; VAS, visual analogue scale; WBC, white blood cells. [1] Results shown are mean (standard deviation), median (25th - 75th percentile) for continuous variables, or prevalence (%) for dichotomous variables, unless otherwise noted. Numbers may vary due to missing values. [2] P-values from ANOVA (F-test) for continuous variables, or from Chi-squared test for dichotomous variables, unless otherwise noted. [3] Results shown are geometric mean, median (25th - 75th percentile). P-value from ANOVA (F-test) based on log2 transformed values.
Table 3: Univariable and multivariable associations of baseline characteristics with length of stay (excluding in-hospital deaths)
------- Univariable model [1] ------- ------ Multivariable model [1] ------
Parameter Mean difference for a change of
Mean difference (95% CI) P-value
Mean difference (95% CI) P-value
Age (years) 10 0.05 (-0.23, 0.33) 0.7376
Gender: Male Yes vs. No 0.07 (-0.58, 0.73) 0.8291
Race: White Yes vs. No 1.44 (0.29, 2.59) 0.0141
Time to randomization (hours) 1 0.02 (-0.02, 0.07) 0.3315
BMI (kg/m2) 5 0.06 (-0.21, 0.34) 0.6468
Atrial fibrillation on admission Yes vs. No 0.39 (-0.34, 1.13) 0.2927
History of CHF Yes vs. No -0.07 (-0.81, 0.67) 0.8522
History of COPD Yes vs. No 0.68 (-0.14, 1.50) 0.1025
History of diabetes Yes vs. No 1.11 (0.47, 1.75) 0.0007 0.96 (0.32, 1.60) 0.0033

LOS in VERITAS Page 21
------- Univariable model [1] ------- ------ Multivariable model [1] ------
Parameter Mean difference for a change of
Mean difference (95% CI) P-value
Mean difference (95% CI) P-value
History of hyperlipidemia Yes vs. No -0.42 (-1.13, 0.28) 0.2419
History of hypertension Yes vs. No -0.11 (-0.91, 0.69) 0.7886
History of smoking Yes vs. No -1.00 (-2.24, 0.25) 0.1159
History of IHD, PVD, stroke Yes vs. No 0.62 (-0.09, 1.33) 0.0868
History of mitral/aortic valve disease Yes vs. No 1.12 (0.24, 1.99) 0.0124 0.94 (0.08, 1.80) 0.0319
History of renal impairment Yes vs. No 1.16 (0.49, 1.83) 0.0007
History of liver disease Yes vs. No 0.96 (-0.24, 2.16) 0.1156
Previous PCI or CABG Yes vs. No -0.04 (-0.73, 0.64) 0.8980
Systolic blood pressure <=145 mmHg [2] 10 -0.25 (-0.49, -0.01) 0.0067 -0.25 (-0.49, -0.01) 0.0104
Systolic blood pressure >145 mmHg [2] 10 0.54 (0.20, 0.88) 0.50 (0.16, 0.83)
Respiratory rate (breaths/min) 5 0.36 (-0.04, 0.76) 0.0782
Heart rate (bpm) 5 0.03 (-0.07, 0.12) 0.5978
ECG QRS interval (ms) 10 0.04 (-0.06, 0.13) 0.4396
Baseline dyspnea VAS (mm) 10 0.20 (0.06, 0.34) 0.0054 0.18 (0.05, 0.32) 0.0084
Albumin (g/L) 5 -0.53 (-0.89, -0.17) 0.0041
ALT (U/L), log2 <=4.2 [2] Doubling -0.79 (-1.54, -0.03) 0.0875
ALT (U/L), log2 >4.2 [2] Doubling 0.44 (-0.12, 0.99)
BUN (mmol/L), log2 <=3 [2] Doubling -0.13 (-1.12, 0.86) 0.0002
BUN (mmol/L), log2 >3 [2] Doubling 1.53 (0.74, 2.32)
Creatinine (umol/L) 10 0.18 (0.09, 0.26) <.0001 0.10 (0.02, 0.19) 0.0202
LOS in VERITAS Page 22
------- Univariable model [1] ------- ------ Multivariable model [1] ------
Parameter Mean difference for a change of
Mean difference (95% CI) P-value
Mean difference (95% CI) P-value
Hemoglobin <=14.5 g/dL [2] 1 -0.55 (-0.80, -0.30) <.0001 -0.41 (-0.67, -0.16) 0.0063
Hemoglobin >14.5 g/dL [2] 1 0.22 (-0.27, 0.70) 0.24 (-0.23, 0.72)
Sodium <=140 mmol/L [2] 3 -0.59 (-0.95, -0.24) 0.0046 -0.57 (-0.92, -0.22) 0.0048
Sodium >140 mmol/L [2] 3 0.45 (-0.19, 1.10) 0.61 (-0.03, 1.24)
WBC (10**9/L) 5 0.25 (-0.18, 0.69) 0.2542
BNP (ng/mL), log2 Doubling 0.15 (-0.02, 0.33) 0.0927
Troponin I (ng/mL), log2 Doubling 0.14 (0.06, 0.22) 0.0005 0.12 (0.05, 0.20) 0.0019
Observed adjusted R-squared 0.1935
Bias-corrected adjusted R-squared (95% CI) [3] 0.1830 (0.1433, 0.2228)
Notes: ALT, alanine aminotransferase; BMI, body mass index; BNP, brain natriuretic peptide; BUN, blood urea nitrogen; CABG, coronary artery bypass graft; CHF, chronic heart failure; CI, confidence interval; COPD, chronic obstructive pulmonary disease; ECG, electrocardiogram; HR, hazard ratio; IHD, ischaemic heart disease; PCI, percutaneous coronary intervention; PVD, peripheral vascular disease; VAS, visual analogue scale; WBC, white blood cells; WHF, worsening heart failure. [1] Results from linear regression model adjusted for region. [2] Non-linear association modeled as a linear spline. [3] Bootstrap estimate with 1000 resampling steps.

LOS in VERITAS Page 23
Table 4: Association of length of stay (excluding in-hospital deaths) with 10-day post-discharge HF readmission
Multivariable model [1] Multivariable model incl. length
of stay [1]
Multivariable model incl. length of stay and in-hospital WHF by
day 7 [1]
Parameter RR for a change of OR (95% CI) P-value OR (95% CI) P-value OR (95% CI) P-value
Age (years) 1 1.03 (1.00, 1.06) 0.0306 1.03 (1.00, 1.06) 0.0369 1.03 (1.00, 1.06) 0.0401
Systolic Blood Pressure (mmHg) 1 0.99 (0.97, 1.00) 0.0613 0.99 (0.97, 1.00) 0.0578 0.99 (0.97, 1.00) 0.0672
Creatinine (umol/L) 1 1.01 (1.00, 1.02) 0.0049 1.01 (1.00, 1.02) 0.0095 1.01 (1.00, 1.02) 0.0145
Sodium (mmol/L) 1 0.93 (0.87, 1.00) 0.0356 0.93 (0.87, 1.00) 0.0379 0.93 (0.87, 1.00) 0.0456
History of Diabetes Yes vs. No 1.78 (0.99, 3.20) 0.0533 1.76 (0.98, 3.16) 0.0584 1.75 (0.98, 3.16) 0.0608
Length of stay (days) 1 1.06 (0.99, 1.14) 0.0961 1.05 (0.97, 1.13) 0.2336
In-hospital WHF by day 7 Yes vs. No 1.43 (0.77, 2.67) 0.2544
Observed C-statistic 0.7053 0.7137 0.7202
Interaction test of length of stay with region 0.5830 0.5971
Notes: CI, confidence interval; OR, odds ratio; WHF, worsening heart failure. [1] Results from logistic regression model stratified by region.

LOS in VERITAS Page 24
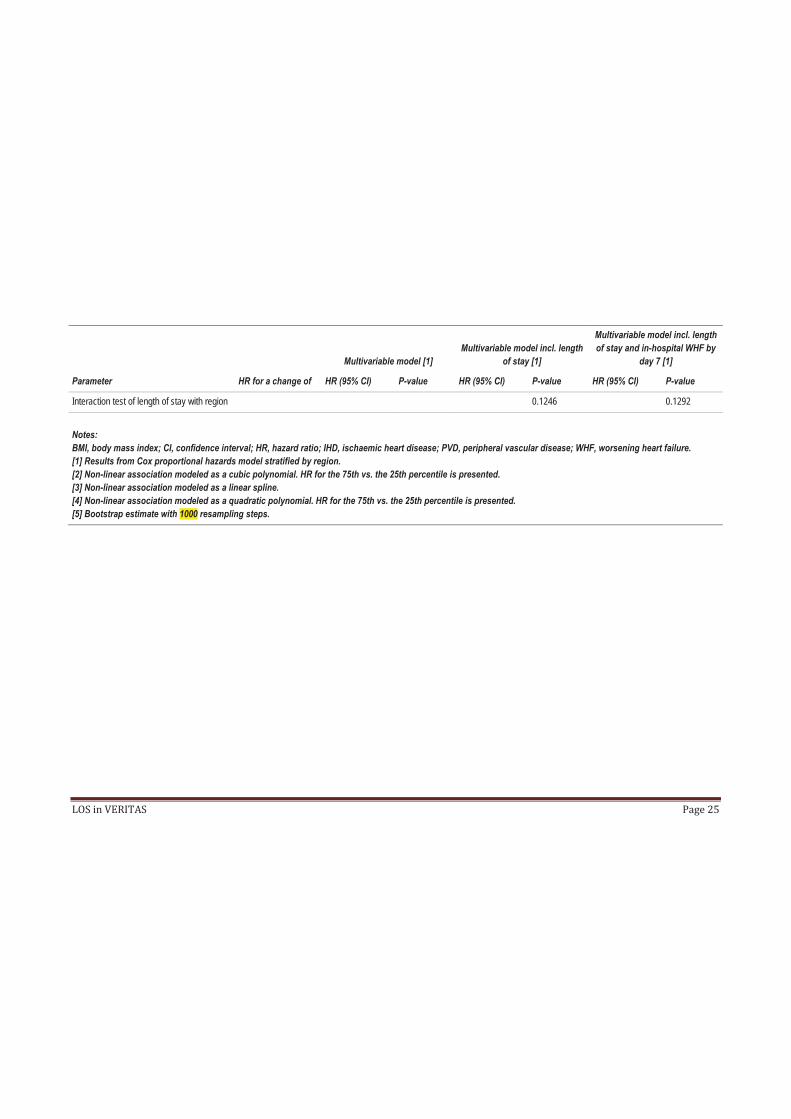
Table 5: Association of length of stay (excluding in-hospital deaths) with 90-day post-discharge mortality
Multivariable model [1] Multivariable model incl. length
of stay [1]
Multivariable model incl. length of stay and in-hospital WHF by
day 7 [1]
Parameter HR for a change of HR (95% CI) P-value HR (95% CI) P-value HR (95% CI) P-value
Age (years) [2] 79.00 vs. 62.00 2.88 (1.62, 5.13) 0.0005 2.89 (1.63, 5.11) 0.0014 2.87 (1.63, 5.07) 0.0011
BMI <=30 kg/m2 [3] 5 0.69 (0.50, 0.97) 0.0971 0.69 (0.49, 0.96) 0.0920 0.69 (0.50, 0.97) 0.0950
BMI >30 kg/m2 [3] 5 1.16 (0.77, 1.75) 1.16 (0.77, 1.74) 1.17 (0.77, 1.75)
History of IHD, PVD, stroke Yes vs. No 1.68 (0.94, 2.98) 0.0785 1.60 (0.90, 2.86) 0.1112 1.59 (0.89, 2.84) 0.1180
History of renal impairment Yes vs. No 1.73 (1.12, 2.66) 0.0128 1.66 (1.07, 2.55) 0.0223 1.61 (1.04, 2.48) 0.0324
Systolic blood pressure (mmHg) 10 0.89 (0.80, 0.99) 0.0346 0.89 (0.80, 0.99) 0.0381 0.89 (0.80, 1.00) 0.0427
Albumin (g/L) [4] 41.27 vs. 34.31 0.57 (0.39, 0.83) 0.0270 0.59 (0.40, 0.86) 0.0441 0.61 (0.42, 0.88) 0.0571
Troponin I (ng/mL), log2 Doubling 1.04 (0.99, 1.10) 0.1149 1.04 (0.98, 1.09) 0.1780 1.03 (0.98, 1.09) 0.2270
Length of stay (days) 1 1.04 (1.01, 1.07) 0.0166 1.03 (1.00, 1.06) 0.0629
In-hospital WHF by day 7 Yes vs. No 1.59 (1.02, 2.48) 0.0396
Observed C-index 0.7421 0.7527 0.7559
LOS in VERITAS Page 25
Multivariable model [1] Multivariable model incl. length
of stay [1]
Multivariable model incl. length of stay and in-hospital WHF by
day 7 [1]
Parameter HR for a change of HR (95% CI) P-value HR (95% CI) P-value HR (95% CI) P-value
Interaction test of length of stay with region 0.1246 0.1292
Notes: BMI, body mass index; CI, confidence interval; HR, hazard ratio; IHD, ischaemic heart disease; PVD, peripheral vascular disease; WHF, worsening heart failure. [1] Results from Cox proportional hazards model stratified by region. [2] Non-linear association modeled as a cubic polynomial. HR for the 75th vs. the 25th percentile is presented. [3] Non-linear association modeled as a linear spline. [4] Non-linear association modeled as a quadratic polynomial. HR for the 75th vs. the 25th percentile is presented. [5] Bootstrap estimate with 1000 resampling steps.
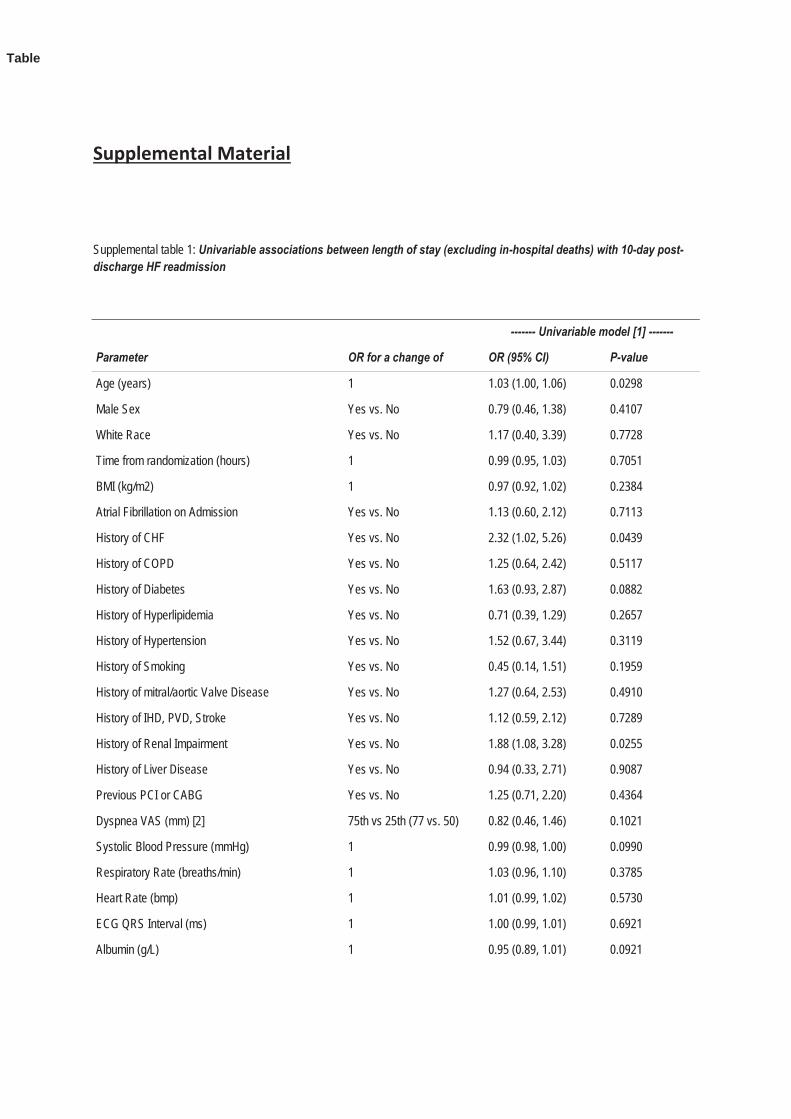
Supplemental Material
Supplemental table 1: Univariable associations between length of stay (excluding in-hospital deaths) with 10-day post-discharge HF readmission
------- Univariable model [1] -------
Parameter OR for a change of OR (95% CI) P-value
Age (years) 1 1.03 (1.00, 1.06) 0.0298
Male Sex Yes vs. No 0.79 (0.46, 1.38) 0.4107
White Race Yes vs. No 1.17 (0.40, 3.39) 0.7728
Time from randomization (hours) 1 0.99 (0.95, 1.03) 0.7051
BMI (kg/m2) 1 0.97 (0.92, 1.02) 0.2384
Atrial Fibrillation on Admission Yes vs. No 1.13 (0.60, 2.12) 0.7113
History of CHF Yes vs. No 2.32 (1.02, 5.26) 0.0439
History of COPD Yes vs. No 1.25 (0.64, 2.42) 0.5117
History of Diabetes Yes vs. No 1.63 (0.93, 2.87) 0.0882
History of Hyperlipidemia Yes vs. No 0.71 (0.39, 1.29) 0.2657
History of Hypertension Yes vs. No 1.52 (0.67, 3.44) 0.3119
History of Smoking Yes vs. No 0.45 (0.14, 1.51) 0.1959
History of mitral/aortic Valve Disease Yes vs. No 1.27 (0.64, 2.53) 0.4910
History of IHD, PVD, Stroke Yes vs. No 1.12 (0.59, 2.12) 0.7289
History of Renal Impairment Yes vs. No 1.88 (1.08, 3.28) 0.0255
History of Liver Disease Yes vs. No 0.94 (0.33, 2.71) 0.9087
Previous PCI or CABG Yes vs. No 1.25 (0.71, 2.20) 0.4364
Dyspnea VAS (mm) [2] 75th vs 25th (77 vs. 50) 0.82 (0.46, 1.46) 0.1021
Systolic Blood Pressure (mmHg) 1 0.99 (0.98, 1.00) 0.0990
Respiratory Rate (breaths/min) 1 1.03 (0.96, 1.10) 0.3785
Heart Rate (bmp) 1 1.01 (0.99, 1.02) 0.5730
ECG QRS Interval (ms) 1 1.00 (0.99, 1.01) 0.6921
Albumin (g/L) 1 0.95 (0.89, 1.01) 0.0921
Table
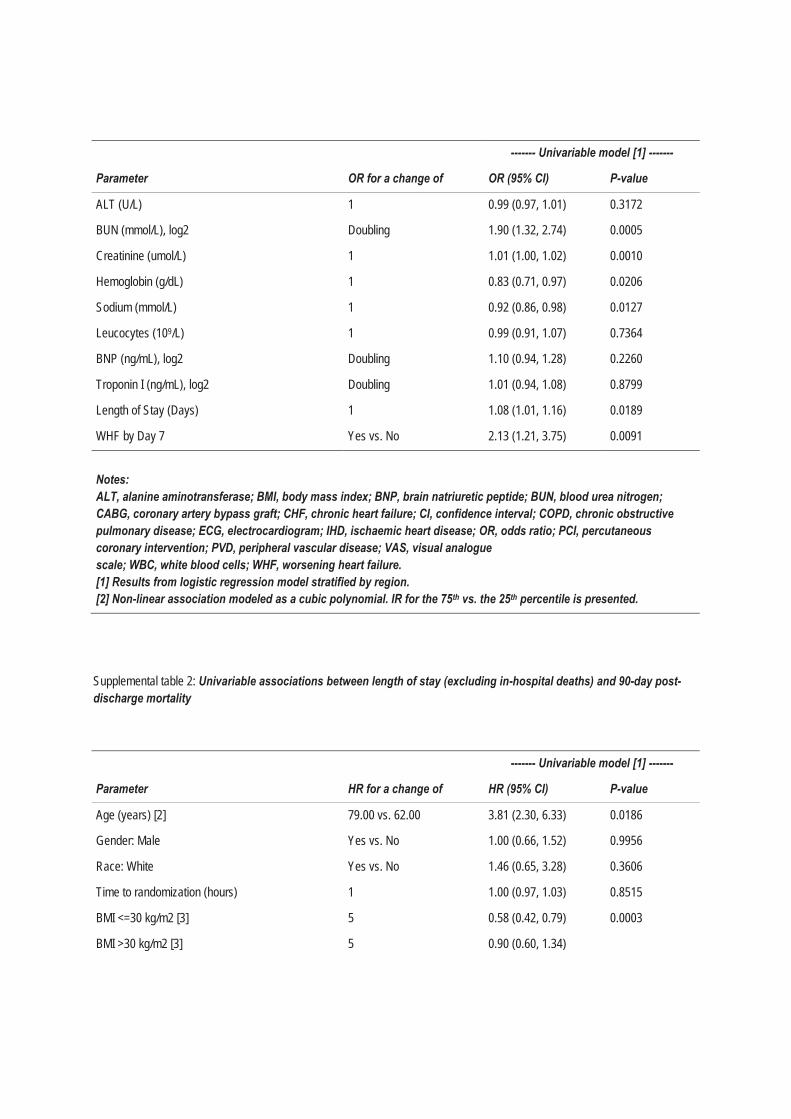
------- Univariable model [1] -------
Parameter OR for a change of OR (95% CI) P-value
ALT (U/L) 1 0.99 (0.97, 1.01) 0.3172
BUN (mmol/L), log2 Doubling 1.90 (1.32, 2.74) 0.0005
Creatinine (umol/L) 1 1.01 (1.00, 1.02) 0.0010
Hemoglobin (g/dL) 1 0.83 (0.71, 0.97) 0.0206
Sodium (mmol/L) 1 0.92 (0.86, 0.98) 0.0127
Leucocytes (109/L) 1 0.99 (0.91, 1.07) 0.7364
BNP (ng/mL), log2 Doubling 1.10 (0.94, 1.28) 0.2260
Troponin I (ng/mL), log2 Doubling 1.01 (0.94, 1.08) 0.8799
Length of Stay (Days) 1 1.08 (1.01, 1.16) 0.0189
WHF by Day 7 Yes vs. No 2.13 (1.21, 3.75) 0.0091
Notes: ALT, alanine aminotransferase; BMI, body mass index; BNP, brain natriuretic peptide; BUN, blood urea nitrogen; CABG, coronary artery bypass graft; CHF, chronic heart failure; CI, confidence interval; COPD, chronic obstructive pulmonary disease; ECG, electrocardiogram; IHD, ischaemic heart disease; OR, odds ratio; PCI, percutaneous coronary intervention; PVD, peripheral vascular disease; VAS, visual analogue scale; WBC, white blood cells; WHF, worsening heart failure. [1] Results from logistic regression model stratified by region. [2] Non-linear association modeled as a cubic polynomial. IR for the 75th vs. the 25th percentile is presented.
Supplemental table 2: Univariable associations between length of stay (excluding in-hospital deaths) and 90-day post-discharge mortality
------- Univariable model [1] -------
Parameter HR for a change of HR (95% CI) P-value
Age (years) [2] 79.00 vs. 62.00 3.81 (2.30, 6.33) 0.0186
Gender: Male Yes vs. No 1.00 (0.66, 1.52) 0.9956
Race: White Yes vs. No 1.46 (0.65, 3.28) 0.3606
Time to randomization (hours) 1 1.00 (0.97, 1.03) 0.8515
BMI <=30 kg/m2 [3] 5 0.58 (0.42, 0.79) 0.0003
BMI >30 kg/m2 [3] 5 0.90 (0.60, 1.34)
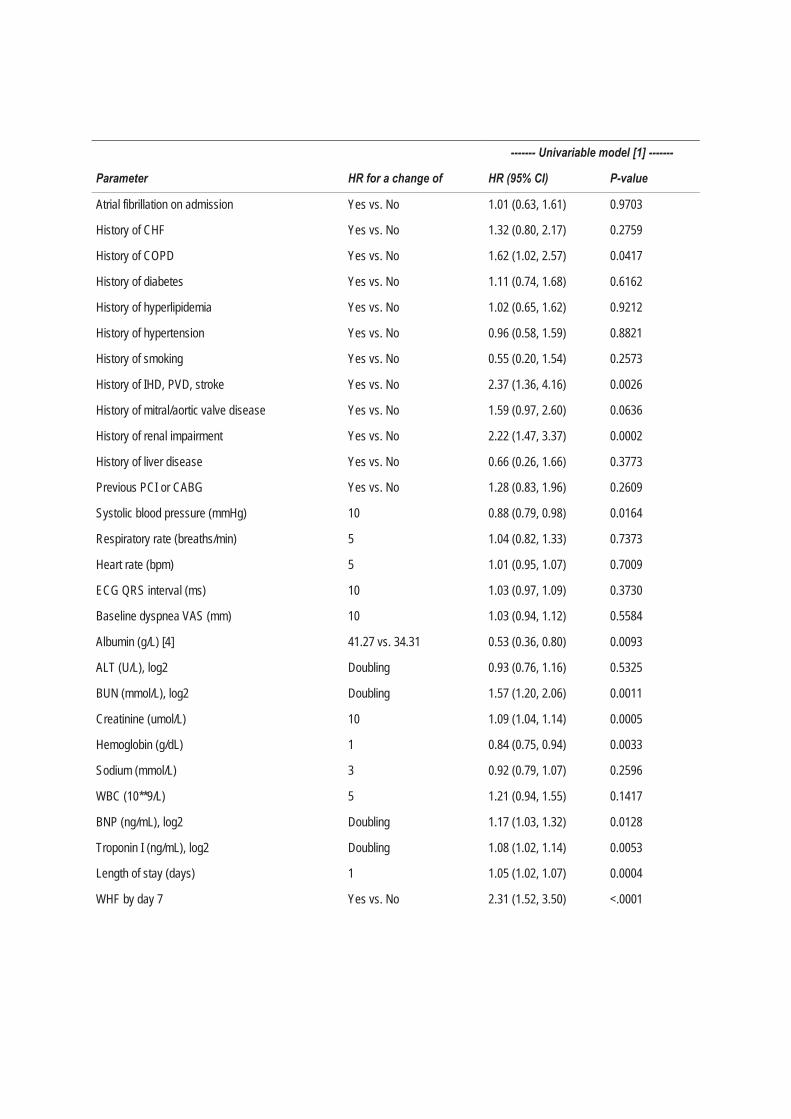
------- Univariable model [1] -------
Parameter HR for a change of HR (95% CI) P-value
Atrial fibrillation on admission Yes vs. No 1.01 (0.63, 1.61) 0.9703
History of CHF Yes vs. No 1.32 (0.80, 2.17) 0.2759
History of COPD Yes vs. No 1.62 (1.02, 2.57) 0.0417
History of diabetes Yes vs. No 1.11 (0.74, 1.68) 0.6162
History of hyperlipidemia Yes vs. No 1.02 (0.65, 1.62) 0.9212
History of hypertension Yes vs. No 0.96 (0.58, 1.59) 0.8821
History of smoking Yes vs. No 0.55 (0.20, 1.54) 0.2573
History of IHD, PVD, stroke Yes vs. No 2.37 (1.36, 4.16) 0.0026
History of mitral/aortic valve disease Yes vs. No 1.59 (0.97, 2.60) 0.0636
History of renal impairment Yes vs. No 2.22 (1.47, 3.37) 0.0002
History of liver disease Yes vs. No 0.66 (0.26, 1.66) 0.3773
Previous PCI or CABG Yes vs. No 1.28 (0.83, 1.96) 0.2609
Systolic blood pressure (mmHg) 10 0.88 (0.79, 0.98) 0.0164
Respiratory rate (breaths/min) 5 1.04 (0.82, 1.33) 0.7373
Heart rate (bpm) 5 1.01 (0.95, 1.07) 0.7009
ECG QRS interval (ms) 10 1.03 (0.97, 1.09) 0.3730
Baseline dyspnea VAS (mm) 10 1.03 (0.94, 1.12) 0.5584
Albumin (g/L) [4] 41.27 vs. 34.31 0.53 (0.36, 0.80) 0.0093
ALT (U/L), log2 Doubling 0.93 (0.76, 1.16) 0.5325
BUN (mmol/L), log2 Doubling 1.57 (1.20, 2.06) 0.0011
Creatinine (umol/L) 10 1.09 (1.04, 1.14) 0.0005
Hemoglobin (g/dL) 1 0.84 (0.75, 0.94) 0.0033
Sodium (mmol/L) 3 0.92 (0.79, 1.07) 0.2596
WBC (10**9/L) 5 1.21 (0.94, 1.55) 0.1417
BNP (ng/mL), log2 Doubling 1.17 (1.03, 1.32) 0.0128
Troponin I (ng/mL), log2 Doubling 1.08 (1.02, 1.14) 0.0053
Length of stay (days) 1 1.05 (1.02, 1.07) 0.0004
WHF by day 7 Yes vs. No 2.31 (1.52, 3.50) <.0001

------- Univariable model [1] -------
Parameter HR for a change of HR (95% CI) P-value
In-hospital WHF by day 7 Yes vs. No 2.27 (1.49, 3.45) 0.0001
Notes: ALT, alanine aminotransferase; BMI, body mass index; BNP, brain natriuretic peptide; BUN, blood urea nitrogen; CABG, coronary artery bypass graft; CHF, chronic heart failure; CI, confidence interval; COPD, chronic obstructive pulmonary disease; ECG, electrocardiogram; HR, hazard ratio; IHD, ischaemic heart disease; PCI, percutaneous coronary intervention; PVD, peripheral vascular disease; VAS, visual analogue scale; WBC, white blood cells; WHF, worsening heart failure. [1] Results from Cox proportional hazards model stratified by region. [2] Non-linear association modeled as a cubic polynomial. HR for the 75th vs. the 25th percentile is presented. [3] Non-linear association modeled as a linear spline. [4] Non-linear association modeled as a quadratic polynomial. HR for the 75th vs. the 25th percentile is presented.