rrs in the new freight era - northwestern university
TRANSCRIPT

RRs in the New Freight Era NUTC Sandhouse 2017
Xmastime (12/5), 2017Anthony B Hatch
abh consulting/NYC

Railroads Since Staggers• Regulation Era (1900s-1980)
– Awful ROI– Cash used for Conglomeracy
• Deregulation Era (1981-1995)– Cost Cutting (Labor, Rolling Stock, RE)– Short Line Creation– Non-core (non-rail) assets sold/spun– Market share losses to deregulated, subsidized trucking– US manufacturing decline
• Core Consolidation Era (1995-2002)• “Railroad Renaissance” (2003-2014)

Railroad Renaissance Prep
• Core Consolidation (1995-2002)– Mergers (& IPOs) create US “Big 4”+ 2 Canadians
(& KSU and 600 short lines)– Mergers stall ROI improvement initially, targets
late (culture/IT/Capex issues, etc)– Globalization & Response – ther creation of
modern international intermodal– PRB Coal booms– EHH takes over at CN

Renaissance at last2003-2014)
• Railroads gain pricing power ~2003• RR ORs decline; ROIs reach CoC levels• Rereg threats emerge/rails’ financial position improves• RR Capex jumps to 20%+/revenues (but so does
DPS/repos)• Intermodal booms (with domestic joining)• Warren buys BNSF (‘08)• Activists emerge (TCI, 3G, Pershing, Mantle Ridge); EHH
to CP• Boom/Busts – not just Ag but ethanol, CBR• Coal begins secular decline (2010)

Pulse of the Ports
Issues for RR/Intermodal to 2020• Return to Growth?
• Fight over Capital – MoW vs Buybacks? Activists, IT, PTC, etc
• M&A Fight fallout effect on Capex?
• RR Pricing Power Still?
• Coal – Dead Cat Bounce?
• Factors: Oil Prices, Consumer Spend/GDP, Truck Capacity
• Infrastructure & the RR Advantage (vs subsidized highway)
• Trade and the Panama Canal impacts? NAFTA? China?
• Rail Service (& Safety) Deterioration?
• Productivity (train lengths, etc) Improvements
• Insourcing
• Driverless beats One Man Crews to the market?5

Fork in the Road – Railroads 2015-?
• Coal plummets• Rail recovery volumes don’t (yet) reach 2006-
07 peak• Auto recovery temporary?• False Hopes? (Ethanol/CBR/Sand?/Plastics?)• End of “Super Cycle” impacts Ag, Steel• IM mysteriously slows 2015-16; recovers trend
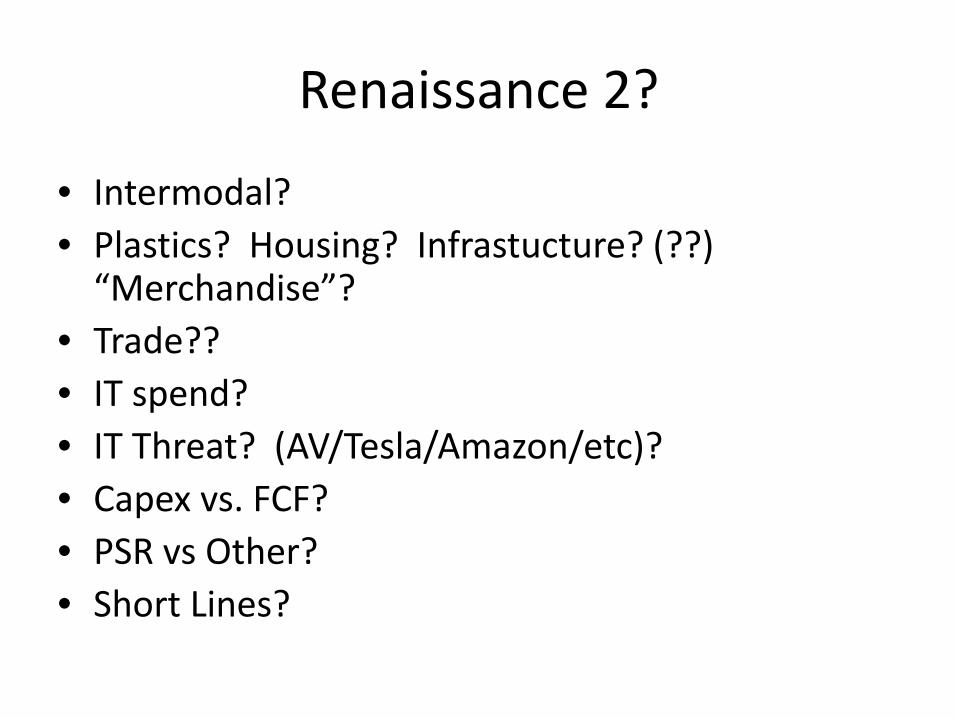
Renaissance 2?
• Intermodal?• Plastics? Housing? Infrastucture? (??)
“Merchandise”?• Trade??• IT spend?• IT Threat? (AV/Tesla/Amazon/etc)?• Capex vs. FCF?• PSR vs Other?• Short Lines?

Pulse of the Ports
Issues for RR/Intermodal to 2020• Return to Growth?
• Fight over Capital – MoW vs Buybacks? Activists, IT, PTC, etc
• M&A Fight fallout effect on Capex?
• RR Pricing Power Still?
• Coal – Dead Cat Bounce?
• Factors: Oil Prices, Consumer Spend/GDP, Truck Capacity
• Infrastructure & the RR Advantage (vs subsidized highway)
• Trade and the Panama Canal impacts? NAFTA? China?
• Rail Service (& Safety) Deterioration?
• Productivity (train lengths, etc) Improvements
• Insourcing
• Driverless beats One Man Crews to the market?8

Pulse of the Ports
Hunter’s Back!
• Mantle/EHH Team Up - EHH leaves CP – and gets his wish (a US Class One) – NOTE: Not about consolidation!
• As such, only 1 Stakeholder group – CSX shareholders –needed to approve! (2/10)
• Precision Railroading will improve OR but\when?– CSX isn’t like CP (damaged goods)– CSX isn’t like CP (density/complexity)– Customer Service is more important than ever!
• Changes already – Hump/Flat yards, Work Rules, Service metrics, Stored rolling stock, Customer reactions
• Late Summer Service Crisis (Stabilized?)• Key Dates – October 28-29 (CANCELLED!)

Pulse of the Ports
New Administration “Promises”
1. The end of the “War on Coal” – maybe a spark amongst the smoke?
2. Drill, Baby, Drill (and pipelines, eh!)3. Infrastructure (Privately Financed) – “Show me”4. Bye-bye Trade (NAFTA)?? Deficits misunderstood?5. Get out and stay out! End of the 150-year relationship of
GOP & “Big Business” (ask Ford)6. War on Regulation (maybe) on Red tape (likely)7. Lower taxes – still waiting////8. Labor – Who’s driverless, now? (Big RR labor Year; missed
opportunity?)

Infrastructure Promises vs. Reality
• Jan 20 POTUS Priority #1 ($1 trillion)• 80/20 split in favor of PPPs (?)• Reality: H1/17 Public Construction Spend
down 10%• Reality: Q2 Infrastructure Expense down to
1.4% US GDP (lowest on record)• But….Regulatory/Permitting) reform may help
private networks (such as railroads)

Cross-Border: U.S./Canada
Source: IANA ETSO, FTR Analysis
-30%
-20%
-10%
0%
10%
20%
30%
Aug Oct Dec Feb Apr Jun
X-Border U.S.-Canada: Year/Year % Change
Sources: GTC, FTR, IANA; Copyright 2017
Total
Domestic
International
Cross Border U.S.-
Canada
North America
July +13.0% +6.6%
Year to Date +9.2% +3.7%
Last 12 Month
s+4.5% +2.0%
% of Total 6.9% 100.0%

-20%
-15%
-10%
-5%
0%
5%
10%
15%
20%
Aug Oct Dec Feb Apr Jun
X-Border U.S.-Mexico: Y/Y % Change
Sources: GTC, FTR, IANA; Copyright 2017
Total
Cross-Border: U.S./Mexico
Source: IANA ETSO, FTR Analysis
Domestic
Cross Border U.S.-
Mexico
North America
July -2.9% +6.6%
Year to Date -6.4% +3.7%
Last 12 Month
s-2.3% +2.0%
% of Total 1.7% 100.0%
Only 33 ISO Boxes Crossed the Border on intermodal in J

The Freight Recession 2015-16 Silver Linings?
• Service (& Safety) Recovery (long term!) Trend (Capex Pays Off)
• Productivity (& volume?) Inflection At Last (H217?)• Restoration of the “Grand Bargain” – at risk again?• Reduced (N/T) Political Pressure (lots of other things to
focus on!)• Coal “stabilization” (Part Two)??• IM (etc.) latent demand….Bi-Modal results; Ag Volumes• Gas-fired Industrial Buildout; Southbound migration of
industry (see WoodMac & PLG and BofA, etc)• Revised MoW Capex (GTMs/Mix) frees CF/2017+

The “Grand Bargain”
• In return for higher prices (& ROI), rails spend, increase capacity & improve service (2005-2012) –The unstated “Grand Bargain”
• Rails gain pricing power (~2003) & F/S• Rails (re) Gain Market Share• Rails Spend Cash “Disproportionately” on Capex
(~18-20% of revenues)• Promotes “Virtuous Circle” – all stakeholders benefit• Under challenge, perceived and real
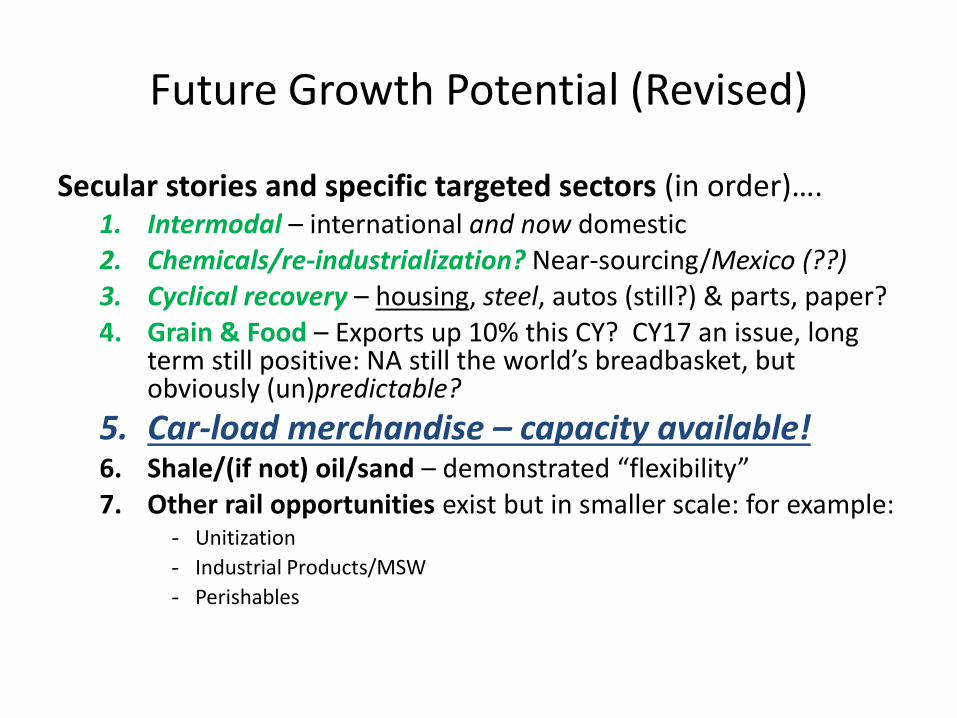
Future Growth Potential (Revised)
Secular stories and specific targeted sectors (in order)….1. Intermodal – international and now domestic2. Chemicals/re-industrialization? Near-sourcing/Mexico (??)3. Cyclical recovery – housing, steel, autos (still?) & parts, paper?4. Grain & Food – Exports up 10% this CY? CY17 an issue, long
term still positive: NA still the world’s breadbasket, but obviously (un)predictable?
5. Car-load merchandise – capacity available!6. Shale/(if not) oil/sand – demonstrated “flexibility”7. Other rail opportunities exist but in smaller scale: for example:
- Unitization- Industrial Products/MSW- Perishables

Pulse of the Ports
ASSOCIATION OF AMERICAN RAILROADS
2
3
4
5
6
7
8
'07 '08 '09 '10 '11 '12 '13 '14 '15 '16
(millions)
U.S. Rail Carloads of Coal: Not Pretty!
Data are originations and do not include the U.S. operations of CN and CP. Source: AAR Weekly Railroad Traffic

2017-18 RR EPS/Expectations• RR earnings 2016-H1 struggled to match improved sentiment
& increased expectations• H2/16 Volume inflection (coal stabilizes/IM grows)• H1 was well above bullish expectations; H2 faces tougher
comps….• Productivity (and price) retention; improvement• Capex down…but not out (?) – once again, CN leads the way!• Guidance & Visibility slightly improved….• Winter is coming (and going) – AV, etc• Big Labor Year• He’s Baaaaaack! (Fall, 2017) – watch for interesting reactions
at NS, CP

ASSOCIATION OF AMERICAN RAILROADS SLIDE 19
0
2
4
6
8
10
12
14
'80 '82 '84 '86 '88 '90 '92 '94 '96 '98 '00 '02 '04 '06 '08 '10 '12 '14 '16
Rapid Intermodal Growth
(millions)
Source: AAR Weekly Railroad Traffic
Containers
Trailers

ASSOCIATION OF AMERICAN RAILROADS SLIDE 20
Why Has Intermodal Grown Over the Years?
• Better service• Huge RR investments• Truck problems
-- fuel-- driver shortages-- congestion
• Switch from other freight cars
• Growing economy and trade

ASSOCIATION OF AMERICAN RAILROADS SLIDE 21
0%10%20%30%40%50%60%70%80%90%
100%
'90 '92 '94 '96 '98 '00 '02 '04 '06 '08 '10 '12 '14 '16
Containers vs. Trailers as % of U.S. Rail Intermodal Traffic
Source: AAR (Weekly Railroad Traffic)
Containers
Trailers

ASSOCIATION OF AMERICAN RAILROADS SLIDE 22
8
9
10
11
12
13
14
15
'07 '08 '09 '10 '11 '12 '13 '14 '15 '16
Lower Intermodal Volumes in 2016
(millions of containers and trailers)
Source: AAR (Weekly Railroad Traffic)

ASSOCIATION OF AMERICAN RAILROADS SLIDE 23
Why Did Intermodal Fallin 2016?
• Cheaper diesel fuel partially offsets RRs’ fuel efficiency advantage
• Inventory overhang
• Truck overcapacity
• Driver turnover “only” ~75%
• Lack of strong economic growth

220,000230,000240,000250,000260,000270,000280,000290,000
1 4 7 10 13 16 19 22 25 28 31 34 37 40 43 46 49 52
2015 (peak year)
2016
2017
U.S. Rail Intermodal Traffic
ASSOCIATION OF AMERICAN RAILROADSSLIDE 24
(12-week moving average originations)
Data do not include the U.S. operations of CN and CP. Source: AAR
Week #

-8%
-4%
0%
4%
8%
12%
16%
U.S. Rail Intermodal Traffic
(% change from same month previous year)
ASSOCIATION OF AMERICAN RAILROADSSLIDE 25
Data are based on originations, are not seasonally adjusted, and do not include the U.S. operations of CN and CP. Source: AAR Weekly Railroad Traffic
2011 2012 2013 2014 2015 2016 2017

Overall domestic container volumes are still a small share of total freight
Source: FTR Transportation Intelligence, TTX
2012
2013
2014
2015
2016
2017
2018
2019
2020
2021
Mill
ions
ofM
oves
Rail Domestic Container Moves and Truck Moves Over 550 Miles30
25
20
15
10
5
0
Truck Moves Rail Moves

The domestic container fleet is expected to grow 4-5%
Source:TTX
86 101 127 155143 160 190 210 227 244 265 279 288 296 309
0
50
100
150
200
250
300
350
Thou
sand
s
Year-end Domestic Container Fleet Size
2004 2005 2006 2007 2008 2009 2010 2011 2012 2013 2014 2015 2016 2017 201848-foot Dom. Cont. 53-foot Dom. Cont.

Domestic container growth has come
disproportionately from Canada and transloads
8%
7%
6%
5%
4%
3%
2%
1%
0%Mexico Canada U.S. Transloads U.S. Non-Transloads
Yr/Y
r% C
hang
e
First Half 2017 Domestic Container Growth
Source: IANA

Domestic container growth should resume,but
slow over time as the market matures
9.3%
7.0%
2.9%
13.9%
9.6%
12.7%
11.0%
5.9%4.6% 4.0%
1.8%2.5% 2.4%
0.9%2.0%
3
4
5
6
7
8
9
0%
2%
4%
6%
8%
10%
12%
14%
16%
2007
2008
2009
2010
2011
2012
2013
2014
2015
2016
2017
2018
2019
2020
2021
Mill
ions
of M
oves
vs.L
astY
ear
North America Domestic Container Volume
Growth Base ( L ) Volume Base ( R )Source: IANA, Licensed Materials, TTX

Domestic containers have been doing well in Canada,
but it is unlikely they can maintain momentum
-10%
15%
10%
5%
0%
-5%
Yr/Y
r% C
hang
e
Domestic Container Growth by Country
2012 2013 2014 2015U.S.
2016Canada
2017 2018 2019 2020 2021Mexico
Source: TTX, IANA

Rail (Five-Year) Growth Potential 1. Intermodal (domestic)*2. Intermodal (International)3. Mexico/Southern US4. Chemicals/plastics (US Gulf)5. Housing/Construction6. Sand & Aggregates7. Grain8. Industrial Products/”Merchandise” (car-load)*9. Neutral – Autos, Positive – Auto Parts*
(*Secular Modal Share Shift Opportunities)

32
$0
$2
$4
$6
$8
$10
$12
$14
$16
$18
'80 '83 '85 '87 '89 '91 '93 '95 '97 '99 '01 '03 '05 '07 '09 '11 '13 '15
Long Term Trends in Class I Freight Railroad Capital Spending($ billions)
Source: AAR

ASSOCIATION OF AMERICAN RAILROADS SLIDE 33
0%2%4%6%8%
10%12%14%16%18%20%
RRs Nonmet.Min. Prod.
Plastics &Rubber
Chemicals All Mfrg. Food
*Average 2006-2015 Sources: Census Bureau, AAR
Class I RRs
Motor Vehicles
Petr. & Coal Prod.
Railroads: Far More Capital Intensive Than Other Industries
Capital Expenditures as a % of Revenue*
Computers Wood Prod.Paper

ASSOCIATION OF AMERICAN RAILROADS SLIDE 34
Record Railroad Capital Spending in Recent Years
$9.2 $10.2 $9.9 $9.8
$11.6 $13.5 $13.1
$15.1 $17.4
$13.8
2007 2008 2009 2010 2011 2012 2013 2014 2015 2016
($ billions)
Data are for Class I railroads. 2016 is preliminary. Source: AAR

ASSOCIATION OF AMERICAN RAILROADS SLIDE 35
$0$2$4$6$8
$10$12$14$16$18
'00 '02 '04 '06 '08 '10 '12 '14 '16
Roadway and StructuresEquipment
Railroad Capital Spending($ billions, current dollars)
2016 is preliminary. Data are for Class I railroads. Source: AAR

ASSOCIATION OF AMERICAN RAILROADS SLIDE 36
80
100
120
140
160
180
200
220
'80 '83 '85 '87 '89 '91 '93 '95 '97 '99 '01 '03 '05 '07 09 '11 '13 '15Source: Federal Highway Administration
Highway lane-miles
Highway vehicle-miles traveled (VMT)
Not Realistic to Think Highway Construction Will Keep Up
(index 1980 = 100)

ASSOCIATION OF AMERICAN RAILROADS SLIDE 37
Higher Rail Profitability = Higher Rail Spending
'06 '07 '08 '09 '10 '11 '12 '13 '14 '15$0$4$8
$12$16$20$24$28$32
RR spending*
*Capital spending plus maintenance expenses. Data are current dollars and are for Class I railroads. Source: AAR
RR net income
($ billions)

ASSOCIATION OF AMERICAN RAILROADS SLIDE 38
Close Correlation Between RR ROI and Spending
6%
7%
8%
9%
10%
11%
12%
13%
14%
'06 '07 '08 '09 '10 '11 '12 '13 '14 '15$16
$18
$20
$22
$24
$26
$28
$30
$32
Rail spending* (right scale, $ bil)
*Capital spending + maintenance expense. **Net railway operating income / average net investment in transportation property. Data are for Class I railroads. Source: AAR
RR ROI** (left scale)

Future RR Capex
• 2016 Capex down across the board (annopunced average -16%!) –except CN and further midyear cuts bring 2016E to -20%?
• Changing Mix of volumes - Most Important Decision Period in Years
• 2017 -Further cuts – Still able to avoid muscle?
• Coal: “Stranded Assets”? NS selling segments….CSX of Tomorrow
• Coal/Mix: Reduced Gross Ton Miles=Reduced Maintenance of Way?
• Yet remember: Service & Safety are even more critical to future RR success
• Changing mix of capex?
• Changing %revenues (16-17%)? UNP @15%, CNI @ 20%
• PTC Extension resolution – more to develop? ECP?
39

ASSOCIATION OF AMERICAN RAILROADS SLIDE 40
Railroads Have Only Recently Earned Their Cost of Capital
0%
3%
6%
9%
12%
15%
18%
'81 '83 '85 '87 '89 '91 '93 '95 '97 '99 '01 '03 '05 '07 '09 '11 '13 '15
RR Cost of Capital
RR Return on Investment
Class I RR Cost of Capital vs. Return on Investment
Note: In 2006, the Surface Transportation Board significantly changed the method by which it calculates the rail industry cost of capital. Source: STB

ASSOCIATION OF AMERICAN RAILROADS SLIDE 41
25.3
22.8
20.7
18.0
2045p
2035p
2025p
2015e
Long-Term Demand for Freight Transportation Will Grow
Billions of Tons of Freight Transported in the U.S.
e – estimated p – projected Source: FHWA - Freight Analysis Framework, version 4.3
The U.S. DOT forecasts total U.S. freight movements to rise from around 18.0 billion tons in 2015 to 25.3 billion tons in 2045 – a 41% increase.

Railroad Philosophy
• Critical to the “RR Renaissance” has been Capex• Private vs public capital (failing US infrastructure)• Capex sparked by growth and ROI prospects –
examples: IM, CBR• “Open Access” antithetical to this….right?• Is a RR its Network (Class One belief) OR is it its
Operators (Hunter)??• Cult of the OR vs ROIC; EHH as “victim of his own
success”; short-termism

Q3/17 Earnings
• Grossly distorted by weather (costs/revenues/rebuild)
• CSX impact (not just on CSX!)• Outlook – tougher comps in coal, autos (?), sand• Price/service/capex• Beat expectations again? Yes – 4/2/1• EPS beat S&P500 levels again• Stocks significantly outperform

Railway Night Sweats• Politics by Tweet • Regulation - The Evergreen• Trade – Is Globalization over? • Trade – Will we kill it? “America First” (42% of NA-car
loads)• (Specifically) NAFTA – which impacts S….&N!• Driverless – AV beer runs! (ahh the irony)• Amazon – Who isn’t scared?• 3-D Printing – good enough for combat? Or F1?• Short-Termism/Over-reactions• Capex and FCF planning

Competitive Advantage: RR Capex vs Aged National Infrastructure

“Our Troubled Industry*”?
• H1/17 OR averaged 63% H2 improvement by 200+bps
• Rails in best-ever condition• Rail Finance – Margins, Cash Flow, etc – best ever• Coal has stabilized, at least• Volumes have inflected• Intermodal is growing again• What’s next?/*Trains Magazine March 2017

ABH Consulting/www.abhatchconsulting.comAnthony B. Hatch1230 Park AvenueNew York, NY 10128(917) [email protected]
www.railtrends.com