rrrc - university of miskolcmidra.uni-miskolc.hu/jadox_portlets/documents/document_12718...rrrc .....
TRANSCRIPT

• • rrrc .. Innovation and Teclmology Transfer Centre University of Miskolc
XXV. microCAD International Scientific Conference
31 March - 1 April 2011
D szekció: Áramlás- és hőtechnika
Section D: Fluid and Heat Engineering

• • ITTC ••
Innovation anl1 Technology Tran~1~~r Cenin:lJniversitv of Misl{ole
XXV. microCAD International Scientific Conference
31 March - 1 April 2011
D szekció: Áramlás- és hőtechnika
Section D: Fluid and Heat Engineering

A kiadvány a XXV. microCAD Nemzetközi Tudományos Konferencia lektorált publikációit tartalmazza.
The proceedings contain the revised publications of the XXV. microCAD International Scientific Conference.
Kiadja a Miskolci Egyetem lnnovációs és Technológia Transzfer Centruma Kiadásért felelős: Dr. Dobróka Mihály rektorhelyettes Szerkesztő : Dr. Bikfalvi Péter osztályvezető Nyomda: ME Sokszorosító Üzeme Üzemvezető: Kovács Tibor Nyomdaszám: ME.Tu-155/2011. ISBN 978-963-661-957-2
DESIGN OF SUCTION PIPE FOR A WIND-TUNNEL
Péter Bencs1, Enikő Kuril/a2
, Szi/árd Szabó3
1 PhD student, 2 B Sc. Student, 3 Professor Department of Fluid and Heat Engineering, University of Miskolc, Hungmy
1. INTRODUCTION
An open circuit wind-tunnel for flow measurements was designed in 2009. The size of the test section is 500x500x800 mm [l, 2]. The prismatic bodies placed in the test section of the wind-tunnel and the flow around the prismatic bodi es is investigated by LDA (Laser Doppler Anemometry), PIV (Particle Image Velocimetry), CT A (Constant Temperature Anemometry) (3-5]. The temperature tieid is determined by special pro be of CT A system, Z-type Schtieren system and BOS (Background Oriented Schlieren) system [6]. The properties of the wind-tunnel : biow-down wind-tunnel, with the test section placed near the end of the wind tunne!. Environment air is blown into the wind-tunnel by axial fan . Oil fog is required for PIY and LDA measuremen ts and a suction pi pe is needed for the disposal of the o il fog from the test area. The first objective of this work is to design the optimal suction pi pe for the wind-tunnel system. The range of suction speed: c= 0.3-5 m/s. The suction pipe has two functions; in the first case oil fog is sueked by the suction pipe. In the second case low speed (c= 0.3-1 m/s) is created by only the suction pipe. Uniform velocity distribution is required in the second case; it is the main goa! of this work. Vanes are placed in to the suction pi pe bend. The lengths and positions of the vanes are determined by set goa!. Numerical simulation is made by AnsysFLUENT software. Velocity distribution in the suction pipe is controlled by 30 numerical simulations.
2. WIND-TUNNE L
The wind-tunnel is shown in Figure l . The suction pipe is designed for this windtunnel (to remove the oil fog) .
The influence of friction can be seen in Figure 7. The hydraulic lossof the suction pipe with three vanes increases because of the extra fricti~nal surface~ (thr_ee ~anes). The change of hydraulic loss is compensated by the um form vel~c1ty ?Istnbutwn (see Figure 6). The selection of the roof fan and frequency changer IS assisted by the findings shown in Figure 7.
5. CONCLUSIONS
The results presented in this work confirm that the s~ction pipe is ~uitable for creating uniform velocity distribution in the whole veloc1ty range. The mfluence of vanes is presented in this work. The required parameters of the roof f~n an? t~e frequency changer are selected from the hydraulic loss diagram. The suctlon p1pe IS suitable for setting the suction volume flow rate (to remove of the oii fog).
6. ACKNOWLEDGEMENTS
The authors are grateful to NKTH-OTKA (68207) for the financial support of this
research.
RE FERENCES
[J] Bencs, P., Szabó, Sz.: Wind Tunne! Design for Flow and Ther~odynamics Measurements, Proc. Micro CAD International Computer Sc1ence Conf., 2009, No. E. 21-29.
[2] Bencs Péter, Dr. Szabó Szilárd: Légcsatorna tervezése áramlás- és hőtechnikai vizsgálatokhoz, Gép; 2009. 2. szám. 37-41 .
[3] Baranyi, L., Szabó, Sz., Bolló, B., Bordás, R.: Analysis of Flow Aroun~ a Heated Circular Cylinder, Proc. 7th JSME-KSME Thermal and Flmds Engineering Conference, Sapporo, Japan, 2008, Paper 08-201, A 115, pp . 1-4.
[4] Bencs, P., Bordás, R., Zahringer, K., Szabó, Sz., Thévenin, D.: Towards the Application of a Schlieren Measurement Technique in ~ Wind-Tunne l, Micro CAD International Computer Science Conference, Miskolc, Hungary, 2009, pp. 13-20.
[5] Baranyi, L., Szabó, Sz., Bolló, B., Bordás, R.: Analysis of Low Reyn~lds Number Flow around a Heated Circular Cylinder, Journal of Mechamcal Science and Technology 23 (2009) 1829-1834.
[6] Settles, G. S.: Schlieren and Shadowgraph Techniques: Visualizing Phenomena in Transparent Media, Springer-Verlag, Berlin, Heidelberg, 2001.
6
DEVELOPMENT OF A PIV-BOS TECHNIQUE FOR SIMULTANEOUS MEASUREMENT OF VELOCITY AND
TEMPERA TURE FIELD
Péter Bencs1, Péter Tóhiái, Szi/árd Szahó3
, Róbert Bordás4, Katharina
Ziihringer5, Dominique Thévenin6
1,4PhD student, 2BSc. Student, 5 Associate Professor, 3.6professor / ,2.3 Department of Fluid and Heat Engineering, University of Miskolc, Hungary
4·5
·6University of Magdeburg "Otto-von-Guericke ", Germany
l. INTRODUCTION
Bluffbodies placed in a flow, such as electricai transmission lines, cartridge heaters, pipes of heat exchangers, factory chirnneys and so on, often have a different temperature compared to that of the surroundings. The structure of the flow developing around bluff bodies has beenalready examined for a long time [1, 2]. The evolving Kármán vortex street was and is examined by numerous researchers, both experimentally and numerically. Nevertheless, the question arises, how this vortex street is modified by a heated cylindrical body. What is the influence of heating on the frequency of the detaching vortices, the structure of the vortices and the localion of the detachment? Many of these questions already have been answered by the help of numerical simulation and of measured velocity distributions using Particle Image Velocimetry (PIV) and vortex distributions obtained from these [3]. A further question is the heat loss caused by the vortex structure and forced convection. To tackle this question, the Background Oriented Schtieren (BOS) method described below has been applied. At the same time, the first steps have been taken towards determining the temperaiure and vortex distributions in real time, which are introduced in this paper. The objective of this work was to carry out non-intrusive measurements of the temperature and flow fields by means of BOS and PIV respectively, using the experience from previous research [5-9] . The flow was examined behind a heated cylinder, mounted in a Göttingen-type (closed-loop) wind-tunnel with suitable conditions. Future intention is to validate existing numerical calculations.
2. EXPERIMENT AL SETUP
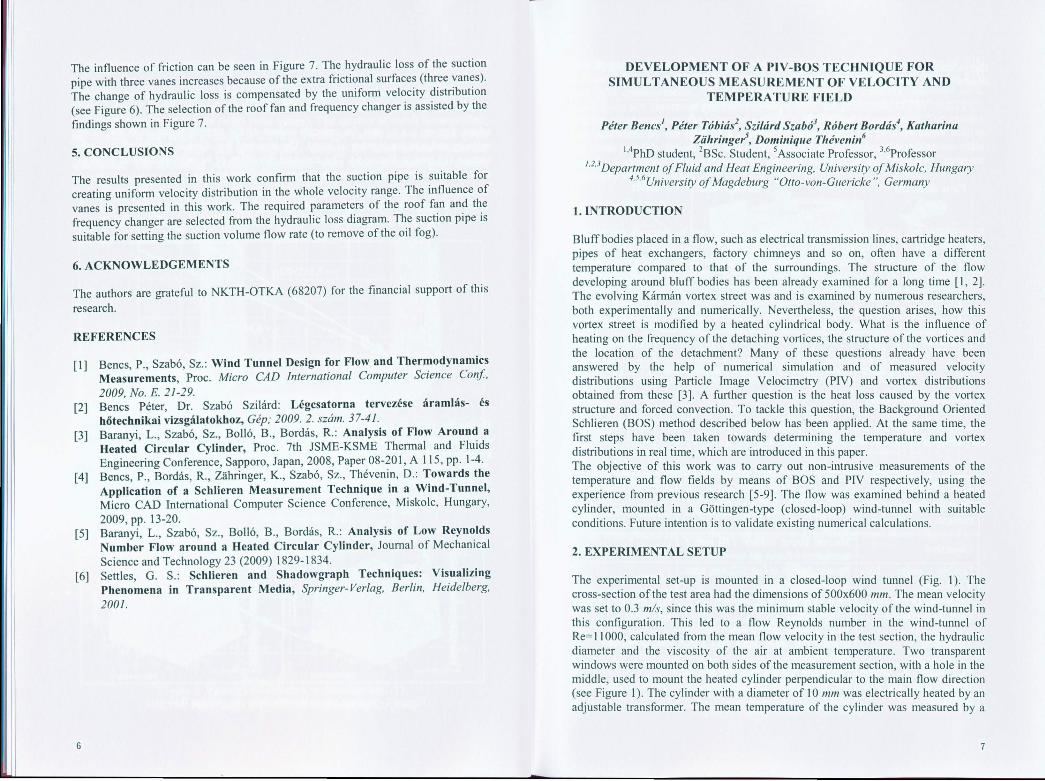
The ex perimental set-up is mounted in a closed-loop wind tunne! (Fi g. l). The cross-section of the test area had the dimensions of 500x600 mm. The mean velocity was set to 0.3 m/s, sincethis was the minimum stable velocity of the wind-tunnel in this configuration. This led to a flow Reynolds number in the wind-tunnel of Re= ll OOO, calculated from the mean flow velocity in the test section, the hydraulic diameter and the viscosity of the air at ambient temperature. Two transparent windows were mounted on bothsidesof the measurement section, with aholein the middle, used to mount the heated cylinder perpendicular to the main flow direction (see Figure l). The cylinder wi th a d i ameter of l O mm was electrically heated by an adjustable transformer. The mean temperaiure of the cylinder was measured by a
7
therrnocouple and the power of the transforrner was actjusted aceording to the desired value. The cylinder Reynolds number was RecyF200.
r---------·---;:::::::::::::::::::=::::;
i Flow direction
Carnera
Laser light sheet optics
Heated cylinder L3.0Q.~CJ
3. PIV/BOS SYSTEM
Temperaiure of heated cvlinder
Background Laser main unit
The system used for the present measurement was a regular 2D-PIV system, consisting ofthe components listed in Table l.
fh I /BOS Tab e l. Descnptwn o t e P V system
Comoonent Remarks Manufacturer
Double frame CCD Flow Sen se 2M/E wi th 8 bit resolution, recording frequency: Dantec Dynamics
carnera 15Hz
Objective Manual Focus N ikkor 180 mm; J- N ikon number: ll focus set to -4 m
Double pulse N d- Power: 2x300 mJ at 532 nm, max. Litron YAG laser frequency: 15 Hz High-energy mirrors for a wa ve length of 532 nm CVI Melles Griot
Laser sheet-ootics 7=-10 La Vision TTL logica l electronic unit to
Timerbox change the laser light and LED Self-produced lights
PC wi th a frame For image data acquisition and for grabber card and PIV the processing of the acquired Dantec Dynamics
software data
8
-The applied software for the acquisition and evaluation was a commercial PIV software (Dynamics Studio 3.0 from the co. Danlee Dynamics), used both for PIV and BOS measurements. The PIV measurements are only briefly discussed here, since there are numerous publications describing the principals of PIV (e.g., [4]). Carnera alignment was the same for both PIV and BOS measurements. The carnera was calibrated by the help of a calibration plate to set the pixlmm factor and to eliminate possihle distortion. The carnera optics was facused on the calibration p late and the J-number (the focal length of the !ens divided by the "effective" a pertu re diameter) was set to ll.
3.1. Timer Box
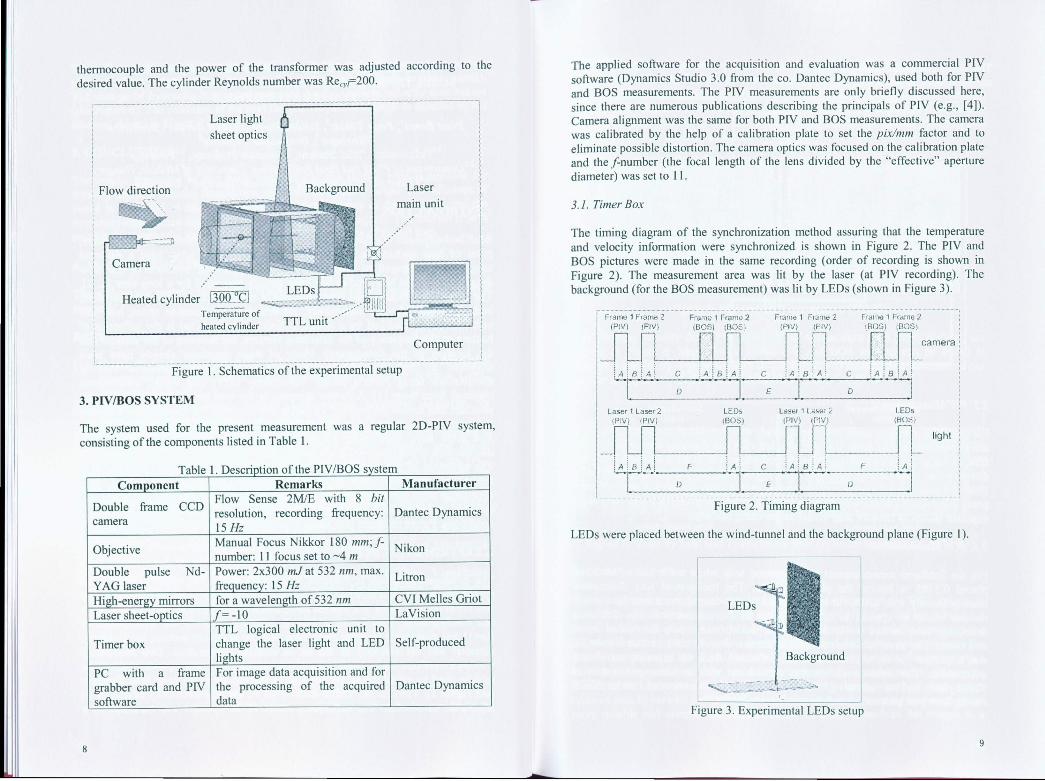
The timing diagram of the synchronization method assuring that the temperaiure and velocity information were synchronized is shown in Figure 2. The PIV and BOS pictures were made in the same recording (order of recording is shown in Figure 2). The measurement area was lit by the laser (at PIV recording). The background (for the BOS measurement) was lit by LEDs (shown in Figure 3).
Frame 1 Frame 2 Frame 1 Framo 2 Ft ame 1 Frame 2 Frame 1 Frame 2 (Pl V) (Pl V) (80S) (80S) (Pl V) (P IV) (80S) (80S)
_IUl l n n_camerai lA j B l A' c 1A!B! Al c ÍA Í B Í A i c lA l B l A 1
L D ] E
. l . . D
--l Laser 1 Laser 2 L EDs Laser 1 La~er 2 L EDs
(P!VJ iPIV) (BOS) (P IV) (PIV) {BOS)
l IL light
lA i B 1 Al F Í A i c !A! aiA( F Í A i ·-c·-· D --, E r {) --, Figure 2. Timing diagram
LE Ds were placed between the wind-tunnel and the background plan e (Figure l).
Background
Figure 3. Experimental LEDs setup
9
This timer box (with timer electronics) was especially developed for the PIV/BOS measurements. A block diagram of the timer box is shown in Figure 4.
14----<!-- AC 230 V
Flashlamp 1
Laser Q-Switch 1 (in) (out)
TTL 02 02 (in) (out) Flashlamp 2
l Laser Q-Switch 2 ·--------
Figure 4. Schematics of the timer box setup
3.2. PIV Measurements
For the PIV measurements the background was not illuminated and the TIL electronics tum on the laser light. Oil droplets of 3 ~-tm diameter were added to the flow as tracer particles and the measurement plane was lit by a doubled Nd:YAG double pulse laser through the light sheet optics with 300 mJ/pulse. The velocity tieid was calculated from the scaled images using a cross-correlation with a 64x64 pixel interrogation area, with 75% overlap. The resulting vector maps were then exported to ASCII files for later visualizalion using Matlab®.
3.3. EOS Measurements
For the Schlieren measurements a background with white noise was printed and placed 0.5185 m behind the plane of focus . The background was illuminated homogeneously with LEDs (in every second double frame), suchthat the same fnumber could be applied as in case of the PIV measurements. The Schlieren recordings were carried out in double frame mode, (where only the second frame was used). The time between two double frames, was B=i500 ps (see Figure 2), was important for the calculation of the deflection from the exported correlation information. The cross-correlation was carried out with an interrogation area of 32x32 pixels and an overlap of 75%. The results were also exported in to an ASCII file for later post processing and visualizalion in Matlab®.
10
4.RESULTS
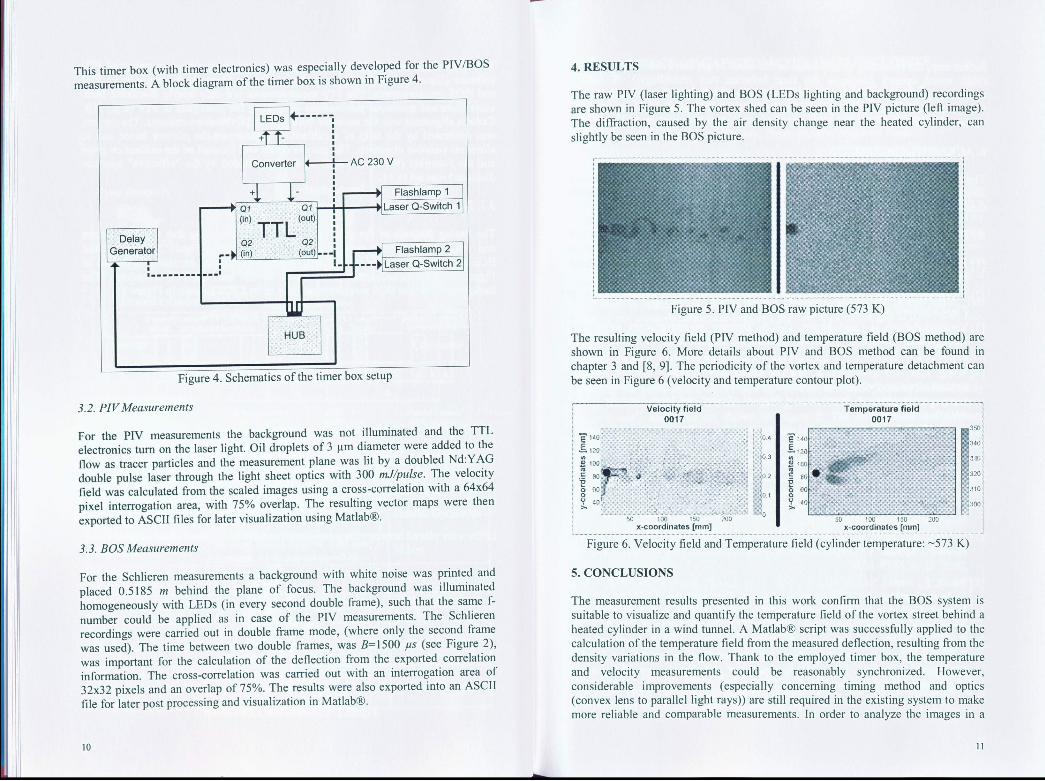
The raw PIV (laser lighting) and BOS (LEDs lighting and background) recordings are shown in Figure 5. The vortex shed can be seen in the PIV picture (left image) . The diffraction, caused by the air density change near the heated cylinder, can slightly be seen in the BOS picture.
Figure 5. PIV and BOS raw picture (573 K)
The resulting velocity tieid (PIV method) and temperature field (BOS method) are shown in Figure 6. More details about PIV and BOS method can be found in chapter 3 and [8, 9]. The periodicity of the vortex and temperaiure detachment can be seen in Figure 6 (velocity and temperaiure contour plot).
e Ho .§. 120 .. 2 100
"' ~ AO
o 60
? 40-; ,.. '
Velocity field 0017
---------------::--:--,--------, Temperatura field
0017 350
Figure 6. V elocity fi eid and Temperaiure field (cylinder temperature: ~573 K)
5. CONCLUSIONS
The measurement results presented in this work confirm that the BOS system is suitable to visualize and quantify the temperaiure fi eid of the vortex street behind a heated cylinder in a wind tunne!. A Matlab® script was successfully applied to the calculation of the temperaiure tieid from the measured deflection, resulting from the density variations in the flow. Thank to the employed timer box, the temperaiure and velocity measurements could be reasonably synchronized. However, considerab le improvements ( especially conceming timing method and opti cs (convex !ens to parallellight rays)) are still required in the existing system to make more reliable and comparable measurements. In order to analyze the images in a
ll

further step, the recording quality must be increased to get more meaningfui images (high speed carnera (decrease the time between two recordings)). A further validation possibility should also be found to check the measured temperature values in the aim to detect the ditferences in vortex shedding due to the temperature ofthe cylinder.
6. ACKNOWLEDGEMENTS
The autbors are grateful to NKTH-OTKA (68207) and to the Hungarian-German Intergovemmental S&T cooperation programs P-MÖB/386, for the financial support of this research.
RE FERENCES
[l] Ad rian, R.J. Particle-Imaging Techniques for Experimental Fluid Mechanics. Annual Reviewsin Fluid Mechanics, 1991. 23(1): p. 261-304.
[2] Williamson, C.H.K. Yortex dynamics in the cylinder wake. Annual Review of Fluid Mechanics, 1996. 28(1): p. 477-539.
[3] Venkatakrishnan, L. and Meier, G.E.A. Density measurements using the Background Oriented Schlieren technique. Experiments in Fluids, 2004. 37(2): p. 237-247.
[4] Wang, A.B. and Trávnicek, Z. On the linear beat transfer correlation of a beated circular cylinder in laminar crossflow using a new representative temperature concept. International Journal of Heat and Mass Transfer, 2001. 44(24) : p . 4635-4647.
[5] Baranyi, L., Szabó, S., Bolló, B., and Bordás, R. Analysis of Flow Around a Heated Circular Cylinder. The 7th JSME-KSME Thermal and Fluids Engineering Conference. 2008. Sapporo, Japan: (No. 08-201.), A 115. p. 1-4.
[6] Bencs, P., Bordás, R., Zahringer, K. , Szabó, S., and Thévenin, D. Towards the Application of a Schlieren Measurement Technique in a Win d-Tu n nel. Micro CAD International Computer Science Conference. 2009. Miskolc, Hungary, p. 13-19.
[7] Baranyi, L. , Szabó, S., Bolló, B., and Bordás, R. Analysis of Flow Around a Heated Circular Cylinder. Journal of Mechanical Science and Technology 2009. 23: p. 1829-1834.
[8] Bencs, P., Szabó, Sz., Bordás, R. , Thévenin, D., Zahringer, K. and Wunderlich, B. Investigation of the Velocity (PIV) and Temperature Field (BOS) of a Heated Cylinder in a Low Re-number Flow. ISFV14 - 14th International Symposium on Flow Visualization. 2010. EXCO, Daegu, Korea. p. 234/1-234/8.
[9] Bencs, P., Bordás, R., Zahringer, K. , Szabó, Sz., Thévenin, D. Application of Schtieren Measurement Technique for Forced Convection from a Heated Circular Cylinder. The 7th International Conference on Mechanical Engineering 2010, Budapest, Hungary, No. E. 203-208.
12
EFFECT OF GAP GEOMETRY ON FLOW LOSSES
Péter Bene/, Balázs Barna2, Ildikó Makó3
, Szilárd Szabó4
1 PhD student, 2 Assistant prof. , 3 Associate prof., 4 Professor 1·4 University of Miskolc, Department of Fluid and Heat Engineering
2' 3 University of Miskolc, Department of Machine Tools
l. INTRODUCTION
During the design of hydraulic reducing elements, it is important to determine the relationship between the pressure differential and the volume flow rate through a reducing gap. The flow coefficient (Kv) as a gap resistance factor is determined by the previous data. The main objective of this study is to determine the relationship between the volume flow rate, flow coefficient (Kv) , and gap geometry (gap crosssection of 9 mm\ Numerical simulation and experiments were carried out for the following gap shapes: square, circle and triangle. Another objective of this study is to use measurements to validate computational results for one case (gap length of L=15 mm) in order to be able to predict numerical results for further cases. The range of the pressure difference between the two en ds of the gap is 11p= l 0-80 bar. Numerical simulation is carried out using the Ansys Fluent software package.
2. GAP SHAPE AND EXPERIMENTAL CASES
Reducing elements with a center hole (L = l 5 mm) are made from cylindrical body (062). Reducing elements are shown in Figure l. The three differential gap shapes (A"o1.=9 mm2
) and sizes are shown in Figure 2. The test section and pressure measurement points (50 mm from the reducing element) are shown in Figure 3. Outlet pressure is set to pJ?30 bar (to avoid cavitation). The pressure difference between the in let and outlet is /1p:::: l 0-80 bar (given by measuremen t system).
Figure l. Reducing elements Figure 2. Size of gap shapes
MOL Hydro HM 46 hydraulic oil is used as the flow medium. !ts temperaturedependent properties (density, viscosity, specitic heat, heat conduction) are used in computations and the measuremen t process [l] .
13