rr - michigan state university
TRANSCRIPT


Traits Code Treatment
RR Glyphosate Tolerant
RR2 Roundup Ready Corn 2
SS SmartStax
CB Corn Borer
LL Liberty Link
HX1 Herculex 1
VT3 YieldGard VT Triple
RW Rootworm
HXX Herculex XTRA
GT Agrisure GT


Pigeon/Bad Axe
Precipitation GDD1
2011 2010 Normal3 2011 2010 Normal3
May 2.3 3.46 2.92 279 385 291
June 3.06 4.41 2.91 482 483 467
July 2.08 3.53 3.04 713 683 601
August 3.36 0.81 3.68 572 665 551
Sept 3.16 2.94 3.82 357 346 360
TOTAL 13.96 13.55 16.37 2403 2079 2,270
Sandusky
Precipitation GDD1
2011 2010 Normal3 2011 2010 Normal3
May 6.47 2.92 2.57 294 397 317
June 1.9 3.16 2.81 497 528 486
July 1.49 2.43 2.71 745 713 622
August 1.75 0.56 2.86 602 690 575
Sept 3.44 4.6 4.1 380 372 377
TOTAL 15.05 14.04 15.05 2518 2178 2,377
Fairgrove/Caro
Precipitation GDD1
2011 2010 Normal3 2011 2010 Normal3
May 3.5 3.68 2.86 325 404 353
June 1.79 3.4 3.3 526 539 519
July 1.84 1.65 2.75 730 714 644
August 4.74 1.68 3.26 594 697 594
Sept 2.68 3.94 4.22 380 376 402
TOTAL 14.55 12.56 16.39 2555 2266 2,512
Summary of Precipitation and Growing Degree Days
May - September 2011
1GDD is the growing degree days based on 50oF and 86oF cutoff (corn method) 22010 & 2011 data are based on the MAWN system in Pigeon, Fairgrove and Sandusky 3”Normal” is the average precipitation from 1971—2000 and is based on data collected at Bad Axe, Caro and Sandusky


1.1
1.0
1.0
1.3
0.8
1.0
0.8
0.8
0.8
0.8
1.3
1.4
1.3
1.4
1.6
1.5
1.6
1.1
1.6
1.3
1.1
1.4
1.3
1.1
1.0
1.3
1.3
1.3
1.0
1.6
1.2


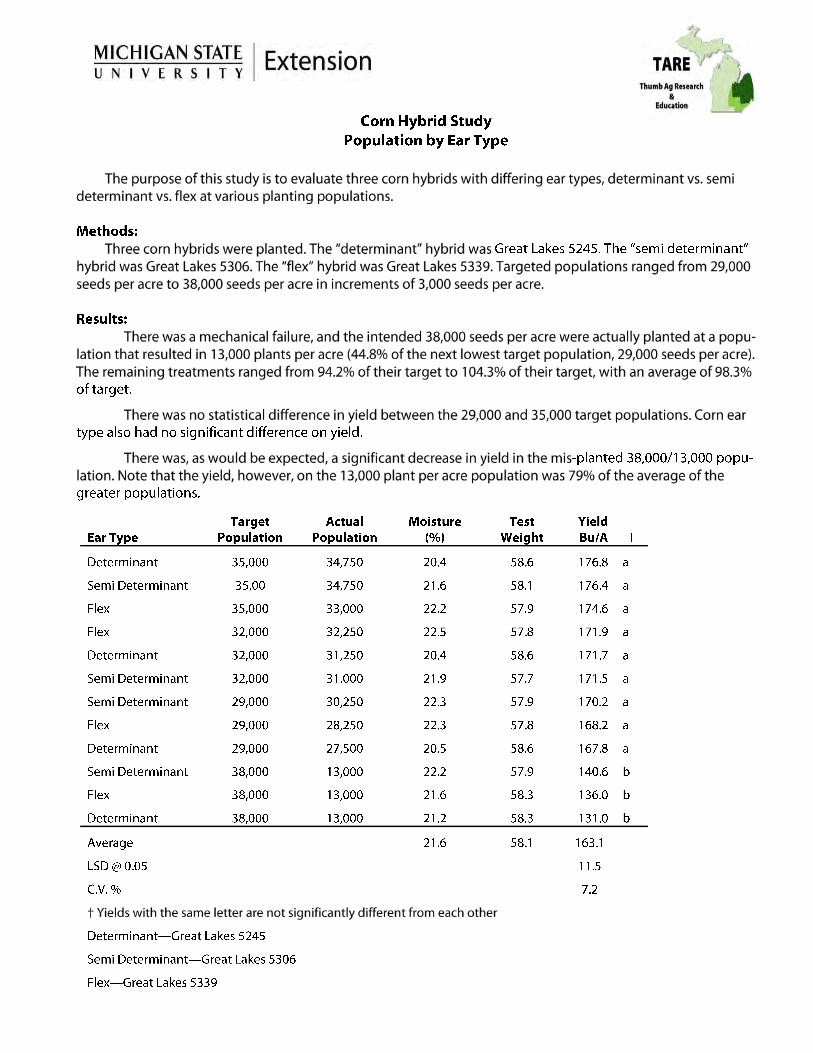

Nitrogen Rate lbs/A
Yield Bu/A Sig
0 131.4 d
40 150.2 c
80 164.1 c
120 185.3 b
160 189.9 b
200 206.6 a
240 198.7 ab
Average 175.2
LSD @ 0.05 14.5
C.V. % 5.6
Sidedress nitrogen was applied on June 29, 2011
County: Tuscola
Cooperator: Jason Haag
Nearest Town: Akron
Previous Crop: Sugarbeets
Planting Date: 5/10/2011
Row Width: 30 inch
Fertilizer: No starter
Hybrid: Croplan 388TS
Harvest Population: 31,500
Harvest Date: 11/12/2011
Experimental Design: RCBD

020406080
100120140160
Yield Bu/A

Treatment Moisture (%) Test Weight Yield Bu/A sig
UTC 18.7 59.4 163.2 a
Accolade 18.9 59.3 162.9 a
Average 18.8 59.4 163.0
LSD @ 0.05 2.8
C. V. % 5.4
Treatment Moisture (%) Test Weight Yield Bu/A Sig
Quadris 18.2 59.7 166.8 a
Stratego 18.4 59.6 163.9 a
UTC 18.4 59.6 159.7 a
Average 18.3 59.7 163.5
LSD @ 0.05 13.9
C.V. % 5.9


37.50 19.03
38.75 19.49
37.42 20.27
40.07 20.09
40.84 18.87
41.94 20.13
40.16 20.02
37.95 19.42
35.74 20.42
36.23 19.93
36.95 19.91

0.7
0.7
1.0
1.0
1.0
1.0
0.3
1.7
1.3
1.0


Treatment Moisture (%) Test Weight Yield Bu/A Sig
All Treatments 19.3 57.7 56.2 a
Headline Fungicide 18.5 57.9 54.6 ab
Foliar Fertilizer 18 58 52.7 bc
UTC 17.9 57.9 51.8 c
Pop Up Fertilizer 18.2 57.9 51.3 c
Average 18.4 57.9 53.3
LSD @ 0.05 1.9 C.V. % 4.3

67.5
68
68.5
69
69.5
70
70.5
71
71.5
72
Mn-EDTA Mn-EDTA +SoySoap
Blackjack Mn Blackjack Mn+ SoySoap
Max-In Mn Max-In Mn +SoySoap
Soybean Manganese Study Yield Bu/A
County: St. Clair
Cooperator: Don Koning
Nearest Town: Capac
Soil Type: Parkhill Loam
Tillage: Conventional
Previous Crop: Corn
Planting Date: 6/2/2011
Fertilizer: 200 # 0-0-60
Herbicide: 2 pt. Pursuit
Row Width: 20 inch
Variety: Dyna-Gro
Harvest Population: 165,000
Harvest Date: 10/8/2011
Experimental Design: RCBD

Variety Planted at all 2011 sites - Hyland HS22RY503

We acknowledge with gratitude the assistance provided the MI Soybean Promotion Committee; John Anton, Sandusky, MI; SipcamAdvan; and Crop Production Services, Sandusky. For additional information, contact Martin Nagelkirk ( [email protected])
Number of sclerotia per liter of soil Application timing of Contans @ 3 lbs/ac
Sample date
Fall application
Spring application
untreated control
#1: Fall, 09 or Spring ‘10
Aug, 2010
2.7
2.9
2.9
#2: Fall, 09 or Spring ‘10
Aug, 2011
2.0
1.4
2.8
#3: Fall, ’10 & ‘11 or Spring ’10 & ‘11
Aug, 2011
2.0
1.3
2.3
#4: Fall, ’10 or Spring ‘11
Aug, 2011
2.0
1.4
2.8
average
---
2.2
1.8
2.7

The Michigan Soybean Promotion Committee supported a study to evaluate the effect of soybean planting date in addition to the effect of plant populations. Hyland Seeds supplied the seed for the study and Zwerk & Sons Farms provided the farm location for the study to be done. The purpose of the study was to determine the optimum yield due to population and planting date. Methods: The soybean variety Hyland 24RY05 was planted in population treatments of 80K, 120K, 160K, 200K and 240K seeds/A in 20 inch rows using a Monosem planter. Three plantings were established in the same field in a randomized complete block design (RCBD) at two week intervals (May 10, May 24, and June 7). Each plot was 18 feet by 100 feet and replicated three times. The center 15 feet was harvested for each plot using a 2144 Case IH combine with an attached HarvestMaster weigh system that records grain weight, moisture, and test weight.
Results: The next page lists the details for the study along with the data and statistical analysis for the study. For the population studies, each planting date was analyzed separately for evaluation. The harvest populations for the 240K ranged from 232K-225K and averaged 228K; the 200K harvest populations ranged from 231K-210K and averaged 217K; the 160K harvest populations ranged from 173K-159K and averaged 167K; the 120K harvest populations ranged from 135K-139K and averaged 136K; and the 80K harvest population ranged from 90-84K and averaged 87K. Test weight and moisture were consistent for the entire plot. Yields for the planting dates were significantly different with the mid and late plantings resulting in reductions of 8.4% and 15.2% in yield.
County: Tuscola
Cooperator: Zwerk & Sons Farms
Nearest Town: Richville
Soil Type: Tappan-Londo loam
Tillage: Conventional
Previous Crop: Corn
Planting Date: Various
Fertilizer: None
Herbicide: Roundup
Row Width: 20 inch
Variety: Hyland 24RY05
Harvest Population: Various
Harvest Date: Nov. 2, 2011
Experimental Design: RCBD

Early Planting May 10, 2011
Moisture % Test Weight Yield Bu/A
80K 13.8 59.4 66.5 a
120K 13.7 59.4 69.3 ab
160K 13.7 59.4 70.2 ab
200K 13.5 59.5 72.3 b
240K 13.5 59.6 72.1 b
Average 70.1
LSD @ 0.05 4.50
CV % 3.41 Yields with the same letter are not significantly different
from each other.
Mid-season Planting May 24, 2011
Moisture % Test Weight Yield Bu/A
80K 13.3 59.6 62.2 a
120K 13.7 59.4 65.1 a
160K 13.4 59.6 64.9 a
200K 13.6 59.5 66.2 a
240K 13.3 59.6 62.5 a
Average 13.5 59.6 64.2
LSD @ 0.05 5.03
CV % 4.16
No statistical difference between treatments
Late Planting June 7, 2011
Moisture % Test Weight Yield Bu/A
80K 13.4 59.6 58.7 a
120K 13.3 59.7 59.5 a
160K 13.2 59.7 59.5 a
200K 13.2 59.7 59.5 a
240K 13.3 59.7 59.6 a
Average 13.3 59.7 59.3
LSD @ 0.05 3.13
CV % 2.80
No statistical difference between treatments
0
50
100
150
200
250
80K 120K 160K 200K 240K
Early
Mid
Late
50
55
60
65
70
75
Early Mid Late
Yield Bu/A

49.0
49.5
50.0
50.5
51.0
51.5
52.0
52.5
53.0
240K 200K 160K 120K 80K
Average of Sites - Yield Bu/A


Mineral Soils 2010 6-Jun 30-Jun 2-Aug 30-Aug 2011 Total Alf Cont.*
Grass Variety Grass Species Alfalfa Variety dry matter tons/acre 1-5
Pradel Meadow fescue WL 348 AP 2.93 2.69 1.01 1.48 1.09 6.27 9.20 3
Pradel Meadow fescue Magnum VI WET 2.85 2.71 1.06 1.36 1.14 6.26 9.11 2.8
Intensiv Orchardgrass WL 348 AP 2.53 2.32 0.88 1.35 1.09 5.63 8.17 2.5
Intensiv Orchardgrass Magnum VI WET 2.86 2.62 1.09 1.19 1.03 5.93 8.79 2.5
Remington Perennial ryegrass WL 348 AP 2.47 2.36 0.84 1.19 1.19 5.58 8.05 2
Remington Perennial ryegrass Magnum VI WET 2.84 2.61 0.99 1.21 1.33 6.14 8.98 2
Palaton Reed canarygrass WL 348 AP 2.91 2.05 0.98 1.37 1.11 5.50 8.41 5
Palaton Reed canarygrass Magnum VI WET 2.95 2.26 1.16 1.43 1.03 5.88 8.83 5
STF43 Tall fescue WL 348 AP 2.82 2.41 1.07 1.40 1.25 6.13 8.95 2.3
STF43 Tall fescue Magnum VI WET 3.04 2.67 1.04 1.39 1.30 6.40 9.44 2.8
none WL 348 AP 3.17 2.22 1.09 1.55 1.25 6.11 9.28 5
none Magnum VI WET 3.25 2.46 1.16 1.54 1.26 6.42 9.67 5
Mean 2.88 2.45 1.03 1.37 1.17 6.02 8.91 3.33
LSD (0.05) 0.32 0.22 0.11 0.12 0.12 0.47 0.65 0.48
Muck Soils
Pradel Meadow fescue WL 348 AP 2.93 2.53 1.00 1.17 0.95 5.65 8.58 2.5
Pradel Meadow fescue Magnum VI WET 2.85 2.56 1.12 1.27 1.20 6.14 8.99 3.3
Intensiv Orchardgrass WL 348 AP 2.92 2.40 0.99 1.34 1.05 5.78 8.70 3
Intensiv Orchardgrass Magnum VI WET 3.15 2.35 1.16 1.30 1.14 5.96 9.11 2.8
Remington Perennial ryegrass WL 348 AP 3.05 2.65 0.88 1.29 1.09 5.91 8.96 2.5
Remington Perennial ryegrass Magnum VI WET 3.06 2.40 1.04 1.31 1.09 5.84 8.91 2.5
Palaton Reed canarygrass WL 348 AP 2.98 2.08 1.12 1.42 1.24 5.86 8.84 5
Palaton Reed canarygrass Magnum VI WET 3.18 2.12 1.18 1.50 1.55 6.35 9.53 5
STF43 Tall fescue WL 348 AP 2.96 2.55 1.04 1.27 1.15 6.01 8.96 1.5
STF43 Tall fescue Magnum VI WET 3.34 3.06 1.11 1.52 1.28 6.97 10.31 1.8
none WL 348 AP 3.28 1.83 1.10 1.55 1.31 5.79 9.06 5
none Magnum VI WET 3.63 2.15 1.27 1.46 1.46 6.33 9.96 5
Mean 3.11 2.39 1.08 1.37 1.21 6.05 9.16 3.33
LSD (0.05) 0.31 0.25 0.14 0.15 0.12 0.50 0.7 0.58
* Visual rating of alfalfa content on 4/15/2011, 1 to 5, 5= 81-100% alfalfa, 4= 61-80%, 3= 41-60%, 2= 21-40, 1= 0-20%

Sown May 2011
Non-irrigated
Entry 15-Jul 22-Aug 2011
5312 1.69 1.62 3.31
Pioneer 54Q32 1.61 1.39 3.00
PLH-resistant check 1.68 1.44 3.12
Pioneer 55V12 1.62 1.40 3.02
Pioneer 55v50 1.76 1.44 3.20
AmeriSta 1.77 1.51 3.28
DG4210 1.89 1.58 3.47
Gunner 1.75 1.40 3.16
HybriF 2.06 1.47 3.53
Legendar 1.92 1.42 3.33
Prolific 2.18 1.70 3.88
Rebound6 2.09 1.44 3.53
Sonic 2.09 1.50 3.59
Vernal 2.01 1.62 3.63
WL354HQ 1.71 1.45 3.16
WL363HQ 1.72 1.40 3.12
Mean 1.85 1.49 3.33
CV% 13 15 12
LSD 5% 0.33 0.31 0.59
Location: Lynn Island Farm
Design: RCB, plot size 3 x 25' (3 x 22' harvested)
Seeded: 5/7/2011
Soil Type: Miami-Dighton sandy loam
Insects: Warrior applied prior to cut 1

Trial Background Location: Parrent Farms, Sandusky, MI Collaborators: MCIA Soil type: Capac silt loam Tillage: no-till Replications: 3 Previous crop: soybeans Treatmt area: 15 x 70 ft. Harvest area: 15 x 65 ft. Planting date: Oct 7, 2010 Harvest date: July 20, 2011 Seeding rate: 1.4 mil/ac. Fert N rate: 100 lbs/ac Fungicide: various
Herbicide: Affinity Brdspec
Response of winter wheat varieties to fungicides use, 2011 With the support of MCIA, several varieties were planted to observe their response to selected fungicide treatments. The varieties included three soft white winter varieties: Coral, D8006, and Jupiter; and three soft red varieties: Red Devil, Red Ruby and Hopewell. The fungicide treatments, including rates and timing, are listed in table 1. All applications included a nonionic surfactant. The wheat did not exhibit extensive disease development until milk stage. By early senescence, diseases including Septoria leaf spot, powdery mildew, Stagonospora leaf blotch, leaf rust, and stem rust could be found. There was considerable variability in the trial area due, in
part, to excessive rains during April and May. One replication was considered lost. Therefore, the data only represents two replications and cannot be properly analyzed. Nevertheless, these results are consistent with those of past years. As summarized in table 1, the application of Prosaro at flowering boosted yields by 6 bushels and was the only cost effective treatment under the conditions of this trial. The addition of Twinline prior to the Prosaro application further improved yields, but by only a couple bushels. Applying Tilt at tillering was not effective. Test weights were unaffected by fungicides, while grain moistures tended to be higher in those plots that received the later applications. Figure 1 illustrates each variety’s yield response to the various fungicide treatments. The responses of the varieties are similar with the possible exception of Hopewell.
Table 1: Response of wheat to fungicide treatments, 2011
treatment tst wt
(lbs/ac) moist
% yield
(bu/ac) pow.*
mildew Leaf* spot
UTC 61.8 12.9 82.3 1.2 5.6
Tilt 4oz @ tillering 61.8 12.9 83.3 0.5 4.6
Prosaro (6.5 oz) @ flower 61.5 13.4 88.7 0.0 1.5
Twinlne (9oz) @ flag & Prosaro @ flower 61.5 13.5 90.9 0.0 0.8
*Disease ratings represent the percent of disease on the flag leaf at early dough
0.0
20.0
40.0
60.0
80.0
100.0
120.0
Coral D8006 Jupiter R.Devil R.Ruby Hopewell
figure 1: Effect of fungicides on the yield of wheat varieties, 2011
untrted control
Tilt @ tillering
Prosaro @ flower
Twinline @ flag &Prosaro @ flower
Yie
ld b
u/a
c

Trial Background Location: Stone Brothers Farm Sandusky, MI Collaborator: BASF Soil Type Parkhill silt loam Soil pH: 6.5 Previous crop: soybeans Variety Pioneer 25R47 Plot area: 20 x 45 ft Treatment area: 18 x 45 ft Harvest area: 17 x 40 ft Planting date: Oct 7 Harvest date: July 15 Seeding rate: 1.8 m/ac Herbicide: none Insecticide: none
Effect of fungicides and nitrogen rates on the performance of winter wheat
A field trial was conducted to measure the effect of selected fungicides and two rates of fertilizer nitrogen (N) on wheat performance. Fungicide products were applied to plots that received 100 and 150 lbs/ac of fertilizer N. The fungicide treatments were:
1) Untreated control; 2) Caramba (13.5 oz/ac) applied at flowering; and 3) Priaxor (2 oz/ac), Twinline (9 oz/ac.), and Caramba (13.5
oz/ac.) applied at first node, early boot, and flowering, respectively.
Despite excessive rainfall during April and May, development
of foliar diseases was limited prior to heading. Leaf spot (Septoria tritici) was the most significant disease, but it not did develop significantly on the flag leaves until the third week of June. There were trace amounts of leaf rust and Fusarium head blight found just prior to senescence. Tests for DON levels revealed no differences. Increasing the rate of fertilizer N from 100 to 150 lbs/ac improved yields by over 10 bushels when averaged across fungicide treatments. At the elevated rate of N, both the Caramba and the Caramba with the Priaxor and Twinline treatments significantly improved yields over the
untreated control. The use of fungicides tended to be slightly more advantageous at the higher rate of N than at the lower rate, but these differences were not statistically significant. Test weights were higher in wheat where no fungicide was used. Martin Nagelkirk MSU Extension Educator [email protected]
Table 1: The effect of fungicides and fertilizer N winter wheat performance, Sandusky, MI, 2011
treatment
yield1
13% M (bu/ac)
harv.1
moist (%)
test1
weight (lbs)
untreated control w/ 100 lbs. N /ac.
96.7 c 16.0 c 60.2 a
untreated control w/ 150 lbs N /ac.
106.5 b 16.0 c 60.3 a
Caramba w/ 100 lbs. N /ac.
100.9 bc 16.6 bc 59.9 a
Caranba w/ 150 lbs. N/ac.
112.1 a 19.7 a 58.5 b
Priaxor, Twinline, & Caramba w/ 100 lbs. N /ac
107.0 ab 18.6 ab 59.0 b
Priaxor, Twinline, Caramba w/ 150 lbs. N /ac
118.3 a 21.4 a 57.9 b
1 Values within a column followed by the same letter are not significantly different
(P=.05)

Trial Background Location: Parrent Farms, Sandusky, MI Collaborators: MCIA Soil type: Capac silt loam Tillage: no-till Replications: 3 Previous crop: soybeans Treatmt area: 15 x 65 ft. Harvest area: 15 x 60 ft. Planting date: Oct 7, 2010 Harvest date: July 20, 2011 Seeding rate: 1.4 mil/ac. Fert N rate: various Fungicide: Tilt @ tillering
Herbicide: Affinity Brdspec
0
20
40
60
80
100
0# N 50# N 100# N 150# N
Figure 1: Response of wheat to increasing rates of N Sandusky, MI, 2011
lbs N/ac
Yiel
d b
u/a
c

Effect of Accolade on the performance of winter wheat,
A trial was conducted to observe the effect
of Accolade P, an INTX Microbials formulation of
rhizobacteria (Azospirillum brasilinse), as a seed
treatment on soft red winter wheat. The trial was
established on G.Burgess Farms, Brown City,
Michigan. On October 13, cv. DynaGro V9723A soft
red winter wheat was planted using a Great Plains
no-till drill. The planting crossed areas having
either conventional tillage, minimum tillage or no-
till. The individual plots measured 15 by 75 feet.
There were four replications in the conventional
zone, and two replications in the minimum tillage
and no-till zones.
There were no apparent differences
between treatments relative to seedling emergence or populations. The trial was harvested on July 22
using an International 2144 combine equipped with a Juniper HarvestMaster system that provided grain
yield, test weight, and moisture. The results are summarized in the table below. The data from the no-
till area was discarded as poor weed control resulted in erratic yields.
M. Nagelkirk, MSU Extension
Effect of corn residue on Fusarium head blight and DON of wheat, Brown City, MI 2011
A multi-state study, under the U.S. Wheat and Barley Scab Initiative, was initiated to measure the effect of corn residue on Fusarium head blight (scab). This two-year project involves planting wheat in a field that was harvested for corn grain. The trial site included areas that were moldboard plowed, minimum tilled (chiseled) or undisturbed (no-till). The individual plots measured 60 by 75 feet. There were four replications.
The results were inconsistent across
states. At Michigan’s site in Brown City, the visual
evidence of scab expressed as FHD Index was
significantly higher where corn stalks were not
incorporated (no-till). The DON levels were 1.2
ppm for the plowed areas; 1.8 ppm for minimum
till; and 2.3 for no-till. M. Nagelkirk, MSU Extension
Effect of Accolade seed treatment on the performance of soft red winter wheat, Brown City, MI 2011
tillage test wt (lbs)
moisture (%)
yield (bu/ac
)
conventional
with Accolade 60.1 16.3 75.7
without Accolade 60.4 15.7 76.4
min. tillage
with Accolade 60.4 15.6 78.7
without Accolade 60.7 15.2 79.5

Farm Labor Unskilled 7= $ per hour $12.48 $3.24
Farm Labor skilled 7 = $ per hour $16.13 $3.60
TRACTORS ONLY: Custom Rate $/ Hour
Machine Cost $/Hour
Est. Fuel Gal. / Hour
Est. Fuel Cost per Hour
No driver or fuel cost 4WD - 260 hp. 47.10$ $97.84 9.95 $35.82
MFWD - 200 hp. 42.32$ $56.51 7.04 $25.34 MFWD - 130 hp. 35.59$ $49.12 5.72 $20.59
Est. Tractor Cost $0.24/hp/hr. 2- WD - 75 hp. 32.76$ $22.55 3.3 $11.88Est. Fuel use .044 gal. diesel/PTO hp / hour 2- WD - 40 hp. 20.00$ $11.41 1.76 $6.34Auto Steer systems charge per acre 2.29$
TILLAGE OPERATIONS: Custom $/Acre 1 Total Machine
Cost/ Ac 3Machine Rate per
Hour4 Acres/Hr. 5Est. Fuel Gal./Acre6
Plowing: Moldboard (6 bottom) $17.85 $20.54 $85.65 4.17 1.32Chisel Plow (23 ft.) $14.84 $10.34 $134.73 13.03 0.60Chisel – front disk (16.3 ft.) $14.88 $12.84 $118.26 9.21 0.97Disk-V.Ripper combo (17.6 ft. +15" deep) $18.90 $19.16 $172.82 9.02 1.47Subsoiler 30" - 10ft (12-15") $18.63 Discing - tandem (21 ft) $12.86 $9.27 $113.28 12.22 0.58Field Cultivator (23 ft.) + incorp. $11.50 $7.35 $121.94 16.59 0.38Field Cultivator (23 ft.) $10.39 $5.93 $98.38 16.59 0.32Harrow $10.32 Soil Finisher $11.14 Strip tillage $15.54 Row Cultivate (12 rows) $10.76 $6.64 $102.59 15.45 0.46Row Cultivate-high residue (12rows) $13.35 Stalk Shredder (20 ft.) $12.11 $12.55 $97.39 7.76 0.74Rotary Hoe (21 ft.) $7.53 $2.53 $65.68 25.96 0.18Land Rolling $6.55 Highboy spraying $7.00 Boom Sprayer-self-Prop.80ft. $7.55 $7.30 $322.08 44.12 0.14Boom Sprayer-pull type 50ft. $5.46 $2.55 $65.31 25.61 0.10Spraying- road ditches / hr 52.04 /hr.
PLANTING: Custom $/Acre 1 Total Machine
Cost/ Ac 3Machine Rate per
Hour 4 Acres/Hr. 5Est. Fuel Gal./Acre6
Planter - conventional (12row) w/fert 30" corn-soys $15.03 $10.28 $143.92 14.00 0.32Planter - soybean 15" rows $16.45Planter - No Till w/fert (12 row) $16.60 Planter - Min Till (12 row) $16.83 $13.80 $175.67 12.73 0.53GPS mapping addition to planting $2.25 Air Seeder Drill w/cart 52ft $19.96 $440.32 22.06 0.45Drill Soybeans Conventional $16.73 Drill - No Till (15 ft.) $15.72 $18.30 $116.39 6.36 0.81Drill - No Till - drill only no tractor $10.28 Drill press wheels - (20 ft) $15.05 $11.88 $100.74 8.48 0.61Grain drill - only $9.80 Pest Control - scouting $5.00
2011- 2012 Production Season Costs Updated 11.08.11
Edited by: Dennis Stein, Extension Educator, District Farm Business Management, Michigan State University Extension362 Green Street, Caro MI 48723 ♦ 989-672-3870 ♦ email: [email protected] ♦ webpage: http://www.msu.edu/user/steind
per gallon of fuel
per gallon lube & fuel cost
Page 1

SUGAR BEETS: Custom $/Acre 1 Total Machine
Cost/ Ac 3Machine Rate per
Hour 4 Acres/Hr. 5Est. Fuel Gal./Acre6
Sugar Beets - Planting (12 row) $21.37 $27.91 $130.34 4.67 0.99Sugar Beet Cultivation $13.00 $14.19 $79.46 5.60 0.81Sugar Beet Topper (8 rows) $12.50 $15.55 $110.87 7.13 0.56Sugar Beet Harvester (6 rows) $75.00 $78.86 $238.95 3.03 2.22Sugar Beet Cart ( 20 ton) $25.00 $31.27 $162.60 5.20 1.80
HARVESTING: Custom $/Acre 1 Total Machine
Cost/ Ac 3Machine Rate per
Hour 4 Acres/Hr. 5Est. Fuel Gal./Acre6
Combine - (Corn -8 row head) $29.73 $39.07 $265.29 6.79 2.35Combine - stalk chopper head $33.45 Combine Small grains (20 ft head) $25.29 $29.02 $197.05 6.79 1.49Combine Soybeans (25 ft. head) $28.46 $29.35 $217.78 7.42 1.95Combine Soybeans - air reel $32.10 Combine & Cart, haul to storage - Corn $48.97 Combine & Cart, haul to storage - Soybeans $38.15 GPS mapping addition to harvesting $2.25 Picker 2 row- Ear Corn + 3 wagons $26.72 Combine Field Beans (belt pickup) $29.80 $31.96 $213.81 6.69 1.81Pulling Dry Beans (knife 6 row) $9.00 $10.29 $89.83 8.73 0.66Pulling Dry Beans (rod 6 row) $8.00 $9.04 $78.92 8.73 0.66Dry Bean – windrowing (6 row) $9.50 $13.88 $121.17 8.73 0.66Grain Cart - corn / acre $6.33 $19.97 $137.19 6.87 1.44Chopping Forage - Pull type (2R corn hd)/ton $4.83 per Ton $55.21 $76.19 1.38 3.35Chopping Forage - w/kernel processor $4.50-$5.75 per TonChopping Forage - Pull type Pickup head-12ft $5.50 -$7.13 per Ton $25.53 $103.91 4.07 1.40Chopping Forage - Self-propelled (6 row corn head) $6.97 per Ton $47.00 $64.86 1.38 2.35
Silo Filling -Tower silo: 1Tractor, 1Chopper & Driver, 2 Wagons $9.60 per Ton
Bunker: Chopper and 3 forage wagons or 2 trucks & packer $8.07 per Ton
Silage Bagging per ft. (9 ft diameter) $4.65-$6.95 per ft.Mowing $12.57 Raking – Hay 9ft. $6.35 $5.83 $20.35 3.49 0.50Tedding $5.90 Windrowing - hay or straw $12.25 Mower -Conditioner Pull - type (9 ft.) $13.49 $12.73 $55.88 4.39 0.40Mower -Conditioner - Self Propelled (16ft) $16.00 $21.46 $166.53 7.76 0.64Mower - Conditioner - Rotary (12ft) $10.50 $8.85 $68.68 7.76 0.38Small Square Baling - Hay $0.66 per bale $12.92 $45.22 3.50 0.40Small Square Baling - Straw $0.63 per baleMow, Rake, Baler & Handle - small sqr. $1.76 per baleBaler, Rake & Handle: Lrg Round $10.50-$13.50/baleComplete Hay Harvesting per ton $36.61 Baling Round - 600 to 800 # per bale $8.99 per baleBaling Round - 1200 to 1500 # per bale $10.94 per baleBaler 1000# Round/ with wrapper $10-$12.50 per bale $8.52 $25.65 3.01 0.35Baling - 1500 # - Lrg. Round-stalks/straw $11.20 per baleBaling - 1500 # - Lrg. Round-stalks/straw- with wrap $13.48 per bale $13.35 $40.58 3.04 0.49 Baling - Lrg Sqr. Hay 4x3x6 $10.50-$12.75/bale $12.03 $140.03 11.64 0.49 Baling - Lrg Sqr. Hay 4x3x8 $12-$13.50 per bale
Page 2

FERTILIZER: Custom $/Acre 1 Total Machine
Cost/ Ac 3Machine Rate per
Hour 4 Acres/Hr. 5Est. Fuel Gal./Acre6
Fertilizer Dry Bulk: Spreading $6.21 Lime application $10.29 Fertilizer - Liquid-Knifed In $10.90 Liquid-Sprayed: $6.80 Fertilizer - Anhydrous: 21 ft. $11.25 Fertilizer - Anhydrous: NoTill 32 ft. $11.48 Manure Hauling - semi solid - Load & Spread / hr. 61.10 per hr $38.89 $77.78 2.00 2.31Liquid Manure Injected Spreader/ 1000 gal. 11.00 per 1000 gal. $62.12 $124.24 2.00 2.86Manure Pump, Hauling, Spreading - liquid (9500 gallon cap.) per hour $82 / hour
Manure Pump, Hauling, Injecting - 1000 gal. liquid (9500 gallon cap.) $12.50 per 1000 gal.
Bobcat / Skid Loader / day $75 to $130 per dayDitch Mowing $58.35 per hourBrush Hogging $22.08Grain Drying - continuous flow / point / bu. $0.05/pt./bu.Grain Drying - inbin dryer / point / bu. $0.056/pt/bu.Grain Auger / bu. $0.050 per bu.Grain Storage / mo. $0.04/bu./mo.Grain Storage / yr $ 0.158 per bu.Grain Haul - per bu. - field to farmstead $0.098/ up to 10 milesRock picking $12.40Custom Farming - Corn $108.95 (all machine operations for growing & harvest)Custom Farming - Soybeans $96.40 (all machine operations for growing & harvest)Custom Farming - Sm Grains $81.45 (all machine operations for growing & harvest)
Fuel cost is calculated by adding fuel, oil and lube, calculated by adding 10% to the power fuel cost. $3.24 Diesel Price ==> $3.600 ** base fuel & lube price used1 Custom $ per acre: Represents the rate obtained from surveys of actual farm data surveys for 2010 & 2011 from Universities listed belowto do this type of machine work for another farm on a general basis. Higher or lower rates apply in each situation depending on crop conditions, soilconditions, size of fields and there locations. These numbers include the machine, power unit & operator where needed. Values have been adjusted higherto reflect the change in power fuel costs noted above. 3 Total Machine Cost/Acre: Includes tractor, fuel cost, lubricants, repairs, maintenance, labor and overhead costs including depreciation. This could be considered as an estimate of the ownership cost and operation of this machine on a per acre basis. No profit or return to management, which would be necessary for on going enterprises were included in this number. Values are based on "Farm Machinery Economic Cost Estimates for 2010", from the University of Minnesota. 4 Machine Rate per Hour: This number takes the Total Machine Cost per Acre and factors in the estimated Acres per Hour to give a value of represents an estimate of the hourly operational and ownership cost of machinery supported by ©University of Minnesota, Machinery Economic cost estimates for 2010. If the machine is run at full capacity (or engine clock hours) this per acre rate should be in the custom work value generated.5 Acres/ Hour: This is an estimate of the acres this machine should average on a per hour basis with normal down time.6 Gal./ Acre: This is an estimated machine use of fuel consumed to do this activity and is based on a factor of 0.044 gallons of diesel fuel per PTO hoursepower-hour on an average. Your individual machine's fuel use may vary from this number. 7 Labor cost ; Charged for this table at a rate of $14.00 per hour unskilled tasks and $17.50 per hour for skilled labor (planter, sprayer, harvester).
Costs were developed as an adjusted estimate of common rates being used by farms in this area to cover their cost of operation. The references listed
below were used collectively to build the summary information listed above:● Michigan State University Extension: E-2131 Custom Work Rates in Michigan . 10/2002 at http://www.aec.msu.edu/agecon/aecreports/aec613.pdf ● University of Minnesota: Machinery Economic cost estimates for 2010 © --2010 at http://www.apec.umn.edu/faculty/wlazarus/documents/machdata.pdf• Iowa State University: 2011 Iowa Farm Custom Rate Survey - Ag Decision Maker at http://www.extension.iastate.edu/Publications/FM1698.pdf● Kansas State University: 2009 Kansas Farm Custom Rates at http://www.nass.usda.gov/Statistics_by_State/Kansas/Publications/Custom_Rates/custom09.pdf• Texas A&M University: Texas Agricultural Custom Rates at http://agecoext.tamu.edu/resources/library/publications/2011-texas-agricultural-custom-rates.html• NASS- USDA & Pennsylvania Department of Ag: 2011 Machinery Custom Rates ; Adam Pike, March 2011 at http://www.nass.usda.gov ● The Ohio State University: 2010 Ohio Farm Custom Rates© at http://ross.osu.edu/topics/agriculture-and-natural-resources/news/ohio-farm-custom-rates-2010● University of Illinois: Machinery Cost Estimates© 4-2010, at http://www.farmdoc.illinois.edu/manage/machinery/machinery%20summary%202010.pdf● University of Nebraska Lincoln: 2010 Nebraska Farm Custom Rates at http://www.agecon.unl.edu/resource/2010PartI.pdf
* This report is a summary of information extracted from various sources. Your actual cost may vary greatly from the numbers presented. It is recommended that you calculate your own cost and economic returns necessary for the operation of machinery and equipment on your individual farm. This document was compiled by: Dennis Stein, District Farm Business Management, Extension Educator, Michigan State University Extension. revised 11/2011362 Green Street, Caro, Michigan 48723-1998 email: [email protected] or web page: http://www.msu.edu/user/steind/Major shifts in power fuel cost during the past few year has had an impact on and has changed the cost of machine operational cost. As a thumb rule it is estimated that each $1.00 increase in fuel cost, will increase most machine operations by an additional 15%.
Page 3

HOW TO FIGURE YOUR MACHINE WORK RATESIf you are hiring or doing custom work, the following will help you determine the custom rate. Custom rates are based on tradition or usual rates set in the community, the bargaining positions of both parties (i.e., availability of machinery services and demand for machinery services in your local area) and cost of operating the machines on your farm.
Cost of ownership and operation can be determined as follows:
Ownership cost per unit (e.g., acre, bushel, ton, hour)using the DIRTI 5:
1. D epreciation: original cost - salvage value $ years of use
2. I nterest: interest rat x AIV a $
3. R epairs: estmated 2 to 5 % of original cost $
4. T axes: (0 in Michigan -i.e., no taxes on personal $ property used in agriculture)
5. I nsurance: (estimated 0.5% x AIV for insurance premium) $
6. Total ownership cost per year (add lines 1 thru 5) $
A. Ownership cost per unit: total ownership cost ÷ estimated (A) $ annual use (acre, hour, bushel, ton)
Operating Cost per (acre, hour, bushel, ton)
1. Tractor: fuel (gallon fuel per unit x price/gallon) x 1.15 b $
2. Machine: gas or fuel gallons per unit x 1.15 b $
3. Labor: hours per unit x wage rate(if labor wage unit is per acre, bushel or ton multiply this wage by acresbushels or tons per hour to determine wage/hour) $
B. Total operating cost per unit (B) $
C. Total ownership and operating cost per unit (A+B) $
D. Desired profit margin and / or risk premium %
E. Custom Rate (per acre, hour, bushel, ton) Line C x [1+(Line D/100)] $
a Average investment value (AIV) = (original cost basis = salvage value) ÷ 2.b The addition of 15 percent above fuel cost is for oil & lube maintenance.
A Custom Machine rate calculator is available online on The Ohio State University web site located at: http://aede.osu.edu/Programs/FarmManagement/Budgets/download.htm#MachFin
MSU is an affirmative-action, equal-opportunity employer. Michigan State University Extension programs and materials are open to all without regard to race, color, national origin, gender, gender identity, religion, age, height, weight, origin, gender, disability, political beliefs, sexual orientation, martial status, family status or veteran status. This information is for educational purposes only.
Page 4