rpp7 cover - university of east anglia file4 about the dev working paper series the working paper...
TRANSCRIPT

Seasonal hazards and health risks in the Mekong Delta: a multi-disciplinary approach
2010
DEVReports and Policy Papers
International Development UEA & School of International Development, University of East Anglia, Norwich, NR4 7TJ, United Kingdom
Roger Few, Paul R Hunter, Iain Lake, Pham Gia Tran, Vu Trong Thien, Nguyen Quoc Tuan

2
DEV Reports and Policy Papers
Seasonal hazards and health risks in the Mekong Delta:
a multi‐disciplinary approach
Roger Few, Paul R Hunter, Iain Lake, Pham Gia Tran, Vu Trong
Thien, Nguyen Quoc Tuan First published by the School of International Development in April 2010.
This publication may be reproduced by any method without fee for teaching or nonprofit
purposes, but not for resale. The papers should be cited with due acknowledgment.
This publication may be cited as:
Few, R., Hunter, P.R., Lake, I., Tran, P.G., Thien, V.T., Tuan, N.Q., 2010, Seasonal hazards
and health risks in the Mekong Delta: a multi‐disciplinary approach, DEV Reports and
Policy Paper Series, The School of International Development, University of East Anglia, UK.
About the Authors
Roger Few is a Senior Research Fellow in the School of International Development at the
University of East Anglia, Norwich, UK.
Paul R Hunter is Professor of Health Protection at the School of Medicine, Health Policy and
Practice, at the University of East Anglia, Norwich, UK.
Iain Lake is a Senior Lecturer in Environmental Science in the School of Environmental
Sciences, University of East Anglia, Norwich, UK.
Pham Gia Tran is a Lecturer in the Department of Geography, University of Social Sciences
and Humanities, Viet Nam National University, Ho Chi Minh City, Vietnam.
Vu Trong Thien is Deputy Director of the Institute of Hygiene and Public Health, Ho Chi
Minh City, Vietnam.
Nguyen Quoc Tuan is a Scientist at the Institute of Hygiene and Public Health, Ho Chi Minh
City, Vietnam.

3
Contact:
School of International Development
University of East Anglia
Norwich, NR4 7TJ
United Kingdom
Tel: +44(0)1603 593439
Fax: +44(0)1603 451999
ISSN 1756‐7904

4
About the DEV Working Paper Series
The Working Paper Series profiles research and policy work conducted by the School of
International Development and International Development UEA (see below). Launched in
2007, it provides an opportunity for staff, associated researchers and fellows to disseminate
original research and policy advice on a wide range of subjects. All papers are peer reviewed
within the School. Recent past work, provided it meets the standards required and has
contemporary significance is also welcome.
About the DEV Reports and Policy Papers
These are reports and policy papers that reproduce consultancy, applied research findings
and policy work conducted by the School of International Development or International
Development UEA (formerly Overseas Development Group). Launched in 2007, the reports
provide an opportunity for staff, associated researchers and fellows to disseminate studies
and findings on a wide range of subjects. Recent past work, provided it meets the standards
required and has contemporary significance is also welcome.
About the School of International Development
The School of International Development (DEV) applies economic, social and natural
sciences to the study of international development, with special emphasis on social and
environmental change and poverty alleviation. DEV has a strong commitment to an
interdisciplinary research and teaching approach to Development Studies and the study of
poverty. This has been developed over a forty year period, bringing together researchers and
students from different disciplines (economists, social scientists, natural resource scientists)
into research areas and teaching teams.
The International Development UEA (formerly Overseas Development Group)
Founded in 1967, the International Development UEA is a charitable company wholly
owned by the University of East Anglia, which handles the consultancy, research, and
training undertaken by the faculty members in DEV and approximately 200 external
consultants. Since its foundation it has provided training for professionals from more than 70
countries and completed more over 1,000 consultancy and research assignments. The
International Development UEA provides DEV staff with opportunities to participate in on‐
going development work ‐ real‐world experience which adds a unique and valuable element
to the Schoolʹs teaching programmes.
For further information on DEV and the International Development UEA, please contact:
School of International Development
University of East Anglia, Norwich NR4 7TJ, United Kingdom
Tel: +44 (0)1603 592329
Fax: +44 (0)1603 451999
Email: [email protected]
Webpage: www.uea.ac.uk/dev
Seasonal hazards and health risks in the Mekong Delta:
a multi-disciplinary approach
Research Project Report
April 2010
Roger Few1, Paul R Hunter2,
Iain Lake3, Pham Gia Tran4, Vu Trong Thien5
Nguyen Quoc Tuan5
1School of International Development, University of East Anglia (UEA), United Kingdom ([email protected])
2School of Medicine, Health Policy and Practice, UEA 3School of Environmental Sciences, UEA
4Department of Geography, University of Social Sciences and Humanities, Vietnam National University, Ho Chi Minh City, Vietnam
5Institute of Hygiene and Public Health, Ho Chi Minh City, Vietnam
School of International Development University of East Anglia
United Kingdom

1
Acknowledgements A team of field researchers from the Vietnamese partner institutions carried out the majority of data collection for the study. Members of the team from the University of Social Sciences and Humanities were Tran Thi Doan Trinh, Le Thi Kim Giau, Nguyen Van Tuyen, Le Thi Lan Anh, Le Phuong Thuy, Nguyen Ngoc Dan Tuyen and Le Hai Nguyen. Team members from the Institute of Hygiene and Public Health were Nguyen Quoc Tuan, Dang Ngoc Chanh, Nguyen Xuan Minh, Ngo Cong Binh and Nguyen Tran Bao Thanh. Funding for the study was provided via project NE/E009042/1 of the ‘Environment and Human Health Programme’, which is supported jointly by the following UK research councils and government agencies: Natural Environment Research Council, Economic and Social Research Council, Medical Research Council, Biotechnology and Biological Sciences Research Council, Engineering and Physical Sciences Research Council, Department for Environment, Food and Rural Affairs (Defra), Environment Agency, Ministry of Defence, and Health Protection Agency. The study also received generous support from the company IDEXX UK in terms of equipment and consumables for use with the IDEXX Quanti-Tray® system. Contents Summary 2 1. Introduction 3 2. Methods 5 3. General information on sites and households 8 4. Seasonality of environment 13 5. Water sources and treatment 17 6. Bathing/swimming behaviour 23 7. Other hygiene behaviour 25 8. Preventive behaviour and attitudes 28 9. Water quality and seasonality 31 10. Health outcomes and seasonality 37 11. Conclusion: combining the evidence on seasonal health risk and other risk factors 44 References 50 Appendix: health survey questionnaire (4-phase) 51
2
Summary The project successfully tested and refined a multi-disciplinary approach to understanding seasonal health risks. The approach deliberately did not set out to emulate data-rich, gold-standard epidemiological practice. The idea was to develop and test a more practical, cost-effective approach applicable to a context in which both existing data and resources for funding research are severely limited, using multiple layers of data on different aspects and using different approaches as triangulation. The exploratory study took place in Vietnam, but the approach is potentially applicable in many other contexts where marked seasonal environmental changes occur. The research was undertaken in the city of Long Xuyen in the heart of the Mekong Delta, where four low-income neighbourhoods reliant on environmental water sources were selected for detailed study. Data collection combined three main components: environmental monitoring for disease organisms, analysis of data on health outcomes, and social research at the household level on how people perceive and respond to health risks. This was backed up with additional historical data on health records and hydrometeorological parameters for the period 2002-2008. Analysis entailed interrogation within each dataset to ascertain seasonal dynamics, testing of relationships between datasets, triangulation of evidence across data sources and synthesis of quantitative and qualitative findings. We found some evidence of seasonality in the risk of skin disease, respiratory disease and fever – all of which tended to be higher in the wet season – though we were unable to determine the precise causes of this. However, for diarrhoeal disease, the prime focus of the study, we found that a highly complex picture emerged of seasonal dynamics (of water contamination levels, patterns of water usage, hygiene behaviour and reported disease incidence), with, overall, no strongly seasonal pattern emerging to health risks for this population. Though contamination of environmental water was higher in the dry season when river levels were low (and rainwater not so readily available), there was little evidence that this carried through to a seasonal impact on the incidence of diarrheal disease in this study. We also found high levels of inter-household variation between households in terms of exposure and sensitivity factors, even within this low-income segment of the population. The work challenges simplistic assumptions about the nature of the hazard - health outcome pathway, and has potential implications for the timing and targeting of health promotion activities in the region. Though further research is needed to support this finding, it appears that marginal seasonal variations in water quality in the environment are unlikely to generate a strong difference in health outcomes at the population level. They become masked by a complex mix of inter-household variations in water source/treatment and hygiene patterns, intra-household variations in behaviour, temporal inconsistencies in behaviour, seasonal variation in other risk factors operating to reduce/increase diarrheal disease risk, and perhaps by within-season and locational complications to seasonal exposure patterns.
Overall incidence of diarrhoeal disease was low in the sampled population, despite the high levels of contamination of drinking water, but rates were notably higher for children under 5 years of age who appeared to gain significant protective benefit from access to improved water sources. Assuming that there are limited resources for health promotion on diarrhoeal disease in the region, this possibly suggests that the resources might best be targeted to households with children under 5 who are exposed to unimproved water sources; and that this activity should take place year-round.

3
1. Introduction In many parts of the world, annual variations in climate produce major seasonal changes in environmental conditions, with important but as yet poorly specified implications for human health. Such change is perhaps most marked on the flood plains of large rivers with high seasonal variation in discharge. Many such flood plains hold dense human populations, and in low and middle income countries in particular both extensive seasonal flooding and low-water conditions in the dry season have the potential to heighten disease risk. For example, these extremes can cause increased abundance of mosquitoes, impacts on drinking water supplies or contamination of the local environment with human wastes and other pollutants. With the prospect of climate change bringing possible intensification of climatic seasonality in many regions, including increases in the average peak flows of monsoon-fed rivers of Asia (Parry et al, 2007), it is crucial to gain a better understanding of how seasonal hazards may affect human health now (Pascual and Dobson, 2005) Gold-standard epidemiological analysis of disease outcomes from hydro-meteorological hazards is challenging, partly because of the multiple transmission pathways for many water-related infections in settings of poor environmental health quality. However, there is important and undervalued practical scope for correlating data on the environmental hazard with data on health outcomes (Hashizume et al, 2008). Moreover, in order to understand the implications for public health and to design effective interventions in environmental health and health promotion, a broader reach of disciplines is also required that engages with how people living under conditions of poverty perceive and respond to such hazards (Emch, 1999; Curtis et al. 2000). This project set out to test a multidisciplinary approach to analysis of health risks from seasonal environmental hazards in lower-income settings using a case study example from the Mekong Delta in southern Vietnam. The Mekong Delta covers around 39,600 sq. km and has a population of 16.1 million - equivalent to one-eighth of the land area and one fifth of the total population of Vietnam. It is widely perceived by local health practitioners that in low-income areas of the delta poor waste control, inadequate latrines, widespread use of surface water for domestic purposes and poor hygiene practices combine to increase disease risk. Given the marked seasonality of the environment, it is plausible that disease risk might be expected to show seasonal trends. However, the existence and pattern of seasonality is far from clear. In an earlier study focussing on local health practitioners’ perceptions of floods, Pham Gia Tran and Few (2006) found that many perceived the risk of gastro-intestinal and other waterborne diseases to be heightened during the annual floods, when river water spills across fields and gardens, and in many cases enters houses for a period of several weeks. However, there were also contrasting views expressed that diarrhoeal disease risk from water sources may be heightened during the dry season, when river levels and rainfall are lowest. Indeed, in a search for statements from public health bodies within the southern region of Vietnam on seasonal risks to public health, we mostly found messages referring to higher risk of diarrhoeal disease in the dry season (although one, focussing on rotavirus, described peaks of incidence occurring in both seasons – March and September)1. Interestingly, there was also some variation in statements about the seasonal risk of dengue (a mosquito-borne disease potentially associated with rainfall)2.
1 www.tuoitre.com.vn; http://giaoduc.edu.vn; www1.vietnamnet.vn www.medinet.hochiminhcity.gov.vn/data/news/2008/3/5377/Rotavirus.htm; [accessed January/March 2010] 2 www.baocantho.com.vn; www.tuoitre.com.vn; http://giaoduc.edu.vn [accessed January/march 2010]

4
Understanding of this dynamic seems to be constrained by insufficient evidence. The evidence base about levels of contamination in the local environment, how it changes/spreads during the changing seasons, how people perceive that risk and how their behaviour might exacerbate or ameliorate it and how that may or may not translate into public health impact needs further development. This study was one of the first attempts to provide integrated answers to those questions.

5
2. Methods The study set out to examine the seasonal environment/health problem from hazard to outcome – combining analysis of changes in levels of environmental contamination, seasonal variations in disease incidence and a social scientific analysis of health behaviour in order to understand changing risk to public health. A case study methodology was employed with intensive multidisciplinary research at ward-level and multiple data strands to facilitate triangulation of findings. • The research took place in four sites around Long Xuyen (population 350,000 in 2006), within the Mekong Delta in Vietnam (see Figure 1). Each year these sites face alternate seasonal extremes in the local environment due to annual flooding in the Delta. • Because the key interest was the temporal dynamic of health risk, field data collection took place in four phases over a 12 months period. Fieldwork was carried out in October 2007 (phase 1) and 2008 (phase 4) during the peak of the flood season, in January 2008 (phase 2) in the early dry season, and in April 2008 (phase 3) in the late dry season. • The field team worked with 120 low-income households from across the 4 sites (30 in each site). The sampling frame was a list of all households within each site that were on the formal poverty register (plus additional households identified as poor on the basis of housing quality) and which had a child under 5 years of age. In each site 30 households on the list were randomly selected (if the site did not have 30 ‘poor’ households with under 5s then the remainder of the quota was randomly selected from the poverty register). • The work had 6 data strands:
a) Water quality monitoring (4 phases)
Microbiological sampling was conducted to determine the potential exposure of residents to faecal contamination within the home and the immediate surroundings, and to gauge how this changes on a seasonal basis. During each of the four seasonal research phases the team tested samples from environmental water sources (including rivers, canals and ditches), together with samples of stored water from the 120 households (both drinking and non-drinking water). Each sample was analysed for Total coliform and E. coli, using the IDEXX Quanti-Tray® system (see Box 1).
b) Health surveys (4 phases)
Four rounds of questionnaire surveys were conducted with adult representatives of the same 120 households. The survey was designed to identify the incidence of self-reported illness within the household during the previous 4 weeks, along with basic demographic data and information on water usage and hygiene practices at the time of each survey. Information was collected on a range of symptoms, but with follow-up questions designed especially to target reported incidences of diarrhoeal disease and skin infections (Box 2).
c) Disease risk survey
A questionnaire survey on health behaviour was carried out with the 120 households during the first research phase, gathering quantitative and qualitative data on perceptions of health risks and how these change during the seasons. Information on hygiene practices, specific responses to the health risks from seasonal extremes, and reasons for practices were also obtained (see Appendix).
d) Household interviews
During the third phase, a follow-up process of 32 semi-structured interviews (8 per site) was carried out with a stratified sample of respondents to gain more in-depth, qualitative information on how perceptions, motives and constraints shape health protection behaviour. Initial findings from the first survey were used to refine and focus the more

6
expansive discussions on key points during the interviews. Follow-up in the fourth phase also included a series of 16 experimental ‘scenario-based’ interviews, using progressive storylines of seasonal dynamics to help understand perceptions of how risk changes between pre-flood and flood phases.
f) Secondary health data
Monthly data on health outcomes was also compiled from health clinic records for the study sites for the period 2002-2008.
e) Hydrometereological data
Data on monthly river height and rainfall data for Long Xuyen collected by the provincial hydrometeorology centre was also obtained for the period 2002-2008.
Analysis entailed both interrogation within each dataset to ascertain seasonal dynamics (for example of water contamination levels, patterns of water usage, hygiene behaviour and reported disease incidence) and comparison between datasets. Quantitative survey data was analysed using SPSS and other statistical software. Qualitative data from interviews was analysed via open coding of transcripts and collation and comparison of coded items. This report is a joint output combining quantitative and qualitative findings.
BOX 1 The IDEXX Quanti-Tray system The Quanti-Tray system uses a reagent (Colilert®) for the simultaneous detection and confirmations of total coliforms and E. coli in water. The reagent was added to the collected water sample, and the mixture was then poured into a quanti-tray, filling a matrix of wells. The quanti-tray was then sealed using specialist sealer equipment and placed in incubator for 24 hours at 35°C. After this period, if E. coli is present, the reagent shows yellow colour and fluorescence when exposed to a long-wave (365-366 nm) UV lamp. Each tray was examined and bacterial counts estimated based on the number of yellow/fluorescent wells (Yellow wells = total coliforms; Yellow/Flourescent wells = E. coli ) and the corresponding conversion using an MPN (most probable number) table. BOX 2 Methodological detail on household health surveys The study communities were visited on four separate occasions. Each house was visited and a reporter from the home interviewed to collect information on all members of the family. Where possible, the survey was conducted with an adult female acting as primary care-giver within the family. Potential research participants were first informed of the purposes and process of the study, and of the expected outputs, and their signed consent was requested before the survey commenced. The questionnaire used was primarily based on one developed previously for use in a tropical rural setting (Hunter et al., submitted). The questionnaire started by asking basic social and economic questions relating to the number, gender and age of people living in the house, ownership of items and animals and occupation and levels of education of the primary earner. The questionnaire also sought information on water usage storage and treatment as well as sanitation. In addition information was sought about whether or not members of the family had developed any of a range of symptoms. If diarrhoea or

7
skin problems were reported then supplementary questions were administered to gain more information to enable the natures of the symptoms. The supplementary questionnaire for people with skin symptoms was based on that of Dalgard et al. (2003). Finally the interviewer would make a judgement about the quality of house construction and state of repair. Data was entered into an Access database and subsequent statistical analyses carried out either with SPSS version 15 or STATA version 10. Possible predictor variables were tested by single variable analysis using Chi squared for categorical variables or t test for continuous variables. Variables that were significant at the p=0.2 level were included in a multi-level mixed effects Poisson regression model, accounting for repeat responses from individuals and possible clusters at the household and hamlet level. The least significant predictor variable was excluded on each cycle until all variables remaining were significant at the p=0.2 level.

8
3. General information on sites and households Long Xuyen is a medium sized city with an area of 115 Km2 and an official population in 2007 of approximately 275,000. It is located on the western branch (Song Hau) of the Mekong river in the south of An Giang province of Vietnam. It lies approximately 130km from the coast. Long Xuyen is made up of 9 urban wards and 3 peri-urban/semi-rural communes. It has a mix of industrial, commercial and service sectors, together with considerable areas of peri-urban agriculture in the outer communes. At the time of the study, monthly average income per capita in the Mekong Delta region was close to the national average. Moreover, urban populations through Vietnam as a whole tended to have more than twice the average income of rural inhabitants (GSO 2006). Nevertheless, pockets of poverty remained in both cities, with many inhabitants falling below the official poverty line of 260 000VND per capita per month for urban areas (the focus of the study was on such poorer segments of the community). Poorer households in Long Xuyen are likely to have a mix of income sources from occupations such as informal businesses (such as motorcycle/cycle transport, selling of food items or lottery tickets, and sewing services), rice farming, fishing, work for hire in agricultural, fishery and construction sectors and other trades such as boat transport and waste collection. The Mekong Delta has a tropical, monsoonal climate with pronounced wet and dry seasons. Annual seasonal flooding affects most of the Mekong Delta region, usually between July and October, broadly coinciding with the rainy season. The flood levels vary from year to year, and the region recorded abnormally high floods in each of the years 2000, 2001 and 2002, creating disaster conditions in some areas (Nguyen Huu Ninh 2007; SRV, 2004). The entire city of Long Xuyen is built on flat, deltaic land and is crossed by an intricate system of waterways. Flooding of parts of the city is an annual seasonal occurrence, with the influence of the tides creating twice-daily rises and falls in flood levels. Though dyke systems for flood control were gradually expanding at the time of the study, many peripheral and some central urban areas had incomplete structural defences as well as deficient drainage systems. At the onset of the dry season river water levels and rainfall both steadily fall to minimum levels and some of the waterways become dry during low tides. For poorer households in particular, the potential health consequences of the wet/dry environmental cycles are considerable. Environmental health remains a challenge in Long Xuyen, particularly for the poorer and more marginalized segments of the urban population. Though access to improved water sources was increasing at the time of the study, the study households tend to rely on river water for domestic uses, including provision of drinking water. Sanitation conditions are simple, with many households using simple latrines located over watercourses and fish ponds. Few have access to solid waste collection services. Figure 1 shows the location of the four flood-prone sites in the city from which the study households were drawn. Specifically the selected households were drawn as follows:
- 30 from Binh Duc commune in the north of the city (hamlets Binh Duc 2 and Binh Duc 6);
- 30 from My Thanh commune in the south of the city (hamlets Thoi An A and Hoa Thanh);
- 30 from the main island of My Hoa Hung commune north-east of the city centre (hamlets My Khanh 2 and My An 2);
- 30 from the small islet called My Thanh, which lies to the south of the main island of My Hoa Hung.

9
Figure 1 Study locations within Long Xuyen
3.1 Sampled households The sample was spread in four locations around the city that were especially flood-prone and hence subject to extreme seasonal variation in environmental conditions. The geographical spread of the sampling was designed to minimize bias that might result from any site-specific characteristics (e.g. location of a major pollution source). The aim of the study was to find a representative sample of the most vulnerable category of residents - all therefore shared characteristics of being poor (though they varied in precise poverty level) and households with children under 5 were also targeted (on the assumption that infant morbidity from waterborne diseases is likely to be higher). It is important to restate that the purpose of the study was to understand the temporal dynamics of disease rather than describe its distribution across the population. Each of the four sites were visited on the four occasions. In the case of the health survey this resulted in 472 completed questionnaires. These questionnaires had data on 2519 people contacts. After accounting for people who were sampled on less than the four occasions, data

10
was available on 777 distinct individuals. Table 1 shows the basic demographics recorded for each sampling occasion. Table 1 Basic demographic data recorded on populations sampled
phase 1 phase 2 phase 3 phase 4
Season Wet Dry Dry Wet
Number of completed questionnaires 120 120 120 112
Number of people sampled 650 636 632 601
Gender Male (%)
341 (52.5)
324 (50.9)
327 (51.7)
310 (51.6)
Female (%)
309 (47.5)
312 (49.1)
305 (48.3)
291 (48.4)
Age group <2 (%)
41 (6.3)
36 (5.7)
25 (4.0)
16 (2.7)
2 to 4 (%)
68 (10.5)
64 (10.1)
70 (11.1)
69 (11.5)
5 to 15 (%)
129 (19.8)
141 (22.2)
140 (22.2)
134 (22.3)
16+ (%)
412 (63.4)
394 (61.9)
397 (62.8)
382 (63.6)
The mean number of people per household in the first visit was 5.4. Table 2 shows the distribution of key socio-economic variables by sampled households based on data collected during the first visit only. The figures reveal the relatively low material wealth and educational level of this sample - for example, refrigerator ownership of just 2% compares with the Government Statistical Office data for 2006 which indicates that refrigerator ownership was 15% for the Mekong Delta region as a whole (GSO, 2006). It is also evident that there is some variation in socio-economic indicators, even among this ‘all-poor’ sample. Table 3 shows the result of factor analysis on indicators of “wealth”. Only those variables that were found in >10% or <90% of homes were included in the factor analysis. It can be seen that factor 1 is most closely aligned with monetary wealth - having a house that was built of permanent rather than temporary materials and being good rather than degraded quality along with owning the expensive consumer products (television, radio cassette and motorbikes). Factor 2 was most strongly associated with livestock ownership, mostly ducks and chickens, factor 3 with pet ownership whereas factor 4 was only negatively associated with bicycle ownership. The first factor was used in subsequent analyses as a proxy for wealth. Table 2 Key social economic variables of sampled households based on first visit
no. of households %
Level of education Illiterate 23 19
Elementary 65 54
Primary 27 22
Secondary 5 4

11
House made from Temporary material 98 81
More permanent materials
22 18
House quality Heavy degraded 32 26
Light degraded 52 43
Good 36 30
Ownership
Boat 36 30
Refrigerator 3 2
Television 63 52
Motorbike 36 30
Bicycle 67 55
Radio cassette 12 10
Ducks 14 11
Chickens 28 23
Pig 5 4
Cat 12 10
Dog 25 20
Table 3 Rotated Component Matrix showing correlation between original variables and first four rotated componentsa
Component
1 2 3 4
House type code 0.706 0.104 -0.099 0.328
House quality 0.646 0.211 0.116 0.069
Boat 0.05 0.016 0.308 0.71
Television 0.696 -0.048 0.212 -0.165
Motorbike 0.735 0.12 -0.036 -0.157
Bicycle 0.151 0.09 0.286 -0.639
Radio cassette 0.331 -0.237 0.483 0.359
Ducks 0.129 0.812 -0.075 -0.02
Chickens 0.067 0.807 0.192 -0.079
Cats -0.043 -0.012 0.741 -0.076
Dogs 0.039 0.265 0.473 0.067aExtraction method: Principal Component Analysis & Rotation Method: Equamax with Kaiser Normalization

12
3.2 General water/health concerns of the study population In the disease risk survey carried out in the first phase of research, householders were asked to prioritize different environmental health issues (‘solid waste’, ‘clean water’, waste water’, and ‘flood’, and ‘other’). Responses were not strongly differentiated but clean water emerged as the highest priority with 37.6% (44/117 respondents) stating it was top priority. 12 out of the 44 specifically noted health protection, avoiding disease or cooking/drinking safety as the reason for this (most others simply referred to avoiding dirty water or river water). Householders were asked if improper use of water would impact on health. 99/117 (84.6%) said it would - reasons cited referred mainly to getting diseases (especially gastro-intestinal) from dirty water (especially from drinking it). 9/117 (7.7%) said it would not impact on health - reasons cited referred mainly to being accustomed to using it and not getting sick (one stated that all types of water are the same). Householders were asked which age group is most likely to get diarrhea. Children under 5 were highlighted: 54/89 (60.7%) households who responded indicated 0-5’s as a high-risk group, and 42/89 (47.2%) had them as the highest risk group. The reasons given related both to physiological factors (e.g. ‘intestine of children is still weak‘; ‘children's resistance is weak’) and to behavioural factors (e.g. ‘children go to play and eat dirty food’; ‘children play with mud in the river’). They were also asked which age group is worst affected by diarrhea. Here the vulnerability of young children was not highlighted so strongly: 34/87 (39.1%) households who responded indicated 0-5’s as high-risk group, and 30/87 (34.5%) had them as the highest risk group; but 31/87 (35.6%) indicated 16-60’s as high-risk group, and 30/87 (34.5%) had them as the highest risk group instead. The reasons given focus especially on health impact for young children (e.g. ‘children with diarrhea will lose their health fast and treatment takes a long time’; ‘children's intestine is weaker and it's hard to recover’) but also on work demands for adults (e.g. ‘adult is the main bread-winner in the family’; ‘I have three children, if parents get sick who takes care of our children’). In subsequent interviews with households during phase 3, the heightened exposure and susceptibility of children to water-related illness was again highlighted, with 21/28 interviewees stating children were more vulnerable than adults. 3.3 Summary findings => ALL THE HOUSEHOLDS IN THE STUDY COULD BE CLASSED AS ‘LOW-INCOME’, BUT THERE WAS SOME VARIATION IN WEALTH INDICATORS SUGGESTING THAT THE GROUP IS NOT HOMOGENOUS IN TERMS OF LIVELIHOOD ASSETS => THERE WAS A GENERAL RECOGNITION AMONG THE SAMPLED HOUSEHOLDS OF THE LINKAGES BETWEEN WATER AND HEALTH AND ESPECIALLY THAT CONTAMINATED WATER CAN POSE HEALTH RISKS => MOST HOUSEHOLDS REGARDED CHILDREN AS MORE LIKELY TO BE EXPOSED AND SUSCEPTIBLE TO DIARRHEAL DISEASE (& TO WATER-RELATED DISEASE IN GENERAL) => THE IMPACTS OF DISEASE WERE ARTICULATED NOT SOLELY IN HEALTH TERMS BUT ALSO IN TERMS OF INCOME GENERATION (HENCE THE EFFECTS OF DISEASE ON ADULTS MAY BE PERCEIVED AS WORSE)
13
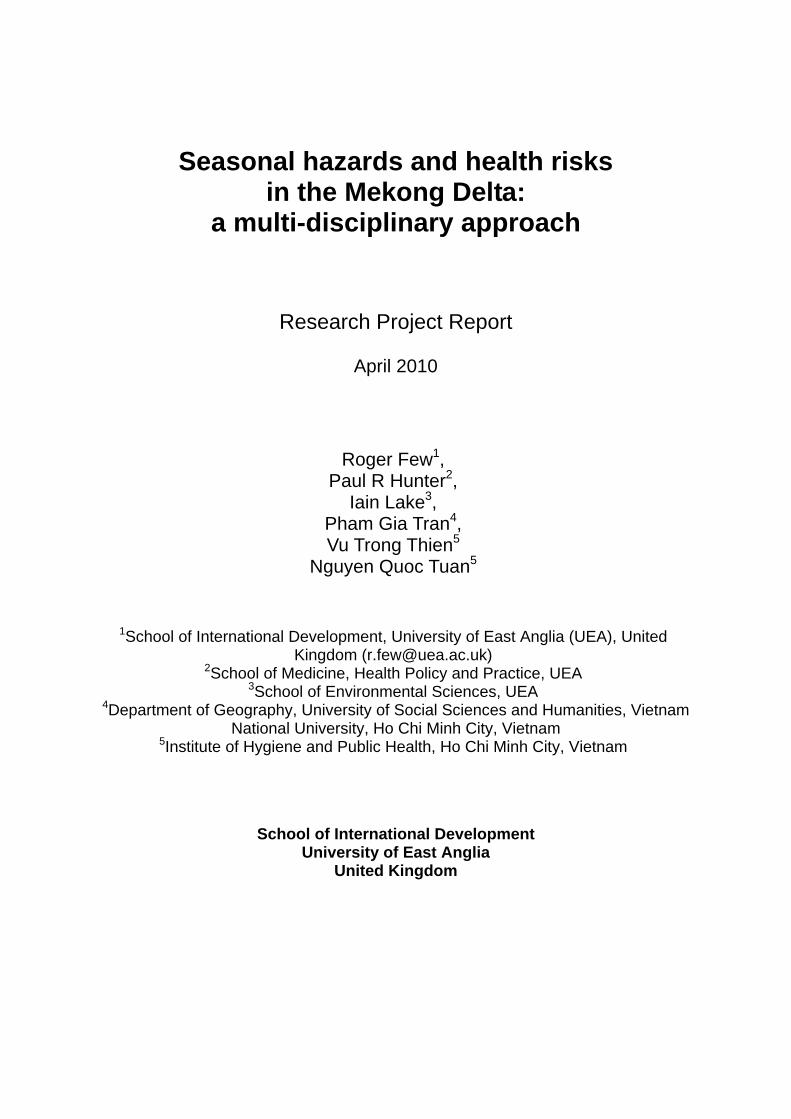
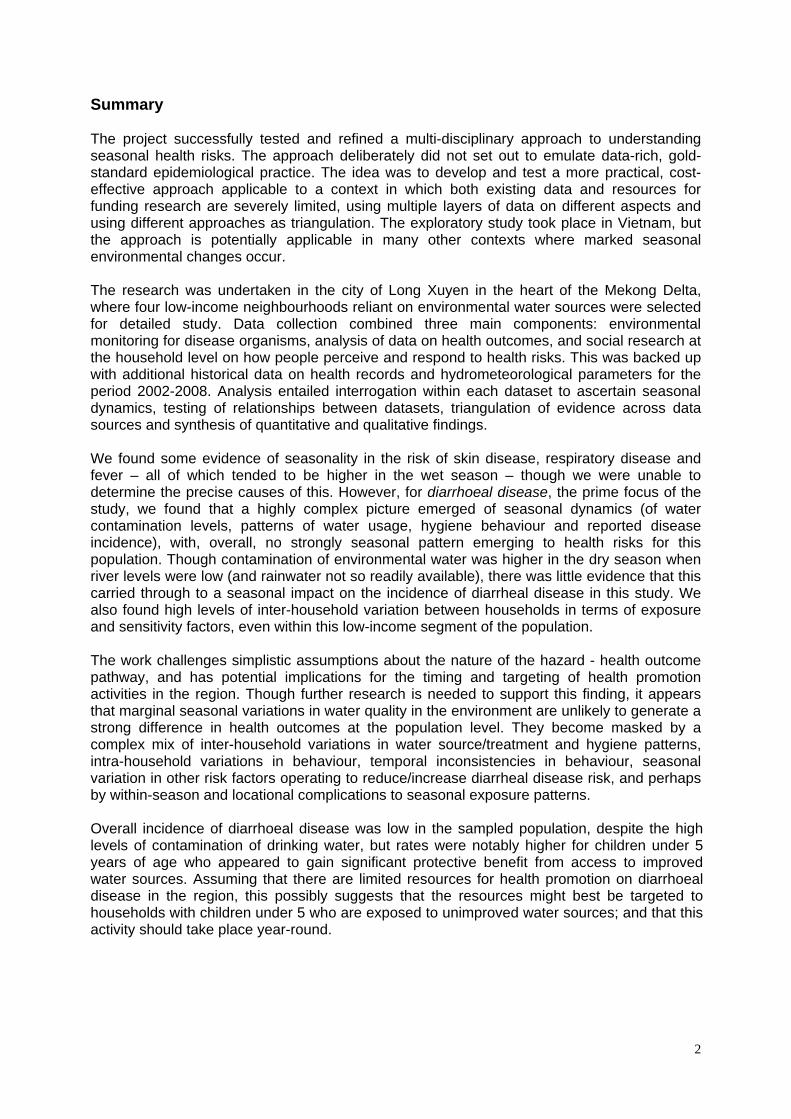
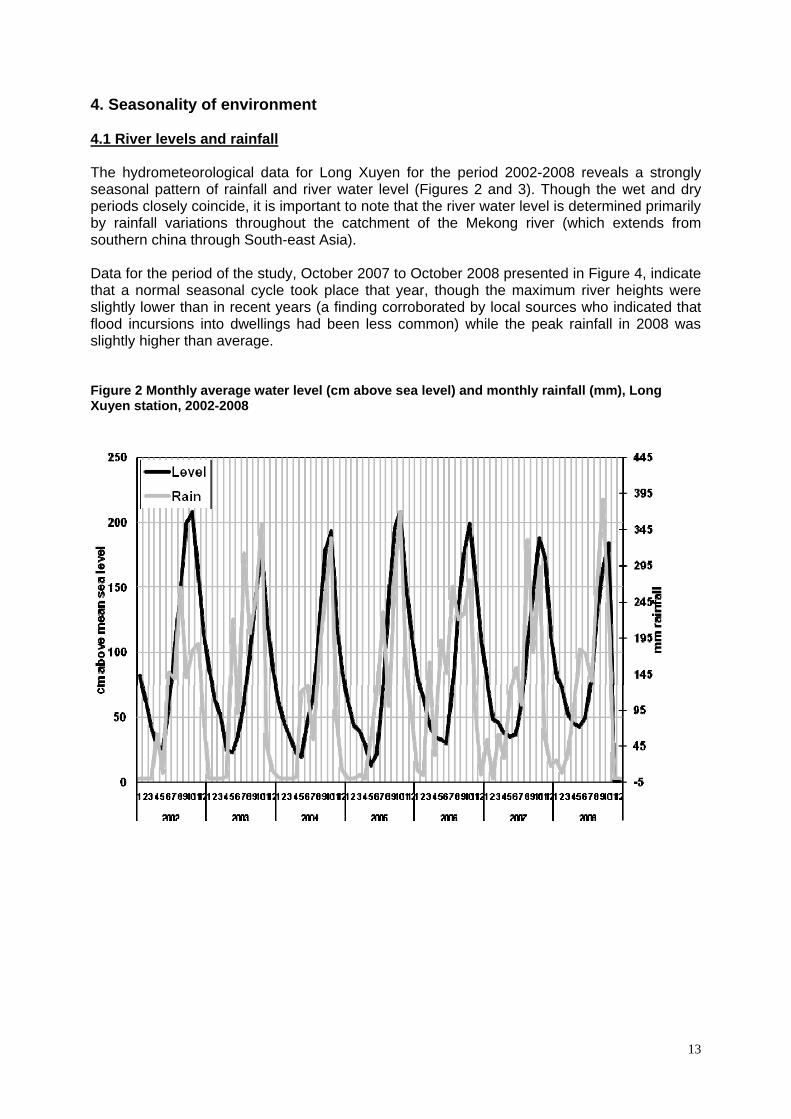
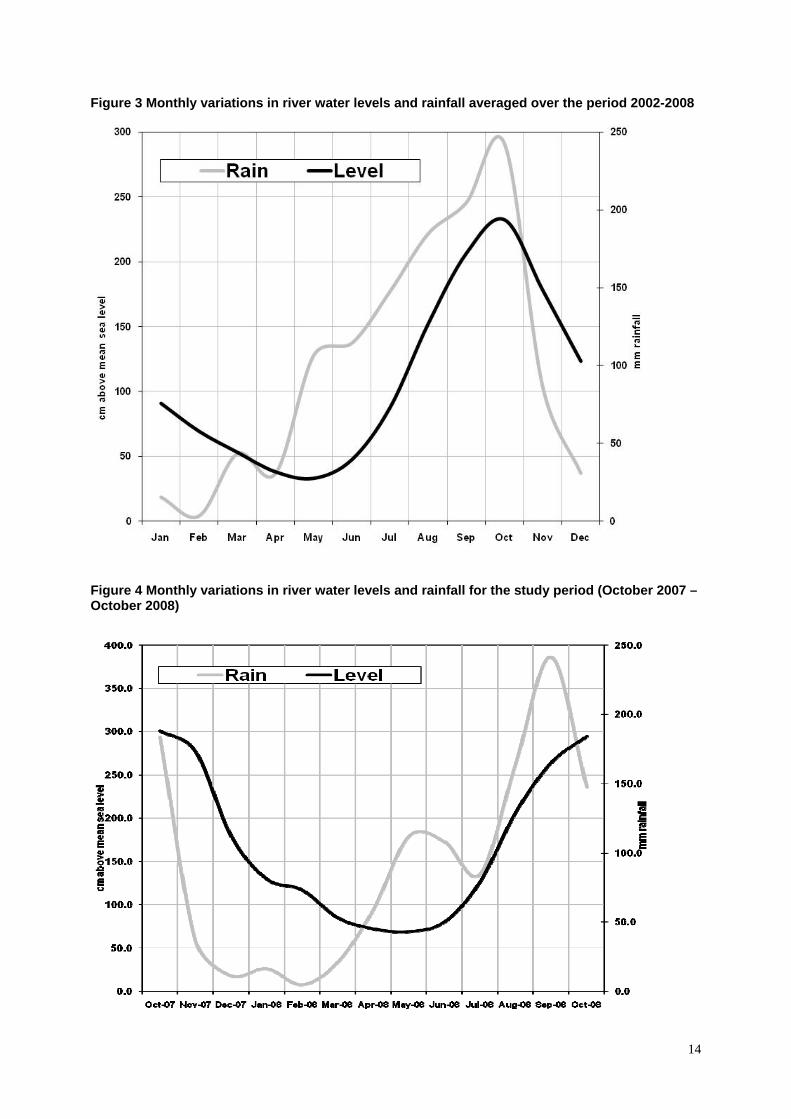
4. Seasonality of environment 4.1 River levels and rainfall The hydrometeorological data for Long Xuyen for the period 2002-2008 reveals a strongly seasonal pattern of rainfall and river water level (Figures 2 and 3). Though the wet and dry periods closely coincide, it is important to note that the river water level is determined primarily by rainfall variations throughout the catchment of the Mekong river (which extends from southern china through South-east Asia). Data for the period of the study, October 2007 to October 2008 presented in Figure 4, indicate that a normal seasonal cycle took place that year, though the maximum river heights were slightly lower than in recent years (a finding corroborated by local sources who indicated that flood incursions into dwellings had been less common) while the peak rainfall in 2008 was slightly higher than average. Figure 2 Monthly average water level (cm above sea level) and monthly rainfall (mm), Long Xuyen station, 2002-2008
14
Figure 3 Monthly variations in river water levels and rainfall averaged over the period 2002-2008
Figure 4 Monthly variations in river water levels and rainfall for the study period (October 2007 – October 2008)

15
4.2 Environmental water quality During each of the 4 sampling phases around 30 environmental samples were taken from standard locations on rivers and canals, which provide an indication of general environmental contamination. The E. coli concentrations are presented in Figure 5 for each of the phases. Figure 5 Concentrations of E. coli in environmental water samples
The results demonstrate a large amount of variation in the E. Coli concentrations between phases. In this graph there is some limited evidence that the environmental samples had greater concentrations of E. Coli in the dry season. The results were analysed statistically taking into account the paired structure of the data, and the findings are presented in Table 4 below. This indicates that the phase 1 results were significantly lower than those in phase 2 and marginally significantly lower than those in pair 3. There were no apparent differences in concentrations between phase 2 and phase 3. There was also some evidence that the phase 4 results were lower than those on phases 2 and 3 but only one of these was significant. So overall there is reasonable evidence that the environmental samples demonstrated greater E. Coli concentrations in the dry season in comparison to the wet season. Table 4 Comparing E. Coli concentrations in environmental samples between phases P1 (Oct-07) P2 (Jan-08) P3 (Apr-08)
P2 (Oct-07) P2 > P1 (p = 0.002) * *
P3 (Jan-08) P3 > P1 (p=0.052) P3 < P2 (p=0.582) *
P4 (Oct-08) P4 > P1 (p=0.265) P4 < P2 (p=0.025) P4 < P3 (p=0.225)
Statistics are based upon a wilcoxon-ranked signs text
16
4.3 Summary findings => RIVER AND RAINFALL LEVELS SHOW A PRONOUNCED SEASONAL PATTERN IN LONG XUYEN, CREATING DISTINCT WET AND DRY SEASON ENVIRONMENTAL CONDITIONS => RAINFALL AND RIVER LEVEL MAXIMA TEND TO COINCIDE, BUT THERE IS A 2-3 MONTH LAG BETWEEN RAINFALL MINIMUM AND WATER LEVEL MINIMUM => EVIDENCE OF HIGHER CONTAMINATION LEVELS IN DRY SEASON (BASED ON E. COLI CONCENTRATION AS AN INDICATOR)

17
5. Water sources and treatment This section focuses on water sources used by the study households, treatment methods and any seasonal patterns in water usage. We examine evidence from 4 data strands – water monitoring, health surveys, behavioural survey and interviews. 5.1 Water monitoring data Based upon the water samples actually collected from households, Figure 6 compares the sources collected that were used for drinking water (shown as a % of households). This suggests that alum treated river water was the dominant source for drinking, and that rainwater usage peaked during the wet seasons. In these samples small amounts of untreated river water used for drinking were also discovered. (It should be noted that many households used multiple water sources in practice – see discussions below – and only one ‘main’ source of drinking water was obtained per household) Figure 6 Sampled drinking water source by phase (based on samples collected from households)
5.2 Health Surveys data
We can compare the drinking water sources recorded through water monitoring with stated water source for each household in each phase obtained from the household questionnaire. A graph of the main stated source by phase is presented in Figure 7. This shows a strong discrepancy with the finding above, as it suggests that river water treated with alum and boiled was the source most commonly used for drinking across all phases. However, the trends by season follow the same pattern as in Figure 6. In the two wet seasons, rain water was a

18
significant source of drinking water. During the two drier phases the drop in rain water consumption appears to have been compensated for by increases in river water consumption (boiled and unboiled) and bottled water. Over the study period the quantity of piped supply increased slightly. Figure 7 Stated main drinking water source at the household level by phase
In a separate analysis of self-reported hygiene behaviours, responses to a range of water usage questions were assessed. In order to distinguish the impact of visit number and season regression analyses were run for all variables with both visit number and season as independent predictor variables. The results are presented in Table 5. They show again that seasonality had a significant impact on choice of source for drinking water with people more likely to drink rainwater in the wet season and less likely to drink bottled water or water from the river or canal. Overall people were much more likely to use an improved water source during the wet season3. There was, however, no difference in whether or not people were likely to treat their water prior to drinking. Of the results on usage other than drinking, the strongest finding is that people were less likely to report using river water to wash dishes in the wet season. Over the course of the four visits people were more likely to report using treated water for washing dishes.
3 The WHO includes rainwater as an ‘improved water’ source – see http://www.who.int/whosis/whostat2006ImprovedWaterImprovedSanitation.pdf

19
Table 5 Impact of visit and season on water usage and treatment Visit
Season Visit Season wet against dry indicator
1 2 3 4 Dry Wet Coef. StdErr Z P Coef. StdErr Z P N 120 120 120 112 240 232
bottle water 8 20 25 18 45 26 0.2835 0.1278 2.22 0.027 -0.5752 0.2546 -2.26 0.024
Piped supply to house 4 7 9 11 16 15 Piped supply to near house
3 1 5 3 6 6
Rain water 44 13 7 32 20 76 -0.0996 0.0768 -1.3 0.195 1.3503 0.2521 5.36 0
Source of drinking water (main)
Water from river/canal 61 79 74 48 153 109 -0.0564 0.0597 -0.94 0.345 -0.3066 0.1255 -2.44 0.015
Not improved 69 99 99 66 198 135 Status of water Improved 51 21 21 46 42 97 -0.0150 0.0660 -0.23 0.82 0.8620 0.1850 4.66 0
Yes 75 89 83 66 172 141 -0.0250 0.0530 -0.47 0.639 -0.1640 0.1140 -1.44 0.15 Boil 51 62 49 46 111 97
Do you treat
Alum 60 80 72 48 152 108
In covered container 115 119 120 112 239 227 How do you store water for drinking?
In uncovered container 5 1 0 0 1 5

20
Piped supply to house 2 6 6 12 12 14
Piped supply to near house
3 0 1 2 1 5
Rain water 2 0 0 1 0 3 Water from river or canal
112 113 111 96 224 208 -0.0262 0.0438 -0.6 0.549 -0.0458 0.0963 -0.48 0.634
Well 1 1 1 1 2 2
What is the main source of water for washing (self/clothes/dishes)
Other 0 0 1 0 1 0
Yes 70 86 66 62 152 132 -0.0454 0.0550 -0.83 0.408 -0.1182 0.1192 -0.99 0.321
Alum 69 85 65 61 150 130
How have you treated this water before washing? Bleach 0 1 1 1 2 1
Drinking water 22 3 22 1 25 23 -0.4052 0.1559 -2.6 0.009 -0.2282 0.3113 -0.73 0.464 What water do you use for washing fruit/vegetables that will not be cooked?
Same water as we use for washing self and clothes
98 117 98 111 215 209
Drinking water 1 2 1 1 3 2 Treated water 5 28 10 62 38 67 River/canal water 107 86 101 41 187 148 -0.2298 0.0545 -4.21 0 -0.2584 0.1130 -2.29 0.022
What water do you use for washing dishes
Other 7 4 8 8 12 15

21
5.3 Disease risk survey During the additional survey in phase 1, householders were asked about water sources used in wet and dry seasons. In this survey people were asked to indicate all (multiple) sources. In both seasons it was evident that the main sources were water from canals/rivers. River water was used by almost all households independently of season – 116/120 households in the wet season and 117/120 households in the dry season. The majority used it for all purposes including drinking, though slightly fewer used it for drinking in the wet season: 98/116 (84.5%) of users compared with 112/117 (95.7%) in the dry season. Rain water was the second major source (though notably not on My Thanh islet). However, its use was highly seasonal: used by 64/120 households in the wet season but only 18/120 households in the dry season. In both seasons rain water was used primarily for drinking: even in the wet season less than 11% of households who used rain water said they used it for daily activities other than drinking and preparing food. Piped supplies to near the house were reportedly used by 6/120 respondents only. Only 8 respondents said they used bottled water in the wet season and only 9 said they used bottled water in the dry season. 5.4 Interviews General water usage was also explored in the in-depth interviews during phase 3. For drinking, only 15 of the 32 interviewees appeared to take significant steps to provide safer drinking water: 12 stated they boiled water, 1 used bottled water and used 2 piped water from neighbours. There was clear qualitative evidence that people, including children, routinely drink untreated river water and sometimes drink water directly from the environment However, the 4 people who were asked about infant’s formula milk all stated that they used boiled water. For cooking water households mostly treated water only with alum at best. Washing of vegetables etc tended to be in alum-treated water or directly in untreated water. In additional interviews carried out during phase 4, 15/16 households stated that they use river water in the home. Box 3 contains a series of illustrative quotes on water use drawn from the two sets of interviews. Interviews also yielded a suggestion from one household that they only boil water if someone becomes sick [case 14 MK2 scen]. Another stated that they would drink bottled water only in the dry season, and that, by contrast, in the wet season they would freely drink river water direct from the environment when working in the ricefields – because the water runs fast and clear, and contains no rubbish [case 6 BD].
Box 3 Statements from households on use of river water “We drink it without boiling. [Q. Why don’t you boil it?] We drink without boiling all the time. Boiling takes firewood and we don’t have time to boil. Daily drinking, we don’t have time because we have to work on the field. [Q. All of your family drinks like that?] Yes.” [case 4 BD] “We boil water, pour it into the big thermos, make the formula for the baby. Its mother also drinks boiled water. My husband usually drinks tea so he uses boiled water. I and

22
other children drink cold water, iced water. Everybody drinks what he likes”. [case 7 MT] “[Q.Where do you get water for drinking?] Scoop the water out of the river, filter alum, then use it…. Children drink the same water as adults.” [case 7 MTI scen] “I take water from the river, filter it, and pour it into two buckets. Sometimes, I am diligent, and I will boil it. If not, I drink river water directly.” [case 2 MTI scen] “We boil water for the children to drink. Adults drink water cleansed by alum, we don’t boil it. [Q. Have your children ever drunk unboiled water like their grandparents or parents?] Sometimes they drink it by stealth, although we don’t allow them to do so.” [case 15 MK2 scen]
5.5 Summary findings => HEAVY RELIANCE ON RIVER WATER AS A SOURCE OF DRINKING WATER IN THE HOME (AND FOR OTHER DOMESTIC USES) => WATER SOURCES TEND TO BE SUBJECT TO SIMPLE (AND SOMETIMES NON-EXISTENT) TREATMENT, THOUGH THIS VARIES CONSIDERABLY BETWEEN HOUSEHOLDS => MULTIPLE WATER SOURCES AND TREATMENT LEVELS EXIST AT ANY ONE TIME FOR EACH HOUSEHOLD, IN ADDITION TO WHAT MAY BE THE STATED MAIN SOURCES OF WATER => CHILDREN MAY ALSO USE POORLY-TREATED DRINKING WATER SOURCES => LESS RAINWATER USAGE IN DRY SEASON (REDUCED AVAILABILITY OF RAINWATER APPEARS TO BE COMPENSATED BY INCREASED USE OF RIVER WATER AND POSSIBLY MORE BOTTLED WATER) => LITTLE OTHER EVIDENCE OF SYSTEMATIC SEASONAL CHANGES IN WATER SOURCE/TREATMENT BEHAVIOUR

23
6. Bathing/swimming behaviour Bathing habits are another focus of attention for disease risk. In this study population bathing takes place either in the home using stored water (none had routine access to piped water for bathing purposes) or directly by ‘swimming’ in the rivers and canals that form a dense network throughout the study sites. We also observed recreational swimming in the rivers, especially by children. Questions related to bathing in the health surveys focussed mainly on regularity of swimming behaviour. The results are presented by phase in Table 6 below. The figures represent the aggregate number of household members reported as following each category of behaviour at the time the survey took place. It is notable that, across phases, the percentage of people reported as swimming every day or most days exceeds the number reported as occasionally or never swimming (50%-63% compared with 36%-50%). Bathing in river water is evidently a commonplace habit, borne out by field observation. These results, however, provide no evidence that behaviours are varying systematically between wet and dry seasons. Table 6 changes in swimming behaviour between phases
every day most days most weeks occasionally never
phase 1 230 180 5 40 194
phase 2 123 192 3 42 276
phase 3 123 230 7 35 237
phase 4 128 206 7 27 233
every day most days most weeks occasionally never
phase 1 35.4% 27.7% 0.8% 6.2% 29.9%
phase 2 19.3% 30.2% 0.5% 6.6% 43.4%
phase 3 19.5% 36.4% 1.1% 5.5% 37.5%
phase 4 21.3% 34.3% 1.2% 4.5% 38.8%
Bathing behaviour was also a focus in the in-depth interviews with households (in the interviews people were asked to consider behaviour in both wet and dry seasons). Interviews backed up the finding that at least half of the population regularly bathes by swimming, and of the 32 interviewees most bathe in untreated water or directly in river (18 said they bathe in the river, 8 washed at home using untreated water, 5 used alum-filtered water, and 1 reported using well water). Box 4 provides some quotes indicating the readiness with which some families (including children) use untreated water for bathing, together with variations in swimming and bathing behaviour according to tide level as well as gender and especially age (bathing water appears more likely to be treated for babies and young children). Some households in the phase 3 and phase 4 interview rounds also made reference to season-specific bathing behaviour. However, the statements were contrasting and provide no further evidence of strong seasonality in bathing behaviour across the communities. One interviewee in Binh Duc stated: “In dry season, people often take a bath and wash clothes in the river because taking [bringing] water up takes time and makes them tired” [case 8 BD].

24
Another, in My Hoa Hung, stated: “Children easily get sick in the flood season with fever, with cold. When the water goes up, children usually bathe in the river, in the canal” [case 14 MK2 scen]. This linkage with swimming and children’s susceptibility to sickness was repeated by another interviewee, though it is unclear whether this perception relates to fear of respiratory or other infections: “We forbid our children to bathe in the river because we are afraid they get sick” [case 13 TTH scen].
Box 4 Statements from households on bathing behaviour “Using river water without being filtered for bathing causes no harm. My two children take bath in the same way. Many times, there is not water in our house, and when the tide is high they jump into the river to swim.” [case 1 BD] “I usually take a bath in the river when the water is high. When the water is low, I scoop water and take a bath ashore”. [case 1 MT] “The men jump into the river to bathe; women pump the water into the jars, cleanse it by alum and use it to bathe”. [case 3 MT] “I see a lot of people let their children swim in the river, but children in my family are using clean water to take baths. The older, 9 year old, uses filtered water for bathing. The younger, 4 year old, uses boiled water mixed with wine for daily bathing”. [case 8 MTI] “Sometimes, I boil the water before using it to bathe my baby” [case 4 MHH] “We usually boil water and use warm water to bathe my baby. He’s 14 months old. We pour some wine into water and use it for bathing the baby”. [case 2 MT]
6.1 Summary findings => BATHING/SWIMMING IN RIVERS AND CANALS & USE OF UNTREATED WATER FOR BATHING ARE COMMONPLACE => BUT CONSIDERABLE VARIATION IN BATHING BEHAVIOUR AMONG HOUSEHOLDS & ACCORDING TO GENDER AND AGE (WITHIN HOUSEHOLDS) => SOME HOUSEHOLDS USE BOILED WATER (MIXED WITH RICE WINE) FOR BATHING YOUNG CHILDREN => PERCEPTIONS IN SOME FAMILIES THAT SWIMMING LEADS TO SICKNESS (though this may relate to aggravation of respiratory infection rather than exposure to waterborne contaminants) => NO SYSTEMATIC EVIDENCE IN THIS STUDY OF SEASONALITY IN BATHING/SWIMMING (RELATED EITHER TO WATER LEVELS OR TO PERCEPTIONS OF HEALTH RISK) (tidal cycles are more likely to have an effect on timing of swimming)

25
7. Other hygiene behaviour The health surveys asked a series of questions over the 4 phases relating to a range of hygiene behaviours in addition to water use and bathing. These included aspects of sanitation, hand-washing and food hygiene. Table 7 lists the frequency of self-reported hygiene behaviours by visit and by season. The data confirms the observation of low levels of access to adequate sanitation within the home in the study sample. The majority of these households do not have their own toilet, and use shared toilets (often those of neighbours) or practice open defecation in waterways. Toilets that are available in the community include both simple latrines (built over fish ponds and watercourses) and flush toilets. This and other aspects of hygiene are discussed further in section 8. In order to distinguish the impact of visit number and season on a range of reported hygiene behaviours regression analyses were run for all variables with both visit number and season as independent predictor variables. As regards sanitation behaviour people were much more likely to defecate in the open rather than use a public or shared toilet during the wet season. Personal hygiene behaviour also differed by season with people reporting more frequent hand washing after toilet, before eating and before preparing food in the wet season compared to the dry. Interestingly there were also identified trends in behaviour that were independent of season. Over the course of the four visits people were more likely to report covering food and report hand washing before preparing or eating food. This apparent shift in behaviour could possible be related to the impact of hygiene education within the communities, although further targeted research would be needed to assess this. From the household interviews conducted in phase 3 we can also get a sense of the variability of hygiene behaviours. Hygiene practices, for example, are clearly not followed by all respondents. For hand-washing some insightful quotes include the following:
“We wash hands before eating. Our teacher taught us and we’ve got used to it” [case 1 MT]; “When hands are so dirty, with mud or soot, we wash; if not, don’t wash” [case 6 BD]; [Q. Do you have the habit of washing hands before cooking?] “Here we are not used to doing that” [case 1 BD].
7.1 Summary findings => POORER HOUSEHOLDS HAVE LOW LEVELS OF OWNERSHIP OF IMPROVED SANITATION (pit latrine or flush toilet) => HYGIENE BEHAVIOUR EXHIBITS VARIABILITY BETWEEN HOUSEHOLDS AND OVER TIME, BUT ONLY SOME BEHAVIOURS INDICATE A LEVEL OF SEASONALITY => OPEN DEFECATION IS MORE COMMON DURING THE WET SEASON => HAND-WASHING IS MORE FREQUENTLY PRACTISED BY SOME HOUSEHOLDS DURING THE WET SEASON

26
Table 7 Impact of visit and season on hygiene behaviour Visit Season Visit Season wet against dry indicator 1 2 3 4 Dry We
t Coef. StdErr Z P Coef. StdErr Z P
N 120 120 120 112 240 232
None: use surrounding area/canal
31 14 6 49 20 80 0.1492 0.0751 1.99 0.047 1.3987 0.2508 5.58 0
Shared toilet 66 86 91 39 177 105 -0.1166 0.0607 -1.92 0.055 -0.5008 0.1241 -4.04 0
Does your household have access to own toilet? Own toilet 23 20 23 24 43 47
Flush toilet to drain 3 7 8 10 15 14
Flush toilet to septic tank
10 7 7 10 14 21
Pit latrine 1 0 2 0 2 2 Toilet over canal or pond
9 6 6 4 13 55
If you have a toilet, what type is it?
Other 0 0 0 2 0 2
Never 9 10 1 9 11 18 0.0101 0.0240 0.42 0.675 0.2169 0.0532 4.08 0
Sometimes 50 65 85 33 150 83 Usually 52 42 31 69 73 121
How often do you wash hands after using the toilet?
Always 9 3 3 1 6 10
Never 20 17 5 14 22 34 0.0924 0.0221 4.19 0 0.1386 0.0490 2.83 0.005
Sometimes 54 71 78 33 149 87 Usually 46 32 34 64 66 110
How often do you wash hands before eating?
Always 0 0 3 1 3 1

27
Never 27 23 35 25 58 52 0.0558 0.0209 2.67 0.008 0.2114 0.0463 4.57 0
Sometimes 46 63 49 22 112 68 Usually 47 34 34 64 68 111
How often do your wife (you) wash hands before preparing food?
Always 0 0 2 1 2 1
Leave them to dry in air 11 75 48 34 123 45 0.1785 0.0884 2.02 0.044 -0.9738 0.1751 -5.56 0
Use towel 95 35 54 70 89 165
How do you usually dry your hands? Wipe on clothes 14 10 18 8 28 22 Do you use soap for washing hands?
Yes 52 40 38 44 78 96 -0.0353 0.0655 -0.54 0.59 0.2302 0.1527 1.51 0.132
Do you use detergent or soap to wash dishes?
Yes 118 120 120 112 240 230
Dry with cloth or towel 1 3 0 2 3 3 How do you dry
dishes after washing them? Leave to dry in air 119 117 120 110 237 229
Never 14 4 7 1 11 15 0.1565 0.0214 7.33 0 0.1024 0.0474 2.16 0.031
Sometimes 15 24 22 0 46 15 Usually 83 88 65 89 153 172
Do you cover food to prevent flies?a
Always 8 4 26 22 30 30
Cook again before eating later
99 116 111 110 227 209
Eat cold later 2 0 0 1 0 3
When you have cooked some food, what do you usually do with uneaten food after the meal?
Throw away or give to animals
19 4 9 1 13 20

28
8. Preventive behaviour and attitudes This section focuses on preventive behaviour in general, including water usage. The disease risk survey conducted in phase 1 include a detailed set of questions on attitudes and usage of preventive measures. The survey questions were later followed up during interviews. 8.1 General preventive behaviour The disease risk survey included reference to 9 specific preventive behaviours (with the option for respondents also to raise additional behaviours). Variations in the number of responses provided for each activity, and for each question relating to that activity, make it difficult to undertake statistical comparison. However, for the 9 assessed behaviours most respondents did provide a response (minimum 96, maximum 120). Table 8 indicates the frequency of responses to questions on whether specific behaviours were usual practice within the household. Table 8 Household responses on whether preventive behaviours were usual practice (ranked according to prevalence)
preventive behaviour
N yes % usual practice rank
Eating well cooked food 112 107 95.5 1
Covering water containers 117 104 88.9 2
Drinking cleaner water 117 103 88.0 3
Hand washing after toilet 113 92 81.4 4
Drinking boiled water 119 81 68.1 5
Hand washing before cooking/eating 107 67 62.6 6
Using cleaner water for washing body 97 38 39.2 7
Avoid touching dirty water 97 25 25.8 8
Using hygienic toilet 101 20 19.8 9
The low levels of practice of the final three behaviours in the table are notable. Qualitative statements on reasons for not practising these behaviours included:
‘saving clean water for eating/drinking’ and ‘convenience of using river’ (washing body); ‘inevitability of contact because of environment’ and ‘being accustomed to contact’ (touching dirty water); ‘lack of capacity to build toilet’ (hygienic toilet use).
In addition, it should be noted that there were still approximately one-third of respondents in the survey who reported not habitually washing hands before cooking/eating and not habitually drinking boiled water. The households were also asked to state how important they perceived each of these preventive measures to be, on the basis of high, medium or low importance. The results broadly matched the actual practices. Notable for being assessed as of high importance were the same top three behaviours as above: covering water containers (92/114 = 80.7%); eating well cooked food (88/112 = 78.6%); drinking cleaner water (88/117 = 75.2%). Notable for

29
being assessed as of low importance were the bottom three: using a hygienic toilet (38/101 = 37.6%); using cleaner water for washing body (33/96 = 34.4%); avoiding touching dirty water (31/99 = 31.3%). However, the assessment of ‘importance’ may in part reflect the apparent impracticality of these measures for many people. (NB Further detailed information about awareness of and practice of various hygiene measures is set out in a separate report from this survey). 8.2 Prevention and season The survey participants were also asked to consider whether they made any changes in their preventive behaviour between the wet and dry seasons. Only 14.2% (17/120) respondents said they changed their preventive behaviours between the two seasons; 72.5% respondents said that their was no change, and 13.3% did not know. The 17 who indicated change (a small minority of households) were asked to describe and explain the changes they made. The main changes they carried out related to water use and treatment. Mostly these responses suggested a relaxing of preventive measures in the dry season by these households related often to a perception that water is less contaminated then (by waste, dirt, agrochemicals and/or mosquito larvae) – however, it is important to restate that this set of responses came from a small minority of households. Some householders spoke of: not having to use alum to clear water in the dry season because the river water is more clear/less dirty; less cleaning of containers in the dry season because water is more clear; and not boiling water in the dry season. The recorded responses included the following rationales: ‘do not use alum to clear water if water is clear: if water is clear, using alum will make water sour’; ‘do not boil water and use alum clearing water in dry season: in the dry season, using alum will cause diarrhea’; ‘no need to boil water: due to water having no insecticide’. Other householders spoke of: not using river water in the wet season, because rainwater is more available then and cleaner than river water (which is used in the dry season); and, interestingly, not using rain water in the rainy season, because it leads to mosquitoes (presumably through breeding in water storage containers). Seasonality and preventive behaviour was also explored in the interviews. Here the responses were divided between those who perceived that disease prevention needed to be heightened in the wet season, those who perceived the need to be greater in the dry season, and those who perceived no difference. The varying perceptions of seasonal disease risk and how to avoid it are captured by the quotes in Box 5. The references to mosquito-borne diseases (in this field area primarily dengue and DHF) are just as mixed and contrasting as for waterborne diseases.
Box 5 Statements from households on preventive behaviour by season General disease (esp. diarrhea) [Q. Before, you said there’s a risk of having diarrhoea, red eyes, scabies…in flood season. So what about the dry season?] “Of course in dry season, we don’t have such a lot of diseases as in wet season. Therefore, I don’t have to do anything for prevention” [case 2 MTI]; “Rainy season, we must be careful, especially when the water both shift and spin [a reference to the onset of floods with high turbulence], that is the disease-ridden water. Children often get diarrhea.…. We make them eat cooked food, drink boiled water. In

30
rainy season, both children and adults have to drink boiled water. But this season [dry], we don’t boil water” [case 3 BD]; “In dry season, we especially pay attention to children’s eating and drinking. Strictly drink boiled water, don’t eat mango, guava - to avoid diarrhoea.” [case 5 BD]. Dengue risk “In the dry season there are more mosquitoes so we have to prevent more than in flood season” [case 1 BD]; “We’re careful in any seasons. There are fewer mosquitoes in the flood season. In the dry season there are more mosquitoes because people work on the fields, dam up. There are mosquitoes in the water. [But] We have to stay in the mosquito nets both in the dry season and the flood season” [case 3 MT]; “There are more mosquitoes in the rainy season than in the dry season. However, we always sleep in the mosquito-net. Therefore, I don’t feel any difference.” [case 4 MHH].
8.3 Summary findings => HOUSEHOLDS SHOW A WIDESPREAD AWARENESS OF POTENTIAL DISEASE RISKS AND OF PREVENTIVE MEASURES, BUT.. => HIGH VARIABILITY OF HOUSEHOLDS IN UNDERSTANDING AND IN PRACTICE OF PREVENTIVE MEASURES (including key hygiene promotion measures such as boiling drinking water and hand-washing before cooking/eating) => SOME KEY MEASURES SUCH AS IMPROVED SANITATION, AVOIDANCE OF WATER CONTACT, USE OF TREATED WATER FOR BODY WASHING APPEAR TO HAVE LOW PRACTICALITY AND ARE THEREFORE NOT VALUED HIGHLY => MOST HOUSEHOLDS DO NOT REPORT OVERALL CHANGE IN PREVENTIVE BEHAVIOUR ACCORDING TO SEASON => SOME EVIDENCE OF LOWER PERCEIVED NEED AND APPLICATION OF WATER TREATMENT/BOILING IN THE DRY SEASON, BUT HIGHLY VARIABLE…. => INCONSISTENT VIEWS BETWEEN HOUSEHOLDS AND COMPLEX SET OF RISK FACTORS AND PREVENTIVE RATIONALES INVOKED
31
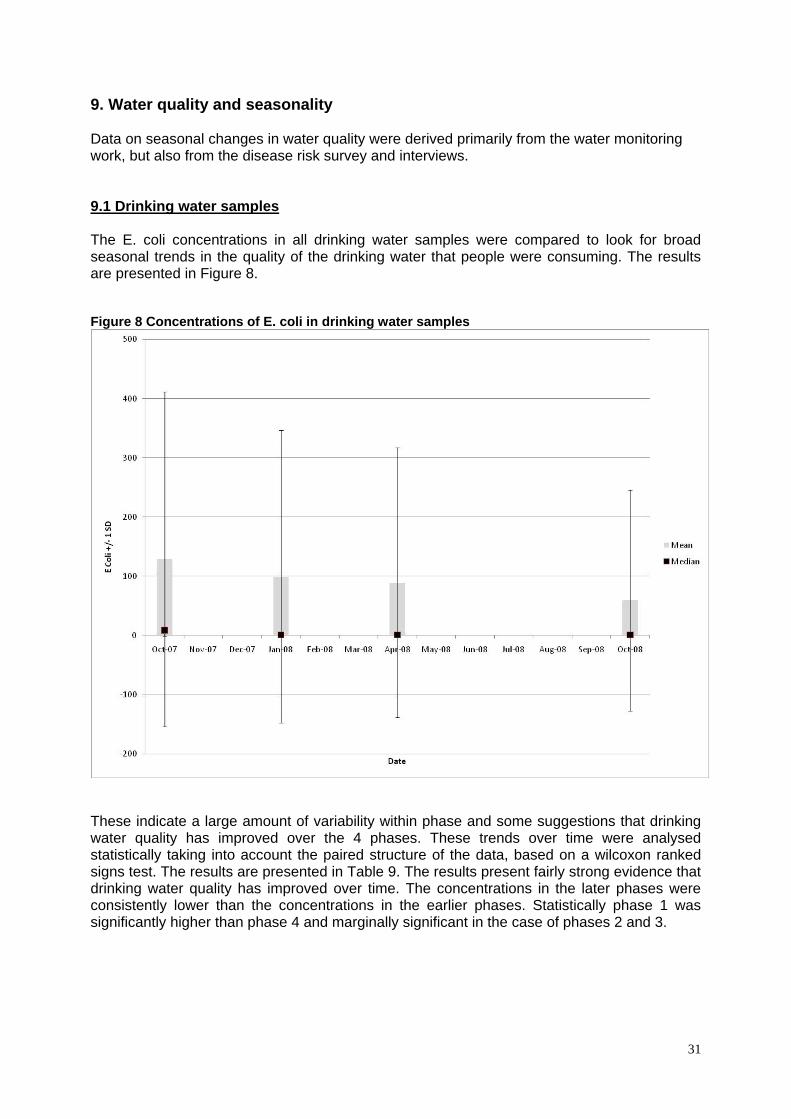
9. Water quality and seasonality Data on seasonal changes in water quality were derived primarily from the water monitoring work, but also from the disease risk survey and interviews. 9.1 Drinking water samples The E. coli concentrations in all drinking water samples were compared to look for broad seasonal trends in the quality of the drinking water that people were consuming. The results are presented in Figure 8. Figure 8 Concentrations of E. coli in drinking water samples
These indicate a large amount of variability within phase and some suggestions that drinking water quality has improved over the 4 phases. These trends over time were analysed statistically taking into account the paired structure of the data, based on a wilcoxon ranked signs test. The results are presented in Table 9. The results present fairly strong evidence that drinking water quality has improved over time. The concentrations in the later phases were consistently lower than the concentrations in the earlier phases. Statistically phase 1 was significantly higher than phase 4 and marginally significant in the case of phases 2 and 3.

32
Table 9 Comparing drinking water quality between phases P1 P2 P3
P2 P2 < P1 (p = 0.080) * *
P3 P3 < P1 (p=0.184) P3 > P2 (p=0.792) *
P4 P4 < P1 (p=0.009) P2 > P4 (p=0.812) P3 > P4 (p=0.555)
Based upon a wilcoxon ranked signs text E. coli concentrations in alum treated river drinking water To explore whether these trends were due to switching water sources the trends within water sources were explored further. Figure 9 presents the E. coli concentrations in alum-treated drinking water source by phase. Figure 9 Concentrations of E. coli in alum-treated drinking water samples
The results present little evidence for changes in E. coli concentrations in alum treated river water samples by phase.

33
Differences in E. coli concentrations in rain water and alum treated river water The significant changes in water source mostly occur between river water and rainwater. A comparison of the E. coli concentrations between river and rain water is presented in Figure 10, subdivided by phase. Figure 10 E. coli concentrations in rain water and alum treated river water
The results suggest that there are high concentrations of E. Coli in both river and rain water. Rain water did have lower concentrations than river water although this was less evident in the first phase. The data were compared using Mann-Whitney U tests. Statistically the concentrations were higher in river water (Mann-Whitney U test = -4.141; p < 0.001).

34
E. coli concentrations by source for drinking water Concentrations of E. coli in different drinking water sources were compared for the entire dataset (combining the 4 phases). This is shown in Table 10. The results suggest that the highest E. coli concentrations occurred in alum-treated river water, followed by unboiled rain water and boiled river water4. Table 10 E. coli concentrations by source for drinking water Mean Median SD N <1 (%) N
Bottled Water 2.45797 1.00000 4.819519 84.06% 69
Unboiled tap water
37.22000 1.00000 154.443685 70% 40
Boiled tap water 41.86667 1.00000 70.783143 66.6% 3
Alum river water 187.68667 29.10000 315.241760 18.49% 150
Boiled river water
28.90404 1.00000 127.595349 71.43% 98
Unboiled rain water
100.24130 4.10000 243.631823 36.96% 92
Boiled rain water 1.35000 1.00000 0.857321 83.33% 9
9.2 Household perceptions of water quality In the section on seasonal water sources within the disease risk survey, respondents were asked to consider the quality of the water source. For river water there was a slight difference in perception of quality between seasons, with marginally more households suggesting quality was poor in the dry season. Of the 114 year-round river water users who expressed an opinion on quality in both seasons, 66 (57.9%) thought its quality in the wet season was ‘unreasonable/needed improving’ (42.1% thought it was ‘reasonable/acceptable’); while 72 (63.2%) thought its quality in the dry season was unreasonable/needed improving (36.8% thought it was reasonable/acceptable). In both cases, more than half the respondents recognised quality concerns over river water. This contrasts greatly with perceptions of rainwater quality. For rainwater, only 1/60 of wet season users and 1/18 of dry season users thought its quality was unreasonable (different respondents). 4 NB The poor performance of alum treatment in this respect is to be expected: though alum can remove particles from water, it would not be expected to significantly reduce overall microbial contamination; moreover, the effectiveness also depends on the quality of the treatment process, and observations of alum use suggested that treatment was often poor.
35
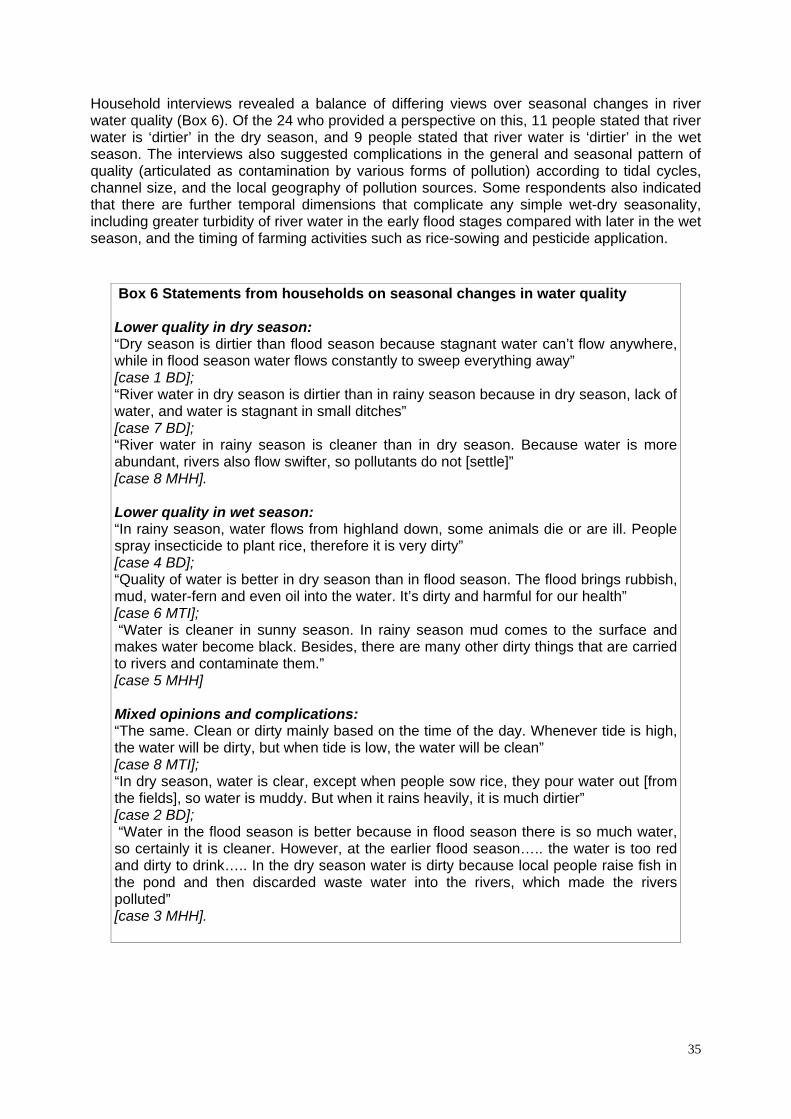
Household interviews revealed a balance of differing views over seasonal changes in river water quality (Box 6). Of the 24 who provided a perspective on this, 11 people stated that river water is ‘dirtier’ in the dry season, and 9 people stated that river water is ‘dirtier’ in the wet season. The interviews also suggested complications in the general and seasonal pattern of quality (articulated as contamination by various forms of pollution) according to tidal cycles, channel size, and the local geography of pollution sources. Some respondents also indicated that there are further temporal dimensions that complicate any simple wet-dry seasonality, including greater turbidity of river water in the early flood stages compared with later in the wet season, and the timing of farming activities such as rice-sowing and pesticide application.
Box 6 Statements from households on seasonal changes in water quality Lower quality in dry season: “Dry season is dirtier than flood season because stagnant water can’t flow anywhere, while in flood season water flows constantly to sweep everything away” [case 1 BD]; “River water in dry season is dirtier than in rainy season because in dry season, lack of water, and water is stagnant in small ditches” [case 7 BD]; “River water in rainy season is cleaner than in dry season. Because water is more abundant, rivers also flow swifter, so pollutants do not [settle]” [case 8 MHH]. Lower quality in wet season: “In rainy season, water flows from highland down, some animals die or are ill. People spray insecticide to plant rice, therefore it is very dirty” [case 4 BD]; “Quality of water is better in dry season than in flood season. The flood brings rubbish, mud, water-fern and even oil into the water. It’s dirty and harmful for our health” [case 6 MTI]; “Water is cleaner in sunny season. In rainy season mud comes to the surface and makes water become black. Besides, there are many other dirty things that are carried to rivers and contaminate them.” [case 5 MHH] Mixed opinions and complications: “The same. Clean or dirty mainly based on the time of the day. Whenever tide is high, the water will be dirty, but when tide is low, the water will be clean” [case 8 MTI]; “In dry season, water is clear, except when people sow rice, they pour water out [from the fields], so water is muddy. But when it rains heavily, it is much dirtier” [case 2 BD]; “Water in the flood season is better because in flood season there is so much water, so certainly it is cleaner. However, at the earlier flood season….. the water is too red and dirty to drink….. In the dry season water is dirty because local people raise fish in the pond and then discarded waste water into the rivers, which made the rivers polluted” [case 3 MHH].
36
9.3 Summary findings => HIGH CONCENTRATIONS OF E. COLI REMAIN IN THE MAJOR DRINKING WATER SOURCE: ALUM-TREATED RIVER WATER (boiled river water is improved but still has significant contamination) => UNBOILED RAINWATER ALSO HIGHLY CONTAMINATED => APPARENT UNDERLYING TREND OF IMPROVEMENT IN DRINKING WATER QUALITY THROUGH STUDY (however, data is not based on all drinking water sources per household) => RIVER WATER PERCEIVED AS LOW QUALITY BY MANY HOUSEHOLDS, BUT RAINWATER GENERALLY PERCEIVED AS HIGH QUALITY => NO EVIDENCE FROM WATER MONITORING OF SYSTEMATIC SEASONAL CHANGE IN DOMESTIC DRINKING WATER QUALITY (however, data is not based on all drinking water sources per household) => LITTLE SEASONAL CHANGE IN QUALITY OF ALUM TREATED WATER (most common source) => CONCERNS OVER DOMESTIC WATER QUALITY SLIGHTLY MORE PREVALENT AMONG RIVER WATER USERS IN DRY SEASON => PERCEPTIONS OF SEASONAL CHANGES IN CONTAMINATION OF RIVER WATER (by various forms of pollution) ARE HIGHLY VARIABLE BY HOUSEHOLD, AND MAY BE ASSOCIATED WITH LOCALIZED FACTORS (including size of watercourse and pollution sources) => EVIDENCE OF A FINER TEMPORAL DIMENSION TO ENVIRONMENTAL WATER QUALITY – INFLUENCED BY TIDAL CYCLES (daily); EARLY FLOOD SEASON TURBIDITY, RICE SOWING AND PESTICIDE APPLICATION (within-season)

37
10. Health outcomes and seasonality Four strands of evidence were used to analyse health outcomes and especially to assess seasonality of disease: health surveys (4 phases); health records data; disease risk survey; and household interviews. 10.1 The effect of seasonality and environmental factors on self-reported symptoms The health surveys conducted with households over 4 phases collected detailed information on a range of self-reported symptoms (with a focus especially on diarrhoeal disease symptoms and skin complaints). These were tested for associations with seasonality and a range of other environmental/behavioural factors. The number of times each symptom was reported and mean prevalence for the dry and wet periods are shown in Table 13. It can be seen that all symptoms that were sufficiently common on which to make a judgement were more common in the wet season compared to the dry season. However, in few cases was this statistically significant. Of particular note was the excess of self-reported symptoms in the wet season due to fever (prevalence rate ratio 2.00; 95% confidence interval 1.55 – 2.58), colds (1.88; 1.06 – 3.34), cough (1.56; 121 – 2.02), abdominal pain (2.48; 1.14 – 5.38) and skin problems (2.26; 1.46 – 3.50). Table 13 Distribution of self reported symptoms by wet or dry season
Wet
Dry
Number reporting symptoms (N=1251)
Mean prevalence rate/%
Number reporting symptoms (N=1268)
Mean prevalence rate/%
Diarrhoea 34 2.72 26 2.05
Fever 176 14.07 90 7.10
Sore eyes 11 0.88 5 0.39
Sore throat 14 1.12 10 0.79
Cold 34 2.72 18 1.42
Cough 148 11.83 96 7.57
Shortness of breath 1 0.08 2 0.16
Chest pain 7 0.56 2 0.16
Abdominal pain 22 1.76 9 0.71
Vomiting 6 0.48 6 0.47
Passy watery stool 14 1.12 14 1.10
Passing blood in stool 0 0.00 0 0.00
Pain on passing urine 0 0.00 0 0.00
Blood in urine 0 0.00 0 0.00
Need to pass urine more frequently 2 0.16 1 0.08
Pain or stiffness in joints/muscles 35 2.80 34 2.68
Gynaecological problems 1 0.08 0 0.00
Skin problems 66 5.28 29 2.29

38
Two symptoms, recent onset of diarrhoea and skin symptoms, were further investigated to determine possible environmental risk factors. Diarrhoeal disease Single variable analyses predicting diarrhoea that were significant at the p=0.2 level were frequency of swimming in surface water (p=0.004), consumption of water from an improved water supply (p=0.191), owning food animals (p=0.142), owning dog or cat (p=0.083), factor variable for “wealth” (p=0.014) and age (p=0.0001). Other variables tested were gender, access to own, shared or no toilet and whether or not river water is consumed. There was no association between diarrhoea and either drinking water quality as measured by E. coli counts or whether or not the drinking water was boiled or otherwise treated. Table 14 shows the final model for diarrhoea in all ages. There were strong negative associations between age (IRR= 0.98; 95%CI 0.96 – 1.00; p=0.013) and frequency of swimming with illness being reported 73% less often in people who swim most days compared to people who never swim. (IRR= 0.27; 95%CI 0.11 – 0.66; p=0.004). Consumption of water from an improved water source (piped tap water and rain water) was marginally negatively associated with risk (IRR= 0.45; 95%CI 0.19 – 1.07; p=0.071). Table 14 Risk factors associated with reporting of diarrhoea in all ages
Variable Incidence
Rate Ratio L95%CI U95%CI P
Age/Years 0.98 0.96 1.00 0.013
Never swim 1 0.017
<1 time/w 0.89 0.32 2.49
Most days 0.27 0.11 0.66
Swimming frequency
Every day 0.45 0.19 1.05 No 1 Improved water source
Yes 0.45 0.19 1.07 0.071
“Wealth factor” 0.76 0.51 1.12 0.162 When the analysis was restricted to children under 5 years (Table 15), age remained significant (IRR=0.70; 0.52 – 0.96; p=0.025), consumption of water from an improved water source was negatively associated with risk (IRR=0.25; 0.07 – 0.85; p=0.027), and owning food animals was marginally negatively associated with risk (IRR=0.34; 0.11 – 1.01; p=0.053). Table 15 Risk factors associated with reporting of diarrhoea in children under 5 years
Variable
IRR L95%CI U95%CI P Age/Years 0.70 0.52 0.96 0.025
No 1 0.027Improved water source
Yes 0.25 0.07 0.85
No 1 0.053Owns food animals
Yes 0.34 0.11 1.01
In line with a recent systematic review by Gundrey et al (2004), we therefore found no association between water quality as measured by E Coli counts and diarrhoeal disease risk.

39
However, there was an association between whether or not people used an improved water source and diarrhoea. This was strongest in children under 5 years old. Children under 5 years who had access to improved water source (piped or rainwater) reported only 25% the amount of diarrhoea as children who drank unimproved water (canal water or river water). Skin symptoms In addition to the significant association with season reported above, significant risk factors for skin symptoms included frequency of swimming in surface water (p=0.003), consumption of water from an improved water supply (p=0.165), the number of people living in the home (p=0.056) and age (p=0.008). In the final model for skin symptoms only age (IRR=0.98; 0.97 – 1.00; p=0.016) and season (wet season/dry season IRR=2.25, 1.45 – 3.49, p<0.001) remained significant, with symptoms more common in the young and more likely to occur in the wet season. Table 16 lists the main skin symptoms complained of. By far the most common complaint was itchy skin. Table 16 Percent distribution of symptom scores for complaints of skin symptoms. Symptom No Yes a little Yes quite a lot Yes very much
Itchy skin 12.6 35.8 35.8 14.7
Dry/sore rash 85.3 6.3 4.2 2.1
Scaly skin 81.1 4.2 9.5 3.2
Itchy rash on your hands 74.7 15.8 4.2 3.2
Pimples 73.7 9.5 13.7 1.1
Other rashes on your face 91.6 3.2 1.1 3.2
Warts 93.7 4.2 0 1.1
Troublesome sweating 88.4 4.2 3.2 3.2
Sores 84.2 5.3 7.4 2.1
Loss of hair 96.8 0 1.1 1.1
Other skin problems 69.5 4.2 17.9 6.3
10.2 Recorded health outcomes and seasonality: 2002-2008 In order to assess the links between seasons and health outcomes over a broader time period, we analyzed data on reported health compiled by the health stations in each commune over the period 2002-2008. As is common in the context of local health surveillance in many countries the quality of the dataset was not high: not all communes recorded the same diseases and there were many evident gaps in the data. However, the collection of data over multiple years and the fact that the study was interested in dynamics rather than absolute numbers makes these data limitations a little less problematic. Hence it was of value to examine the data to see if any seasonal trend emerged – at least in the case of diarrheal diseases and dengue haemorrhagic fever, which were recorded by all three health stations.

40
Figure 12 shows the cycle of water level and the incidence of diarrhoea as an aggregate of monthly data from the three health stations. As it shows, reported incidence5 of diarrhoeal disease was higher in the mid-period years 2003 to 2007, with peaks in June 2004, January 2006, and April to August 2007. There is no clear seasonal pattern in the disease data, with peaks and lows occurring in various months in different years. Figure 12 Average river height and reported incidence of diarrhoea per month, 2002-2008
5
10
15
20
25
30
35
40
45
50
1 2 3 4 5 6 7 8 91011121 2 3 4 5 6 7 8 91011121 2 3 4 5 6 7 8 91011121 2 3 4 5 6 7 8 91011121 2 3 4 5 6 7 8 91011121 2 3 4 5 6 7 8 91011121 2 3 4 5 6 7 8 9101112
2002 2003 2004 2005 2006 2007 2008
Dia
rrh
ea in
cid
ence
(ca
ses)
0
50
100
150
200
250
Ave
rag
e w
ater
leve
l (cm
)
Diarrhea Level
A simple regression model was used to test the relationship of river level and rainfall with aggregate diarrhoea cases reported across the three communes. The results are provided in Table 17. Though there was possible negative association between river level and diarrhoea incidence (ie possibly suggesting higher levels in the dry season), this finding had only marginal statistical significance. Taking autocorrelation within the data into account, the association is seen to be weaker still. Hence there was again no strong evidence of an association between seasonality and diarrhoeal disease. Table 17 Regression model results: river level and rainfall with aggregate data on diarrhoea incidence, 2002-2008
Coefficientsa
Unstandardized Coefficients
Standardized
Coefficients
Model B Std. Error Beta t Sig.
(Constant) 27.988 2.066 13.544 .000
level -.041 .022 -.265 -1.897 .062
1
rainfall .011 .012 .127 .912 .365
a Dependent Variable: total cases of diarrhoea 5 It is important to note that the number of diarrhoeal cases per month reported to health stations is likely to be much lower than the incidence within the community.

41
Data on dengue haemorrhagic fever (DHF) was also consistently recorded by the three health stations, although overall incidence rates were low. Figure 13 shows monthly average cases of reported DHF for during the 2002-2008 period. It displays a tendency for more dengue cases to occur in the period June to November, broadly corresponding to the wet season. However, the standard deviation bars are large, indicating a very large amount of inter-annual variability that makes overall trends difficult to ascertain. Figure 14 shows the annual variation in dengue cases from year to year. It displays an extreme amount of variability and reveals no definite trends over time. Figure 13 Monthly average cases of DHF 2002 – 2008
Figure 14 Annual cases of DHF 2002 – 2008

42
10.3 Disease risk and season perceptions The possible linkages between disease and seasons were explored in the behavioural survey. For diarrheal disease, 64/106 (60.4%) who responded said that the number of people affected changed with the seasons; only 9/106 (8.5%) said it did not. However, views on which season had higher levels was split, though a larger number suggested the rain/flood period was worse: 51/91 (56.0%) indicated the wet season was a time of higher diarrheal disease and 28/91(30.8%) indicated the dry season. For skin disease, 82/116 (70.7%) said that the number of people affected changed with the seasons; only 11/116 (9.5%) said it did not. Here the views on which season was worse were more heavily skewed toward the wet season: 60/99 (60.6%) said the highest number was during the wet season, and 24/99 (24.2%) said the highest number was during the dry season. (NB For each disease 20-30% did not know if seasonal changes took place). People were also asked to give reason for the seasonal differences. In both cases, reasons related to water dominated. For diarrheal disease, 71.1% of the reasons given related to water quality/use; for skin diseases, 77.9% of reasons given related to water quality/contact. Recorded statements on the reasons for higher diarrheal/skin disease risk in the wet season included the following: ‘Flood water with dirty things, insecticide, mud and waste overflows into residential area’; ‘In flood season, water from fish pond and toilet run into river and cause pollution’; ‘In rainy season, waste and excrement drifted downstream and cause pollution’. Reasons for higher incidence of diarrheal disease in the dry season included: ‘Weather is very hot in February and March and people feel thirsty and drink much water. Therefore, they easily get diarrhea’; ‘In blazing sun time, stomach feels heavy and it’s easy to get diarrhea’. In the household interviews, disease risk was also more often regarded as higher in the rainy season, but differing views were again evident – indeed their were complex nuances of perspective even within one account:
‘At the beginning of the rainy season [there is] a lot of disease: fever, heat, dengue. In the sunny season, diarrhoea, vomit, indigestion, sore eyes. Because water supply in dry season is more dirty and not everyone uses tap water, in this season it’s hot, feel tired, easily become ill…food source is not safe neither. [However] Usually, disease in rainy season is more serious, and it takes a long time to recover’ [case 7 BD].
As with the discussion of river water quality, there was a complex mix of explanations for seasonal differences, and perceptions of changing disease risk were linked with many factors other than river levels. For example, in the wet season, it was again suggested that pesticide application to crops in certain months can be a factor (presumably in relation to skin disease). It was also noted that the beginning of the flood season may be a peak time for some diseases, including diarrheal disease: related to water quality/turbidity; pollution from upstream; and people being unaccustomed to changes in water at the start of the season. A wide range of factors were mentioned in relation to dry season risk (especially of diarrheal disease). For example, it was suggested that the dry (sunny, hotter) season was a time of: polluted vegetables (including sellers wetting them to keep them moist); unripe fruit being eaten; people quenching their thirst in the fields because of the heat; the heat increasing susceptibility of the body to disease; sweating and skin rashes; more river-bathing to keep cool; more abundant flies; higher food-borne disease risk from meat and other foodstuffs. (NB many quotes are available to illustrate these assertions).

43
10.4 Summary findings => LITTLE EVIDENCE OF CORRELATION BETWEEN DIARRHEAL DISEASE AND MONITORED DRINKING WATER QUALITY OR TREATMENT METHOD……ALTHOUGH SOME NEGATIVE ASSOCIATION WITH ACCESS TO AN IMPROVED WATER SOURCE WAS NOTED, ESPECIALLY FOR CHILDREN => AGE AND SWIMMING FREQUENCY WERE BOTH STRONGLY NEGATIVELY ASSOCIATED WITH DIARRHEAL DISEASE => AGE IS ALSO SIGNIFICANT FOR SKIN DISEASE => LITTLE EVIDENCE OF CORRELATION BETWEEN SEASON AND DIARRHEAL DISEASE WITHIN THE HEALTH SURVEYS OR THE HISTORICAL DATA => STRONGER SEASONAL LINKAGE FOR SKIN DISEASE, FEVER AND RESPIRATORY DISEASE (higher in wet season) IN THE HEALTH SURVEY DATA => MOST PEOPLE PERCEIVED SEASONAL DIFFERENCES EXISTED IN DIARRHEAL DISEASE AND SKIN DISEASE RISK (with more saying incidence was higher in the wet season, especially for skin disease) …… => …..BUT VIEWS WERE SPLIT ACROSS HOUSEHOLDS, ESPECIALLY FOR DIARRHEAL DISEASE => MOST IDENTIFIED THE DIFFERENCES AS BEING RELATED TO WATER QUALITY/USE/CONTACT => BUT COMPLEX MIX OF LAY EXPLANATIONS AND LINKAGE WITH SEASONAL FACTORS OTHER THAN WATER LEVELS (including pesticides/flood onset in wet season; effects of heat and dryness on thirst, thermoregulation, foodstuffs etc)

44
11. Conclusion: combining the evidence on seasonal disease risk and other risk factors Each of the data strands in the study and each of the sections of this report tells its own story. However, the aim of the research design was to bring the strands together to build a narrative of risk associated with seasonal change in the Mekong Delta. By risk, here we mean risk of disease outcomes in the population. Risk can be defined in many ways within the different branches of science represented in this project. One approach, drawn largely from the political ecology of natural hazards, sees the level of risk defined both by the nature of the hazard and the vulnerability of people to its potential health effects (Few, 2007). Vulnerability, in turn, is seen to be composed both of potential exposure and underlying susceptibility of individuals. At the outset, it needs to be acknowledged that each dataset has some limitations, associated in part with the experimental nature of the work, including the relatively small sample size. However, in this study the data limitations are to some extent countered by the complementary data strands and the opportunity to triangulate tentative findings. Problems such as under-reporting of risk-raising behaviours or exaggeration of preventive actions (with some respondents perhaps unwilling to admit to poor hygiene practices) are also partially negated because of the study was fundamentally interested in looking at temporal dynamics rather than absolute numbers. 11.1 Dynamics of disease risk Table 18 brings together each of the summary points listed at the end of each section. Drawing on this list we can see that overall a highly complex picture emerged of seasonal dynamics in the study sites - of water contamination levels, patterns of water usage, hygiene behaviour (and perceptions), other risk factors and reported disease incidence. This was especially the case for diarrhoeal disease risk, which was the prime focus within the original study design. Diarrhoeal disease Contrary to some prevailing messages from public health bodies, in this study we found little evidence of any seasonal impact on the incidence of diarrheal disease, and little evidence of an increase in risk factors. Using E. coli as an indicator, water testing results suggest that contamination of environmental water was higher in the dry season when river levels were low. This is also the season when there is less access to rainwater as an alternative (relatively safer) source. The evidence that this higher contamination level was matched in domestic water supplies, however, is not strong (most people rely on river water but many apply treatment methods to stored drinking water). Taken together, the findings on perceptions of water quality and the need for water treatment also do not suggest a strong seasonality to water quality existed – although perspectives from different households were highly variable and included strong views relating to both seasons. There was little systematic seasonal change to note in most hygiene behaviours – although the wet season tended to be characterized by more hand-washing on the one hand, but more open defecation on the other. There were wide disparities across the households in perceived risk of diarrheal disease according to season, with most people citing factors relating to water (wet or dry season) but references also to the effects of dry season heat on physiology and on food hygiene. Finally, this variation in perspectives was reflected in the lack of any clear association between seasonality and reported diarrheal disease outcomes within the 4-phase health surveys in 2007/2008 or within the historical data for 2002-2008. This challenges the idea that environmental seasonality translates into significantly higher diarrheal disease burden at population level. The results suggest that even if there is a slight

45
increase in environmental contamination in the dry season, its effect may well not be carried through to seasonal diarrheal disease outcomes at the population level. Though further research is needed to support this finding, it appears that marginal temporal variations in water quality in the environment are unlikely to generate a strong difference in health outcomes at the population level. They become masked by a complex mix of inter-household variations in water source/treatment and hygiene patterns, intra-household variations in behaviour, temporal inconsistencies in behaviour, seasonal variation in other risk factors operating to reduce/increase diarrheal disease risk, and perhaps by within-season and locational complications to seasonal exposure patterns. We found inter-household variation in exposure and sensitivity factors within the population under study according to complicating factors such as size of watercourse available and proximity to pollution sources; and we also noted how disease risk might vary on a finer temporal scale because of transitions through flood season. Similarly, other seasonal risk factors potentially operating to reduce/increase diarrheal disease risk such as changes in sanitation behaviour or food hygiene are likely to become masked in effect by the complex interweaving of health impact pathways for diarrheal disease. Detection of a seasonal signal relating to health outcomes is likely to require a very large population sample – and the proportional change in outcomes may be so small as to be trivial in terms of public health (though for vulnerable sub-groups, especially infants, this needs to be closely monitored). The work on seasonality and differences in sensitivity challenges simplistic assumptions about the nature of the hazard-outcome pathway, and has potential implications for the timing and targeting of health promotion activities in the region. The differential vulnerability of young children to diarrheal disease throughout the year was especially highlighted in the surveys and interviews – perhaps suggesting the need for targeted health promotion to help protect this age group in all seasons. Skin complaints & other diseases For skin diseases, the evidence of seasonality from various data strands was stronger. Both self-reported cases of skin complaints and perceptions of risk of skin disease were skewed toward the wet season (although it is notable that over 20% of households perceived the contrary - that risk is higher in the dry season). Most households in the behavioural survey associated skin disease with contact with water, through activities such as bathing in river water, swimming and working in ricefields. As with diarrheal disease, age was significantly negatively associated with risk of skin disease. The reason for the strong seasonality in reporting of skin symptoms (almost entirely itch) is not clear. Although the cause of the symptoms, and of the seasonal change in their incidence, was untested in this study, possible explanations may include variations in exposure behaviour to surface water, and seasonal variations in growth of algae and cercaria. Among respondents there was a common perception that agrochemicals applied to fields were a major cause. Pesticide use in rice paddy production in the Mekong delta is highest in the early phases of the growing seasons (e.g. July/August and March/April6), and the general suggestion was that early wet season floodwaters became contaminated with pesticides from fields – however, we cannot prove that an association between this and skin disease exists. The health surveys also reported significantly higher wet season incidence of respiratory complaints. It is possible that higher rain/humidity in the wet season may account for this – though that needs further study. Fever symptoms also exhibited some seasonality, but in this study we were unable to distinguish cause of symptoms (e.g. gastro-intestinal disease, respiratory disease, vector-borne disease). It is plausible that excess fever in the wet season
6 Farmers in Long Xuyen normally produce 2 rice crops per year: July-September and March-May.

46
could be related to increased transmission of vector-borne diseases such as dengue, but we have no obvious diagnosis. Historical data for reported dengue haeomorrhagic fever (DHF) suggested some association with the wet season, although high inter-annual variability made overall trends difficult to ascertain. Additional note on preventive behaviour One of the key rationales of the study was not simply to examine seasonal environmental changes on the one hand and disease outcomes on the other, but to try to understand quite how the two were linked (or delinked) via mechanisms of exposure and susceptibility. Hence behavioural analysis was a major element in the study, and one of the striking findings of the research was the high variability of preventive behaviour. However, this was not necessarily a result of knowledge deficit. Despite being all classed as poor, the level of awareness of the links between environment, hygiene and health appeared to be high in these communities. Knowledge/awareness was not the main problem – economic capacity and motivation to act were just as likely to be key constraints on health protection. Table 18 Summary points from the sections of the report
General information on sites and households
• All the households in the study could be classed as ‘low-income’, but there was some variation in wealth indicators suggesting that the group is not homogenous in terms of livelihood assets • There was a general recognition among the sampled households of the linkages between water and health and especially that contaminated water can pose health risks • Most households regarded children as more likely to be exposed and susceptible to diarrheal disease (& to water-related disease in general) • The impacts of disease were articulated not solely in health terms but also in terms of income generation (hence the effects of disease on adults may be perceived as worse)
Seasonality of environment
• River and rainfall levels show a pronounced seasonal pattern in Long Xuyen, creating distinct wet and dry season environmental conditions • Rainfall and river level maxima tend to coincide, but there is a 2-3 month lag between rainfall minimum and water level minimum • Evidence of higher contamination levels in dry season (based on E. coli concentration as an indicator)
Water sources and treatment
• Heavy reliance on river water as a source of drinking water in the home (and for other domestic uses) • Water sources tend to be subject to simple (and sometimes non-existent) treatment, though this varies considerably between households • Multiple water sources and treatment levels exist at any one time for each household, in addition to what may be the stated main sources of water • Children may also use poorly-treated drinking water sources • Less rainwater usage in dry season (reduced availability of rainwater appears to be compensated by increased use of river water and possibly more bottled water) • Little other evidence of systematic seasonal changes in water source/treatment behaviour
Bathing/ swimming behaviour
• Bathing/swimming in rivers and canals & use of untreated water for bathing are commonplace • But considerable variation in bathing behaviour among households & according to gender and age (within households) • Some households use boiled water (mixed with rice wine) for bathing young children • Perceptions in some families that swimming leads to sickness (though this may relate to aggravation of respiratory infection rather than exposure to waterborne contaminants) • No systematic evidence in this study of seasonality in bathing/swimming (related either to water levels or to perceptions of health risk) (tidal cycles are more likely to have an effect on timing of swimming)

47
Other hygiene behaviour
• Poorer households have low levels of ownership of improved sanitation (pit latrine or flush toilet) • Hygiene behaviour exhibits variability between households and over time, but only some behaviours indicate a level of seasonality • Open defecation is more common during the wet season • Hand-washing is more frequently practised by some households during the wet season
Preventive behaviour and attitudes
• Households show a widespread awareness of potential disease risks and of preventive measures, but.. • High variability of households in understanding and in practice of preventive measures (including key hygiene promotion measures such as boiling drinking water and hand-washing before cooking/eating) • Some key measures such as improved sanitation, avoidance of water contact, use of treated water for body washing appear to have low practicality and are therefore not valued highly • Most households do not report overall change in preventive behaviour according to season • Some evidence of lower perceived need and application of water treatment/boiling in the dry season, but highly variable…. • Inconsistent views between households and complex set of risk factors and preventive rationales invoked
Water quality and seasonality
• High concentrations of E. coli remain in the major drinking water source: alum-treated river water (boiled river water is improved but still has significant contamination) • Unboiled rainwater also highly contaminated • Apparent underlying trend of improvement in drinking water quality through study (however, data is not based on all drinking water sources per household) • River water perceived as low quality by many households, but rainwater generally perceived as high quality • No evidence from water monitoring of systematic seasonal change in domestic drinking water quality (however, data is not based on all drinking water sources per household) • Little seasonal change in quality of alum treated water (most common source) • Concerns over domestic water quality slightly more prevalent among river water users in dry season • Perceptions of seasonal changes in contamination of river water (by various forms of pollution) are highly variable by household, and may be associated with localized factors (including size of watercourse and pollution sources) • Evidence of a finer temporal dimension to environmental water quality – influenced by tidal cycles (daily); early flood season turbidity, rice sowing and pesticide application (within-season)
Health outcomes and seasonality
• Little evidence of correlation between diarrheal disease and monitored drinking water quality or treatment method……although some negative association with access to an improved water source was noted, especially for children • Age and swimming frequency were both strongly negatively associated with diarrheal disease • Age is also significant for skin disease • Little evidence of correlation between season and diarrheal disease within the health surveys or the historical data • Stronger seasonal linkage for skin disease, fever and respiratory disease (higher in wet season) in the health survey data • Most people perceived seasonal differences existed in diarrheal disease and skin disease risk (with more saying incidence was higher in the wet season, especially for skin disease) • …..but views were split across households, especially for diarrheal disease Most identified the differences as being related to water quality/use/contact • But complex mix of lay explanations and linkage with seasonal factors other than water levels (including pesticides/flood onset in wet season; effects of heat and dryness on thirst, thermoregulation, foodstuffs etc)
48
11.2 Discussion of the approach The first objective of this study was to field test a multi-disciplinary research approach. It is possible to draw a number of lessons from progress to date in terms of research design and the processes of data collection. Here we concentrate on some key points that are likely to be applicable in many lower-income country settings. The initial phase of fieldwork emphasized the importance of piloting a research design to fit local contexts. Household selection procedures and survey designs went through a vital iterative process of revision before and after piloting in one of the study sites. It was therefore crucial that senior team members from the different disciplines were directly involved in this stage of fieldwork. Two examples of revisions for this project included decisions to target households with children under five (to capture the perceived highest-risk group) and the decision to instruct field researchers to speak with adult women where possible (men were much less likely to express knowledge of ill-health within the household). Another lesson learned was the recognition that, for this streamlined, integrated approach, it was appropriate to maximize sampling of high-risk population groups - both in terms of site selection and household selection. This was particularly important in order to generate sufficient data on health outcomes, bearing in mind that the research was interested in analyzing disease dynamics as opposed to community incidence per se. The multi-layered research approach also reduced the need to build control groups into research design. Hence all the households selected for study were ‘low-income’ and in locations not protected by flood control structures. These high-risk groups also constituted the key target beneficiaries for the research, further justifying a methodological focus on the risk factors affecting them (Emch, 1999). Locating, re-locating, and mapping households and sample sites can be problematic in contexts where existing maps are absent or of poor quality, houses are not numbered and there are no formal addresses. Data collection and processing could be improved through the use of GPS equipment and a standardized system of house identifiers applied across the field team from the outset of the fieldwork. One notable value of the in-depth semi-structured interview research was that it revealed a greater complexity of household water usage than would have been derived from the questionnaire survey alone. For example each household in the survey was asked to describe a main source of drinking water currently used. However, from the qualitative interviews it became clear that members of most households drew their drinking water supply from multiple sources (including treated and untreated river water, stored rainwater, piped supplies and bottled water) at different times. This underscores the need for methodologies that can reveal a detailed understanding of multiple sources, levels of treatment and corresponding uses. The potential value of direct observation of household water use practices was raised in related research in Vietnam (Clasen et al., 2008). This study was not, and was never intended to emulate, gold-standard epidemiological research practice. The idea was to develop and test a streamlined, cost-effective approach applicable to a context in which both existing data and resources for funding research are severely limited, using multiple layers of data on different aspects and using different approaches as triangulation. Each dataset has its limitations (in part because of the experimental aspect of the project but also because of the intentional rapid-research approach). However, taken together the combined datasts create a more robust argument, and, especially where they are mutually corroborative, we can have reasonable expectations of reliability for the findings. They also complement one another to provide a more holistic and nuanced characterization of the situation. Qualitative findings for example help us to bridge the lack of correlation between potential seasonal hazard and actual health outcome patterns.

49
11.3 Concluding note The principal role of this exploratory project was to pilot a multi-disciplinary approach to work on seasonal health risks tailored to the research challenges and the public health priorities of lower-income countries. The research has successfully generated an integrated dataset combining information from environmental monitoring, health data and analysis of health behaviour in order to develop a multi-layered understanding of risk. The researchers recognise that this is an initial study with limited scope that will affect the robustness of conclusions. However, practitioners serving poor communities in countries such as Vietnam have to make ‘hard’ health promotion choices based on available evidence (Curtis et al, 2000), and relatively low-cost studies such as this can play an important role in guiding decisions. In a broader sense, the opportunity to test the methodology has yielded valuable lessons that will help refine the approach for application in other locations and contexts where research on seasonal environmental changes and associated disease risks has important consequences for current and future public health (Altizier et al., 2003).

50
References Altizier S, Dobson A, Hosseini P, Hudson P, Pascual M, Rohani P (2006): Seasonality and the
dynamics of infectious diseases. Ecology Letters, 9:467-484. Clasen T, Do Hang Thao, Boisson S, Shipin O (2008): Microbiological effectiveness and cost
of boiling to disinfect drinking water in rural Vietnam. Environmental Science & Technology, 42:4255-4260.
Curtis V, Cairncross S, Yonli R (2000) Domestic hygiene and diarrhea - pinpointing the
problem. Tropical Medicine & International Health, 5: 22-32. Dalgard F, Svensson Å, Holm JØ, Sundby J. (2003) Self-reported skin complaints: validation
of a questionnaire for population surveys. British Journal of Dermatology; 149: 794–800. Emch, M (1999): Diarrheal disaese risk in Matlab, Bangladesh. Social Science & Medicine,
49: 519-530. Few, R. (2007) ‘Health and climatic hazards: framing social research on vulnerability,
response and adaptation’, Global Environmental Change 17, 281-295. Gundry, S, Wright, J, Conroy, R (2004). A systematic review of the health outcomes related to
household water quality in developing countries. Journal of Water and Health, 2 (1): 1-13. Hunter PR, Ramírez Toro GI, Minnigh HA (Submitted). Impact on diarrhoeal illness of a
community educational intervention to improve drinking water quality in rural communities in Puerto Rico.
Hashizume M, Wagatsuma Y, Faruque ASG, Hayashi T, Hunter PR, Armstrong B, Sack DA
(2008): Factors determining vulnerability to diarrhoea during and after severe floods in Bangladesh. Journal of Water and Health, 6:323-332.
Parry ML, Canziani OF, Palutikof JP, van der Linden PJ, Hanson CE (Eds) (2007): Climate
Change 2007: Impacts, Adaptation and Vulnerability. Contribution of Working Group II to the Fourth Assessment Report of the Intergovernmental Panel on Climate Change. Cambridge: Cambridge University Press.
Pascual M, Dobson A (2005): Seasonal patterns of infectious diseases. PLoS Medicine, 2:18-
20. Pham Gia Tran, Few R (2006): Local responses to floods in the Mekong Delta, Viet Nam. In
Flood hazards and health: responding to present and future risks. Edited by Few R, Matthies F. London: Earthscan,128-144.

51
Appendix: health survey questionnaire (4-phase) Form ID:…………. [house/survey number]
QUESTIONNAIRE SELF-REPORTED HEALTH AND RISK FACTORS SURVEY
Name of interviewer: ……………………………………………………..…………………………………………… Date of interview: …………………………………………………………………………………………………… Address (or house identifier): ……………………………………………………………………………………………………… Ethnic: 1- Kinh 2- Khmer 3- Others (Clarify): ……………… Information on interviewee 1. Age: ………………………… 2. Sex: 1- Male 2- Female Information on household 3. How many people live within the house? ……………………….. 4. Level of education of main income earner:
1. Illiterate 1 2. Primary school 2 3. Junior high school 3 4. Senior high school 4 5. College/University 5
5. Occupation of main income earner of household: ………………………………………… 6. Residential registration status:
1. Permanent 1 2. Temporary 2 3. No registration 3
6a. Number of year living in locality: ……………………… year 7. Housing type (look rather than ask):
1. Solid house 1 2. House with wood wall 2 3. Semi-solid house 3 4. House with cement wall 4 5. House with temporary material 5 6. Others 6 (Clarify):.......................................................
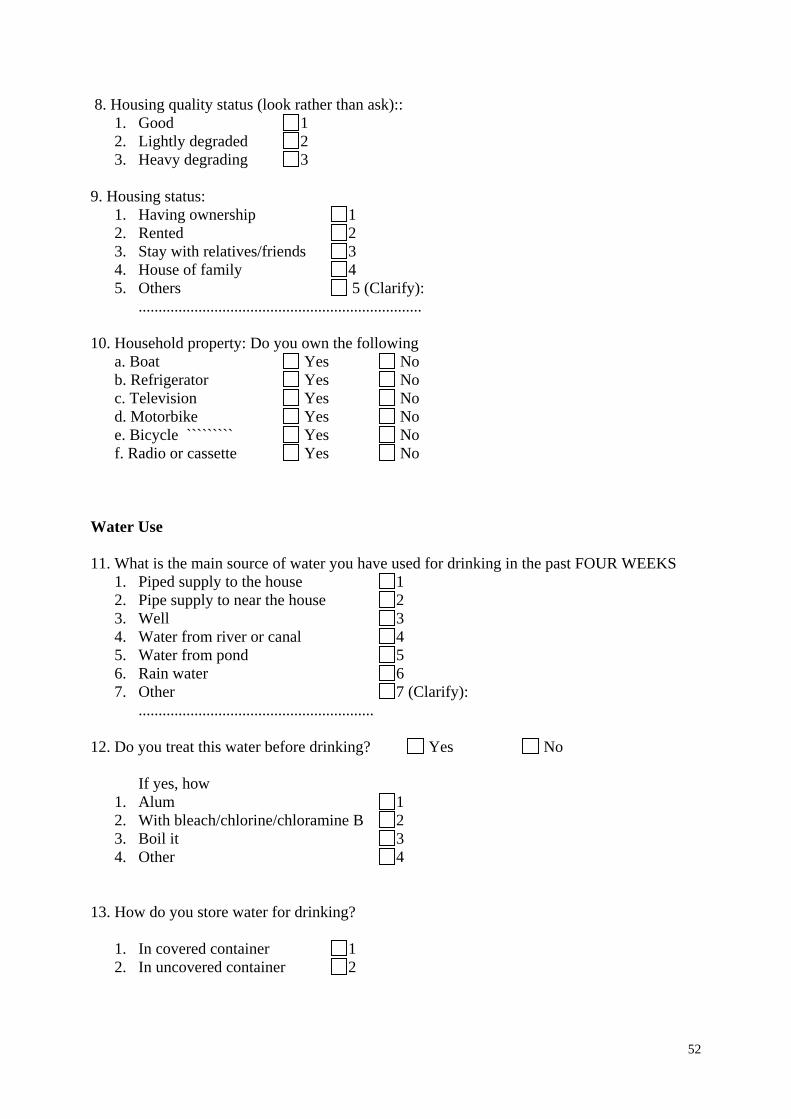
52
8. Housing quality status (look rather than ask):: 1. Good 1 2. Lightly degraded 2 3. Heavy degrading 3
9. Housing status:
1. Having ownership 1 2. Rented 2 3. Stay with relatives/friends 3 4. House of family 4 5. Others 5 (Clarify):
....................................................................... 10. Household property: Do you own the following
a. Boat Yes No b. Refrigerator Yes No c. Television Yes No d. Motorbike Yes No e. Bicycle ````````` Yes No f. Radio or cassette Yes No
Water Use 11. What is the main source of water you have used for drinking in the past FOUR WEEKS
1. Piped supply to the house 1 2. Pipe supply to near the house 2 3. Well 3 4. Water from river or canal 4 5. Water from pond 5 6. Rain water 6 7. Other 7 (Clarify):
........................................................... 12. Do you treat this water before drinking? Yes No If yes, how
1. Alum 1 2. With bleach/chlorine/chloramine B 2 3. Boil it 3 4. Other 4
13. How do you store water for drinking?
1. In covered container 1 2. In uncovered container 2

53
14. Do you have a problem with your drinking water Yes No
If yes is this 1. Odour/smell 1 2. Taste 2 3. Clarity 3 4. Colour 4 5. Other, 5 please specify _______________
15. What is the main source of water have you used for washing (self/clothes/dishes) in the past FOUR WEEKS
1. Piped supply to the house 1 2. Pipe supply to near the house 2 3. Well 3 4. Water from river or canal 4 5. Water from pond 5 6. Rain water 6
16. How have you treated this water before washing?
1. Not treated it/ used it as is 1 2. Alum 2 3. With bleach/chlorine 3 4. Boiled it 4 5. Other
17. If you have a baby under six months old what water do you use to wash him/her
1. Same water as we all use for washing 1 2. Same water but with boiling or other treatment 2 3. Drinking water 3 4. Wash in river or canal 4
18. What water do you use for washing fruit and vegetables that will not be cooked?
1. Drinking water 1 2. the same water as for other for washing 2
Sanitation 19. Does your household have access to
1. Your own toilet 1 2. shared toilet with neighbours 2 3. public toilet 3 4. None, we use the canal/surrounding area 4

54
20. If you have a toilet, what type is it? 1. Flush toilet to sewer 1 2. Flush toilet to septic tank 2 3. Pit latrine 3 4. Toilet on canal or pond 4 5. Other
21. If you have a septic tank how often do you have it emptied
1. Never 1 2. Once a year or less 2 3. More than once a year 3
22. Do you have problems with your septic tank
Yes No If yes, what problems
1. Leaks 1 2. Bad smells 2 3. Other, 3 please state ________________
Food and general hygiene Please be honest with your answers to these questions – say what you actually do or do not do. 23. How often do you wash hands after using the toilet?
1. Always 1 2. Usually 2 3. Sometimes 3 4. Never 4
24. How often do you wash hands before eating?
1. Always 1 2. Usually 2 3. Sometimes 3 4. Never 4
25. How often do your wife (you) wash hands before preparing food?
1. Always 1 2. Usually 2 3. Sometimes 3 4. Never 4
26. How do you usually dry your hands?
1. Leave them to dry 1 2. Wipe on clothes 2 3. Dry on towel 3
27. Do you use soap for washing hands?
Yes No

55
28. Do you use detergent or soap to wash dishes? Yes No 29. How do you dry dishes after washing them?
1. Leave to dry in the air 1 2. Dry with cloth or towel 2
30. What water do you use for washing dishes?
1. Drinking water 1 2. Treated water 2 3. River/canal water 3 4. Other 4 ……………………………………………………………..
31. Do you cover food to prevent flies?
1- Always 1 2- Usually 2 3- Sometimes 3 4- Never 4
32. When you have cooked some food, what do you usually do with uneaten food after the meal?
1- Eat later cold 1 2- Cook again before eating later 2 3- Give food to animal/ throw away 3
33. Do you own any of the following animals
Dogs Yes No Cats Yes No Pig Yes No Chicken Yes No Duck Yes No Buffalo/cow Yes No
34. Do you keep livestock in a cage (chicken, ducks) or enclosure (cows, pigs) outside of the house?
Yes No

56
36. For each person living in the household please answer the following How often did they go swimming
in the canal or river How often do they drink directly from the river or canal
Age Sex Occupation
Nev
er
1
Occ
asio
nall
y 2 M
ost w
eeks
3 M
ost d
ays
4 E
very
day
5 Do
not k
now
9 R
arel
y/
Nev
er1
Occ
asio
nall
y 2 O
ften
3
Do
not
know
9
1 2 3 4 5 6 7 8 9 10 Health of household 37. Please indicate whether people in the household have developed in the past FOUR WEEKS any of the following symptoms? Use the same numbers as above to indicate which person and put cross in each box that applies 1 2 3 4 5 6 7 8 9 10Fever Sore/red eye Sore throat Cold Cough Shortness of breath Chest pain Abdominal pain Vomiting Diarrhoea Passing watery stool Passing blood in stool Need to pass stool more frequently Pain on passing urine Passing blood in urine Need to pass urine more frequently Pain or stiffness in joints/muscles Gynaecological problems

57
38. Do any of the members of the household suffer from a long term illness (such as diabetes, heart disease or cancer)? Person number (from above) ………………… Condition/s ………………………………………………………………………………… Person number (from above) ………………… Condition/s ………………………………………………………………………………… Person number (from above) ………………… Condition/s ………………………………………………………………………………… Person number (from above) ………………… Condition/s ………………………………………………………………………………… 39. Has any person developed diarrhoea and or vomiting, passed watery stool, or blood in stool or had to pass stool more frequently than usual in the past 4 weeks?
Yes No Please complete diarrhoea Positive Case sheet for each person 40. Has any person reported skin symptoms in past 4 weeks?
Yes No Please complete skin Positive Case sheet for each person

58
SUPPLEMENTARY QUESTIONNAIRE DIARRHOEA POSITIVE CASE SHEET
If the person who was ill is another adult and is available please ask these questions directly from that person. If that person is not available, or if the ill person is a child, please continue to ask the original interviewee or the child’s mother. Form ID: …………………………………………… Person number within family (from main questionnaire) ……………………………. Please complete the following D1. Age …………. D2. Sex Male 1 Female 2 D3. Did the person have more than one episode of diarrhoea or passage of loose/watery stools in the past FOUR WEEKS?
Yes No (PLEASE NOTE if the person had more than one incident, i.e., incidents separated by at least a week) If yes: how many episodes of diarrhoea (separated by at least one week) did the person suffer from? ………… D4. For the following please give details for the most recent episode only: Which of the following symptoms did the person suffer from Diarrhoea Yes No Do not know Abdominal pain / cramps Yes No Do not know Vomiting Yes No Do not know Fever Yes No Do not know Blood in stool Yes No Do not know D5. What date did the illness start? …………………………………….. D6. Does the person still have diarrhoea? Yes No D7. How long did the illness last (days) ………………………………………….. D8. At worst, how many times in a day did the person need to go to the toilet? …………….. D9. Did the person need to see a doctor? Yes No D10. Did the person need to go to the health station/health centre? Yes No D11. Did the person need to be admitted to hospital? Yes No

59
D12. Did person need to see any other healer? Yes No D13. Did the person miss school or work? Yes No D14. Did the person take any medication or treat themselves Yes No Is so what medication did they take? ……………………………………. D15. What do you think was the cause of this illness ? ……………………………………………………………………………………………. D16. Why do you think the cause (answer to D15) was to blame? ……………………………………………………………………………………………..

60
SUPPLEMENTARY QUESTIONNAIRE SKIN DISEASE POSITIVE CASE SHEET
If the person who was ill is another adult and is available please ask these questions directly from that person. If that person is not available, or if the ill person is a child, please continue to ask the original interviewee or the child’s mother. Form ID: …………………………………………… Person number within family (from main questionnaire) ……………………………. S1. In the last month have you had any of the following complaints? No Yes a little Yes quite a
lot Yes very much
Itchy skin Dry/sore rash Scaly skin Itchy rash on your hands Pimples Other rashes on your face Warts Troublesome sweating Sores Loss of hair Other skin problems* * if other skin problem, please state ………………………………………………. S2. When did these symptoms start? ……………………………….. S3. What do you think was the cause of this illness? ……………………………………………………………………………………………. S4. Why do you think the cause (answer to S3) was to blame? ……………………………………………………………………