royal dutch shell plc · pdf fileroyal dutch shell plc 4th quarter and full year 2017...
TRANSCRIPT
ROYAL DUTCH SHELL PLC 4TH QUARTER AND FULL YEAR 2017 UNAUDITED RESULTS
SUMMARY OF UNAUDITED RESULTS
Quarters $ million Full year
Q4 2017 Q3 2017 Q4 2016 %1 Definition 2017 2016 %
3,807 4,087 1,541 +147 Income/(loss) attributable to shareholders 12,977 4,575 +184
3,082 3,698 1,032 +199 CCS earnings attributable to shareholders Note 2 12,081 3,533 +242
(1,221) (405) (763) Of which: Identified items2 A (3,683) (3,652)
4,303 4,103 1,795 +140 CCS earnings attributable to shareholders excluding identified items
15,764 7,185 +119
94 105 40 Add: CCS earnings attributable to non-controlling interest
418 270
4,397 4,208 1,835 +140 CCS earnings excluding identified items 16,182 7,455 +117
Of which:
1,636 1,282 907 Integrated Gas 5,268 3,700
1,650 562 54 Upstream 3,091 (2,704)
1,396 2,668 1,339 Downstream 9,082 7,243
(285) (304) (465) Corporate (1,259) (784)
7,275 7,582 9,170 -21 Cash flow from operating activities 35,650 20,615 +73
(665) (3,912) (3,429) Cash flow from investing activities (8,029) (30,963)
6,610 3,670 5,741 Free cash flow H 27,621 (10,348)
0.46 0.50 0.19 +142 Basic earnings per share ($) 1.58 0.58 +172
0.37 0.45 0.13 +185 Basic CCS earnings per share ($) B 1.47 0.45 +227
0.52 0.50 0.22 +136 Basic CCS earnings per share excl. identified items ($)
1.92 0.92 +109
0.47 0.47 0.47 - Dividend per share ($) 1.88 1.88 - 1. Q4 on Q4 change 2. Fourth quarter 2017 includes a non-cash charge of $2,014 million related to the impact of the US tax reform legislation.
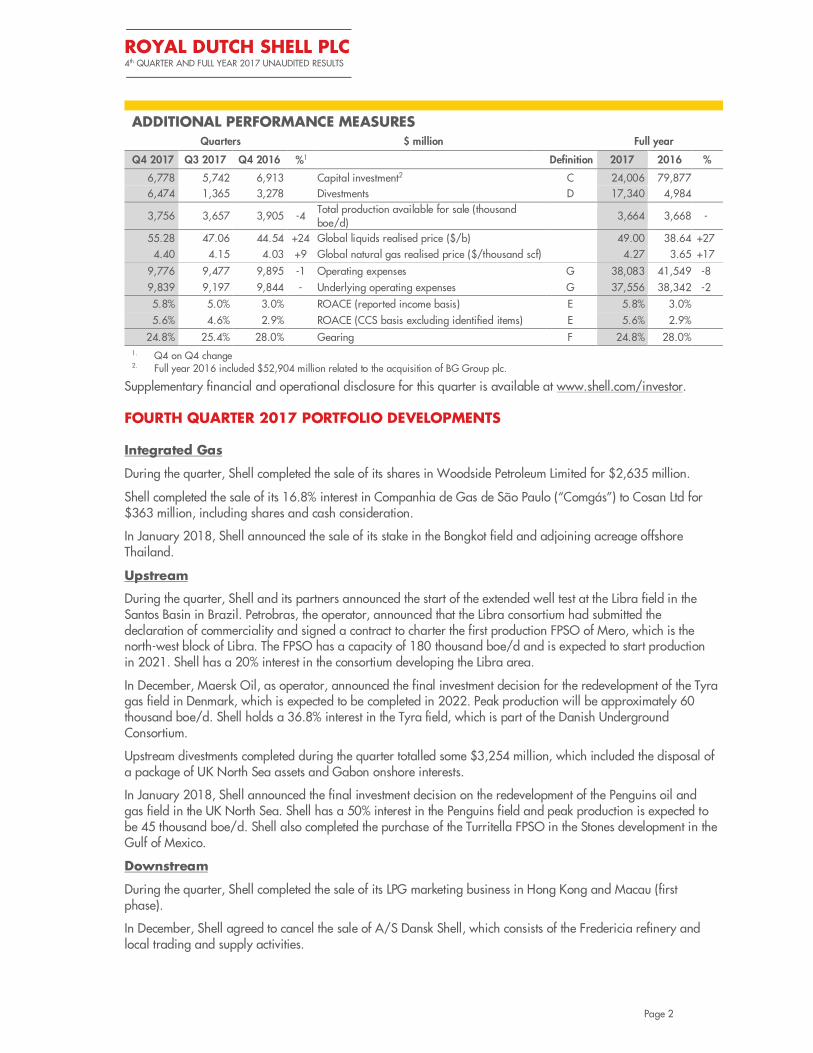
CCS earnings attributable to shareholders excluding identified items were $4.3 billion for the fourth quarter 2017 and $15.8 billion for the full year 2017, reflecting increased contributions from all businesses, compared with 2016. Full year earnings benefited mainly from higher realised oil, gas and LNG prices, improved refining performance and higher production from new fields, which offset the impact of field declines and divestments.
Cash flow from operating activities for the fourth quarter 2017 of $7.3 billion included negative working capital movements of $1.1 billion. Excluding working capital effects, cash flow from operations was $8.4 billion. Full year 2017 cash flow from operating activities of $35.7 billion included negative working capital movements of $3.2 billion.
Total dividends distributed to shareholders in the quarter were $3.9 billion, of which $1.6 billion were settled by issuing 52.7 million A shares under the Scrip Dividend Programme. In November, Shell announced the cancellation of the Scrip Dividend Programme from the fourth quarter 2017. Shell expects to announce a dividend of $0.47 per ordinary share and $0.94 per American Depositary Share for the first quarter 2018.
Royal Dutch Shell Chief Executive Officer Ben van Beurden commented:
“2017 was a year of strong financial performance for Shell. A year of transformation, in which we showed we have what it takes to deliver a world-class investment case. Our relentless focus on value, performance and competitiveness meant we were able to deliver $39 billion of cash flow from operations excluding working capital movements from our upgraded portfolio. We strengthened our financial framework during the year through an $8 billion reduction in our net debt, while our increased free cash flow generation gave us the confidence to cancel the scrip dividend programme in the fourth quarter, in line with what we said previously.
We reported strong earnings for the quarter underpinned by continued delivery momentum. Cash flow reflected higher tax payments and increased cash requirements in relation to our trading business. We enter 2018 with continued discipline and confidence, committed to the delivery of strong returns and cash.”
ROYAL DUTCH SHELL PLC 4th QUARTER AND FULL YEAR 2017 UNAUDITED RESULTS
Page 2
ADDITIONAL PERFORMANCE MEASURES
Quarters $ million Full year
Q4 2017 Q3 2017 Q4 2016 %1 Definition 2017 2016 %
6,778 5,742 6,913 Capital investment2 C 24,006 79,877
6,474 1,365 3,278 Divestments D 17,340 4,984
3,756 3,657 3,905 -4 Total production available for sale (thousand boe/d)
3,664 3,668 -
55.28 47.06 44.54 +24 Global liquids realised price ($/b) 49.00 38.64 +27
4.40 4.15 4.03 +9 Global natural gas realised price ($/thousand scf) 4.27 3.65 +17
9,776 9,477 9,895 -1 Operating expenses G 38,083 41,549 -8
9,839 9,197 9,844 - Underlying operating expenses G 37,556 38,342 -2
5.8% 5.0% 3.0% ROACE (reported income basis) E 5.8% 3.0%
5.6% 4.6% 2.9% ROACE (CCS basis excluding identified items) E 5.6% 2.9%
24.8% 25.4% 28.0% Gearing F 24.8% 28.0% 1. Q4 on Q4 change 2. Full year 2016 included $52,904 million related to the acquisition of BG Group plc.
Supplementary financial and operational disclosure for this quarter is available at www.shell.com/investor.
FOURTH QUARTER 2017 PORTFOLIO DEVELOPMENTS
Integrated Gas
During the quarter, Shell completed the sale of its shares in Woodside Petroleum Limited for $2,635 million.
Shell completed the sale of its 16.8% interest in Companhia de Gas de São Paulo (“Comgás”) to Cosan Ltd for $363 million, including shares and cash consideration.
In January 2018, Shell announced the sale of its stake in the Bongkot field and adjoining acreage offshore Thailand.
Upstream
During the quarter, Shell and its partners announced the start of the extended well test at the Libra field in the Santos Basin in Brazil. Petrobras, the operator, announced that the Libra consortium had submitted the declaration of commerciality and signed a contract to charter the first production FPSO of Mero, which is the north-west block of Libra. The FPSO has a capacity of 180 thousand boe/d and is expected to start production in 2021. Shell has a 20% interest in the consortium developing the Libra area.
In December, Maersk Oil, as operator, announced the final investment decision for the redevelopment of the Tyra gas field in Denmark, which is expected to be completed in 2022. Peak production will be approximately 60 thousand boe/d. Shell holds a 36.8% interest in the Tyra field, which is part of the Danish Underground Consortium.
Upstream divestments completed during the quarter totalled some $3,254 million, which included the disposal of a package of UK North Sea assets and Gabon onshore interests.
In January 2018, Shell announced the final investment decision on the redevelopment of the Penguins oil and gas field in the UK North Sea. Shell has a 50% interest in the Penguins field and peak production is expected to be 45 thousand boe/d. Shell also completed the purchase of the Turritella FPSO in the Stones development in the Gulf of Mexico.
Downstream
During the quarter, Shell completed the sale of its LPG marketing business in Hong Kong and Macau (first phase).
In December, Shell agreed to cancel the sale of A/S Dansk Shell, which consists of the Fredericia refinery and local trading and supply activities.
ROYAL DUTCH SHELL PLC 4th QUARTER AND FULL YEAR 2017 UNAUDITED RESULTS
Page 3
PERFORMANCE BY SEGMENT
INTEGRATED GAS
Quarters $ million Full year
Q4 2017 Q3 2017 Q4 2016 %1 2017 2016 %
848 1,217 28 +2,929 Segment earnings 5,078 2,529 +101
(788) (65) (879) Of which: Identified items (Definition A) (190) (1,171)
1,636 1,282 907 +80 Earnings excluding identified items 5,268 3,700 +42
823 1,742 2,419 -66 Cash flow from operating activities 6,467 9,132 -29
1,043 1,148 1,145 -9 Capital investment (Definition C)2 3,827 26,214 -85
229 226 222 +3 Liquids production available for sale (thousand b/d) 203 223 -9
4,364 4,496 3,979 +10 Natural gas production available for sale (million scf/d) 3,969 3,832 +4
981 1,001 908 +8 Total production available for sale (thousand boe/d) 887 884 -
8.52 8.45 8.57 -1 LNG liquefaction volumes (million tonnes) 33.24 30.88 +8
17.15 16.97 15.34 +12 LNG sales volumes (million tonnes) 66.04 57.11 +16 1. Q4 on Q4 change 2. Full year 2016 included $21,773 million related to the acquisition of BG Group plc.
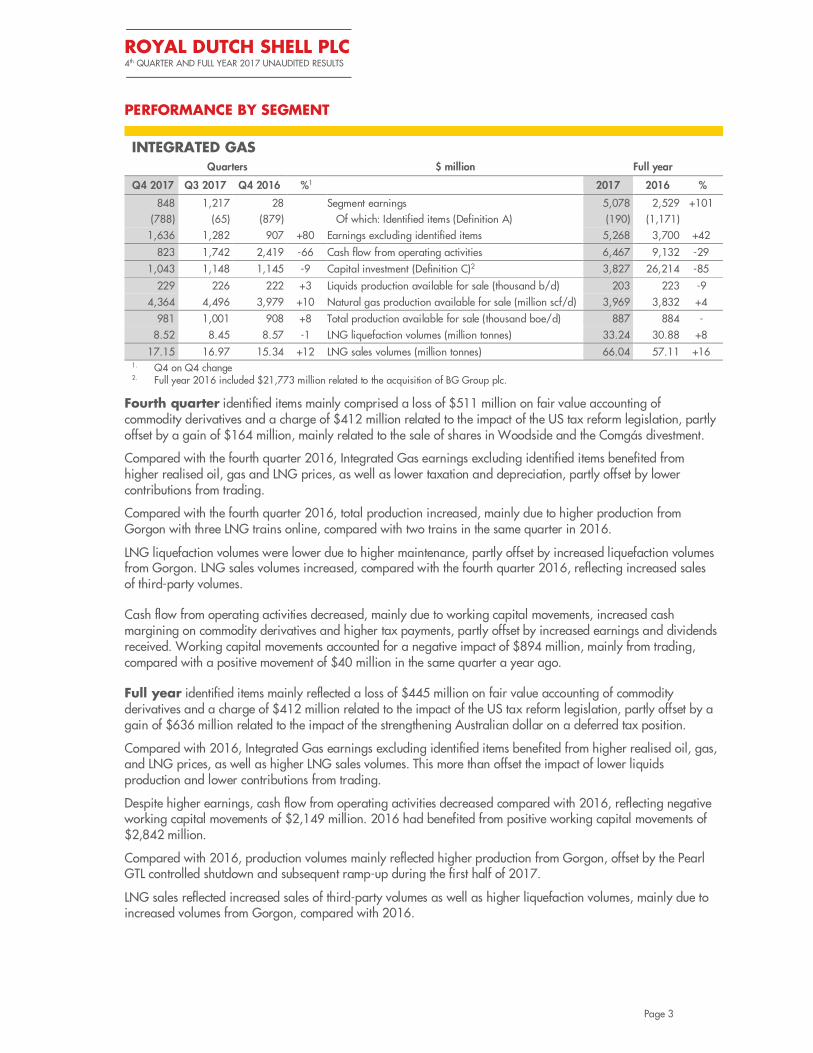
Fourth quarter identified items mainly comprised a loss of $511 million on fair value accounting of commodity derivatives and a charge of $412 million related to the impact of the US tax reform legislation, partly offset by a gain of $164 million, mainly related to the sale of shares in Woodside and the Comgás divestment.
Compared with the fourth quarter 2016, Integrated Gas earnings excluding identified items benefited from higher realised oil, gas and LNG prices, as well as lower taxation and depreciation, partly offset by lower contributions from trading.
Compared with the fourth quarter 2016, total production increased, mainly due to higher production from Gorgon with three LNG trains online, compared with two trains in the same quarter in 2016.
LNG liquefaction volumes were lower due to higher maintenance, partly offset by increased liquefaction volumes from Gorgon. LNG sales volumes increased, compared with the fourth quarter 2016, reflecting increased sales of third-party volumes.
Cash flow from operating activities decreased, mainly due to working capital movements, increased cash margining on commodity derivatives and higher tax payments, partly offset by increased earnings and dividends received. Working capital movements accounted for a negative impact of $894 million, mainly from trading, compared with a positive movement of $40 million in the same quarter a year ago.
Full year identified items mainly reflected a loss of $445 million on fair value accounting of commodity derivatives and a charge of $412 million related to the impact of the US tax reform legislation, partly offset by a gain of $636 million related to the impact of the strengthening Australian dollar on a deferred tax position.
Compared with 2016, Integrated Gas earnings excluding identified items benefited from higher realised oil, gas, and LNG prices, as well as higher LNG sales volumes. This more than offset the impact of lower liquids production and lower contributions from trading.
Despite higher earnings, cash flow from operating activities decreased compared with 2016, reflecting negative working capital movements of $2,149 million. 2016 had benefited from positive working capital movements of $2,842 million.
Compared with 2016, production volumes mainly reflected higher production from Gorgon, offset by the Pearl GTL controlled shutdown and subsequent ramp-up during the first half of 2017.
LNG sales reflected increased sales of third-party volumes as well as higher liquefaction volumes, mainly due to increased volumes from Gorgon, compared with 2016.
ROYAL DUTCH SHELL PLC 4th QUARTER AND FULL YEAR 2017 UNAUDITED RESULTS
Page 4
UPSTREAM
Quarters $ million Full year
Q4 2017 Q3 2017 Q4 2016 %1 2017 2016 %
2,050 575 35 +5,757 Segment earnings 1,551 (3,674) +142
400 13 (19) Of which: Identified items (Definition A) (1,540) (970)
1,650 562 54 Earnings excluding identified items 3,091 (2,704) +214
3,765 4,222 3,904 -4 Cash flow from operating activities 16,337 7,662 +113
3,485 2,805 3,490 - Capital investment (Definition C)2 13,648 47,507 -71
1,542 1,626 1,732 -11 Liquids production available for sale (thousand b/d) 1,622 1,615 -
7,154 5,974 7,336 -2 Natural gas production available for sale (million scf/d) 6,699 6,781 -1
2,775 2,656 2,997 -7 Total production available for sale (thousand boe/d) 2,777 2,784 - 1. Q4 on Q4 change 2. Full year 2016 included $31,131 million related to the acquisition of BG Group plc.
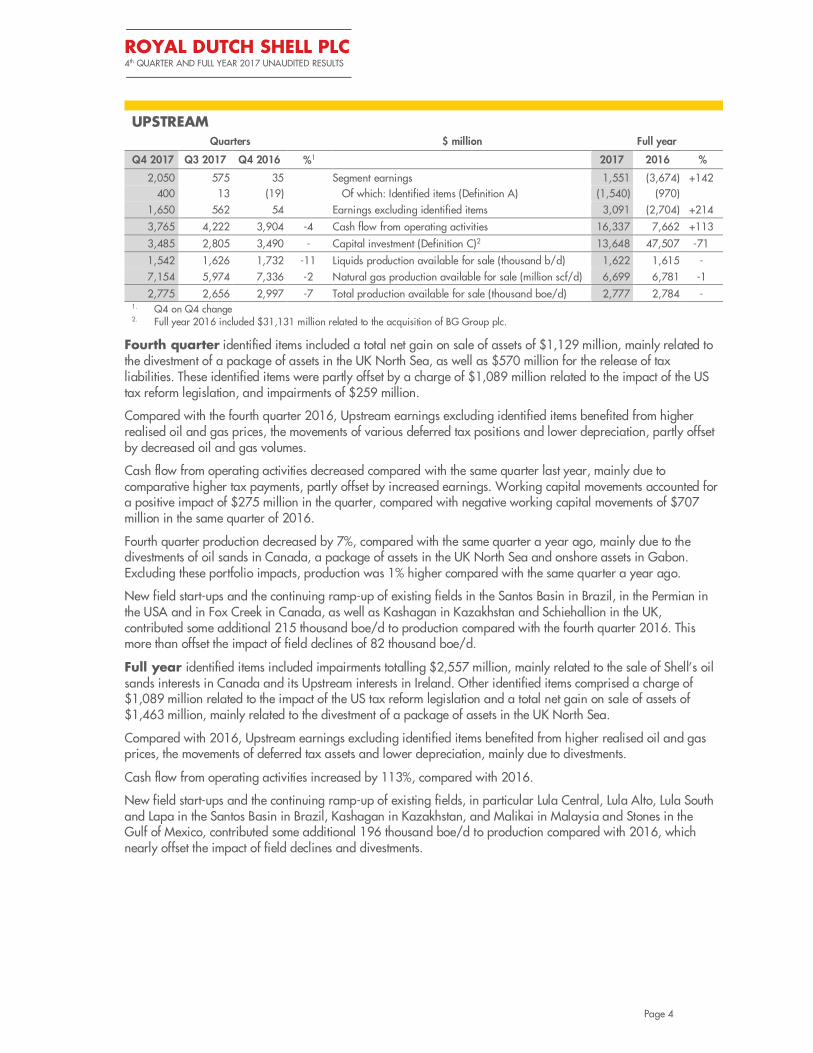
Fourth quarter identified items included a total net gain on sale of assets of $1,129 million, mainly related to the divestment of a package of assets in the UK North Sea, as well as $570 million for the release of tax liabilities. These identified items were partly offset by a charge of $1,089 million related to the impact of the US tax reform legislation, and impairments of $259 million.
Compared with the fourth quarter 2016, Upstream earnings excluding identified items benefited from higher realised oil and gas prices, the movements of various deferred tax positions and lower depreciation, partly offset by decreased oil and gas volumes.
Cash flow from operating activities decreased compared with the same quarter last year, mainly due to comparative higher tax payments, partly offset by increased earnings. Working capital movements accounted for a positive impact of $275 million in the quarter, compared with negative working capital movements of $707 million in the same quarter of 2016.
Fourth quarter production decreased by 7%, compared with the same quarter a year ago, mainly due to the divestments of oil sands in Canada, a package of assets in the UK North Sea and onshore assets in Gabon. Excluding these portfolio impacts, production was 1% higher compared with the same quarter a year ago.
New field start-ups and the continuing ramp-up of existing fields in the Santos Basin in Brazil, in the Permian in the USA and in Fox Creek in Canada, as well as Kashagan in Kazakhstan and Schiehallion in the UK, contributed some additional 215 thousand boe/d to production compared with the fourth quarter 2016. This more than offset the impact of field declines of 82 thousand boe/d.
Full year identified items included impairments totalling $2,557 million, mainly related to the sale of Shell’s oil sands interests in Canada and its Upstream interests in Ireland. Other identified items comprised a charge of $1,089 million related to the impact of the US tax reform legislation and a total net gain on sale of assets of $1,463 million, mainly related to the divestment of a package of assets in the UK North Sea.
Compared with 2016, Upstream earnings excluding identified items benefited from higher realised oil and gas prices, the movements of deferred tax assets and lower depreciation, mainly due to divestments.
Cash flow from operating activities increased by 113%, compared with 2016.
New field start-ups and the continuing ramp-up of existing fields, in particular Lula Central, Lula Alto, Lula South and Lapa in the Santos Basin in Brazil, Kashagan in Kazakhstan, and Malikai in Malaysia and Stones in the Gulf of Mexico, contributed some additional 196 thousand boe/d to production compared with 2016, which nearly offset the impact of field declines and divestments.

ROYAL DUTCH SHELL PLC 4th QUARTER AND FULL YEAR 2017 UNAUDITED RESULTS
Page 5
DOWNSTREAM
Quarters $ million Full year
Q4 2017 Q3 2017 Q4 2016 %1 2017 2016 %
1,116 2,405 1,575 -29 Segment earnings2 8,258 6,588 +25
(280) (263) 236 Of which: Identified items (Definition A) (824) (655)
1,396 2,668 1,339 +4 Earnings excluding identified items2 9,082 7,243 +25
Of which:
884 2,018 823 +7 Oil Products 6,460 5,560 +16
96 891 77 +25 Refining & Trading 2,462 1,469 +68
788 1,127 746 +6 Marketing 3,998 4,091 -2
512 650 516 -1 Chemicals 2,622 1,683 +56
2,649 949 2,286 +16 Cash flow from operating activities 12,429 3,556 +250
2,208 1,743 2,251 -2 Capital investment (Definition C) 6,416 6,057 +6
2,589 2,592 2,698 -4 Refinery processing intake (thousand b/d) 2,572 2,701 -5
6,861 6,557 6,464 +6 Oil products sales volumes (thousand b/d) 6,599 6,483 +2
4,688 4,540 4,414 +6 Chemicals sales volumes (thousand tonnes) 18,239 17,292 +5 1. Q4 on Q4 change 2. Earnings are presented on a CCS basis (See Note 2).
Fourth quarter identified items primarily reflected a charge of $121 million related to the impact of the US tax reform legislation and redundancy and restructuring provisions of $89 million, partly offset by a total net gain on sale of assets of $103 million, mainly related to the divestment of Shell’s LPG marketing business in Hong Kong and Macau.
Compared with the fourth quarter 2016, Downstream earnings excluding identified items benefited from improved refining industry conditions as well as increased contributions from marketing. This was partly offset by higher operating expenses, as a result of exchange rate effects.
Cash flow from operating activities included negative working capital movements of $402 million, compared with negative movements of $216 million in the same quarter of 2016.
Oil Products
� Refining & Trading earnings excluding identified items benefited mainly from the impact of the Motiva transaction and exchange rate effects, partly offset by lower contributions from trading, compared with the same quarter a year ago.
Refinery processing intake volumes decreased by 4%, compared with the fourth quarter of 2016, mainly due to the divestment of the Port Dickson refinery in Malaysia. Excluding this impact, intake volumes were 1% higher compared with the same quarter a year ago. Refinery availability increased to 89% compared with 87% in the fourth quarter 2016.
� Marketing earnings excluding identified items reflected lower taxation and increased underlying unit margins, partly offset by adverse exchange rate effects, compared with the same quarter a year ago.
Oil products sales volumes reflected increased refining and trading volumes, partly offset by lower marketing volumes.
Chemicals
� Chemicals earnings excluding identified items reflected higher operating expenses and increased depreciation, partly offset by improved industry conditions.
Chemicals manufacturing plant availability remained 93%, similar to the fourth quarter 2016.
Full year identified items primarily reflected the impact of the Motiva transaction resulting in a net charge of $546 million, which included a non-cash charge on a taxable gain (see Note 7), as well as impairment losses of $315 million, and redundancy and restructuring provisions of $200 million and a charge of $121 million related to the impact of the US tax reform legislation. These identified items were partly offset by a total gain of $585 million, mainly related to the divestment of assets in Saudi Arabia, Africa, Australia, and Hong Kong and Macau.
ROYAL DUTCH SHELL PLC 4th QUARTER AND FULL YEAR 2017 UNAUDITED RESULTS
Page 6
Compared with 2016, Downstream earnings excluding identified items benefited from improved refining and chemicals industry conditions, partly offset by portfolio impacts.
Cash flow from operating activities increased by 250%, reflecting higher earnings and more favourable working capital movements, which comprised a negative impact of $325 million in 2017, compared with negative working capital movements of $6,272 million in 2016.
Oil Products
� Refining & Trading earnings excluding identified items benefited from higher margins as a result of stronger refining industry conditions and portfolio impacts, compared with 2016.
Refinery processing intake volumes decreased by 5% compared with 2016, as a result of the divestment of the Port Dickson refinery in Malaysia and the Motiva transaction. Excluding these portfolio impacts, intake volumes were 3% higher compared with the same period a year ago. Refinery availability increased to 91%, compared with 90% in 2016.
� Marketing earnings excluding identified items decreased compared with a year ago, reflecting lower volumes mainly as a result of portfolio impacts, partly offset by lower taxation.
Oil products sales volumes reflected increased refining and trading volumes, partly offset by lower marketing volumes.
Chemicals
� Chemicals earnings excluding identified items benefited from a better market environment and higher sales volumes.
Chemicals manufacturing plant availability increased to 92% compared with 90% in 2016.

ROYAL DUTCH SHELL PLC 4th QUARTER AND FULL YEAR 2017 UNAUDITED RESULTS
Page 7
CORPORATE
Quarters $ million Full year
Q4 2017 Q3 2017 Q4 2016 2017 2016
(838) (394) (566) Segment earnings (2,416) (1,751)
(553) (90) (101) Of which: Identified items (Definition A) (1,157) (967)
(285) (304) (465) Earnings excluding identified items (1,259) (784)
38 669 561 Cash flow from operating activities 417 265
Fourth quarter identified items mainly reflected a charge of $392 million related to the impact of the US tax reform legislation as well as a tax provision of $282 million.
Compared with the fourth quarter 2016, Corporate earnings excluding identified items reflected increased currency exchange rate gains and lower net interest expense, partly offset by higher taxation.
Full year identified items mainly included a non-cash charge of $550 million related to the restructuring of the funding of our businesses in North America, a charge of $392 million related to the impact of the US tax reform legislation as well as a tax provision of $282 million.
Compared with 2016, Corporate earnings excluding identified items were impacted by higher net interest expense, partly offset by lower operating expenses.
PRELIMINARY RESERVES UPDATE
When final volumes are reported in the 2017 Annual Report and Form 20-F, Shell expects that SEC proved oil and gas reserves additions before taking into account production will be around 0.4 billion boe, and 2017 production to be 1.4 billion boe. As a result, total proved reserves on an SEC basis are expected to be 12.2 billion boe. Acquisitions and divestments of 2017 reserves accounted for a net reduction of 1.4 billion boe.
The proved Reserves Replacement Ratio on an SEC basis is expected to be 27% for the year and 78% for the 3-year average. Excluding the impact of acquisitions and divestments, the reserves replacement ratio was 127% for the year.
Further information will be provided in the 2017 Annual Report and Form 20-F, which is expected to be filed in March 2018.
OUTLOOK FOR THE FIRST QUARTER 2018
Compared with the first quarter 2017, Integrated Gas production volumes are expected to be positively impacted by some 210 thousand boe/d, mainly associated with Pearl, Gorgon and portfolio impacts.
Compared with the first quarter 2017, Upstream earnings are expected to be negatively impacted by a reduction of some 270 thousand boe/d associated with completed divestments, and positively impacted by some 40 thousand boe/d associated with lower maintenance activities. Earnings are expected to be positively impacted by 40 thousand boe/d associated with restored production in Nigeria; however, the security situation remains sensitive. The production outlook for NAM in the Netherlands is subject to decisions on production volumes by the Dutch government following the earthquake in Zeerijp in January 2018.
Refinery availability is expected to decrease in the first quarter 2018 as a result of higher levels of maintenance compared with the same period a year ago.
Chemicals manufacturing plant availability is expected to increase in the first quarter 2018, due to lower levels of maintenance compared with the first quarter 2017.
As a result of the separation of the Motiva assets and completed divestments, oil products sales volumes are expected to decrease by some 175 thousand barrels per day compared with the same period a year ago.

ROYAL DUTCH SHELL PLC 4th QUARTER AND FULL YEAR 2017 UNAUDITED RESULTS
Page 8
Corporate results, excluding the impact of currency exchange rate effects and interest rate movements, are expected to be a net charge of $300 – 350 million in the first quarter and around $1.4 – 1.6 billion for the full year.
As a result of the expected change in the fiscal functional currency of some Shell entities in Australia to US dollars, the impact of exchange rate movements of the Australian dollar on deferred tax balances will be significantly reduced in 2018.
FORTHCOMING EVENTS
The LNG Outlook will be held on February 26, 2018 in London.
The Downstream Open House for Investors will be held on March 21, 2018.
The Annual General Meeting will be held on May 22, 2018.
First quarter 2018 results and dividends are scheduled to be announced on April 26, 2018. Second quarter 2018 results and dividends are scheduled to be announced on July 26, 2018. Third quarter 2018 results and dividends are scheduled to be announced on November 1, 2018.
ROYAL DUTCH SHELL PLC 4th QUARTER AND FULL YEAR 2017 UNAUDITED RESULTS
Page 9
UNAUDITED CONDENSED CONSOLIDATED FINANCIAL STATEMENTS
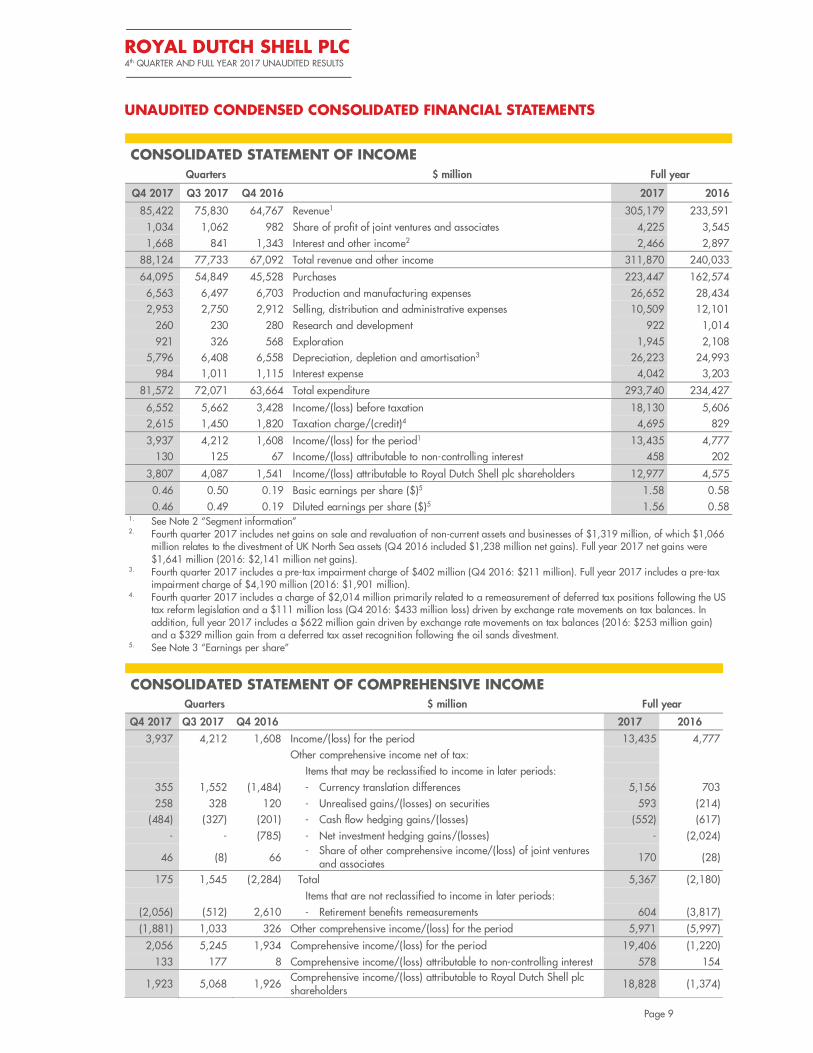
CONSOLIDATED STATEMENT OF INCOME
Quarters $ million Full year
Q4 2017 Q3 2017 Q4 2016 2017 2016
85,422 75,830 64,767 Revenue1 305,179 233,591
1,034 1,062 982 Share of profit of joint ventures and associates 4,225 3,545
1,668 841 1,343 Interest and other income2 2,466 2,897
88,124 77,733 67,092 Total revenue and other income 311,870 240,033
64,095 54,849 45,528 Purchases 223,447 162,574
6,563 6,497 6,703 Production and manufacturing expenses 26,652 28,434
2,953 2,750 2,912 Selling, distribution and administrative expenses 10,509 12,101
260 230 280 Research and development 922 1,014
921 326 568 Exploration 1,945 2,108
5,796 6,408 6,558 Depreciation, depletion and amortisation3 26,223 24,993
984 1,011 1,115 Interest expense 4,042 3,203
81,572 72,071 63,664 Total expenditure 293,740 234,427
6,552 5,662 3,428 Income/(loss) before taxation 18,130 5,606
2,615 1,450 1,820 Taxation charge/(credit)4 4,695 829
3,937 4,212 1,608 Income/(loss) for the period1 13,435 4,777
130 125 67 Income/(loss) attributable to non-controlling interest 458 202
3,807 4,087 1,541 Income/(loss) attributable to Royal Dutch Shell plc shareholders 12,977 4,575
0.46 0.50 0.19 Basic earnings per share ($)5 1.58 0.58
0.46 0.49 0.19 Diluted earnings per share ($)5 1.56 0.58 1. See Note 2 “Segment information” 2. Fourth quarter 2017 includes net gains on sale and revaluation of non-current assets and businesses of $1,319 million, of which $1,066
million relates to the divestment of UK North Sea assets (Q4 2016 included $1,238 million net gains). Full year 2017 net gains were $1,641 million (2016: $2,141 million net gains).
3. Fourth quarter 2017 includes a pre-tax impairment charge of $402 million (Q4 2016: $211 million). Full year 2017 includes a pre-tax impairment charge of $4,190 million (2016: $1,901 million).
4. Fourth quarter 2017 includes a charge of $2,014 million primarily related to a remeasurement of deferred tax positions following the US tax reform legislation and a $111 million loss (Q4 2016: $433 million loss) driven by exchange rate movements on tax balances. In addition, full year 2017 includes a $622 million gain driven by exchange rate movements on tax balances (2016: $253 million gain) and a $329 million gain from a deferred tax asset recognition following the oil sands divestment.
5. See Note 3 “Earnings per share”
CONSOLIDATED STATEMENT OF COMPREHENSIVE INCOME
Quarters $ million Full year
Q4 2017 Q3 2017 Q4 2016 2017 2016
3,937 4,212 1,608 Income/(loss) for the period 13,435 4,777
Other comprehensive income net of tax:
Items that may be reclassified to income in later periods:
355 1,552 (1,484) - Currency translation differences 5,156 703
258 328 120 - Unrealised gains/(losses) on securities 593 (214)
(484) (327) (201) - Cash flow hedging gains/(losses) (552) (617)
- - (785) - Net investment hedging gains/(losses) - (2,024)
46 (8) 66 - Share of other comprehensive income/(loss) of joint ventures
and associates 170 (28)
175 1,545 (2,284) Total 5,367 (2,180)
Items that are not reclassified to income in later periods:
(2,056) (512) 2,610 - Retirement benefits remeasurements 604 (3,817)
(1,881) 1,033 326 Other comprehensive income/(loss) for the period 5,971 (5,997)
2,056 5,245 1,934 Comprehensive income/(loss) for the period 19,406 (1,220)
133 177 8 Comprehensive income/(loss) attributable to non-controlling interest 578 154
1,923 5,068 1,926 Comprehensive income/(loss) attributable to Royal Dutch Shell plc shareholders
18,828 (1,374)

ROYAL DUTCH SHELL PLC 4th QUARTER AND FULL YEAR 2017 UNAUDITED RESULTS
Page 10
CONDENSED CONSOLIDATED BALANCE SHEET
$ million Dec 31, 20171 Dec 31, 2016
Assets
Non-current assets
Intangible assets 24,180 23,967
Property, plant and equipment2 226,380 236,098
Joint ventures and associates 27,927 33,255
Investments in securities3 7,222 5,952
Deferred tax 13,791 14,425
Retirement benefits 2,799 1,456
Trade and other receivables4 9,394 9,553
311,693 324,706
Current assets
Inventories 25,223 21,775
Trade and other receivables4 49,869 45,664
Cash and cash equivalents 20,312 19,130
95,404 86,569
Total assets 407,097 411,275
Liabilities Non-current liabilities
Debt 73,870 82,992
Trade and other payables4 4,428 6,925
Deferred tax 13,007 15,274
Retirement benefits 13,247 14,130
Decommissioning and other provisions5 24,966 29,618
129,518 148,939
Current liabilities
Debt 11,795 9,484
Trade and other payables4 56,663 53,417
Taxes payable 7,250 6,685
Retirement benefits 594 455
Decommissioning and other provisions 3,465 3,784
79,767 73,825
Total liabilities 209,285 222,764
Equity attributable to Royal Dutch Shell plc shareholders 194,356 186,646 Non-controlling interest 3,456 1,865
Total equity 197,812 188,511
Total liabilities and equity 407,097 411,275 1. See Note 7 “Motiva joint venture”. 2. Compared with 2016, the carrying amount of property, plant and equipment at December 31, 2017, includes a decrease of $12,879
million related to the divestment of assets, mainly Canada oil sands, UK North Sea and Gabon onshore. 3. Compared with 2016, investments at December 31, 2017, increased by $3,485 million in relation to shares in Canadian Natural
Resources Limited received in the second quarter 2017 as partial consideration for the oil sands divestment, and decreased in the fourth quarter by $2,653 million in relation to the sale of shares in Woodside Petroleum.
4. See Note 6 “Derivative contracts and debt excluding finance lease liabilities”. 5. Compared with December 31, 2016, a decrease of $2,767 million in provisions is included related to the divestments of assets, mainly
UK North Sea, Canada oil sands, and Gabon onshore.

ROYAL DUTCH SHELL PLC 4th QUARTER AND FULL YEAR 2017 UNAUDITED RESULTS
Page 11
CONSOLIDATED STATEMENT OF CHANGES IN EQUITY
Equity attributable to Royal Dutch Shell plc shareholders
$ million Share
capital1
Shares held in trust
Other reserves2
Retained earnings
Total Non-
controlling interest
Total equity
At January 1, 2017 683 (901) 11,298 175,566 186,646 1,865 188,511
Comprehensive income/(loss) for the period
- - 5,851 12,977 18,828 578 19,406
Dividends paid - - - (15,628) (15,628) (406) (16,034)
Scrip dividends 13 - (13) 4,751 4,751 - 4,751
Share-based compensation - (16) (204) (74) (294) - (294)
Other changes in non-controlling interest3
- - - 53 53 1,419 1,472
At December 31, 2017 696 (917) 16,932 177,645 194,356 3,456 197,812
At January 1, 2016 546 (584) (17,186) 180,100 162,876 1,245 164,121
Comprehensive income/(loss) for the period
- - (5,949) 4,575 (1,374) 154 (1,220)
Dividends paid - - (14,959) (14,959) (180) (15,139)
Scrip dividends 17 - (17) 5,282 5,282 - 5,282
Shares issued 120 - 33,930 - 34,050 - 34,050
Share-based compensation - (317) 520 141 344 - 344
Other changes in non-controlling interest
- - - 427 427 646 1,073
At December 31, 2016 683 (901) 11,298 175,566 186,646 1,865 188,511 1. See Note 4 “Share capital”. 2. See Note 5 “Other reserves”. 3. This includes $1,286 million for the 50% non-controlling interest share in the acquisition of Marathon Oil Canada Corporation in the
second quarter 2017, and $275 million related to the public offering of limited partner units in Shell Midstream Partners, L.P. in the
third quarter 2017.

ROYAL DUTCH SHELL PLC 4th QUARTER AND FULL YEAR 2017 UNAUDITED RESULTS
Page 12
CONDENSED CONSOLIDATED STATEMENT OF CASH FLOWS
Quarters $ million Full year
Q4 2017 Q3 2017 Q4 2016 2017 2016
3,937 4,212 1,608 Income/(loss) for the period 13,435 4,777
Adjustment for:
1,467 1,734 1,241 - Current tax 6,591 2,731
817 839 980 - Interest expense (net) 3,365 2,752
5,795 6,408 6,558 - Depreciation, depletion and amortisation 26,222 24,993
(1,319) (459) (1,238) - Net (gains)/losses on sale and revaluation of non-current assets and
businesses (1,640) (2,141)
(1,121) (2,467) (648) - Decrease/(increase) in working capital (3,158) (6,289)
(1,034) (1,062) (982) - Share of (profit)/loss of joint ventures and associates (4,225) (3,545)
1,647 1,082 1,466 - Dividends received from joint ventures and associates 4,998 3,820
155 (1,158) 1,078 - Deferred tax, retirement benefits, decommissioning and other
provisions (3,918) (823)
(704) (31) (153) - Other1 287 (1,226)
(2,365) (1,516) (740) Tax paid (6,307) (4,434)
7,275 7,582 9,170 Cash flow from operating activities 35,650 20,615
(5,861) (5,018) (5,714) Capital expenditure (20,845) (22,116)
- - - Acquisition of BG Group plc, net of cash and cash equivalents acquired
- (11,421)
(202) (42) (527) Investments in joint ventures and associates (595) (1,330)
2,866 236 1,306 Proceeds from sale of property, plant and equipment and businesses2 8,808 2,072
221 874 1,411 Proceeds from sale of joint ventures and associates 2,177 1,565
157 237 176 Interest received 724 470
2,154 (199) (81) Other3 1,702 (203)
(665) (3,912) (3,429) Cash flow from investing activities (8,029) (30,963)
543 (544) 23 Net increase/(decrease) in debt with maturity period within three months
(869) (360)
Other debt:
120 29 189 - New borrowings 760 18,144
(4,103) (2,702) (3,327) - Repayments (11,720) (6,710)
(840) (858) (1,073) Interest paid (3,550) (2,938)
6 279 291 Change in non-controlling interest 293 1,110
Cash dividends paid to:
(2,266) (3,016) (2,323) - Royal Dutch Shell plc shareholders (10,877) (9,677)
(97) (113) (72) - Non-controlling interest (406) (180)
- - - Repurchases of shares - -
(443) (221) (175) Shares held in trust: net sales/(purchases) and dividends received (717) (160)
(7,080) (7,146) (6,467) Cash flow from financing activities (27,086) (771)
83 183 (128) Currency translation differences relating to cash and cash equivalents
647 (1,503)
(387) (3,293) (854) Increase/(decrease) in cash and cash equivalents 1,182 (12,622)
20,699 23,992 19,984 Cash and cash equivalents at beginning of period 19,130 31,752
20,312 20,699 19,130 Cash and cash equivalents at end of period 20,312 19,130 1. Fourth quarter 2017 includes $726 million of unrealised net gains related to financial instruments. 2. Fourth quarter 2017 includes $2,063 million from the divestment of the package of UK North Sea assets and $600 million from the
divestment of Gabon onshore assets. 3. Fourth quarter 2017 includes $2,635 million from the sale of shares in Woodside Petroleum Limited.
ROYAL DUTCH SHELL PLC 4th QUARTER AND FULL YEAR 2017 UNAUDITED RESULTS
Page 13
NOTES TO THE UNAUDITED CONDENSED CONSOLIDATED FINANCIAL STATEMENTS
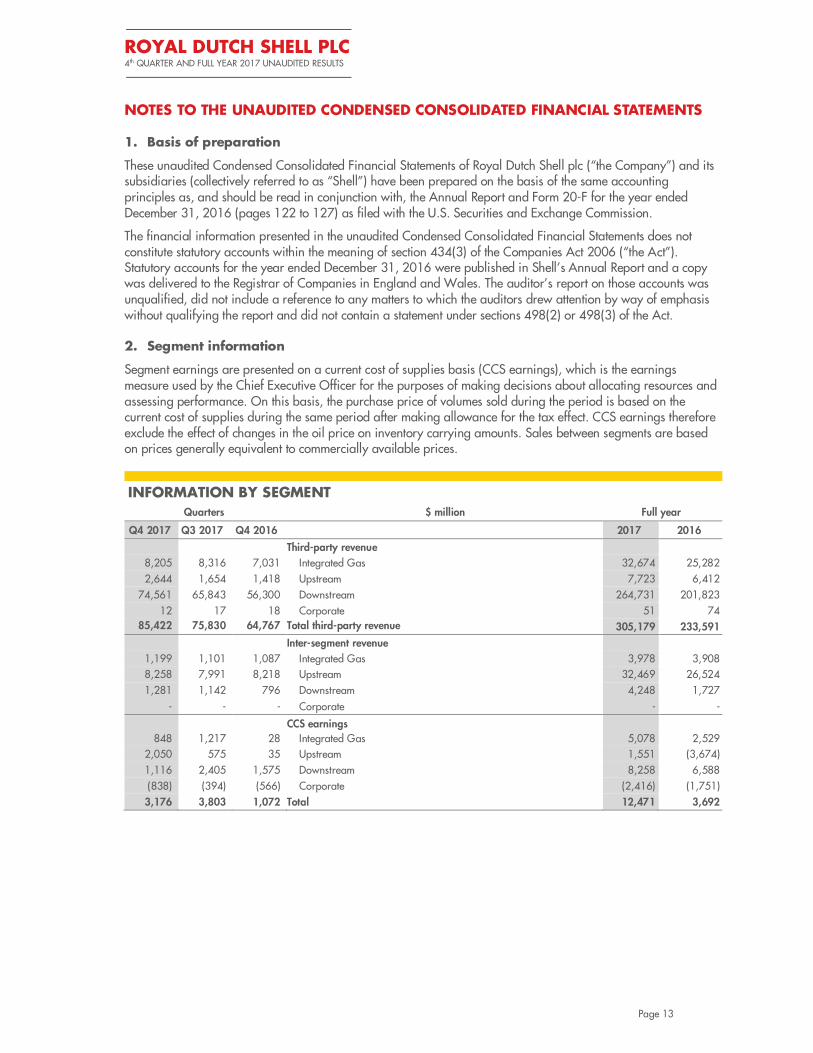
1. Basis of preparation
These unaudited Condensed Consolidated Financial Statements of Royal Dutch Shell plc (“the Company”) and its subsidiaries (collectively referred to as “Shell”) have been prepared on the basis of the same accounting principles as, and should be read in conjunction with, the Annual Report and Form 20-F for the year ended December 31, 2016 (pages 122 to 127) as filed with the U.S. Securities and Exchange Commission.
The financial information presented in the unaudited Condensed Consolidated Financial Statements does not constitute statutory accounts within the meaning of section 434(3) of the Companies Act 2006 (“the Act”). Statutory accounts for the year ended December 31, 2016 were published in Shell’s Annual Report and a copy was delivered to the Registrar of Companies in England and Wales. The auditor’s report on those accounts was unqualified, did not include a reference to any matters to which the auditors drew attention by way of emphasis without qualifying the report and did not contain a statement under sections 498(2) or 498(3) of the Act.
2. Segment information
Segment earnings are presented on a current cost of supplies basis (CCS earnings), which is the earnings measure used by the Chief Executive Officer for the purposes of making decisions about allocating resources and assessing performance. On this basis, the purchase price of volumes sold during the period is based on the current cost of supplies during the same period after making allowance for the tax effect. CCS earnings therefore exclude the effect of changes in the oil price on inventory carrying amounts. Sales between segments are based on prices generally equivalent to commercially available prices.
INFORMATION BY SEGMENT
Quarters $ million Full year
Q4 2017 Q3 2017 Q4 2016 2017 2016
Third-party revenue
8,205 8,316 7,031 Integrated Gas 32,674 25,282
2,644 1,654 1,418 Upstream 7,723 6,412
74,561 65,843 56,300 Downstream 264,731 201,823
12 17 18 Corporate 51 74 85,422 75,830 64,767 Total third-party revenue 305,179 233,591
Inter-segment revenue
1,199 1,101 1,087 Integrated Gas 3,978 3,908
8,258 7,991 8,218 Upstream 32,469 26,524
1,281 1,142 796 Downstream 4,248 1,727
- - - Corporate - -
CCS earnings
848 1,217 28 Integrated Gas 5,078 2,529
2,050 575 35 Upstream 1,551 (3,674)
1,116 2,405 1,575 Downstream 8,258 6,588
(838) (394) (566) Corporate (2,416) (1,751)
3,176 3,803 1,072 Total 12,471 3,692
ROYAL DUTCH SHELL PLC 4th QUARTER AND FULL YEAR 2017 UNAUDITED RESULTS
Page 14
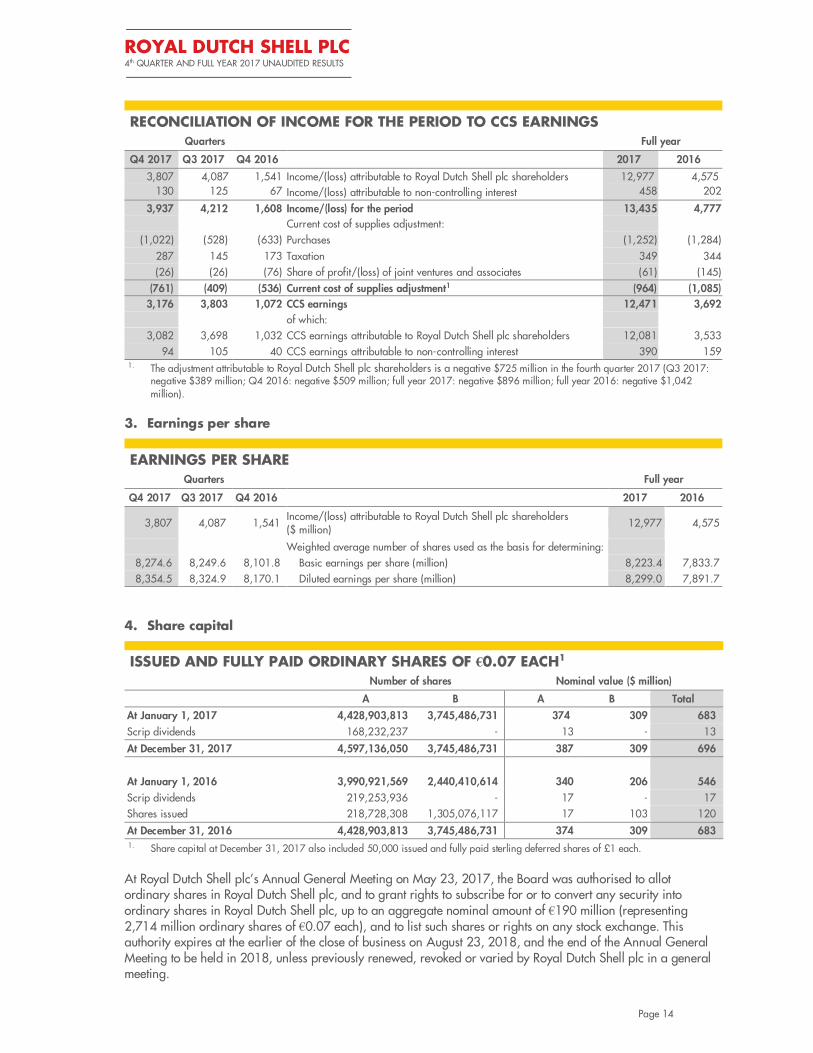
RECONCILIATION OF INCOME FOR THE PERIOD TO CCS EARNINGS
Quarters Full year
Q4 2017 Q3 2017 Q4 2016 2017 2016
3,807 4,087 1,541 Income/(loss) attributable to Royal Dutch Shell plc shareholders 12,977 4,575 130 125 67 Income/(loss) attributable to non-controlling interest 458 202
3,937 4,212 1,608 Income/(loss) for the period 13,435 4,777
Current cost of supplies adjustment:
(1,022) (528) (633) Purchases (1,252) (1,284)
287 145 173 Taxation 349 344
(26) (26) (76) Share of profit/(loss) of joint ventures and associates (61) (145)
(761) (409) (536) Current cost of supplies adjustment1 (964) (1,085)
3,176 3,803 1,072 CCS earnings 12,471 3,692
of which:
3,082 3,698 1,032 CCS earnings attributable to Royal Dutch Shell plc shareholders 12,081 3,533
94 105 40 CCS earnings attributable to non-controlling interest 390 159 1. The adjustment attributable to Royal Dutch Shell plc shareholders is a negative $725 million in the fourth quarter 2017 (Q3 2017:
negative $389 million; Q4 2016: negative $509 million; full year 2017: negative $896 million; full year 2016: negative $1,042 million).
3. Earnings per share
EARNINGS PER SHARE
Quarters Full year
Q4 2017 Q3 2017 Q4 2016 2017 2016
3,807 4,087 1,541 Income/(loss) attributable to Royal Dutch Shell plc shareholders ($ million)
12,977 4,575
Weighted average number of shares used as the basis for determining:
8,274.6 8,249.6 8,101.8 Basic earnings per share (million) 8,223.4 7,833.7
8,354.5 8,324.9 8,170.1 Diluted earnings per share (million) 8,299.0 7,891.7
4. Share capital
ISSUED AND FULLY PAID ORDINARY SHARES OF €0.07 EACH1
Number of shares Nominal value ($ million)
A B A B Total
At January 1, 2017 4,428,903,813 3,745,486,731 374 309 683
Scrip dividends 168,232,237 - 13 - 13
At December 31, 2017 4,597,136,050 3,745,486,731 387 309 696
At January 1, 2016 3,990,921,569 2,440,410,614 340 206 546
Scrip dividends 219,253,936 - 17 - 17
Shares issued 218,728,308 1,305,076,117 17 103 120
At December 31, 2016 4,428,903,813 3,745,486,731 374 309 683 1. Share capital at December 31, 2017 also included 50,000 issued and fully paid sterling deferred shares of £1 each.
At Royal Dutch Shell plc’s Annual General Meeting on May 23, 2017, the Board was authorised to allot ordinary shares in Royal Dutch Shell plc, and to grant rights to subscribe for or to convert any security into ordinary shares in Royal Dutch Shell plc, up to an aggregate nominal amount of €190 million (representing 2,714 million ordinary shares of €0.07 each), and to list such shares or rights on any stock exchange. This authority expires at the earlier of the close of business on August 23, 2018, and the end of the Annual General Meeting to be held in 2018, unless previously renewed, revoked or varied by Royal Dutch Shell plc in a general meeting.
ROYAL DUTCH SHELL PLC 4th QUARTER AND FULL YEAR 2017 UNAUDITED RESULTS
Page 15
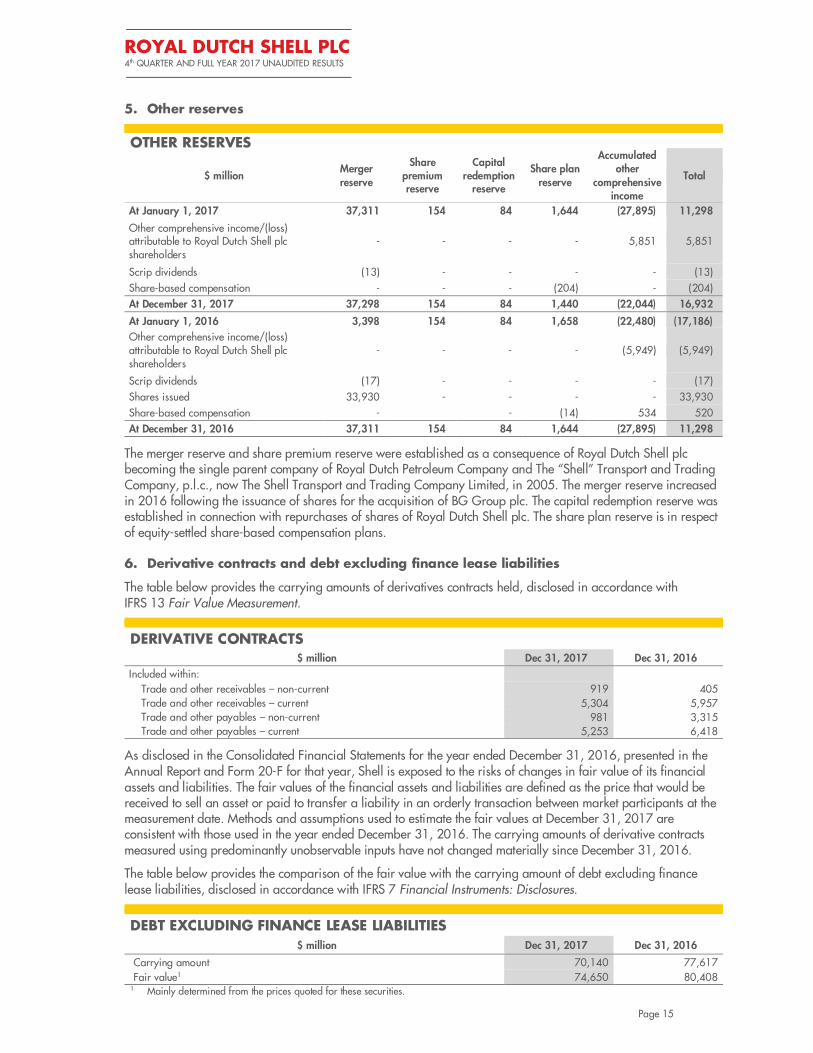
5. Other reserves
OTHER RESERVES
$ million Merger reserve
Share premium reserve
Capital redemption
reserve
Share plan reserve
Accumulated other
comprehensive income
Total
At January 1, 2017 37,311 154 84 1,644 (27,895) 11,298
Other comprehensive income/(loss) attributable to Royal Dutch Shell plc shareholders
- - - - 5,851 5,851
Scrip dividends (13) - - - - (13)
Share-based compensation - - - (204) - (204)
At December 31, 2017 37,298 154 84 1,440 (22,044) 16,932
At January 1, 2016 3,398 154 84 1,658 (22,480) (17,186)
Other comprehensive income/(loss) attributable to Royal Dutch Shell plc shareholders
- - - - (5,949) (5,949)
Scrip dividends (17) - - - - (17)
Shares issued 33,930 - - - - 33,930
Share-based compensation - - (14) 534 520
At December 31, 2016 37,311 154 84 1,644 (27,895) 11,298
The merger reserve and share premium reserve were established as a consequence of Royal Dutch Shell plc becoming the single parent company of Royal Dutch Petroleum Company and The “Shell” Transport and Trading Company, p.l.c., now The Shell Transport and Trading Company Limited, in 2005. The merger reserve increased in 2016 following the issuance of shares for the acquisition of BG Group plc. The capital redemption reserve was established in connection with repurchases of shares of Royal Dutch Shell plc. The share plan reserve is in respect of equity-settled share-based compensation plans.
6. Derivative contracts and debt excluding finance lease liabilities
The table below provides the carrying amounts of derivatives contracts held, disclosed in accordance with IFRS 13 Fair Value Measurement.
DERIVATIVE CONTRACTS
$ million Dec 31, 2017 Dec 31, 2016
Included within: Trade and other receivables – non-current 919 405 Trade and other receivables – current 5,304 5,957 Trade and other payables – non-current 981 3,315 Trade and other payables – current 5,253 6,418
As disclosed in the Consolidated Financial Statements for the year ended December 31, 2016, presented in the Annual Report and Form 20-F for that year, Shell is exposed to the risks of changes in fair value of its financial assets and liabilities. The fair values of the financial assets and liabilities are defined as the price that would be received to sell an asset or paid to transfer a liability in an orderly transaction between market participants at the measurement date. Methods and assumptions used to estimate the fair values at December 31, 2017 are consistent with those used in the year ended December 31, 2016. The carrying amounts of derivative contracts measured using predominantly unobservable inputs have not changed materially since December 31, 2016.
The table below provides the comparison of the fair value with the carrying amount of debt excluding finance lease liabilities, disclosed in accordance with IFRS 7 Financial Instruments: Disclosures.
DEBT EXCLUDING FINANCE LEASE LIABILITIES
$ million Dec 31, 2017 Dec 31, 2016
Carrying amount 70,140 77,617 Fair value1 74,650 80,408
1. Mainly determined from the prices quoted for these securities.
ROYAL DUTCH SHELL PLC 4th QUARTER AND FULL YEAR 2017 UNAUDITED RESULTS
Page 16
7. Motiva joint venture
On May 1, 2017, Shell and Saudi Refining Inc. (“SRI”) completed the separation of assets, liabilities and businesses of Motiva Enterprises LLC (“Motiva”), a 50:50 joint venture. Following the transaction, Shell assumed sole ownership of two refineries, eleven distribution terminals and certain Shell-branded fuel retail markets in the United States. The transaction enables Shell to combine the assets retained from the joint venture with other Shell Downstream assets in North America, in line with its strategy to deliver increased cash and returns through simpler and highly integrated businesses. It is accounted for as a disposal of Shell’s 50% interest in the Motiva joint venture and a subsequent business acquisition.
The fair value of Shell’s interest in the joint venture on May 1, 2017 was $3,847 million. This fair value was used, for accounting purposes, as the consideration recognised for the disposal. The disposal gave rise to a taxable gain, leading to a non-cash charge of $574 million on completion of the transaction. Consequently, income for the second quarter 2017 included a net charge of $546 million representing the difference between the net carrying amount of Shell’s interest in the joint venture (including associated deferred tax liabilities) of $3,819 million and its fair value, and the tax charge which crystallised upon the disposal. This net charge was reported under “Interest and other income”.
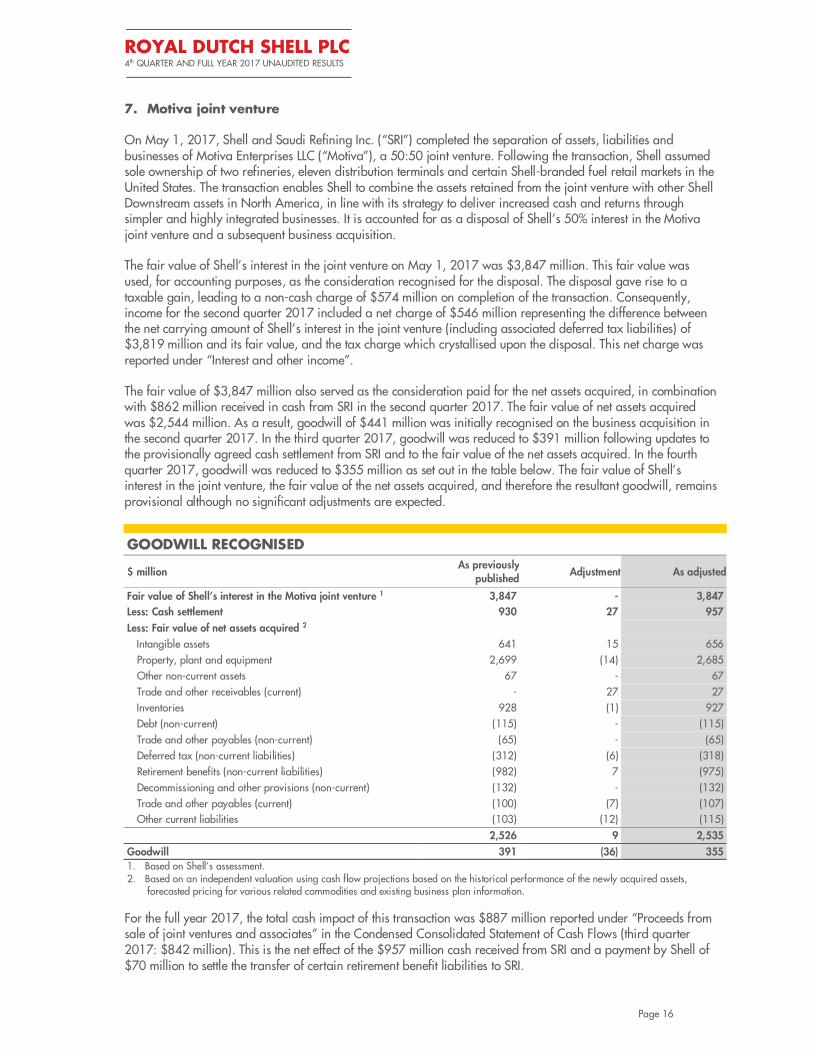
The fair value of $3,847 million also served as the consideration paid for the net assets acquired, in combination with $862 million received in cash from SRI in the second quarter 2017. The fair value of net assets acquired was $2,544 million. As a result, goodwill of $441 million was initially recognised on the business acquisition in the second quarter 2017. In the third quarter 2017, goodwill was reduced to $391 million following updates to the provisionally agreed cash settlement from SRI and to the fair value of the net assets acquired. In the fourth quarter 2017, goodwill was reduced to $355 million as set out in the table below. The fair value of Shell’s interest in the joint venture, the fair value of the net assets acquired, and therefore the resultant goodwill, remains provisional although no significant adjustments are expected.
GOODWILL RECOGNISED
$ million As previously
publishedAdjustment As adjusted
Fair value of Shell’s interest in the Motiva joint venture 1 3,847 - 3,847
Less: Cash settlement 930 27 957
Less: Fair value of net assets acquired 2
Intangible assets 641 15 656
Property, plant and equipment 2,699 (14) 2,685
Other non-current assets 67 - 67
Trade and other receivables (current) - 27 27
Inventories 928 (1) 927
Debt (non-current) (115) - (115)
Trade and other payables (non-current) (65) - (65)
Deferred tax (non-current liabilities) (312) (6) (318)
Retirement benefits (non-current liabilities) (982) 7 (975)
Decommissioning and other provisions (non-current) (132) - (132)
Trade and other payables (current) (100) (7) (107)
Other current liabilities (103) (12) (115)
2,526 9 2,535
Goodwill 391 (36) 355 1. Based on Shell’s assessment. 2. Based on an independent valuation using cash flow projections based on the historical performance of the newly acquired assets,
forecasted pricing for various related commodities and existing business plan information.
For the full year 2017, the total cash impact of this transaction was $887 million reported under “Proceeds from sale of joint ventures and associates” in the Condensed Consolidated Statement of Cash Flows (third quarter 2017: $842 million). This is the net effect of the $957 million cash received from SRI and a payment by Shell of $70 million to settle the transfer of certain retirement benefit liabilities to SRI.
ROYAL DUTCH SHELL PLC 4th QUARTER AND FULL YEAR 2017 UNAUDITED RESULTS
Page 17
DEFINITIONS
A. Identified items
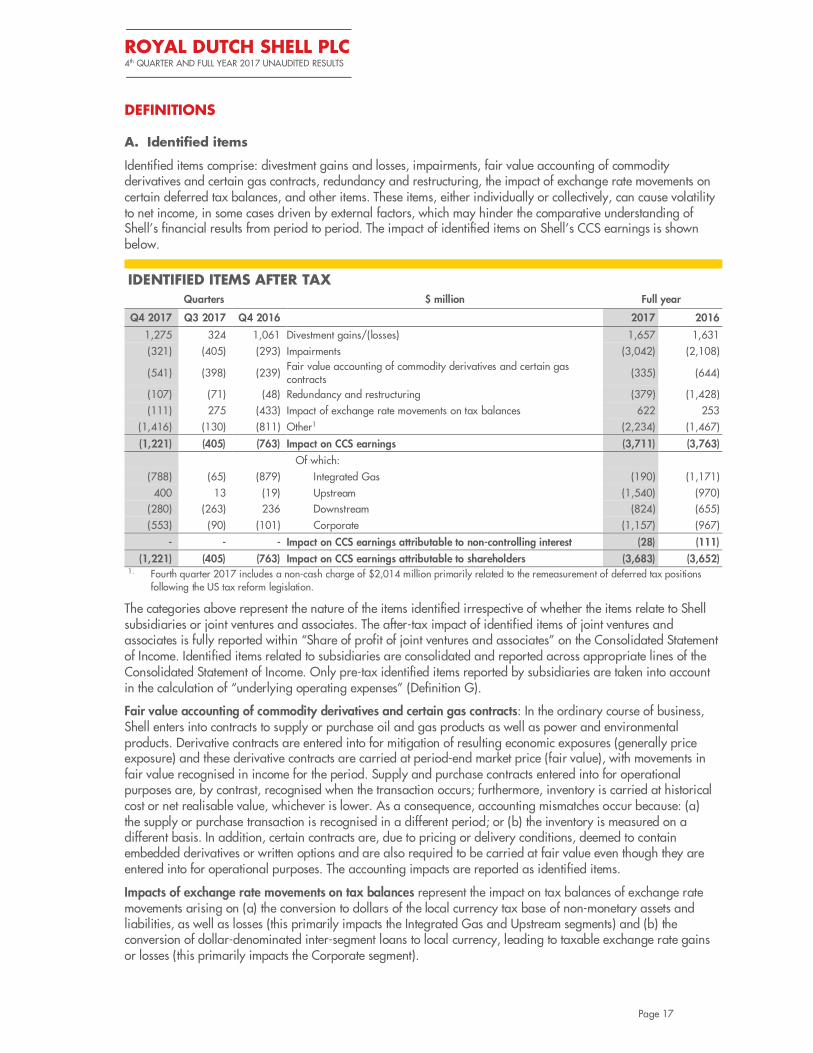
Identified items comprise: divestment gains and losses, impairments, fair value accounting of commodity derivatives and certain gas contracts, redundancy and restructuring, the impact of exchange rate movements on certain deferred tax balances, and other items. These items, either individually or collectively, can cause volatility to net income, in some cases driven by external factors, which may hinder the comparative understanding of Shell’s financial results from period to period. The impact of identified items on Shell’s CCS earnings is shown below.
IDENTIFIED ITEMS AFTER TAX
Quarters $ million Full year
Q4 2017 Q3 2017 Q4 2016 2017 2016
1,275 324 1,061 Divestment gains/(losses) 1,657 1,631
(321) (405) (293) Impairments (3,042) (2,108)
(541) (398) (239) Fair value accounting of commodity derivatives and certain gas contracts
(335) (644)
(107) (71) (48) Redundancy and restructuring (379) (1,428)
(111) 275 (433) Impact of exchange rate movements on tax balances 622 253
(1,416) (130) (811) Other1 (2,234) (1,467)
(1,221) (405) (763) Impact on CCS earnings (3,711) (3,763)
Of which:
(788) (65) (879) Integrated Gas (190) (1,171)
400 13 (19) Upstream (1,540) (970)
(280) (263) 236 Downstream (824) (655)
(553) (90) (101) Corporate (1,157) (967)
- - - Impact on CCS earnings attributable to non-controlling interest (28) (111)
(1,221) (405) (763) Impact on CCS earnings attributable to shareholders (3,683) (3,652) 1. Fourth quarter 2017 includes a non-cash charge of $2,014 million primarily related to the remeasurement of deferred tax positions
following the US tax reform legislation.
The categories above represent the nature of the items identified irrespective of whether the items relate to Shell subsidiaries or joint ventures and associates. The after-tax impact of identified items of joint ventures and associates is fully reported within “Share of profit of joint ventures and associates” on the Consolidated Statement of Income. Identified items related to subsidiaries are consolidated and reported across appropriate lines of the Consolidated Statement of Income. Only pre-tax identified items reported by subsidiaries are taken into account in the calculation of “underlying operating expenses” (Definition G).
Fair value accounting of commodity derivatives and certain gas contracts: In the ordinary course of business, Shell enters into contracts to supply or purchase oil and gas products as well as power and environmental products. Derivative contracts are entered into for mitigation of resulting economic exposures (generally price exposure) and these derivative contracts are carried at period-end market price (fair value), with movements in fair value recognised in income for the period. Supply and purchase contracts entered into for operational purposes are, by contrast, recognised when the transaction occurs; furthermore, inventory is carried at historical cost or net realisable value, whichever is lower. As a consequence, accounting mismatches occur because: (a) the supply or purchase transaction is recognised in a different period; or (b) the inventory is measured on a different basis. In addition, certain contracts are, due to pricing or delivery conditions, deemed to contain embedded derivatives or written options and are also required to be carried at fair value even though they are entered into for operational purposes. The accounting impacts are reported as identified items.
Impacts of exchange rate movements on tax balances represent the impact on tax balances of exchange rate movements arising on (a) the conversion to dollars of the local currency tax base of non-monetary assets and liabilities, as well as losses (this primarily impacts the Integrated Gas and Upstream segments) and (b) the conversion of dollar-denominated inter-segment loans to local currency, leading to taxable exchange rate gains or losses (this primarily impacts the Corporate segment).

ROYAL DUTCH SHELL PLC 4th QUARTER AND FULL YEAR 2017 UNAUDITED RESULTS
Page 18
Other identified items represent other credits or charges Shell’s management assesses should be excluded to provide additional insight, such as the impact arising from the US tax reform legislation and certain provisions for onerous contracts or litigation.
B. Basic CCS earnings per share
Basic CCS earnings per share is calculated as CCS earnings attributable to Royal Dutch Shell plc shareholders (see Note 2), divided by the weighted average number of shares used as the basis for basic earnings per share (see Note 3).
C. Capital investment
Capital investment is a measure used to make decisions about allocating resources and assessing performance. It comprises capital expenditure, exploration expense excluding well write-offs, new investments in joint ventures and associates, new finance leases and investments in Integrated Gas, Upstream and Downstream securities, all of which on an accruals basis. In 2016, it also included the capital investment related to the acquisition of BG Group plc.
The reconciliation of “Capital expenditure” to “Capital investment” is as follows.
Quarters $ million Full year
Q4 2017 Q3 2017 Q4 2016 2017 2016
5,861 5,018 5,714 Capital expenditure1 20,845 22,116
- - - Capital investment related to the acquisition of BG Group plc - 52,904
202 42 527 Investments in joint ventures and associates 595 1,330
380 280 416 Exploration expense, excluding exploration wells written off 1,048 1,274
330 312 215 Finance leases 1,074 2,343
5 90 41 Other1 444 (90)
6,778 5,742 6,913 Capital investment 24,006 79,877
Of which:
1,043 1,148 1,145 Integrated Gas 3,827 26,214
3,485 2,805 3,490 Upstream 13,648 47,507
2,208 1,743 2,251 Downstream 6,416 6,057
42 46 27 Corporate 115 99 1. Full year 2017 includes capital expenditure of $911 million and, under “Other”, a payable position of $375 million, related to the
acquisition of Marathon Oil Canada Corporation in Canada.
D. Divestments
Divestments is a measure used to monitor the progress of Shell’s divestment programme. This measure comprises proceeds from sale of property, plant and equipment and businesses, joint ventures and associates, and other Integrated Gas, Upstream and Downstream investments, reported in “Cash flow from investing activities”, adjusted onto an accruals basis and for any share consideration received or contingent consideration recognised upon divestment, as well as proceeds from the sale of interests in entities while retaining control (for example, proceeds from sale of interest in Shell Midstream Partners, L.P.), which are included in “Change in non-controlling interest” within “Cash flow from financing activities”.
With effect from January 1, 2017, consideration received in the form of shares is valued and included in this measure upon completion of the divestment transactions, instead of when these shares are disposed of. This change in timing of recognition enables Shell to better evaluate its progress against its divestment programme. The share or contingent consideration is not remeasured thereafter, including if and when the shares received are eventually disposed of, or contingent consideration is realised. Comparative information for 2016 has been adjusted to include the share consideration received upon the divestments of Shell’s interests in the Deep Basin and Gundy acreages (Canada) and the Brutus TLP and Glider subsea production system (USA), both in the fourth quarter 2016.
In future periods, the proceeds from any disposal of shares received as divestment consideration, and proceeds from realisation of contingent consideration, will be included in “Cash flow from investing activities”.
ROYAL DUTCH SHELL PLC 4th QUARTER AND FULL YEAR 2017 UNAUDITED RESULTS
Page 19
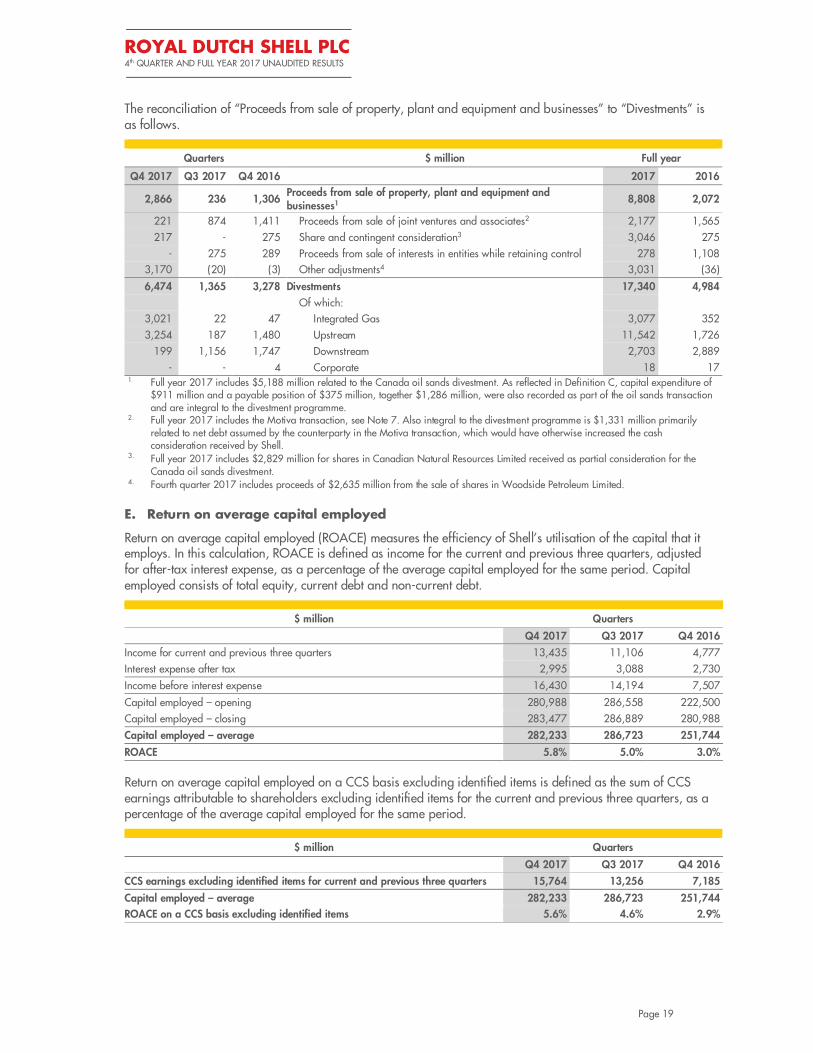
The reconciliation of “Proceeds from sale of property, plant and equipment and businesses” to “Divestments” is as follows.
Quarters $ million Full year
Q4 2017 Q3 2017 Q4 2016 2017 2016
2,866 236 1,306 Proceeds from sale of property, plant and equipment and businesses1
8,808 2,072
221 874 1,411 Proceeds from sale of joint ventures and associates2 2,177 1,565
217 - 275 Share and contingent consideration3 3,046 275
- 275 289 Proceeds from sale of interests in entities while retaining control 278 1,108
3,170 (20) (3) Other adjustments4 3,031 (36)
6,474 1,365 3,278 Divestments 17,340 4,984
Of which:
3,021 22 47 Integrated Gas 3,077 352
3,254 187 1,480 Upstream 11,542 1,726
199 1,156 1,747 Downstream 2,703 2,889
- - 4 Corporate 18 17 1. Full year 2017 includes $5,188 million related to the Canada oil sands divestment. As reflected in Definition C, capital expenditure of
$911 million and a payable position of $375 million, together $1,286 million, were also recorded as part of the oil sands transaction and are integral to the divestment programme.
2. Full year 2017 includes the Motiva transaction, see Note 7. Also integral to the divestment programme is $1,331 million primarily related to net debt assumed by the counterparty in the Motiva transaction, which would have otherwise increased the cash consideration received by Shell.
3. Full year 2017 includes $2,829 million for shares in Canadian Natural Resources Limited received as partial consideration for the Canada oil sands divestment.
4. Fourth quarter 2017 includes proceeds of $2,635 million from the sale of shares in Woodside Petroleum Limited.
E. Return on average capital employed
Return on average capital employed (ROACE) measures the efficiency of Shell’s utilisation of the capital that it employs. In this calculation, ROACE is defined as income for the current and previous three quarters, adjusted for after-tax interest expense, as a percentage of the average capital employed for the same period. Capital employed consists of total equity, current debt and non-current debt.
$ million Quarters
Q4 2017 Q3 2017 Q4 2016
Income for current and previous three quarters 13,435 11,106 4,777
Interest expense after tax 2,995 3,088 2,730
Income before interest expense 16,430 14,194 7,507
Capital employed – opening 280,988 286,558 222,500
Capital employed – closing 283,477 286,889 280,988
Capital employed – average 282,233 286,723 251,744
ROACE 5.8% 5.0% 3.0%
Return on average capital employed on a CCS basis excluding identified items is defined as the sum of CCS earnings attributable to shareholders excluding identified items for the current and previous three quarters, as a percentage of the average capital employed for the same period.
$ million Quarters
Q4 2017 Q3 2017 Q4 2016
CCS earnings excluding identified items for current and previous three quarters 15,764 13,256 7,185
Capital employed – average 282,233 286,723 251,744
ROACE on a CCS basis excluding identified items 5.6% 4.6% 2.9%
ROYAL DUTCH SHELL PLC 4th QUARTER AND FULL YEAR 2017 UNAUDITED RESULTS
Page 20
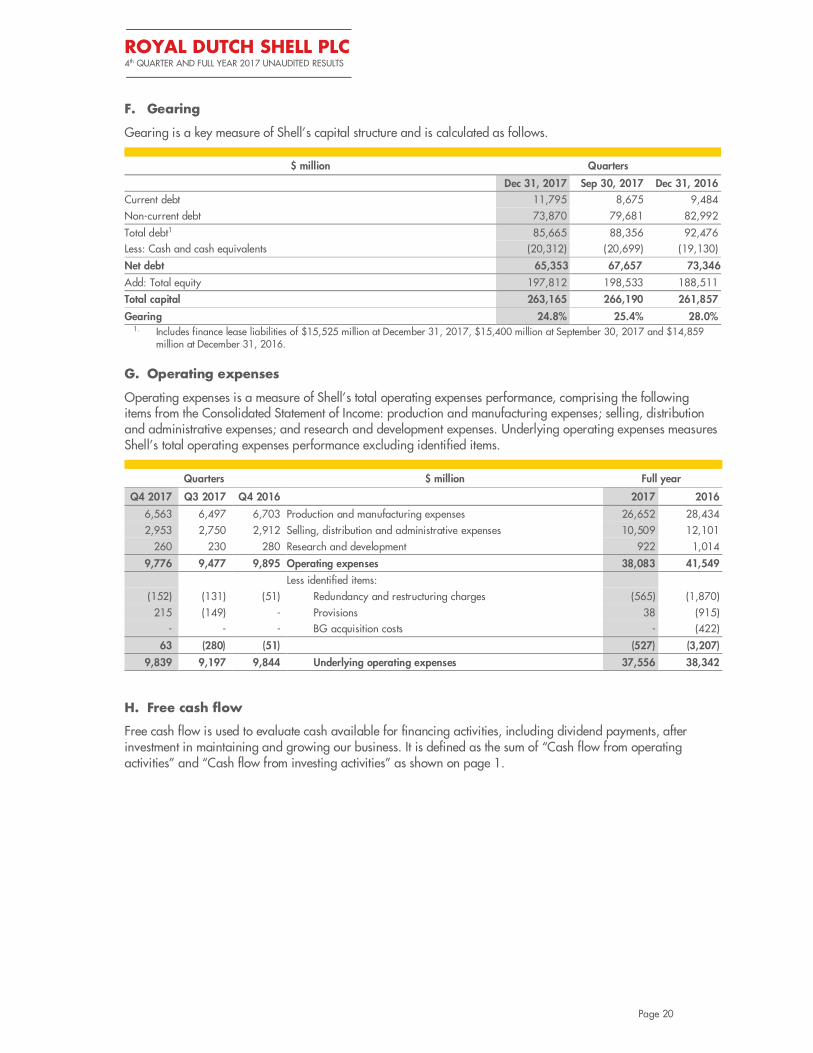
F. Gearing
Gearing is a key measure of Shell’s capital structure and is calculated as follows.
$ million Quarters
Dec 31, 2017 Sep 30, 2017 Dec 31, 2016
Current debt 11,795 8,675 9,484
Non-current debt 73,870 79,681 82,992
Total debt1 85,665 88,356 92,476
Less: Cash and cash equivalents (20,312) (20,699) (19,130)
Net debt 65,353 67,657 73,346
Add: Total equity 197,812 198,533 188,511
Total capital 263,165 266,190 261,857
Gearing 24.8% 25.4% 28.0% 1. Includes finance lease liabilities of $15,525 million at December 31, 2017, $15,400 million at September 30, 2017 and $14,859
million at December 31, 2016.
G. Operating expenses
Operating expenses is a measure of Shell’s total operating expenses performance, comprising the following items from the Consolidated Statement of Income: production and manufacturing expenses; selling, distribution and administrative expenses; and research and development expenses. Underlying operating expenses measures Shell’s total operating expenses performance excluding identified items.
Quarters $ million Full year
Q4 2017 Q3 2017 Q4 2016 2017 2016
6,563 6,497 6,703 Production and manufacturing expenses 26,652 28,434
2,953 2,750 2,912 Selling, distribution and administrative expenses 10,509 12,101
260 230 280 Research and development 922 1,014
9,776 9,477 9,895 Operating expenses 38,083 41,549
Less identified items:
(152) (131) (51) Redundancy and restructuring charges (565) (1,870)
215 (149) - Provisions 38 (915)
- - - BG acquisition costs - (422)
63 (280) (51) (527) (3,207)
9,839 9,197 9,844 Underlying operating expenses 37,556 38,342
H. Free cash flow
Free cash flow is used to evaluate cash available for financing activities, including dividend payments, after investment in maintaining and growing our business. It is defined as the sum of “Cash flow from operating activities” and “Cash flow from investing activities” as shown on page 1.
ROYAL DUTCH SHELL PLC 4th QUARTER AND FULL YEAR 2017 UNAUDITED RESULTS
Page 21
CAUTIONARY STATEMENT
All amounts shown throughout this announcement are unaudited. All peak production figures in Portfolio Developments are quoted at 100% expected production.
The companies in which Royal Dutch Shell plc directly and indirectly owns investments are separate legal entities. In this announcement “Shell”, “Shell group” and “Royal Dutch Shell” are sometimes used for convenience where references are made to Royal Dutch Shell plc and its subsidiaries in general. Likewise, the words “we”, “us” and “our” are also used to refer to subsidiaries in general or to those who work for them. These expressions are also used where no useful purpose is served by identifying the particular company or companies. ‘‘Subsidiaries’’, “Shell subsidiaries” and “Shell companies” as used in this announcement refer to companies over which Royal Dutch Shell plc either directly or indirectly has control. Entities and unincorporated arrangements over which Shell has joint control are generally referred to as “joint ventures” and “joint operations” respectively. Entities over which Shell has significant influence but neither control nor joint control are referred to as “associates”. The term “Shell interest” is used for convenience to indicate the direct and/or indirect ownership interest held by Shell in a venture, partnership or company, after exclusion of all third-party interest.
This announcement contains forward-looking statements concerning the financial condition, results of operations and businesses of Royal Dutch Shell. All statements other than statements of historical fact are, or may be deemed to be, forward-looking statements. Forward-looking statements are statements of future expectations that are based on management’s current expectations and assumptions and involve known and unknown risks and uncertainties that could cause actual results, performance or events to differ materially from those expressed or implied in these statements. Forward-looking statements include, among other things, statements concerning the potential exposure of Royal Dutch Shell to market risks and statements expressing management’s expectations, beliefs, estimates, forecasts, projections and assumptions. These forward-looking statements are identified by their use of terms and phrases such as ‘‘anticipate’’, ‘‘believe’’, ‘‘could’’, ‘‘estimate’’, ‘‘expect’’, ‘‘goals’’, ‘‘intend’’, ‘‘may’’, ‘‘objectives’’, ‘‘outlook’’, ‘‘plan’’, ‘‘probably’’, ‘‘project’’, ‘‘risks’’, “schedule”, ‘‘seek’’, ‘‘should’’, ‘‘target’’, ‘‘will’’ and similar terms and phrases. There are a number of factors that could affect the future operations of Royal Dutch Shell and could cause those results to differ materially from those expressed in the forward-looking statements included in this announcement, including (without limitation): (a) price fluctuations in crude oil and natural gas; (b) changes in demand for Shell’s products; (c) currency fluctuations; (d) drilling and production results; (e) reserves estimates; (f) loss of market share and industry competition; (g) environmental and physical risks; (h) risks associated with the identification of suitable potential acquisition properties and targets, and successful negotiation and completion of such transactions; (i) the risk of doing business in developing countries and countries subject to international sanctions; (j) legislative, fiscal and regulatory developments including regulatory measures addressing climate change; (k) economic and financial market conditions in various countries and regions; (l) political risks, including the risks of expropriation and renegotiation of the terms of contracts with governmental entities, delays or advancements in the approval of projects and delays in the reimbursement for shared costs; and (m) changes in trading conditions. No assurance is provided that future dividend payments will match or exceed previous dividend payments. All forward-looking statements contained in this announcement are expressly qualified in their entirety by the cautionary statements contained or referred to in this section. Readers should not place undue reliance on forward-looking statements. Additional risk factors that may affect future results are contained in Royal Dutch Shell’s Form 20-F for the year ended December 31, 2016 (available at www.shell.com/investor and www.sec.gov). These risk factors also expressly qualify all forward-looking statements contained in this announcement and should be considered by the reader. Each forward-looking statement speaks only as of the date of this announcement, February 1, 2018. Neither Royal Dutch Shell plc nor any of its subsidiaries undertake any obligation to publicly update or revise any forward-looking statement as a result of new information, future events or other information. In light of these risks, results could differ materially from those stated, implied or inferred from the forward-looking statements contained in this announcement.
This Report contains references to Shell’s website. These references are for the readers’ convenience only. Shell is not incorporating by reference any information posted on www.shell.com
We may have used certain terms, such as resources, in this announcement that the United States Securities and Exchange Commission (SEC) strictly prohibits us from including in our filings with the SEC. U.S. investors are urged to consider closely the disclosure in our Form 20-F, File No 1-32575, available on the SEC website www.sec.gov. You can also obtain this form from the SEC by calling 1-800-SEC-0330.
This announcement contains inside information.
February 1, 2018
The information in this Report reflects the unaudited consolidated financial position and results of Royal Dutch Shell plc. Company No.
4366849, Registered Office: Shell Centre, London, SE1 7NA, England, UK.
Contacts:
- Linda Szymanski, Company Secretary - Investor Relations: International + 31 (0) 70 377 4540; North America +1 832 337 2034 - Media: International +44 (0) 207 934 5550; USA +1 832 337 4355 LEI number of Royal Dutch Shell plc: 21380068P1DRHMJ8KU70 Classification: Inside Information