roughness and reflectivity of mass finished 6061 t6 al ... · pdf fileroughness and...
TRANSCRIPT
WORCESTER POLYTECHNIC INSTITUTE
Roughness and Reflectivity
of Mass Finished 6061 T6
Al Surfaces
Major Qualifying Project
Authors: Nicolas Allen & Jeffrey Laun
Advisor: Christopher A. Brown
~ 1 ~
Table of Contents
Table of Contents .......................................................................................................................................... 1
Table of Figures ............................................................................................................................................. 2
1. Abstract ................................................................................................................................................. 3
2. Introduction .......................................................................................................................................... 4
2.1 Objective ............................................................................................................................................. 4
2.2 Rationale ............................................................................................................................................. 4
2.3 State-of-the-Art ................................................................................................................................... 5
2.3.1 Existing Research in Mass Finishing ............................................................................................. 5
2.3.2 Existing Research in Roughness vs. Reflectivity of Mass Finished Surfaces ................................ 7
3. Approach ........................................................................................................................................... 7
3.1 Research Gap .................................................................................................................................. 7
4. Methods ................................................................................................................................................ 8
4.1 Variable Significance Isolation ............................................................................................................ 8
4.1.1 Application to Mass Finishing ...................................................................................................... 8
4.2 Design of Experiment .......................................................................................................................... 9
4.2.1 Estimation of Contact force of Media & Part ............................................................................... 9
4.2.2 Roughness and Reflectivity Correlations ................................................................................... 10
4.3 Analysis ............................................................................................................................................. 13
4.3.1 Roughness and Reflectivity Correlation ..................................................................................... 13
5. Results ................................................................................................................................................. 14
5.1 Estimation of Media Forces ........................................................................................................ 14
5.2 Reflectivity Correlation ..................................................................................................................... 15
6. Discussion ............................................................................................................................................ 25
7. Conclusions ......................................................................................................................................... 27
8. References .......................................................................................................................................... 29
Appendix A .................................................................................................................................................. 30
Results at Roughest Finish ...................................................................................................................... 30
Complexity Results .................................................................................................................................. 31
Appendix B .................................................................................................................................................. 33
Mass Finisher Design Component........................................................................................................... 33
~ 2 ~
Table of Figures
Figure 1 (Note: Scale is in cm) ....................................................................................................................... 9
Figure 2: Roughness-Reflectivity Methods ................................................................................................. 13
Figure 3 (Initial Machined Piece at .05mm/rev @ 2000 rpm) .................................................................... 15
Figure 4 (Piece after 0.5min of Mass Finishing)......................................................................................... 16
Figure 5 (Piece after 1 min of Mass Finishing) .......................................................................................... 16
Figure 6 (Piece after 4 min of Mass Finishing) .......................................................................................... 17
Figure 7 (Piece after 10 min of Mass Finishing)......................................................................................... 17
Figure 8 (Piece after 30 min of Mass Finishing)......................................................................................... 18
Figure 9 (Piece after 60 min of Mass Finishing)......................................................................................... 18
Figure 10 Ra vs. Time ................................................................................................................................. 19
Figure 11 Relative Area vs. Scale ............................................................................................................... 19
Figure 12 Reflectivity vs. Time .................................................................................................................. 20
Figure 13 Relative Area vs. Reflectivity ..................................................................................................... 21
Figure 14 R2 vs. Scale at λ of 380 nm ......................................................................................................... 22
Figure 15 R2 vs. Scale at λ of 405 nm ......................................................................................................... 23
Figure 16 R2 vs. Scale at λ of 515 nm ......................................................................................................... 24
Figure 17 Wavelength vs. Scale vs. R2 ....................................................................................................... 25
Figure 18: 380 nm for roughest surface...................................................................................................... 30
Figure 19 390 nm for roughest surface ....................................................................................................... 30
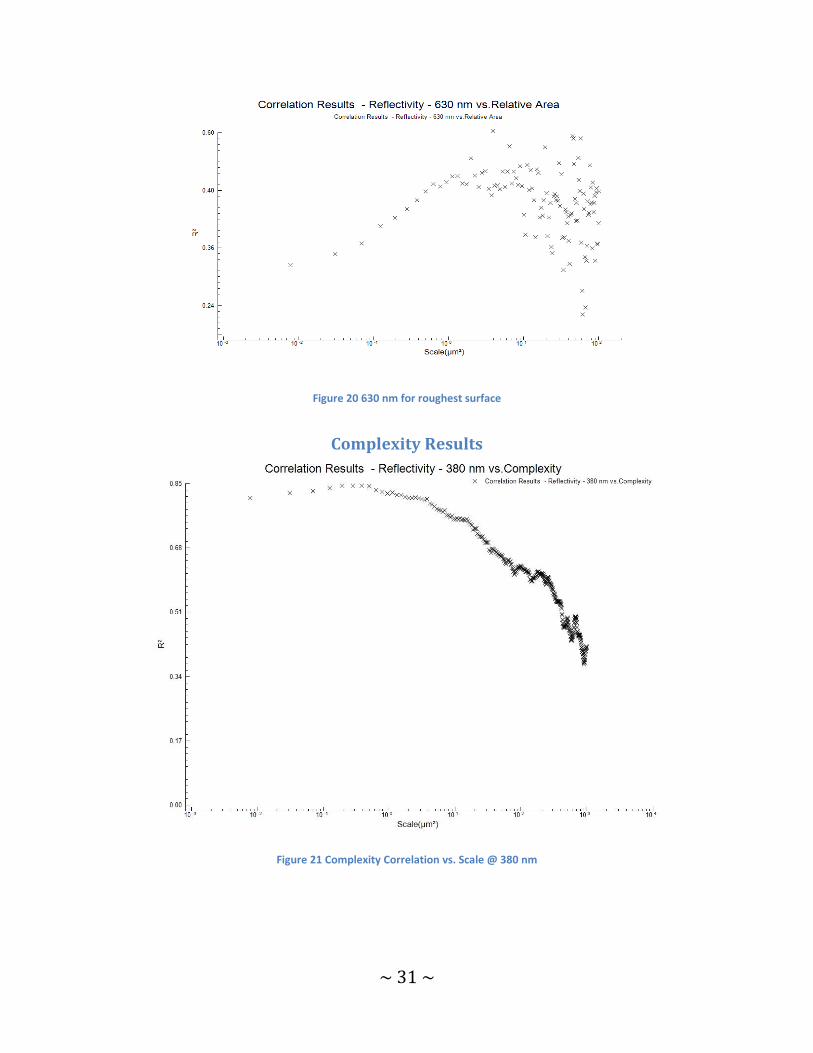
Figure 20 630 nm for roughest surface ....................................................................................................... 31
Figure 21 Complexity Correlation vs. Scale @ 380 nm ............................................................................... 31
Figure 22 Complexity Correlation vs. Scale @ 405 nm ............................................................................... 32
Figure 23 Complexity Correlation vs. Scale @ 630 nm ............................................................................... 32
Figure 24 Final Design of Part Extraction Device (PhotoView 360 Render) ................................................ 34
Figure 25 Acclaro Screen Shot .................................................................................................................... 36
Table 1: Summary of Scratch Depths and Forces ....................................................................................... 15
Equation 1 ................................................................................................................................................... 14
~ 3 ~
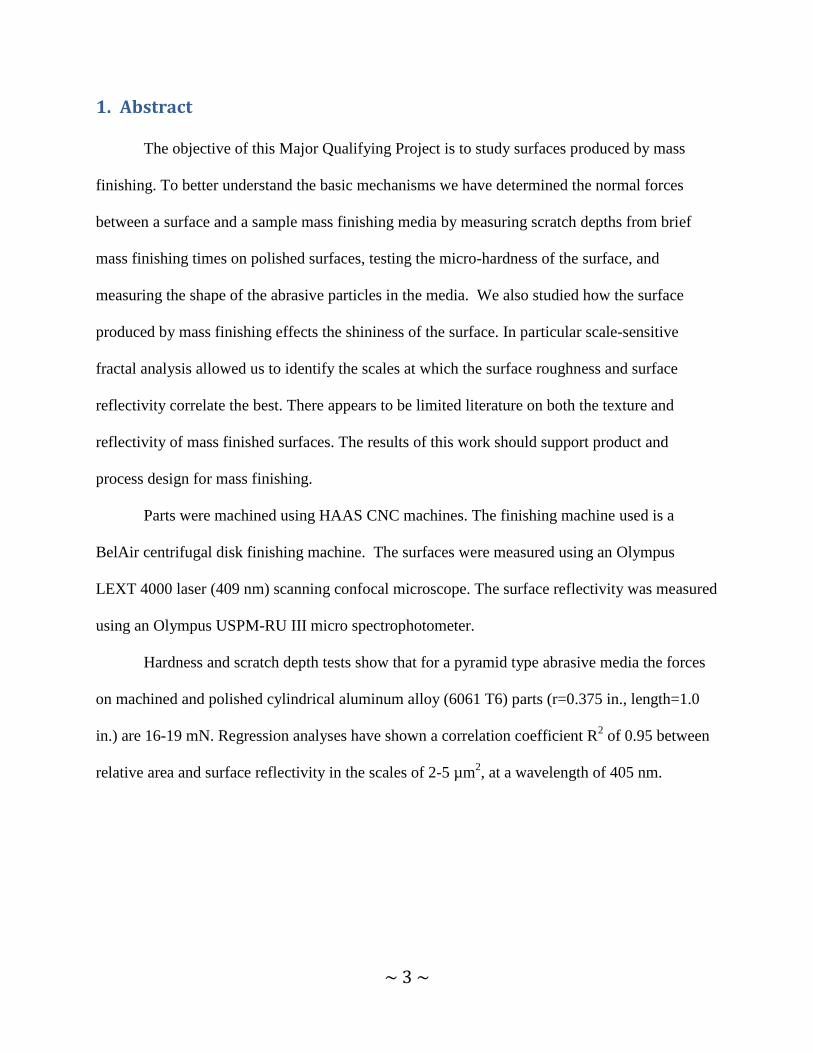
1. Abstract
The objective of this Major Qualifying Project is to study surfaces produced by mass
finishing. To better understand the basic mechanisms we have determined the normal forces
between a surface and a sample mass finishing media by measuring scratch depths from brief
mass finishing times on polished surfaces, testing the micro-hardness of the surface, and
measuring the shape of the abrasive particles in the media. We also studied how the surface
produced by mass finishing effects the shininess of the surface. In particular scale-sensitive
fractal analysis allowed us to identify the scales at which the surface roughness and surface
reflectivity correlate the best. There appears to be limited literature on both the texture and
reflectivity of mass finished surfaces. The results of this work should support product and
process design for mass finishing.
Parts were machined using HAAS CNC machines. The finishing machine used is a
BelAir centrifugal disk finishing machine. The surfaces were measured using an Olympus
LEXT 4000 laser (409 nm) scanning confocal microscope. The surface reflectivity was measured
using an Olympus USPM-RU III micro spectrophotometer.
Hardness and scratch depth tests show that for a pyramid type abrasive media the forces
on machined and polished cylindrical aluminum alloy (6061 T6) parts (r=0.375 in., length=1.0
in.) are 16-19 mN. Regression analyses have shown a correlation coefficient R2 of 0.95 between
relative area and surface reflectivity in the scales of 2-5 µm2, at a wavelength of 405 nm.
~ 4 ~
2. Introduction
This project came to fruition through the donation of a centrifugal disk finishing machine
to WPI by Bel Air Finishing Supply. As previously mentioned, it was the goal of the MQP to
study the surfaces produced by the mass finisher. We began with a literature review to identify
exactly what was known about such devices already. We then proceeded to do experiments using
both turned and polished aluminum with the goal of identifying the forces involved with this
specific type of mass finishing operation. It was at this point that we were given a micro
spectrophotometer from Olympus to utilize and learn about for a week. We took this opportunity
to also include in the MQP research relating to surface roughness and reflectivity from mass
finishing operations. The remainder of the project was focused on this goal and our methods and
results are as follows.
2.1 Objective
The objective of this Major Qualifying Project is to study surfaces produced by mass
finishing. To better understand the basic mechanisms we have determined the normal forces
between a surface and a sample mass finishing media by measuring scratch depths, testing
micro-hardness and measuring the shape of abrasive media. In addition we have studied how the
surface produced by mass finishing effects the shininess of the surface.
2.2 Rationale
These two objectives are important for the major reason that there is very limited
knowledge of the forces which are acting between the media and the part, as well as how the
reflectivity of a non-smooth surface changes with roughness after a tumbling operation.
~ 5 ~
The principal work done on the generation of scratches on surfaces was Archard
(Archard, 1953). However, most of this research was done in the 1950’s and limited work has
been done on the topic since. Furthermore, we were unable to find anything done on the topic of
the generation of scratches during mass finishing operations.
Light scattering is also a well-documented phenomenon on surfaces. The basic principal
of Snell’s law is one that is well understood by the scientific community. However, the
scattering of light on rough surfaces is one a subject with very limited research. The behavior of
the different wavelengths of light and the roughness of a surface is not something which is well
known. Jean Bennett is one of the few who has contributed to the knowledge of the topic;
however there are still many questions which remain (Bennett, 1961).
2.3 State-of-the-Art
There appears to be limited literature on both the texture and reflectivity of mass finished
surfaces. What sets our work apart from most other reflectivity research is that we are testing
with rough surfaces, not flat or polished surfaces. In our literature review we failed to find any
research correlating the roughness of a surface produced by mass finishing to the reflectivity of
the surface taken from a micro spectrophotometer, which makes our results exciting. The results
of this work should support product and process design for mass finishing.
2.3.1 Existing Research in Mass Finishing
To begin the team first looked at some of the fundamental work done in the area of
abrasive wear on solids since the movement of media within the centrifugal disc finishing
machine can be seem to act in this way. Early studies by Archard introduced that the wear rate is
proportional to the load and independent of the area of contact. He also finds that given a
constant flow and pressure, the wear rate is independent of speed of sliding (Archard, 1953).
~ 6 ~
Samuels and Mulhearn conducted a study using silicon carbide abrasive papers to model the
abrasion of metals. They found that wear on a surface was related directly to the load, contact
length and density of the work piece (Mulhearn and Samuels, 1962). Other important work,
which may relate more closely to the process involved in centrifugal disk finishing, models the
effects of low stress abrasive wear. During this study, Grigoroudis and Stephenson found again
that the wear rate increased with load and that the quantity of material loss was proportional to
amount of abrasive material used (Grigoroudis and Stephenson, 1997).
Specific to mass finishing, some research has been conducted using vibratory bowls.
Using a vibratory bowl, contact forces were measured on aluminum work pieces. This work led
to the discovery that surface hardness of a work piece was directly proportional to the lubrication
of the compound run through the media (Wang et al., 2000). Using the same machine,
Domblesky developed a set of relationships between the material removal rate of aluminum,
brass and steal pieces and the vibratory bowl parameters (Domblesky et al., 2004). Up until this
point in time, this research most closely resembles the team’s current objectives.
Specific to centrifugal disc finishing, there has been very little research aimed at
developing accurate models. Cariapa et al. performed research in 2007 in an effort to explain
both the material removal characteristics and media flow in a centrifugal disc finishing machine.
They successfully modeled the flow of the media in the machine, as well as, developed a method
for calculating the material removal rate as a function of density and hardness. In addition they
also identified several characteristics of the media weight loss during a finishing period. It is
important to note, however, that the report identified the need for additional research into
changes in surface finish of work pieces (Cariapa et al., 2007).
~ 7 ~
2.3.2 Existing Research in Roughness vs. Reflectivity of Mass Finished Surfaces
Once again, we were unable to find any research pertaining to the correlation between
surface roughness and reflectivity of mass finished surfaces. Most of the literature that we
discovered focused on specular reflection of smooth surfaces, and the remainder discussed using
the bidirectional reflectance distribution function (BRDF). Li and Torrance conducted research
attempting to correlate surface roughness and light scattering for rough metallic surfaces
produced by bead-blasting, grinding and etching. Their results related surface roughness to
incidence of light scattered from the rough surfaces (Li and Torrance, 2005).
Bennett and Porteus found a relationship between surface roughness and specular
reflectance at normal incidences using steel plate disks coated in an aluminum film. Finishes
were created using fine feed grinders. Roughness’s of 2.5, 8, and 32 µin were measured using a
profilometer (Bennett and Porteus, 1967).
Attempts to create a geometric model of reflectance for use in design of surfaces have
been worked on to predict surface scattering based on scale-sensitive methods. We expect that
the reflectance should decrease with decreasing scale (Shipulski and Brown, 1994). These
experiments were done using steel however, and do not directly address the objective we are
working towards.
3. Approach
3.1 Research Gap
It is clear from the existing research found in the area of centrifugal disc finishing and
reflectivity that there is a wide gap in research which has yet to be explored. Although Cariapa
successfully identified relationships for material removal rate and media flow, it was noted that
further research regarding the relationships between finishing parameters and the resulting
~ 8 ~
surface finish was needed. The team did not identify any other material related specifically to
identifying relationships in centrifugal disc finishing machines.
In order to lessen this gap, we designed several experiments to test for significant
relationships between input parameters and the resulting surface finish. First, using design of
experiments, we factored out any insignificant variables leaving a list of variables which were
tested. The total number of initial variables is as follows: initial surface finish& duration inside
the finisher.
4. Methods
4.1 Variable Significance Isolation
It is going to be very important that during the course of this project that we are able to
quickly determine which variables are significant. In this case we will be looking at variables
that affect surface finish when looking at mass finishing, and variables that affect determining
the accuracy of obtaining an area scale value. Furthermore we will need to a basic
discrimination test to affirm conclusions that were made during testing.
Discrimination testing is a useful tool because it allows for the identification of irrelevant
data (Discrimination testing: a few ideas, old and new). There are many different ways to
perform these tests. However, the underlying question in all of these tests is “how different is
different”.
4.1.1 Application to Mass Finishing
In order to determine which variables greatly influence the final outcome of a surface
during mass finishing we will need to test many variables, which of these are important, and
~ 9 ~
which do not require strict control. After we determine this we will be able to, in and quick and
efficient matter developed a basic strategy to figure out which variables matter and which do not.
To really answer the question “how different is different?”
4.2 Design of Experiment
4.2.1 Estimation of Contact force of Media & Part
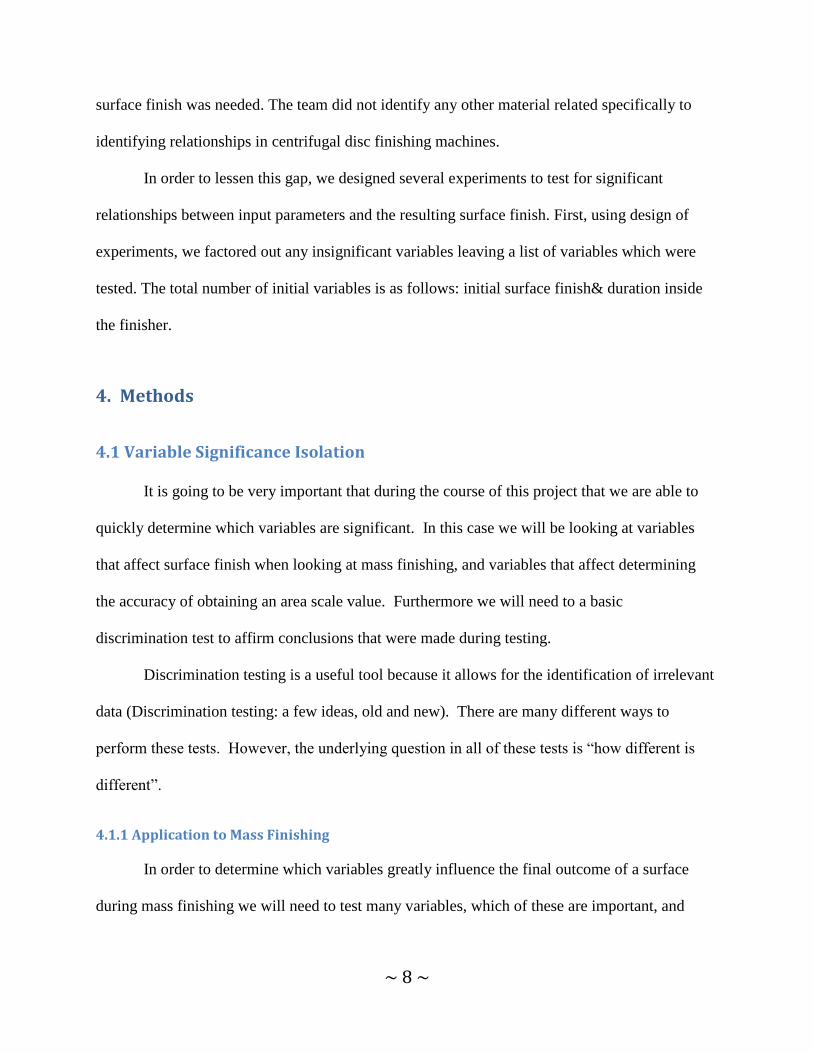
To identify the forces involved in mass finishing we used first had to generate a surface
which was polished. To do this, we used the Metallographic Polishing Laboratory located in
Washburn Shops. The Surfaces we used were the ends of a 0.750 inch bar stock of T-6061
Aluminum. (Shown in Figure 1 after 30s. in Mass Finisher)
Figure 1 (Note: Scale is in cm)
To begin our experiment we identified which variables were to be tested. To quickly
identify which variables are significant in the overall surface finish of a final part we took 4 data
points and tested each several times. These 4 data points are as follows: there will be two groups
of 2 and the groups will have quantifiable values within 10% of their values, and the groups will
~ 10 ~
be different by at least 100%. This will allow us to quickly determine if there is a correlation
between these variables and surface finish quickly. If no correlation is found then this variable
will be disregarded for future experimentation. For our purposes we will be testing the following
variables:
Initial surface finish
4.2.2 Roughness and Reflectivity Correlations
To identify correlations in reflectivity we used initial surface finish and time in the mass
finisher as our variables. There were three distinct branches in this experiment: processing,
measurement and performance. A diagram outlining the overall process of the experiment can be
seen in figure 5 below.
4.2.2.1 Processing
All the parts used for the experiment were 6061 T6 Aluminum. In order to prepare the
surface finish for measurement, several steps were taken. First a rod of extruded aluminum was
turned in a HAAS lathe at a feed of 0.5 mm/rev at a speed of 2000 rpm. A portion of the rod (1
inch) was cut off and used for the experiment. In order to be sure that the same area of the work
piece was being measured after each interval of time, a small area was marked with an etching
tool at one end of the part.
The next process required to achieve the desired finish was the mass finishing operation.
As mentioned previously, time in the mass finisher was one of the variables and therefore this
operation was repeated. The part was finished for a total of 7 times: 0, 0.5, 1, 4, 10, 30, and 60
minutes. The part was finished using a spin speed of 50%. A pyramid shaped abrasive media was
chosen for the experiment so that the surfaces would become increasingly rough with increasing

~ 11 ~
time. After each interval of finishing, the part was removed, rinsed with water and then
measured.
The tumbling in the mass finisher gave us our first scale of interaction for the experiment
which was time. Later this would be compared with the other scales to identify where the best
correlations were.
4.2.2.2 Measurement
After each mass finishing operation, the part then had to be measured using the Olympus
LEXT confocal laser scanning microscope. The actual data used for the experiment came from
measurements taken with the 100x objective on the microscope; however, measurements using
the 20x and 50x objective were also taken for comparison purposes. Roughly four measurements
were taken with the 100x objective for each interval, to ensure the target area was being
measured. Measurements taken on the LEXT were analyzed using both the LEXT software, as
well as, SFrax in order to get relative area calculations.
For analysis on the LEXT, all measurements were first filtered using the standard
filtering in the software. All measurements were put through an inclination filter, curved surface
correction filter and a flat surface spike removal filter before taking any data. For Sa calculations
a cutoff value, λc, of 800 µm was selected. Roughly ten tine profiles in the x direction were taken
for each measurement and then averaged to acquire the average Ra’s for each time interval. Sa
data was also taken from each of the measurements and averaged to obtain the average Sa for
each time interval of mass finishing operations.
In order to obtain a more accurate and relative set of data on the surface characterization,
we utilized the area-scale analysis software SFrax. Using this software we were able to import
the measurements from the LEXT and run several analyses such as relative area and complexity
~ 12 ~
calculations. Although we did correlate the average Ra’s with reflectivity, we wanted to also
correlate the relative areas because this had never been done before. During the area scale
analysis, instead of averaging the data from each measurement, the measurements themselves
were averaged within the software and then the data was taken from that. This allowed us to
quickly gather area scale and complexity data that could be correlated to the reflectivity data.
The area scale analysis resulted in another scale of interaction. The different scales which
were analyzed during the area scale analysis output different relative areas. In order to eventually
find the best correlations we would have to determine which scales to look in.
4.2.2.3 Performance
The final area of the experiment was the performance of the work piece, or in our case,
the reflectivity. Although it was separate, the reflectivity measurements ran concurrent to the
surface roughness measurements. Therefore, after each mass finishing operation, the work piece
was measured for both roughness and reflectivity before it was finished for the next interval of
time.
The device used for the reflectivity measurements was an Olympus USPM RU-III micro
spectrophotometer. The data output from the device is a percentage of light returned for each
wavelength of the visible spectrum (380-780 nm).
Roughly 30 different points were measured for each interval, within the area designated
earlier before mass finishing. Outliers were removed and the remaining data points were then
averaged for each wavelength, resulting in the average reflectivity for each time interval over the
range of wavelengths. This resulted in the last scale of interaction: wavelength. We now also had
to determine which of the 400 wavelengths would show the best correlation with surface
roughness.

~ 13 ~
Figure 2: Roughness-Reflectivity Methods
4.3 Analysis
4.3.1 Roughness and Reflectivity Correlation
Three main tools were used in the analysis of the data measured during the roughness and
reflectivity experiment: LEXT OLS 4000 software, SFrax, Excel, and MATLAB. As mentioned
earlier, the standard Ra and Sa values were measured using the Olympus software, but were used
only to show a simple outline of how roughness changes with time in the mass finisher. The
majority of the analysis came from SFrax and Excel.
After both the reflectivity and relative area (and complexity) data was organized, we
began to make correlations In SFrax between relative area and reflectivity. At first this required
manually selecting different wavelengths to test and then inputting that data into the variable
correlation analysis tool in SFrax. Based off of this method we were able to identify the best
correlation was at 405 nm at a scale of 2 µm2. This method of manually analyzing each scale and
wavelength would take far too much time, however, so we needed a faster way to test each
possibly pairing and return its R2.
~ 14 ~
We did this by entering all of the data calculated in SFrax into Excel and using the RSQ
function to correlate every single roughness for each scale with all reflectivity’s at each
wavelength. We then entered all of that data into MATLAB, which was able to produce a 3D
plot of all correlations versus scale and wavelength. At this point, we had an overall picture of
how well roughness and reflectivity were correlated.
5. Results
5.1 Estimation of Media Forces
Initial calculations for the media cutting forces were completed using a Vickers hardness
test. A sample piece of Aluminum (6061 T6) was tested in the mass finisher for a time of 30 s.
The Vickers hardness was then taken on the work hardened surface yielding a HV=124 (using a
force of 10 g over 5 s.).
Equation 1
Assuming that the abrasive in the media has diamond geometry, we used the following
equation to calculate the normal forces, where F is in Newton’s and d is in mm.
Data taken from scratch depth/width measurements were used for “d” (equation above).
These measurements were obtained using line profile measurement tools within the LEXT
software.
• A total of 11 scratches were measured
• An average of 7 width, depth and area measurements were taken for each scratch
~ 15 ~
• The scratches examined were the deepest scratches in isolated areas
5.2 Reflectivity Correlation
As mentioned in the Methods Section we mass finished the Pieces for a grand total of 7
different times, including the initial turned surface. The following Images are the images taken
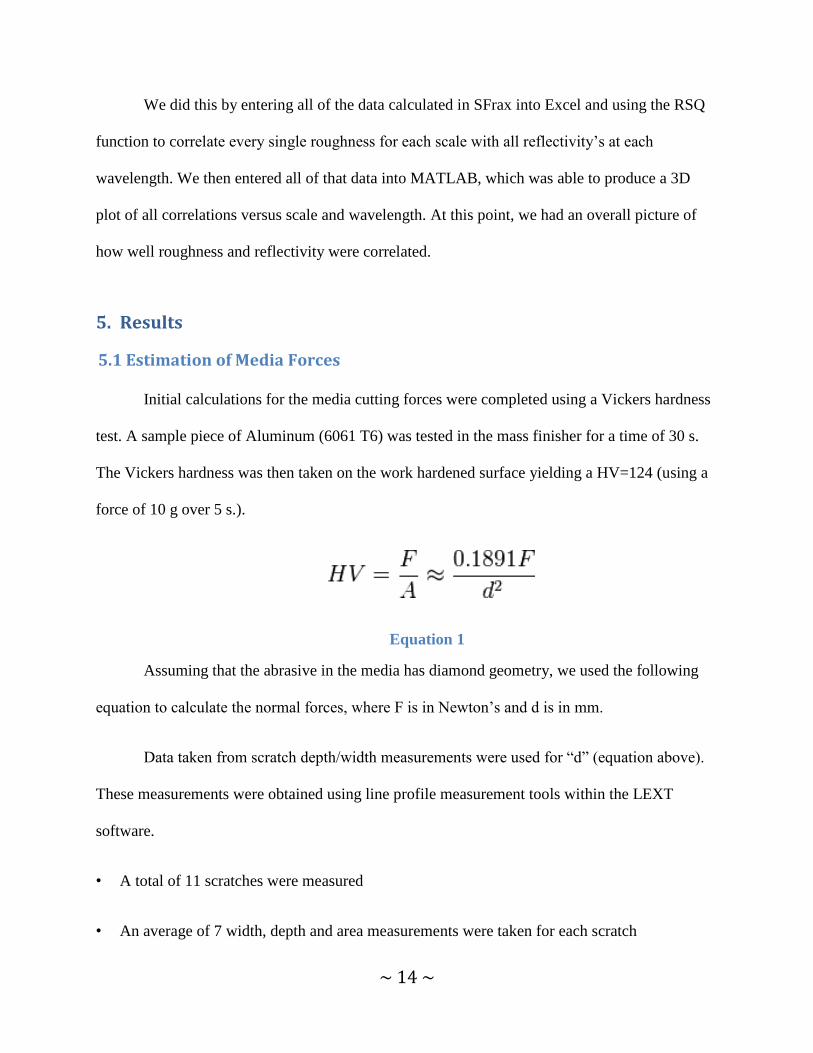
from the Olympus LEXT Confocal Microscope at a 20x objective.
Figure 3 (Initial Machined Piece at .05mm/rev @ 2000 rpm)
Parameter Mean Value Standard Deviation
Scratch Depth 0.399 µm 0.180 µm
Scratch Width 5.396 µm 1.337 µm
Scratch Cross-Sectional
Area
2.204 µm2 0.790 µm
2
Vickers Hardness 124.0 HV10g 6.555 HV10g
Normal Force 19.09 mN -
Table 1: Summary of Scratch Depths and Forces
~ 16 ~
It is clear from this image that the machining marks are still visible. However, due to the
very small feed rate of the tooling the surface is still very smooth.
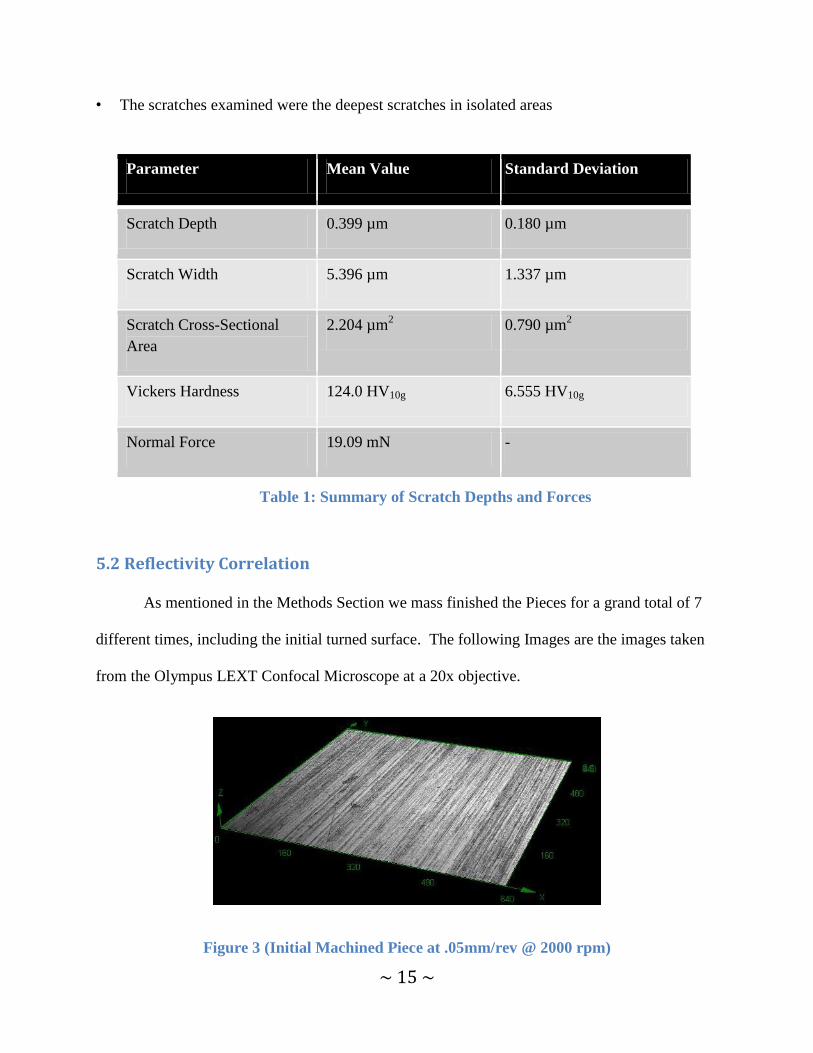
Figure 4 (Piece after 0.5min of Mass Finishing)
After only 30s (or .5 min) in the mass finisher deep scratches have begun to form on the
surface as a result of the action of the media on the part.
Figure 5 (Piece after 1 min of Mass Finishing)
After an additional 30s in the mass finisher many more scratches have formed and the
machining marks have begun to disappear.

~ 17 ~
Figure 6 (Piece after 4 min of Mass Finishing)
After 4 minutes in the mass finisher the machining marks have been completely obscured
by the action of the media.
Figure 7 (Piece after 10 min of Mass Finishing)
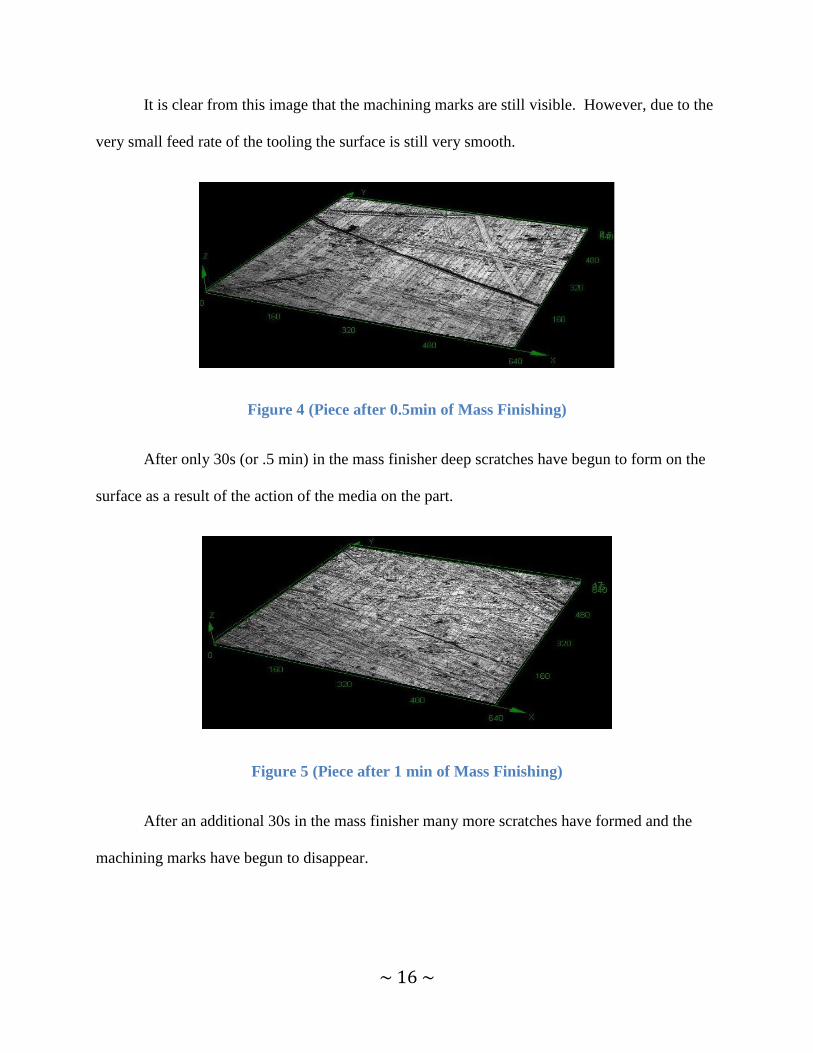
After 10 minutes of mass finishing little can be distinguished from a visual inspection of
the images which were generated from the Confocal Microscope. There is little that visually
distinguishes the surfaces from here to the hour mark. However, the behavior of these surfaces is
quite different.
~ 18 ~
Figure 8 (Piece after 30 min of Mass Finishing)
Figure 9 (Piece after 60 min of Mass Finishing)
~ 19 ~
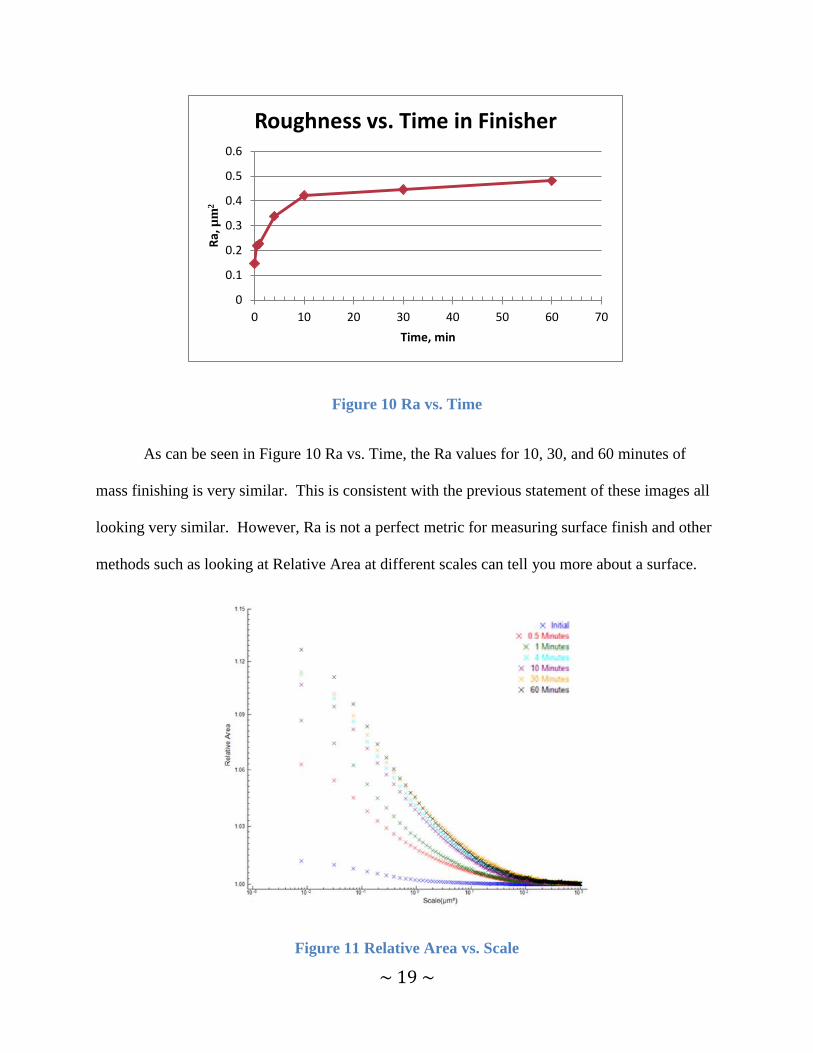
Figure 10 Ra vs. Time
As can be seen in Figure 10 Ra vs. Time, the Ra values for 10, 30, and 60 minutes of
mass finishing is very similar. This is consistent with the previous statement of these images all
looking very similar. However, Ra is not a perfect metric for measuring surface finish and other
methods such as looking at Relative Area at different scales can tell you more about a surface.
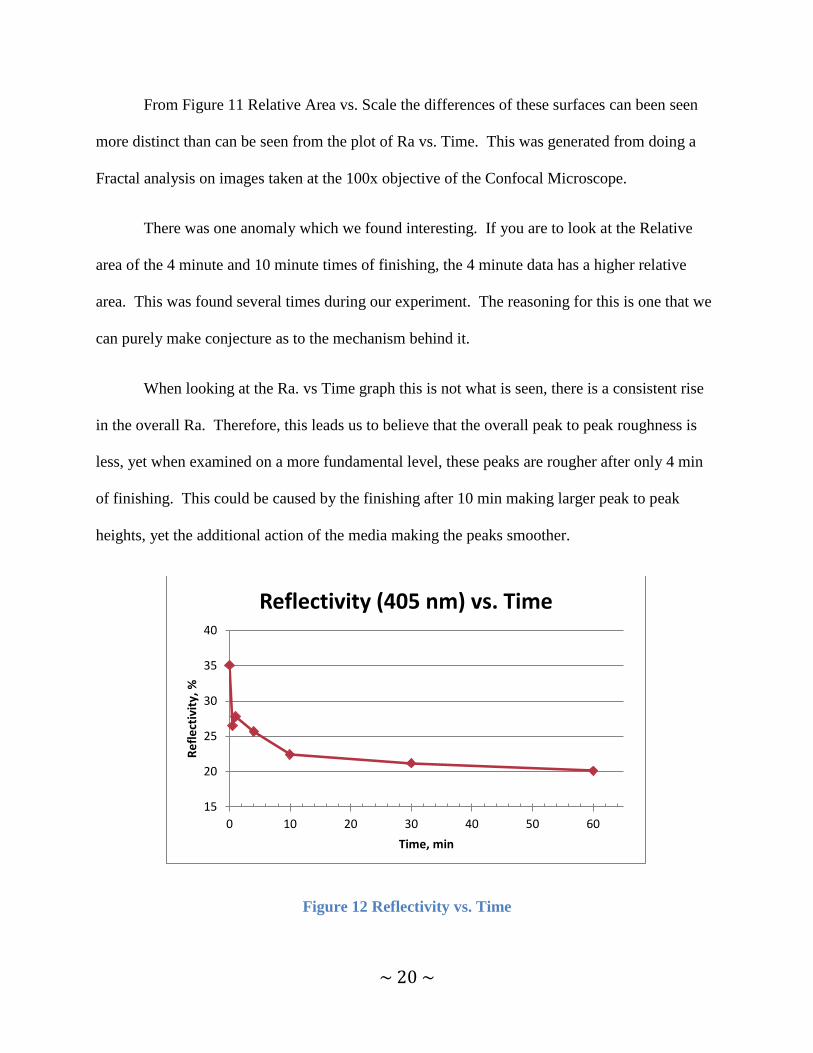
Figure 11 Relative Area vs. Scale
0
0.1
0.2
0.3
0.4
0.5
0.6
0 10 20 30 40 50 60 70
Ra,
µm
2
Time, min
Roughness vs. Time in Finisher
~ 20 ~
From Figure 11 Relative Area vs. Scale the differences of these surfaces can been seen
more distinct than can be seen from the plot of Ra vs. Time. This was generated from doing a
Fractal analysis on images taken at the 100x objective of the Confocal Microscope.
There was one anomaly which we found interesting. If you are to look at the Relative
area of the 4 minute and 10 minute times of finishing, the 4 minute data has a higher relative
area. This was found several times during our experiment. The reasoning for this is one that we
can purely make conjecture as to the mechanism behind it.
When looking at the Ra. vs Time graph this is not what is seen, there is a consistent rise
in the overall Ra. Therefore, this leads us to believe that the overall peak to peak roughness is
less, yet when examined on a more fundamental level, these peaks are rougher after only 4 min
of finishing. This could be caused by the finishing after 10 min making larger peak to peak
heights, yet the additional action of the media making the peaks smoother.
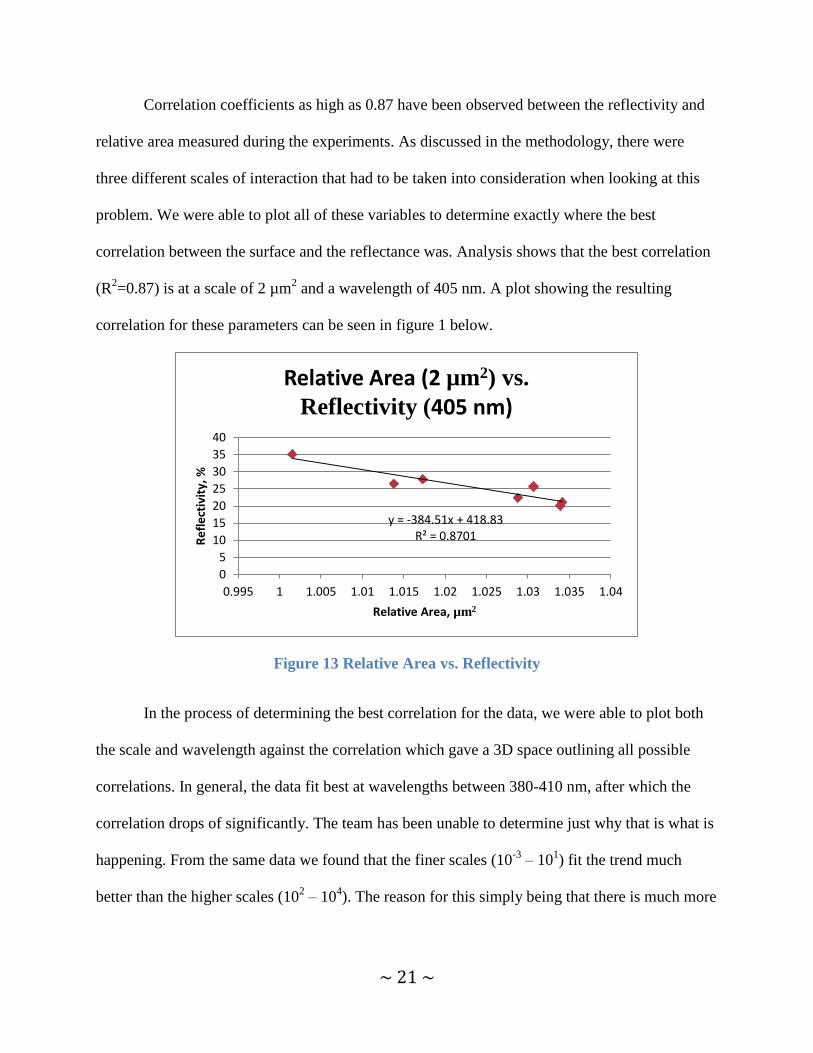
Figure 12 Reflectivity vs. Time
15
20
25
30
35
40
0 10 20 30 40 50 60
Re
fle
ctiv
ity,
%
Time, min
Reflectivity (405 nm) vs. Time
~ 21 ~
Correlation coefficients as high as 0.87 have been observed between the reflectivity and
relative area measured during the experiments. As discussed in the methodology, there were
three different scales of interaction that had to be taken into consideration when looking at this
problem. We were able to plot all of these variables to determine exactly where the best
correlation between the surface and the reflectance was. Analysis shows that the best correlation
(R2=0.87) is at a scale of 2 µm
2 and a wavelength of 405 nm. A plot showing the resulting
correlation for these parameters can be seen in figure 1 below.
Figure 13 Relative Area vs. Reflectivity
In the process of determining the best correlation for the data, we were able to plot both
the scale and wavelength against the correlation which gave a 3D space outlining all possible
correlations. In general, the data fit best at wavelengths between 380-410 nm, after which the
correlation drops of significantly. The team has been unable to determine just why that is what is
happening. From the same data we found that the finer scales (10-3
– 101) fit the trend much
better than the higher scales (102 – 10
4). The reason for this simply being that there is much more
y = -384.51x + 418.83 R² = 0.8701
0
5
10
15
20
25
30
35
40
0.995 1 1.005 1.01 1.015 1.02 1.025 1.03 1.035 1.04
Re
fle
ctiv
ity,
%
Relative Area, µm2
Relative Area (2 µm2) vs.
Reflectivity (405 nm)
~ 22 ~
noise/variance in the relative area calculations at these higher scales so the data is jumbled and
not accurate.
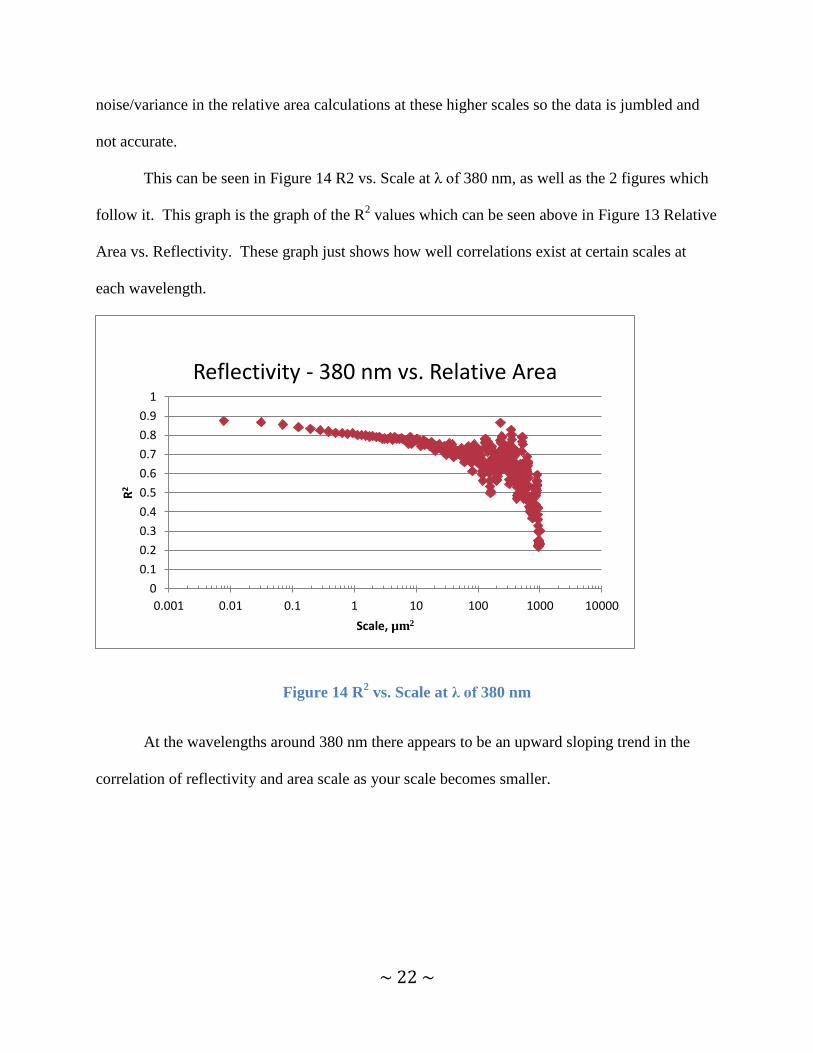
This can be seen in Figure 14 R2 vs. Scale at λ of 380 nm, as well as the 2 figures which
follow it. This graph is the graph of the R2 values which can be seen above in Figure 13 Relative
Area vs. Reflectivity. These graph just shows how well correlations exist at certain scales at
each wavelength.
Figure 14 R2 vs. Scale at λ of 380 nm
At the wavelengths around 380 nm there appears to be an upward sloping trend in the
correlation of reflectivity and area scale as your scale becomes smaller.
0
0.1
0.2
0.3
0.4
0.5
0.6
0.7
0.8
0.9
1
0.001 0.01 0.1 1 10 100 1000 10000
R2
Scale, µm2
Reflectivity - 380 nm vs. Relative Area

~ 23 ~
Figure 15 R2 vs. Scale at λ of 405 nm
At 405 nm there exists the best correlation at around 2 μm of relating the percentage of
light returned and area scale. It is interesting that this wavelength is also the same wavelength of
light which the laser of the confocal microscope uses during data acquisition. We are not sure if
this fact has true significance in these results; however, reproducing these findings using a
different microscope, which uses a different wavelength, might be a useful experiment to
determine the validity of this finding.
0
0.1
0.2
0.3
0.4
0.5
0.6
0.7
0.8
0.9
1
0.001 0.01 0.1 1 10 100 1000 10000
R2
Scale, µm2
Reflectivity - 405 nm vs. Relative Area

~ 24 ~
Figure 16 R2 vs. Scale at λ of 515 nm
When getting out of the low 400 nm wavelengths the correlations of the data goes down
drastically. This can be see when taking 515 nm as an example. The peak correlation, of any
real significance, is around 0.68 which is far lower than that of 405 @ 0.87.
The preceding graphs are just the 2 axis representation of each wavelength. This then
lead us to wondering what the 3 dimension space would look like when all the wavelengths are
plotted together. The result of this can be seen in Figure 17 Wavelength vs. Scale vs. R2.
0.00
0.10
0.20
0.30
0.40
0.50
0.60
0.70
0.80
0.90
1.00
0.001 0.01 0.1 1 10 100 1000 10000
R2
Scale, µm2
Reflectivity - 515 nm vs. Relative Area

~ 25 ~
Figure 17 Wavelength vs. Scale vs. R2
It is very apparent from this graph of the 3D space that the correlations of Area Scale and
the larger wavelengths is virtually non-existent, while at the shorter wavelengths very good
correlations exist.
Another aspect of this graph which is intriguing is the local maximums and minimums
that exist between ~400-550 nm. This upward and downward movement of the correlation is an
aspect of the behavior which we do not understand.
6. Discussion
1. After plotting all of our data together, we were able to pinpoint where exactly the best
correlation was between shininess and relative area. An R2=0.87 was observed at a scale
of 2 µm2 and wavelength of 405 nm. From this the following equation was obtained:
~ 26 ~
Although this was the best correlation, the wavelengths and scales immediately
surrounding 2 µm2 and 405 nm also show similar correlations. These can be found in
Appendix A.
2. During the experiment a Ra measurement was taken after each interval of time in the
mass finisher. From this data we were able to develop a correlation between time in the
finisher and Ra. We found that the Ra leveled off after 10 minutes in the finisher. This
data should help with processing improvements.
3. The plot of R2 vs. Scale vs. Wavelength is shown in Figure 17 Wavelength vs. Scale vs.
R2. Clearly the best correlations are at both lower scales and wavelengths. Although there
appear to be correlations at the larger scales, this is not the case. The accuracy of relative
area calculations drops off significantly at higher scales, therefore that data can be
ignored. Knowing exactly what wavelengths and scales to consider when taking
measurements will be a benefit for any application using these methods.
4. During the course of the experiment it was discovered that the wavelength of light used
by the reflectivity machine to obtain the best correlation (405 nm) was the same
wavelength used by the laser on the confocal microscope used to take the measurements.
We have no explanation for this occurrence, nor is there any indication whether it has had
an effect on the results of the experiment. It has simply been recognized as an interesting
phenomenon and needs further attention.
5. Based on data measured from the confocal microscope we obtained an average scratch
size put on the part from the mass finishing operation. We combined this data with other
measurements taken of the media geometry, as well as, Vickers hardness tests. Using the
~ 27 ~
Archard equation we calculated the average normal force of a piece of media on the work
piece.
6. We have recognized the need for further research to be performed on this subject. First,
attention is needed to determine if the wavelength of the laser microscope has any effect
on the results of the experiment. Next, the project team will conduct further research in
the near future to repeat the experiment. In doing so we will be able to correct any
mistakes made in the original experiment and test for repeatability. In addition, testing
with different materials is of further interest.
7. Conclusions
1. Correlations between relative area and reflectivity (percentage of light returned) were
discovered. The best correlation was found at a scale of 2 µm2 and wavelength of 405
nm. The best correlation obtained was with an R2 = 0.87.
2. A correlation between roughness measured with the confocal microscope and time in the
mass finisher was discovered. The relationship appears to follow a logarithmic curve.
3. There is a clear pattern in the correlation coefficient, R2, between relative area and
reflectivity based on the scale and the wavelength. Relative area and reflectivity are best
correlated with both decreasing wavelength and scale.
4. The wavelength used by the confocal microscope’s laser (405 nm) is the same
wavelength at which we found the best correlation between reflectivity and relative area.
5. Based on scratch depth measurements, media geometry and hardness tests a value for the
average normal force of media on a part was calculated. The average normal force is
19.09 mN.

~ 28 ~
~ 29 ~
8. References 1. Alviti, S., 2007. Take 'Em for a Spin. Products Finishing, pp. 22-25.
2. Archard, J., 1953. Contact and Rubbing of Flat Surfaces. Journal of Applied Physics, pp. 981-988.
3. Bennett, H.E. & Porteus, J.O., 1961. Relation Between Surface Roughness and Specular
Relflectance at Normal Incidence. Journal of the Optical Society of America, pp. 123-129.
4. Cariapa, V. et al., 2007. Development of a Metal Removal Model Using Spherical Ceramic Media
in a Centrifugal Disk Mass Finishing Machine. International Journal of Advanced Manufacturing
Technology, pp. 92-106.
5. Davidson, D., 2006. Mass Finishing Processes. Foundry Management and Technology, pp. 104-
117.
6. Domblesky, J., Evans, R. & Cariapa, V., 2004. A Material Removal Model for Vibratory Finishing.
International Journal of Production Research, pp. 1029-1041.
7. Grigoroudis, K. & Stephenson, D., 1997. Modeling Low Stress Abrasive Wear. Wear, pp. 103-111.
8. Li, H & Torrance, K.E., 2005. An Experimental Study of the Correlation Between Surface
Roughness and Light Scattering for Rough Metallic Surfaces. Cornell University.
9. Mulhearn, T. & Samuels, L., 1962. The Abrasion of Metals: A Model of the Process. Wear, pp.
478-498.
10. Shipulski, E.M. & Brown, C.A., 1994. A Scale-Based Model for Reflectivity. Fractals, pp. 413-416.
11. Suh, N. P., 1990. The Principles of Design. s.l.:Oxford University Press.

~ 30 ~
Appendix A
Results at Roughest Finish
Figure 18: 380 nm for roughest surface
Figure 19 390 nm for roughest surface
~ 31 ~
Figure 20 630 nm for roughest surface
Complexity Results
Figure 21 Complexity Correlation vs. Scale @ 380 nm
~ 32 ~
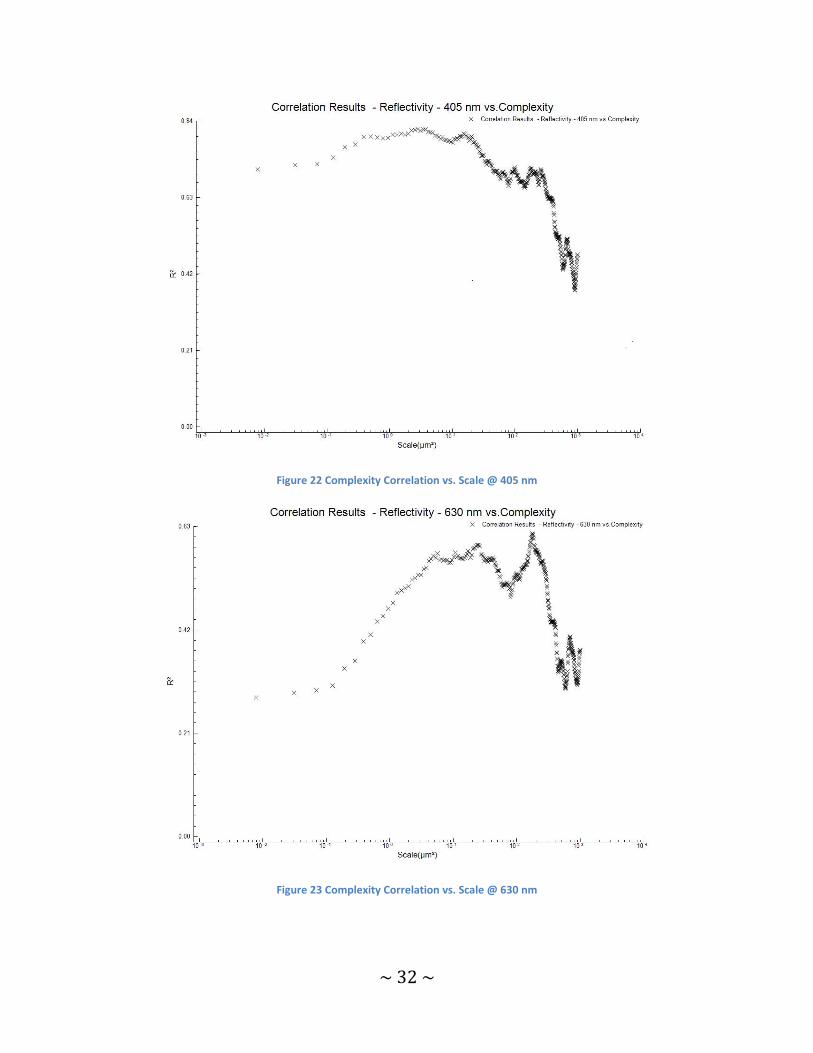
Figure 22 Complexity Correlation vs. Scale @ 405 nm
Figure 23 Complexity Correlation vs. Scale @ 630 nm

~ 33 ~
Appendix B
Mass Finisher Design Component
The purpose of this aspect of the project is to satisfy the Mechanical Systems Design
aspect of the Worcester Polytechnic Institute Bachelors of Science in Mechanical Engineering
program.
For this aspect of the project, an add on to the current mass finisher was designed. This
was done through an Axiomatic Design process modeled after the work of Nam P Suh. The
purpose of this is to simplify the design and justify all aspects of the design.
The purpose of the design is to extract parts from the mass finisher in such a way that all
parts would be removed at the same time in such a way that the removal of all the media in the
mass finisher is not necessary.
~ 34 ~
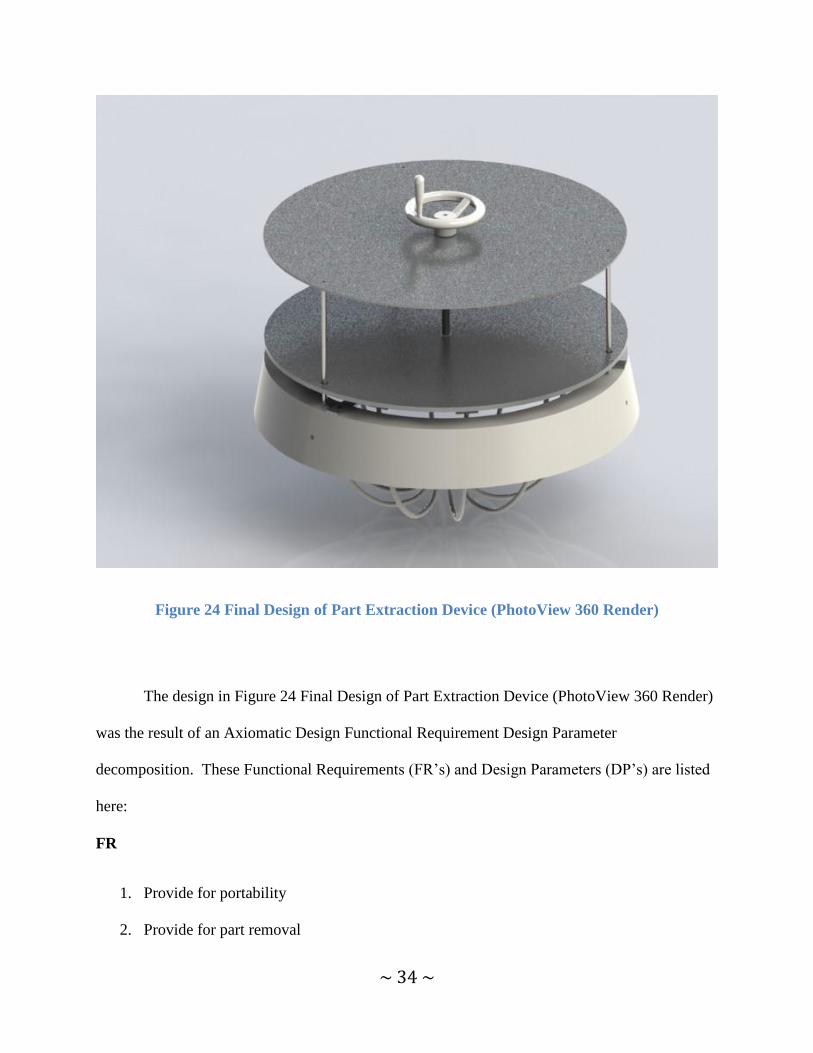
Figure 24 Final Design of Part Extraction Device (PhotoView 360 Render)
The design in Figure 24 Final Design of Part Extraction Device (PhotoView 360 Render)
was the result of an Axiomatic Design Functional Requirement Design Parameter
decomposition. These Functional Requirements (FR’s) and Design Parameters (DP’s) are listed
here:
FR
1. Provide for portability
2. Provide for part removal
~ 35 ~
3. Provide for media to remain in finisher
4. Provide for extraction of parts in ranges of media where parts will exist in Mass Finisher
5. Provide for securing to finisher during extraction
6. Provide for all parts to be removed at the same time
7. Provide for no unwanted axis’s of movement of moving parts
DP
1. Have a ring which can be picked up
2. Finger like devices move through media
3. Fingers vibrate to ensure media does not come out
4. Fingers will move along an arc path to remove parts
5. Device must clamp to rim of mass finisher
6. Device will use lead screw to drive in all finger mechanisms
7. Device will move downward in a fashion that only allows downward by use of guide
rails, and the finger mechanisms will only be allowed to move along their arched path by
channels
In this, each numbered FR corresponds to the DP with the same number.
The rationale behind each of these is that:
1. It must be easy to carry
2. The purpose of this design is to remove parts from the mass finisher
3. Dumping the Media out of the Mass Finisher is time consuming and messy
4. The parts only end up along certain parts of the media stream, and therefore anything
more than this is wasted

~ 36 ~
5. Securing the Part to the Finisher provides a stable platform for removal
6. If all the parts are removed at the same time you can ensure that no parts will be over
finished because they get missed by the device.
7. Any unwanted axis’s of movement will not allow for proper removal
Figure 25 Acclaro Screen Shot
Above is an image taken from Acclaro, which is my FR DP decomposition in matrix
form. This shows a Triangular matrix, which means that the design is “partially coupled” due to
an issue I foresaw in FR’s 2&3. Therefore I adjusted my design accordingly to avoid any
interference in the overall design. However, not the most ideal case, a partially coupled design is
far better than a completely coupled design, but less ideal than an uncoupled design.
~ 37 ~
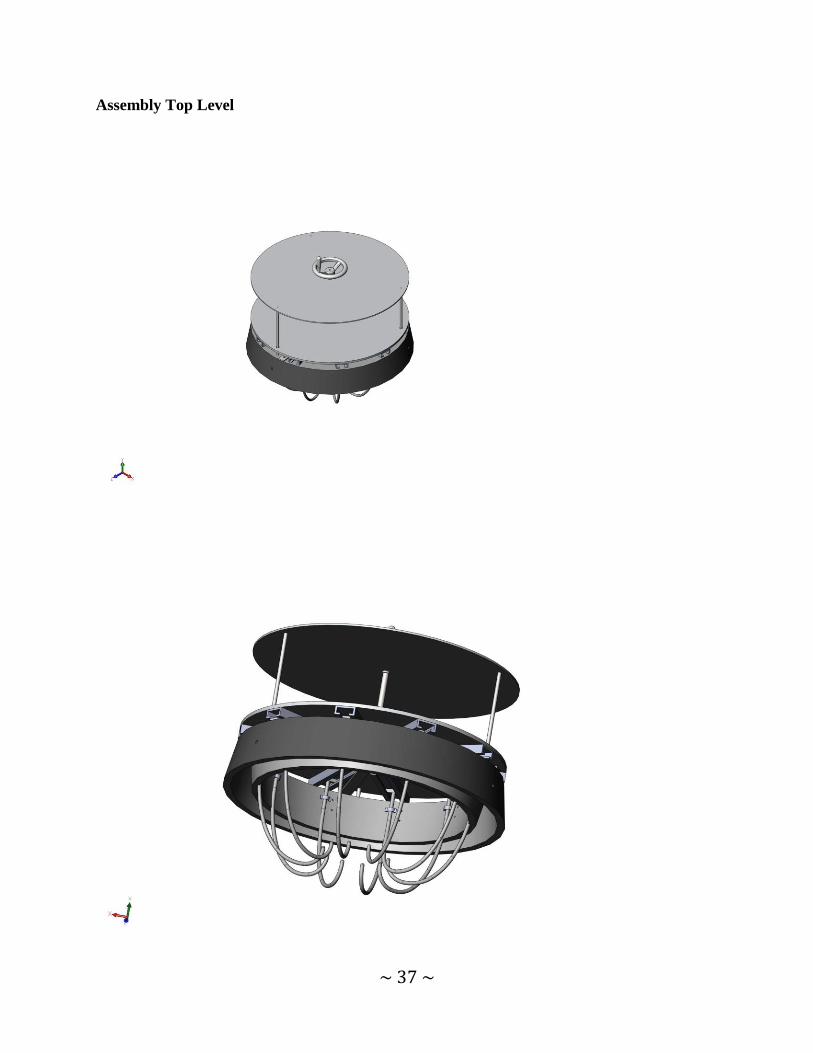
Assembly Top Level
~ 38 ~
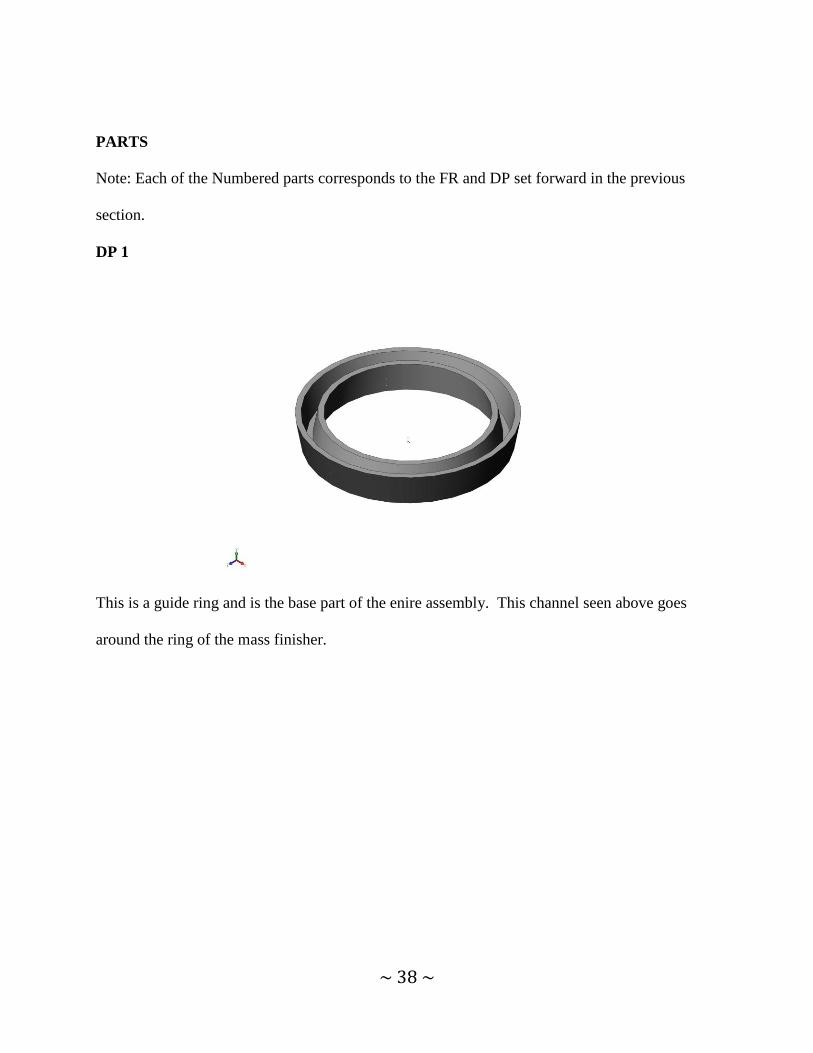
PARTS
Note: Each of the Numbered parts corresponds to the FR and DP set forward in the previous
section.
DP 1
This is a guide ring and is the base part of the enire assembly. This channel seen above goes
around the ring of the mass finisher.
~ 39 ~
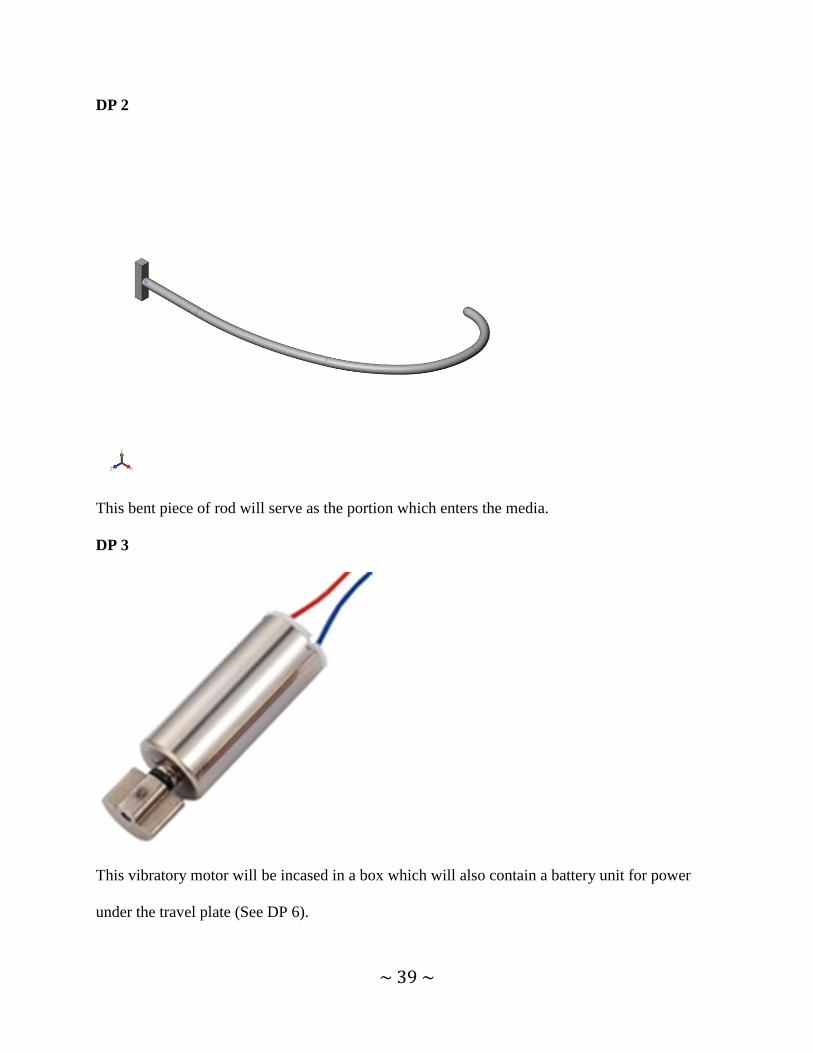
DP 2
This bent piece of rod will serve as the portion which enters the media.
DP 3
This vibratory motor will be incased in a box which will also contain a battery unit for power
under the travel plate (See DP 6).

~ 40 ~
DP 4
This finger like mechanism is the part which goes into the media to remove the parts and the
curvature of the part ensures its motion.
DP 5
~ 41 ~
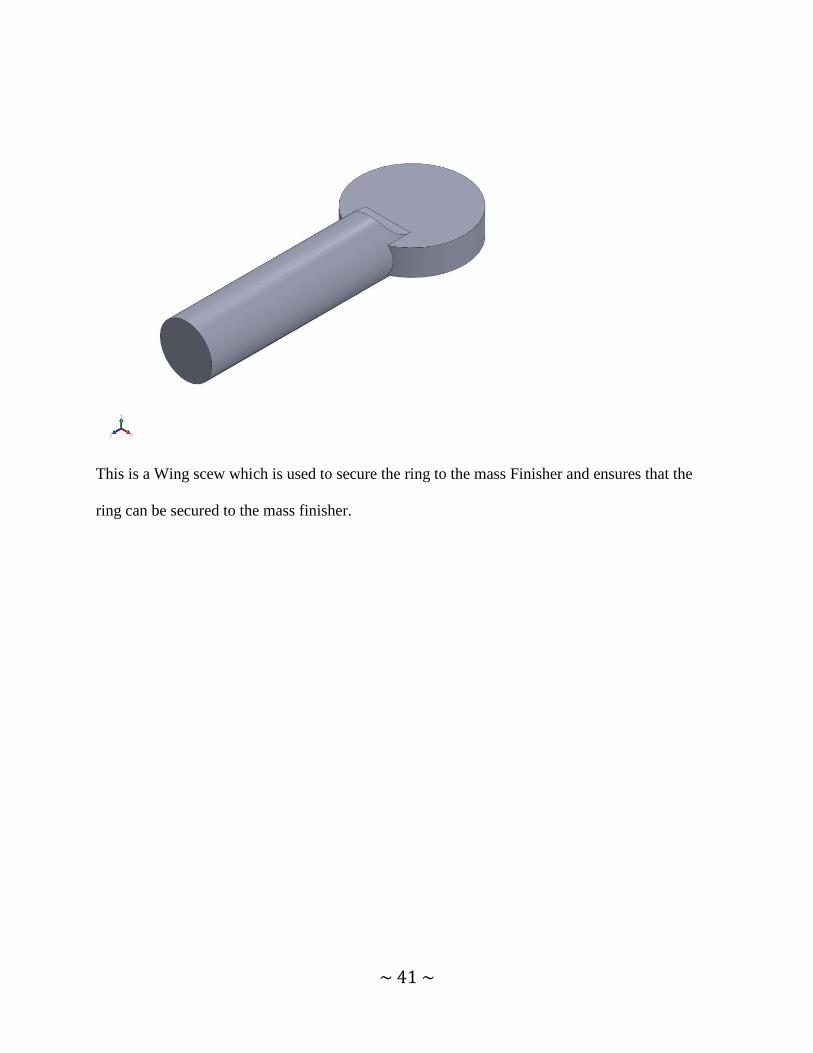
This is a Wing scew which is used to secure the ring to the mass Finisher and ensures that the
ring can be secured to the mass finisher.
~ 42 ~
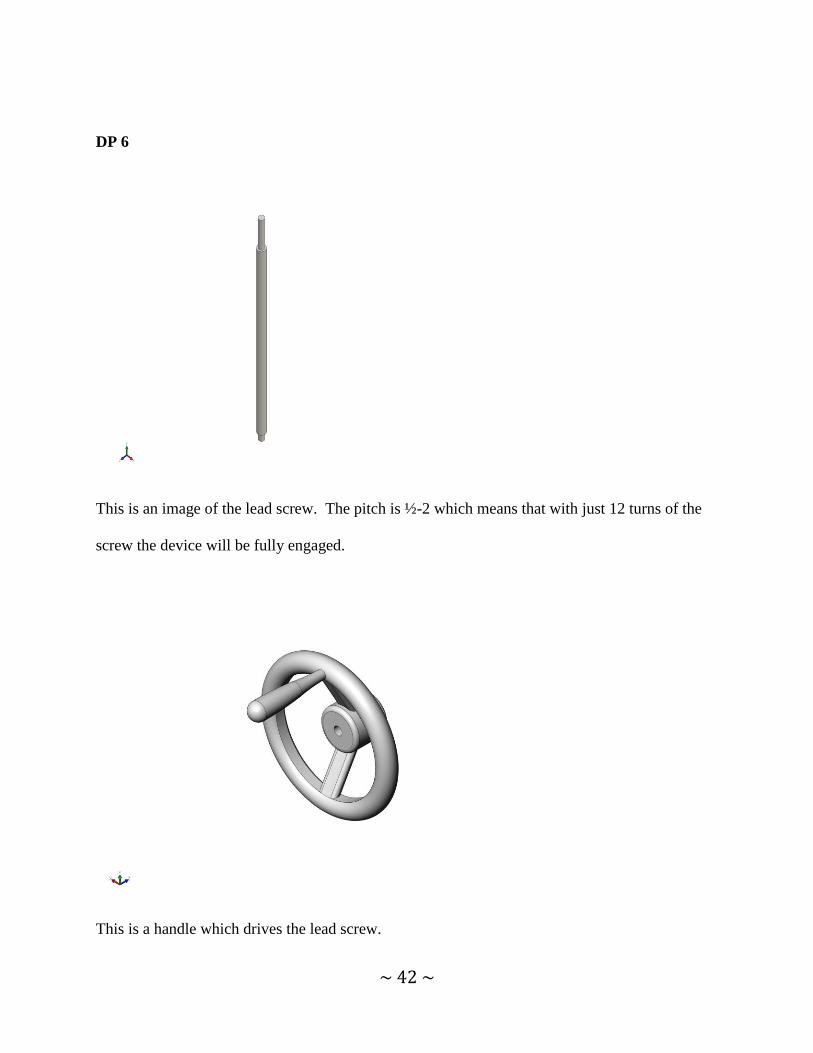
DP 6
This is an image of the lead screw. The pitch is ½-2 which means that with just 12 turns of the
screw the device will be fully engaged.
This is a handle which drives the lead screw.
~ 43 ~
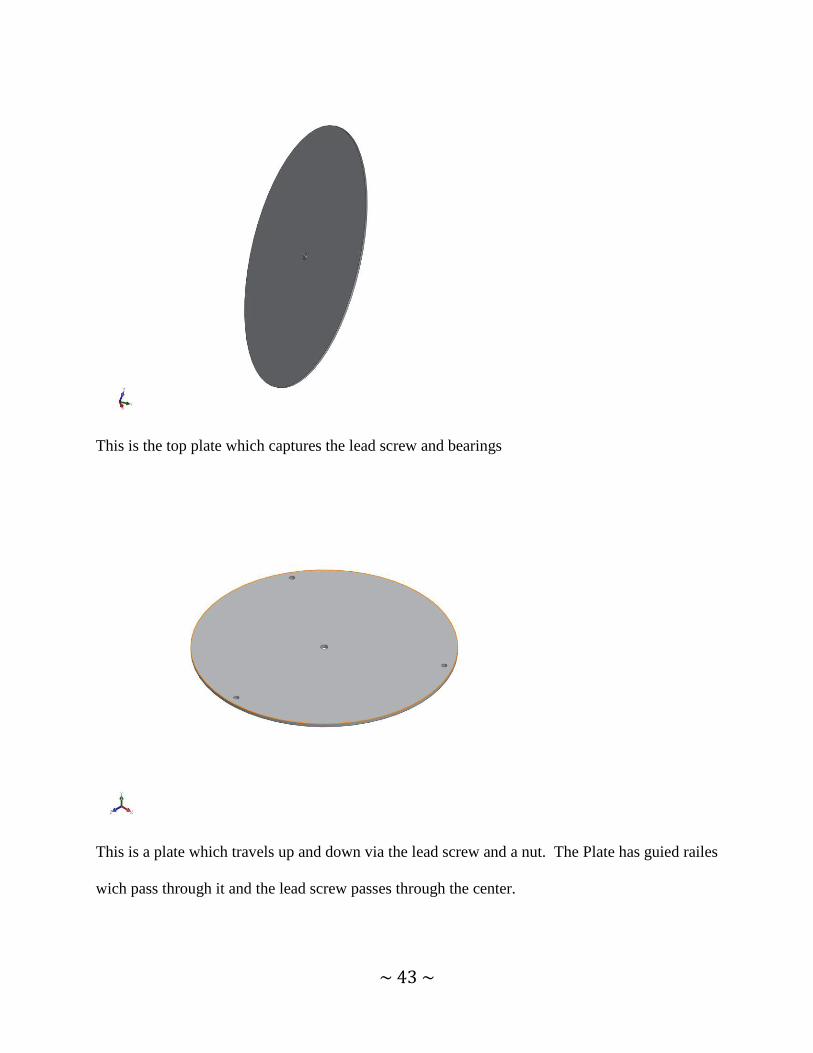
This is the top plate which captures the lead screw and bearings
This is a plate which travels up and down via the lead screw and a nut. The Plate has guied railes
wich pass through it and the lead screw passes through the center.
~ 44 ~
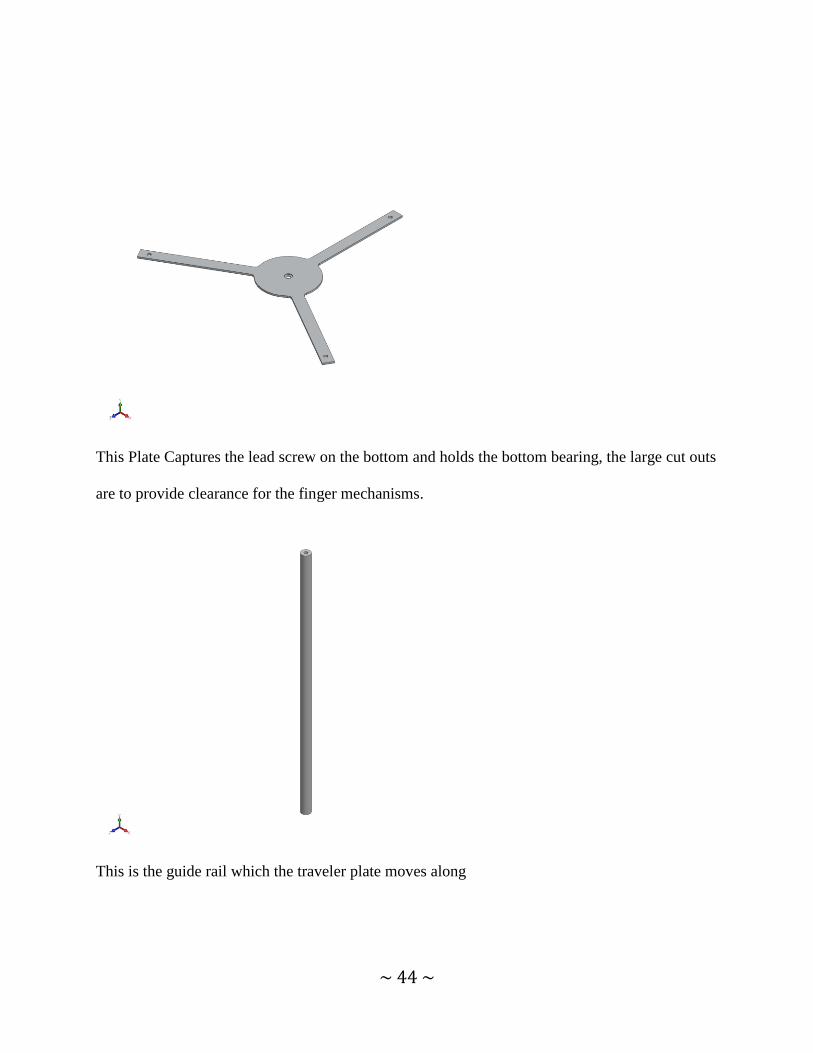
This Plate Captures the lead screw on the bottom and holds the bottom bearing, the large cut outs
are to provide clearance for the finger mechanisms.
This is the guide rail which the traveler plate moves along
~ 45 ~
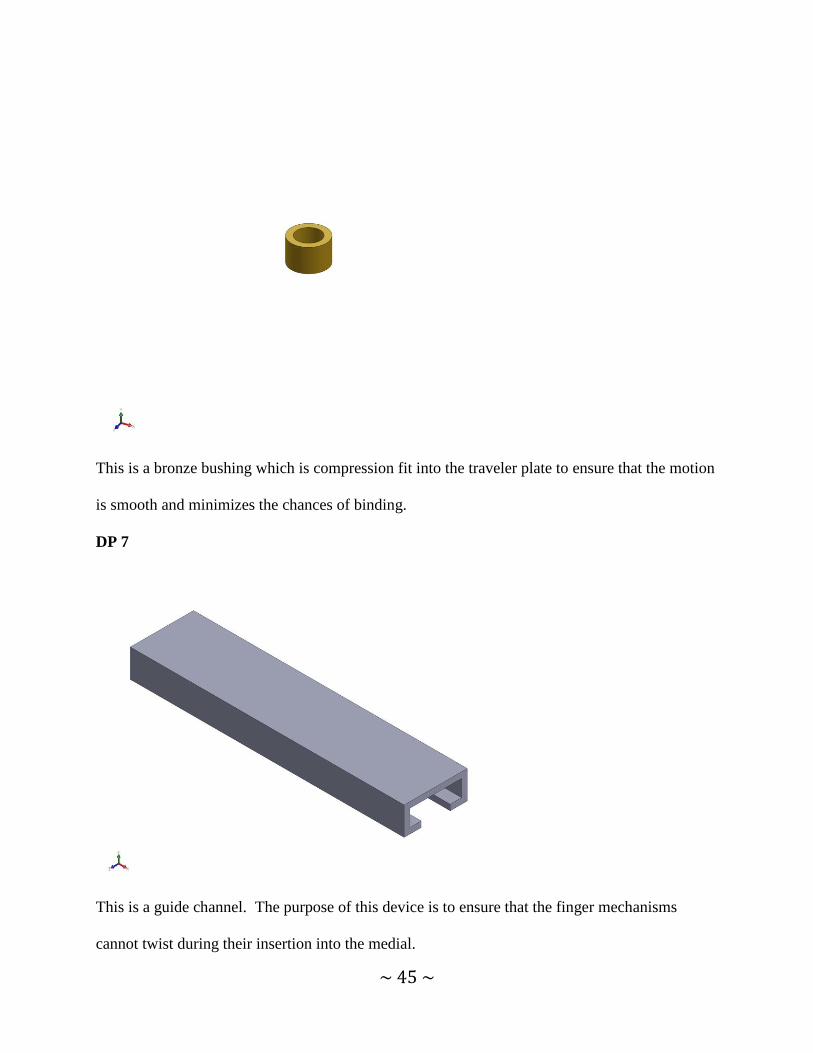
This is a bronze bushing which is compression fit into the traveler plate to ensure that the motion
is smooth and minimizes the chances of binding.
DP 7
This is a guide channel. The purpose of this device is to ensure that the finger mechanisms
cannot twist during their insertion into the medial.
~ 46 ~
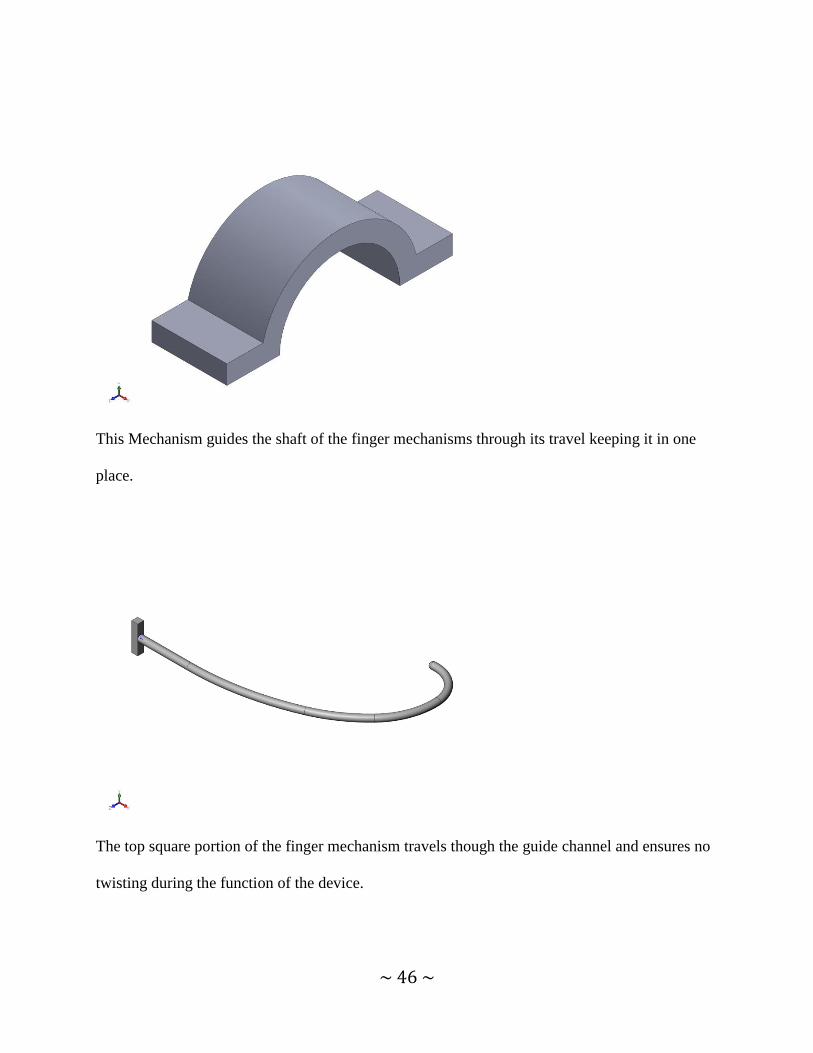
This Mechanism guides the shaft of the finger mechanisms through its travel keeping it in one
place.
The top square portion of the finger mechanism travels though the guide channel and ensures no
twisting during the function of the device.
~ 47 ~
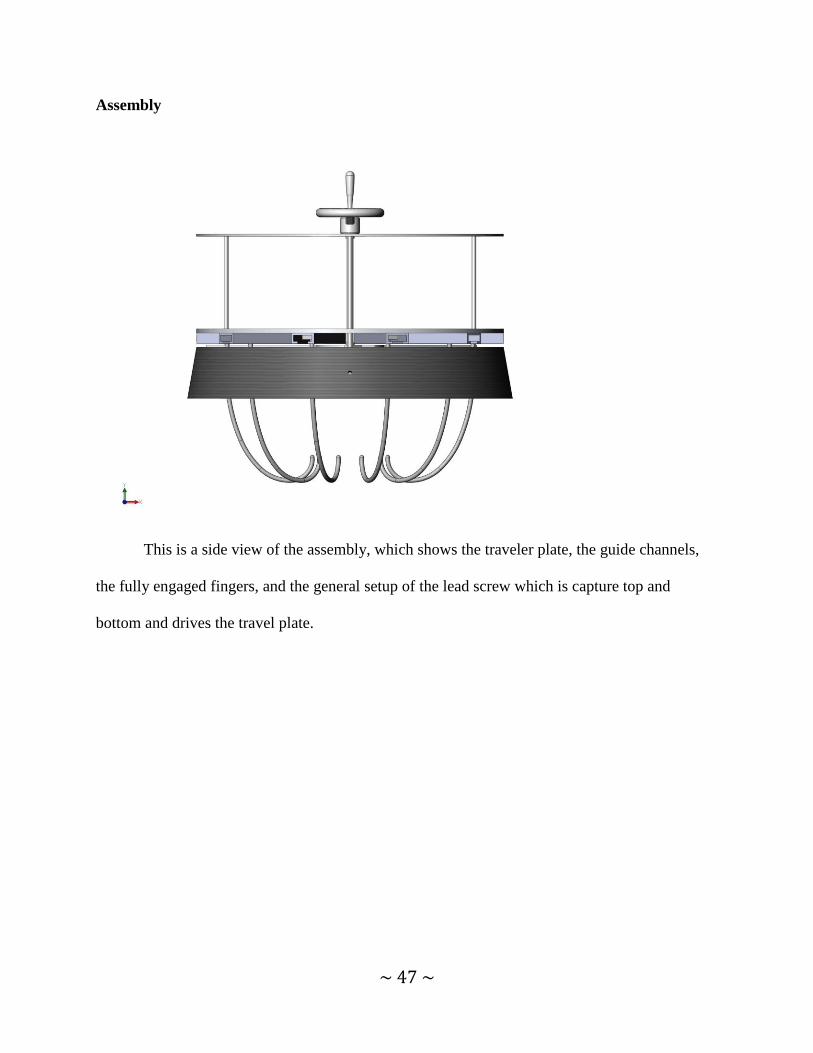
Assembly
This is a side view of the assembly, which shows the traveler plate, the guide channels,
the fully engaged fingers, and the general setup of the lead screw which is capture top and
bottom and drives the travel plate.