rotork plc 2018 full year results · 1 rotork plc 2018 full year results 2018 2017 % change occ 2 %...
TRANSCRIPT

1
Rotork plc 2018 Full Year Results
2018 2017 % change OCC 2 % change
Order intake3 £681.7m £666.5m +2.3% +5.4%
Revenue £695.7m £642.2m +8.3% +11.3%
Adjusted1 operating profit £146.0m £130.2m +12.2% +14.8%
Adjusted1 operating margin 21.0% 20.3% +70bps +60bps
Profit before tax £120.7m £80.6m +49.8% +53.8%
Adjusted1 profit before tax £143.8m £124.8m +15.3% +17.9%
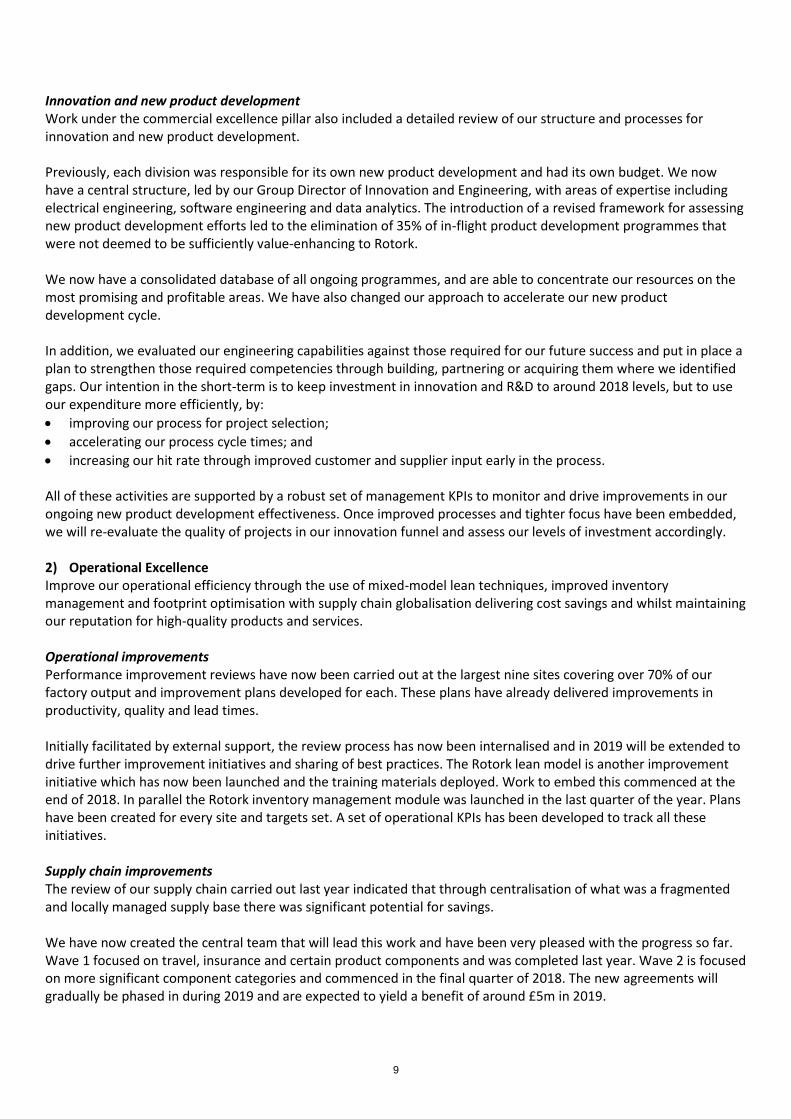
Basic earnings per share 10.5p 6.4p +64.1% +69.5%
Adjusted1 basic earnings per share 12.6p 10.6p +18.9% +21.7%
Full year dividend 5.90p 5.40p +9.3%
1 Adjusted figures exclude the amortisation of acquired intangible assets and other adjustments (see note 2). 2 OCC is organic constant currency results excluding acquisitions and disposals and restated at 2018 exchange rates. 3 Order intake represents the value of orders received during the period.
Summary
• Strong OCC revenue growth, up 11.3%
• Adjusted operating margin improved to 21.0%
• ROCE increased 430bps to 29.2%
• Cash conversion of 110.7%
• Net cash of £43.6m at year end
• Growth Acceleration Programme proceeding at pace in H2:
- 160bps improvement in working capital to sales
- Revenue per head up 7.5%; adjusted operating profits per head up 11.3%
- Supply chain improvements yielding benefits
- Centralised new product development structure
Kevin Hostetler, Chief Executive, commenting on the results, said:
“This is a very exciting period for Rotork. We have mapped out and are now executing a comprehensive plan to
return Rotork to the levels of growth and margin performance previously experienced by the Group, and to do this on
a sustainable basis throughout the cycle.
“We have assembled a capable management team, comprising new and existing talent. We have a strong balance
sheet, with opportunities to improve on an already strong track record of cash generation, providing scope to further
accelerate progress.
“Following double-digit OCC revenue growth in 2018, and mindful of macroeconomic uncertainty, we are planning for slower growth in 2019. Based on our current assessment of project phasing, we expect to deliver modest sales growth on an OCC basis in 2019, with lower year on year sales in H1 reflecting the strong comparator period. Margins will benefit from the restructuring plans under our Growth Acceleration Programme and the implementation of additional cost saving initiatives. Overall, we expect full year margins to show progress on 2018.”

2
Rotork plc Tel: +44 (0)1225 733 200
Kevin Hostetler, Chief Executive
Jonathan Davis, Finance Director
Andrew Carter, Investor Relations Director
FTI Consulting Tel: + 44 (0)20 3727 1340
Nick Hasell / Susanne Yule
There will be a meeting for analysts and institutional investors at 8.30 am GMT this morning at the offices of FTI Consulting, 200
Aldersgate, Aldersgate Street, London EC1A 4HD. The presentation will also be webcast (audio only). Please register at
www.rotork.com.
Chairman’s statement 2018 was a busy and productive year for Rotork. The Group delivered a strong financial performance, despite an
increasingly challenging political and macroeconomic environment, and made significant progress with a number of
key strategic initiatives.
As previously reported, towards the end of 2017 we began a series of detailed business reviews examining our routes
to market, innovation funnel, operations footprint, global supply chain, IT infrastructure and our talent base.
Following the appointment in March of Kevin Hostetler as Chief Executive, and the subsequent completion of those
reviews, we formulated a detailed business plan, the objective of which is to return Rotork to the higher levels of
organic growth and operating margins previously experienced by the business. It is an ambitious plan to be
implemented at pace, and we have termed it our Growth Acceleration Programme.
While there has been a great deal of activity across the business, this is not about transforming Rotork, but rather
refining how we do things, building on our strong foundations. Kevin has assembled a strong team, with a wealth of
experience in managing such programmes. Early results in this first phase of the multi-year programme are
encouraging, with strong support for all initiatives across the business. Kevin provides a review of the progress made
in the Growth Acceleration Programme in his report.
Financial highlights
Order intake increased 2.3% on the prior year, or 5.4% on an OCC basis. The strong order intake in the first quarter
was partially offset by lower order intake in the second half reflecting the variation in the timing of project orders and
deliveries compared with 2017. Revenue increased by 8.3% to £695.7m (OCC +11.3%) with the strongest revenue
growth coming from the downstream oil and gas and industrial markets. Upstream and midstream oil and gas and
water grew more modestly whilst sales to power declined. Geographically, the strongest growth was in the Far East,
with all regions apart from the Middle East growing. The Middle East had seen a very active upstream oil and gas
market in the prior year and these projects were not repeated in 2018.
Statutory operating profit increased by 43.0% to £122.9m, adjusted operating profit increased 12.2%, or £15.8m, to
£146.0m (OCC +14.8%) with an adjusted operating margin 70 basis points higher at 21.0% (OCC up 60 basis points at
21.1%). An improved gross margin, increasing 60 basis points to 44.8%, and net overhead increases below the rate of
revenue growth, both contributed to the improved adjusted operating margin. Furthermore, initiatives to reduce
working capital saw a reduction from 29.3% of revenue in the prior year to 27.7% and the balance sheet returned to a
net cash position, with net cash of £43.6m at the year end. These movements combined to produce an improved
return on capital employed of 29.2% (2017: 24.9%).

3
Growth Acceleration Programme
We expect the cash costs of restructuring to be largely self-financed through working capital improvements over the
course of the Growth Acceleration Programme. Investment will be focused on market and product segments offering
the greatest scope for growth and margin improvement, with increased investment in our front-end commercial
activities (in particular key account management), new product development, and site services/aftermarket. Much of
the funding required for this we again expect to be self-generated through cost efficiencies and benefits arising from
the Growth Acceleration Programme. The Board receives regular updates from management on progress with the
Growth Acceleration Programme initiatives.
Board changes
We were delighted to welcome Kevin Hostetler to the Board on 12 February 2018 and as Chief Executive from 12
March 2018. Following Kevin’s appointment as Chief Executive, I resumed my role as Non-Executive Chairman.
Towards the end of the year as part of our Board succession planning, we also appointed two new Non-Executive
Directors. Ann Christin Andersen brings extensive knowledge of the oil and gas industry and the application of new
technology, most recently in the digital space, a key focus area for Rotork. Tim Cobbold is an experienced former CEO
with a strong background in Rotork’s end markets.
In line with best governance practice, Gary Bullard, Non-Executive Director and Chair of the Remuneration
Committee, who has been a director for almost nine years, will not stand for re-appointment at the AGM on 26 April
2019. On behalf of the Board, I would like to thank Gary for his invaluable contribution to Rotork over the last nine
years, in particular as Chair of the Remuneration Committee during a period of significant change for the Group. Tim
Cobbold will assume the Chair of the Remuneration Committee following Gary Bullard’s retirement.
We have also recently welcomed Helen Barrett-Hague as our new Group General Counsel and Company Secretary
following Stephen Jones’ retirement in August 2018. Helen joins us from Pennon Group where she was Group
General Counsel and Company Secretary. Prior to this she has held a number of senior legal and company secretary
roles and brings a wealth of experience from a number of sectors.
Corporate Governance
The Board continues to be committed to the highest standards of governance. During the year, the Board played a
vital role in evaluating and helping to shape the Growth Acceleration Programme. In the second half of 2018, the
Board focused on the governance changes under the new Corporate Governance Code following its publication in July
2018.
Dividend
Rotork is a strong cash generator, recognises the importance of a growing dividend to its shareholders, and is
committed to a progressive dividend policy, subject to satisfying cash demands which can vary significantly from year
to year. This year the Board recommends a final dividend of 3.7p per share, an increase of 10.4% from the 2017 final
dividend. With the 2018 interim dividend of 2.2p, the total dividend for the year is 5.9p (2017: 5.4p), a 9.3% increase
on 2017. This is equivalent to 2.1 times cover based on adjusted earnings per share (2017: 2.0 times). The final
dividend will be payable on 22 May 2019 to shareholders on the register on 12 April 2019.
Outlook
This is a very exciting period for Rotork. We have mapped out and are now executing a comprehensive plan to return
Rotork to the levels of growth and margin performance previously experienced by the Group, and to do this on a
sustainable basis throughout the cycle.
We have assembled a capable management team, comprising new and existing talent. We have a strong balance
sheet, with opportunities to improve on an already strong record of cash generation, providing scope to further
accelerate progress including through M&A.
4
Following double-digit OCC revenue growth in 2018, and mindful of macroeconomic uncertainty, we are planning for
slower growth in 2019. Based on our current assessment of project phasing, we expect to deliver modest sales
growth on an OCC basis in 2019, with lower year on year sales in H1 reflecting the strong comparator period. Margins
will benefit from the restructuring plans under our Growth Acceleration Programme and the implementation of
additional cost saving initiatives. Overall, we expect full year margins to show progress on 2018.
Martin Lamb
Chairman
4 March 2019
Chief Executive’s statement
It gives me great pleasure to write my first annual review as Chief Executive of Rotork and to report on a strong set of
full year results in a year of significant development for the Group.
Having spent time getting to know the business after joining in February, I was struck by Rotork’s exceptional
reputation for quality, reliability and service, the depth of expertise and dedication of our employees, and their
willingness to drive improvements throughout the organisation. Feedback from customers was also very positive, but
identified scope to refine how we do things to make us easier to do business with and to maximise the value we
create for all of our stakeholders.
Following a thorough review of our routes to market, innovation funnel, operations footprint, supply chain, talent
development and IT systems, we identified scope for improvement, validating our five-year ambition to deliver
sustainable mid-to-high single digit revenue growth while also returning to operating margins in the mid-20s.
We began the implementation phase of the Growth Acceleration Programme in the second half of the year. This is
the first phase of a multi-year process, but already the results have been very encouraging, and are testament to the
calibre of our people and their ability to execute day-to-day operations while implementing the initiatives identified
in our workstreams. Our progress and results are especially pleasing in the context of an increasingly challenging
macroeconomic and political backdrop and with considerable volatility in oil prices.
Financial performance
Revenue grew 8.3%, 11.3% on an organic constant currency basis. Growth in Group order intake was 2.3% or 5.4% on
an organic constant currency basis, reflecting the variation in the timing of project orders and deliveries compared
with 2017.
Despite inflationary cost pressures, adjusted operating margins improved 70bps to 21.0%, with new products and a
greater emphasis on cost management and productivity contributing to this.
The strength of our return on capital employed and cash flow provides further evidence that our Growth Acceleration
Programme is beginning to yield results. Our balance sheet is strong, with a net cash position of £43.6m at the year
end, which will provide firepower for our organic investment plans and flexibility to pursue targeted M&A.
Key external drivers
2018 began with a rising oil price, leading to greater stability and increased confidence in the oil and gas sector, which
represents just over half of our revenues. As a result, we saw a return to more normal buying behaviour in the
maintenance and upgrade markets, and some recovery in larger projects as breakeven costs – which continue to fall
as the industry adopts newer and more efficient technologies – became more closely aligned to the oil price.
5
PMI (Purchasing Managers’ Index) and GDP economic indicators were largely supportive of steady growth in our
water and industrial markets, while our power markets continued to be challenging, particularly in high carbon
sectors such as coal fired power applications.
Towards the end of the year the PMI/GDP data pointed to a weakening in business sentiment and confidence and the
oil price declined. We continue to monitor developments closely.
End market focus
Our strategy continues to focus on critical applications and higher value fluids and gasses, where the Rotork brand is
strongest and most differentiated. Although there is a long, ongoing trend towards decarbonisation, oil & gas will
continue to be our largest and most profitable sector for the foreseeable future, due to the complexity, critical nature
of our application set and high value of the fluids and gases. As operators seek to drive down their costs, our product
and service solutions can play a key role in helping them to generate operating efficiencies.
We have renewed our focus on industrial applications by realigning our approach, putting in place dedicated
salespeople and hiring distribution partners to focus on those markets. Part of our extensive review of the business
was an analysis of how we go to market for our different types of products, and this exercise yielded a significant
number of opportunities to pursue in the industrial market sector. Food, pharma, petrochemical and HVAC are the
largest areas in which we’re gaining traction within the industrial sector, largely to do with our more focused and
accelerated new product development efforts targeted at these markets. These efforts have been reflected in a 14%
revenue growth in industrial applications.
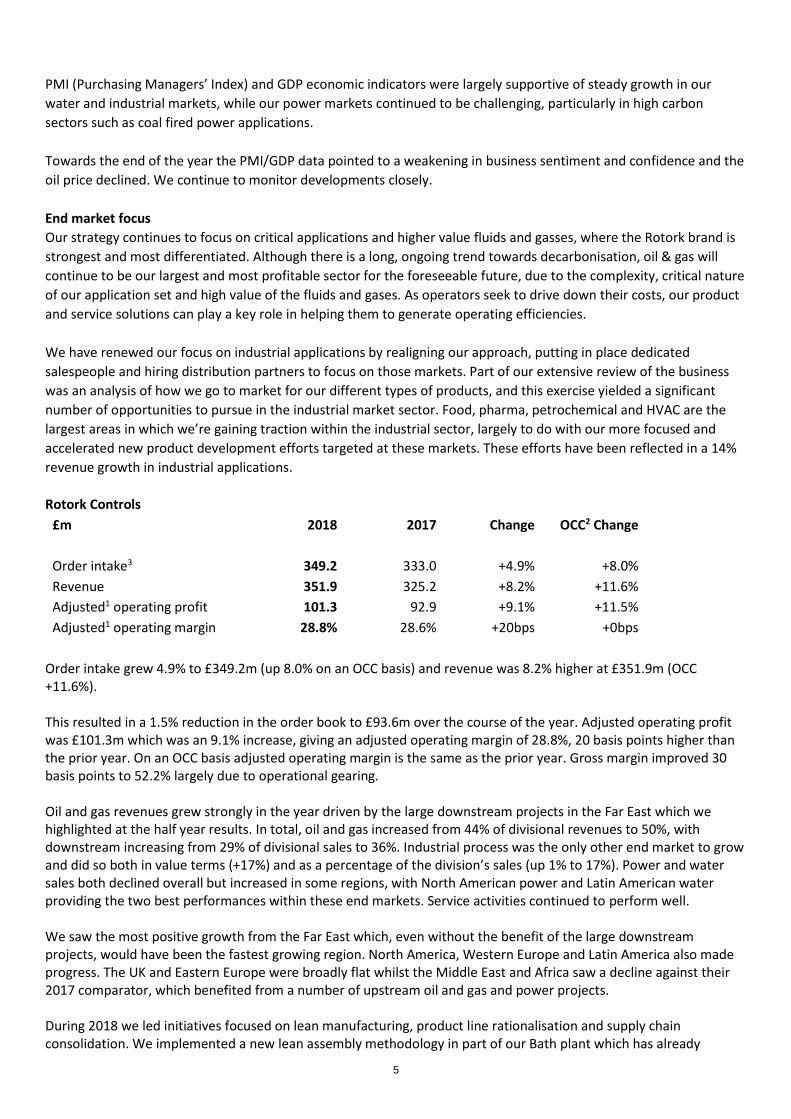
Rotork Controls
£m 2018 2017 Change OCC2 Change
Order intake3 349.2 333.0 +4.9% +8.0%
Revenue 351.9 325.2 +8.2% +11.6%
Adjusted1 operating profit 101.3 92.9 +9.1% +11.5%
Adjusted1 operating margin 28.8% 28.6% +20bps +0bps
Order intake grew 4.9% to £349.2m (up 8.0% on an OCC basis) and revenue was 8.2% higher at £351.9m (OCC +11.6%). This resulted in a 1.5% reduction in the order book to £93.6m over the course of the year. Adjusted operating profit was £101.3m which was an 9.1% increase, giving an adjusted operating margin of 28.8%, 20 basis points higher than the prior year. On an OCC basis adjusted operating margin is the same as the prior year. Gross margin improved 30 basis points to 52.2% largely due to operational gearing. Oil and gas revenues grew strongly in the year driven by the large downstream projects in the Far East which we highlighted at the half year results. In total, oil and gas increased from 44% of divisional revenues to 50%, with downstream increasing from 29% of divisional sales to 36%. Industrial process was the only other end market to grow and did so both in value terms (+17%) and as a percentage of the division’s sales (up 1% to 17%). Power and water sales both declined overall but increased in some regions, with North American power and Latin American water providing the two best performances within these end markets. Service activities continued to perform well. We saw the most positive growth from the Far East which, even without the benefit of the large downstream projects, would have been the fastest growing region. North America, Western Europe and Latin America also made progress. The UK and Eastern Europe were broadly flat whilst the Middle East and Africa saw a decline against their 2017 comparator, which benefited from a number of upstream oil and gas and power projects. During 2018 we led initiatives focused on lean manufacturing, product line rationalisation and supply chain consolidation. We implemented a new lean assembly methodology in part of our Bath plant which has already

6
delivered quality and efficiency improvements in the year – and which, once fully established, will be rolled out across our other plants. We have reviewed our product ranges and notified customers of 12 product lines which have now been discontinued, with a further three to follow in 2019. In most cases these customers have been successfully migrated to newer product ranges. The new procurement team has been working on both our direct and indirect cost base. Whilst the impact on our 2018 costs is not significant, they have been laying the groundwork for delivery of savings in 2019. Rotork Fluid Systems
£m 2018 2017 Change OCC2 Change
Order intake3 154.7 160.1 -3.3% +0.9%
Revenue 166.3 150.1 +10.8% +14.2%
Adjusted1 operating profit 16.1 9.0 +78.9% +85.6%
Adjusted1 operating margin 9.7% 6.0% +370bps +380bps
Fluid Systems saw strong project activity early in the year and as a result was able to convert a large part of this to revenue. Order intake of £154.7m was 0.9% higher on an OCC basis than the prior year but a currency headwind and the sale of the Hiller nuclear actuator business meant reported order intake was 3.3% lower. Revenue was 10.8% higher (+14.2% OCC) and as a result adjusted operating profit increased 78.9% (OCC +85.6%) to £16.1m. Adjusted operating margin increased 370 basis points to 9.7% (OCC +380bps). Gross margin improved 280 basis points to 31.7% as the higher revenue was delivered from a lower direct cost base, as well as benefiting from a small improvement in material costs. Oil and gas was the fastest growing end market and is now 68% of Fluid System’s sales compared with 67% last year. Within this, midstream was broadly flat and upstream, the largest element, grew 7% with progress in North America and the Far East offset by a decline in the Middle East. Downstream grew 34% led by activity in the Middle East. Water and industrial process both showed modest progress but power declined, partly due the sale of Hiller. The Far East grew in nearly all end markets and was the best performing region although is still smaller than North America and the Middle East and Africa overall. North America, Western Europe and Eastern Europe all made progress in the year with Western Europe’s performance strongest in industrial process. The Middle East and Africa and UK markets, both declined in the year, largely as a result of lower upstream business. Operational improvement initiatives focused on Lucca, Italy during the year. Introduction of lean techniques, consistent with the overall methodology being deployed across the Group, were supplemented by a drive to reduce inventory. From a product perspective there has been a balance between new and expanded product lines, notably the electro-hydraulic SI range, and a rationalisation of the existing product ranges with eight low volume ranges being phased out.
Rotork Gears
£m 2018 2017 Change OCC2 Change
Order intake3 86.8 86.1 +0.9% +3.8%
Revenue 85.6 83.9 +2.0% +4.7%
Adjusted1 operating profit 15.3 15.7 -2.7% +1.3%
Adjusted1 operating margin 17.9% 18.7% -80bps -70bps
Order intake increased 0.9% (OCC +3.8%) to £86.8m whilst revenue of £85.6m was 2.0% ahead of last year (OCC
+4.7%).

7
Adjusted operating profit was £15.3m, 2.7% lower than the prior year but was +1.3% on an OCC basis. Adjusted oper-
ating margins were 17.9%, 80 basis points lower than 2017. Gross margin reduced 160 basis points to 32.2% driven by
higher material costs which were the result of higher warranty costs and material write-offs. These adverse impacts
were partially offset by reductions in overheads through the year.
Oil and gas sales grew the fastest and increased from 52% of divisional sales last year to 54%. The growth was in mid-
stream in the Middle East and downstream in North America and the Far East whilst Western Europe was lower in
both the end markets. Upstream activity was lower in most regions. Industrial process was the other growth market,
led by North America, with water and power broadly flat. The Middle East and Africa and Far East were the two re-
gions which grew sales whilst Western Europe reported the largest decline. All other regions reported similar activity
levels to the prior year.
Early in the year we undertook a review of the division’s products and took the decision to rationalise the product
range in a number of areas. The closure of our Valvekits business mid-year was the most visible result of this but a
number of low volume product lines with obvious replacements were also phased out. This exercise continues and
we expect to consolidate more ranges in 2019 which will deliver further inventory reductions and simplify our prod-
uct portfolio. At the same time the reorganisation of R&D and coordination at a Group level is allowing us to focus on
development of gearboxes that primarily sell to Controls and Fluid Systems to improve the efficiency of the product
pairing and competitiveness of the solution.
Rotork Instruments
£m 2018 2017 Change OCC2 Change
Order intake3 105.5 104.5 +0.9% +1.9%
Revenue 107.2 100.6 +6.5% +7.5%
Adjusted1 operating profit 24.1 20.5 +17.7% +17.5%
Adjusted1 operating margin 22.5% 20.3% +220bps +190bps
Order intake was £105.5m, 0.9% higher than last year (OCC +1.9%) and revenue of £107.2m was 6.5% higher (OCC +7.5%). The additional revenue combined with tight control of costs ensured adjusted operating profit grew 17.7% (OCC +17.5%) to £24.1m with adjusted operating margins increasing 220 basis points (OCC +190 bps) to 22.5%. Gross margin improved 110 basis points to 44.3% with the positive impact of operational gearing combined with holding direct costs at the prior year level more than offsetting a small rise in material costs. Oil and gas remains the largest end market and increased from 46% to 48% of revenue this year. This growth comes from upstream and midstream oil and gas sales as downstream reduced in the year, falling from 12% to 10% of revenue. Water and power delivered modest growth and whilst Industrial sales grew, they declined as a percentage of sales from 19% to 18%. Geographically most regions maintained their share of divisional revenue, growing in-line with the overall division. The only exception was the UK which grew faster, benefiting from upstream oil and gas sales. Our focus on driving efficiency improvements included product rationalisation, where we have withdrawn over 2,500 SKUs covering more than 20 product ranges. At the same time new product development plays a major role as we look to match our customers’ changing needs. Our new chemical pump range for the oil and gas market offers major efficiency savings, with reduced power requirements which is ideal for growing solar applications. With the reshaped Group engineering structure, we were able to close a small remote engineering centre, driving cost savings without impacting our ability to innovate.

8
Growth Acceleration Programme Our Growth Acceleration Programme, while wide-ranging, is not about the fundamental reinvention of Rotork but rather about refinements that build upon the Group’s strong foundations, through people, processes and systems. An overview of our progress is outlined below. The themes of the programme include:
• Reinvesting in our customer focus and intimacy;
• Driving operational and supply chain efficiencies;
• Improving our processes and focus within our Innovation and New Product Development activities;
• Enhancing our talent acquisition and development programmes;
• Increasing the alignment between our long-term strategy, our near-term goals and our desired behaviours and our rewards systems;
• A renewed emphasis on headcount productivity; and,
• A critical review of our strategy, portfolio and current product lines. We identified 12 distinct initiatives and grouped these within four pillars, with an underlying drive to simplify our business and to improve the quality of our portfolio through an evaluation of our strategy, portfolio and product lines. The four pillars are defined as Commercial Excellence, Operational Excellence, Talent Acquisition and Development, and IT & Core Business Processes. We have made very good progress, and are on track with all of the initiatives and plans announced at our half year results. Having previously recorded a seven year decline in revenue and profit per employee, our productivity has now begun to recover. We added a net 31 to our headcount in the last year (equating to a 0.8% growth) yet grew the revenue by 8.3%. Revenue per head has therefore improved 7.5% to £180k per head and adjusted operating profit per head 11.3% to £38k per head. 1) Commercial Excellence Focus on providing our customers with the products and services they want whilst at the same time making it simple for them to buy from Rotork wherever they are in the world. While happy with many aspects of Rotork’s performance, customers singled out in their feedback to us three areas for improvement, which we have worked hard to address: quote turnaround times, on-time delivery and client communications. Route to market One of the most significant conclusions from the programme has been a recognition of the need to migrate from Rotork’s product-based structure to an organisation that is more closely aligned to market segments and customer needs. Several of our fastest growing geographical markets already work partially in this way, and in 2019 we will begin a phased, region by region roll-out, which we expect to have completed in 2020. The approach - whereby team members are tasked with providing solutions to customers, irrespective of the historical division responsible for that product - will be supported by a greater emphasis on key account management and end user engagement, and a renewed drive to be easier for customers to do business with. Our key account managers currently focus on 15 of our largest oil and gas end users and the most active international engineering contractors. The key account team has been able to adapt to the end users’ business requirements and improve relationships with key influencers and decisions makers in customers’ procurement, operations and projects departments. Development of service offering A core element of our commercial excellence pillar relates to site services, identified in our customer research as a key differentiator for the Group. This is an area we intend to expand as we continue our migration from a reactive service model to proactive preventative maintenance, and ultimately to the utilisation of real-time data analytics to predict failures and prevent them from occurring in the first place. We have recruited a new Global Director of Site Services, who has a depth of experience in running major service networks, and bolstered the team through the addition of 45 customer-facing service technicians.
9
Innovation and new product development Work under the commercial excellence pillar also included a detailed review of our structure and processes for innovation and new product development. Previously, each division was responsible for its own new product development and had its own budget. We now have a central structure, led by our Group Director of Innovation and Engineering, with areas of expertise including electrical engineering, software engineering and data analytics. The introduction of a revised framework for assessing new product development efforts led to the elimination of 35% of in-flight product development programmes that were not deemed to be sufficiently value-enhancing to Rotork. We now have a consolidated database of all ongoing programmes, and are able to concentrate our resources on the most promising and profitable areas. We have also changed our approach to accelerate our new product development cycle. In addition, we evaluated our engineering capabilities against those required for our future success and put in place a plan to strengthen those required competencies through building, partnering or acquiring them where we identified gaps. Our intention in the short-term is to keep investment in innovation and R&D to around 2018 levels, but to use our expenditure more efficiently, by:
• improving our process for project selection;
• accelerating our process cycle times; and
• increasing our hit rate through improved customer and supplier input early in the process. All of these activities are supported by a robust set of management KPIs to monitor and drive improvements in our ongoing new product development effectiveness. Once improved processes and tighter focus have been embedded, we will re-evaluate the quality of projects in our innovation funnel and assess our levels of investment accordingly. 2) Operational Excellence Improve our operational efficiency through the use of mixed-model lean techniques, improved inventory management and footprint optimisation with supply chain globalisation delivering cost savings and whilst maintaining our reputation for high-quality products and services. Operational improvements Performance improvement reviews have now been carried out at the largest nine sites covering over 70% of our factory output and improvement plans developed for each. These plans have already delivered improvements in productivity, quality and lead times. Initially facilitated by external support, the review process has now been internalised and in 2019 will be extended to drive further improvement initiatives and sharing of best practices. The Rotork lean model is another improvement initiative which has now been launched and the training materials deployed. Work to embed this commenced at the end of 2018. In parallel the Rotork inventory management module was launched in the last quarter of the year. Plans have been created for every site and targets set. A set of operational KPIs has been developed to track all these initiatives. Supply chain improvements The review of our supply chain carried out last year indicated that through centralisation of what was a fragmented and locally managed supply base there was significant potential for savings. We have now created the central team that will lead this work and have been very pleased with the progress so far. Wave 1 focused on travel, insurance and certain product components and was completed last year. Wave 2 is focused on more significant component categories and commenced in the final quarter of 2018. The new agreements will gradually be phased in during 2019 and are expected to yield a benefit of around £5m in 2019.

10
3) Talent acquisition & development Having the right team in place is crucial to achieving our aspirations. Through a combination of targeted development of existing employees, recruitment of world-class external talent and a re-alignment between our strategy, behaviours, results and rewards systems, we have already delivered promising results in driving towards our ambitions and have a clear roadmap to make further progress. Global talent development Following assessment of our senior leaders we were prompted to fill skill gaps, through internal training or externally through hiring, improving our capabilities particularly in Operations and Procurement. Leaders have now been hired for our General Counsel, Procurement, Communications, Talent, Strategy & M&A and Site Service functions. The Talent Review and Succession Planning processes initially provided by consultants have now been internalised to enable us to deliver them ourselves as we move forward. Performance management A Performance Management and Objective Setting approach has been launched which will be applied globally, providing total alignment to our Vision and setting the standard for what high performance looks like. With our new Performance Approach as a foundation we have been able to adjust our variable and fixed compensation programmes to include differentiation between high and lower performers and have announced a new annual cycle for compensation. 4) IT & core business processes IT systems development At the end of 2018 we appointed our partner to work with us on the design and development of our new core IT systems. These will go beyond the ERP system and will incorporate CRM, project tracking and global HR systems. This integrated development has now started and will be deployed in phases with some aspects going live in 2019, although ultimately this is a multi-year programme before all sites are operating on a common platform. IT team development The system development programme of work is significant and it is vital that we have the right people with the appropriate skills to lead the programme. In recognition of this, the IT team has been strengthened with additional enterprise architecture and project management resources particularly. The training and development of the wider team has also been increased, focused on the skills that will be most relevant to the system development programme. Dashboards In order to support the business through a period of change, we need to be able to track and measure the improvements. To deliver a consistent and visible set of KPIs we have developed dashboards for some of our key focus areas. Dashboards for Rotork Site Services, Global Operations and Customer Quote Responsiveness were launched in 2018. These dashboards operate independently from our underlying systems and will provide us with a consistent set of data as we roll out our new core ERP system. Strategy, portfolio and product line assessment The four pillars outlined above are supported by our Strategy, Portfolio and Product Line Assessment activities. The initial assessment of our portfolio identified three business areas that were candidates for immediate exit, given that they were dilutive to Group margins, yet accounted for only 1% of Group revenue. These were exited in 2018. An extensive product review also identified more than 28 product lines with low sales volumes, dilutive margins or both. These added a great deal of complexity to the business, and will be withdrawn from production over the course of 2019. Sales from these are being transferred to alternative products, in most cases to newer generations, within the core portfolio.

11
Growth Acceleration Programme financial impact The sale of the Hiller nuclear actuator business, closure of the Valvekits business and the engineering office resulted in a £0.7m loss. This has been reported as a restructuring cost within other adjustments and is excluded from adjusted operating profit. During 2018 these business contributed £3.1m of revenue and operating profit of £0.1m and their disposal generated proceeds of £4.3m. The central procurement team was established in the middle of last year and added to through the second half of 2018. Work started on the wave 1 (insurance, travel and certain components) early in the year but then towards the end of the year focus moved to wave 2 (larger component categories) that would bring benefits in 2019. In total this team has achieved £1.7m of in-year savings which benefited the 2018 results. The impact of these savings in 2019 plus the impact of wave 2 will generate an incremental £5m of savings in 2019. The implementation of a mixed-model lean programme and focus on continuous improvement was led initially by consultants. Gradually through the year we have built the in-house expertise in these areas and are now able to run the site assessment process and drive further improvements led by our own people. Of the £4.1m consultancy costs incurred in 2018, which are reported within ‘Other adjustments’ and excluded from adjusted operating profit, the majority were incurred in the first half of the year and relate to the information gathering and analysis phase of the Growth Acceleration Programme. However £0.7m related to site improvement activities and the benefits arising from these activities in 2018 have been in two main areas. Firstly the identification and use of slow moving inventory, which has generated £0.7m of additional profit, and secondly the efficiency gains from process changes the most significant part of which are reflected in improved labour utilisation. The efficiency gains, which totalled circa £0.4m in 2018, are recurring benefits and will continue to build as these programmes gain momentum. The other costs incurred in 2018 as part of the Growth Acceleration Programme are redundancy and executive change costs (£2.9m) and restructuring costs (£2.9m). These include the write-off of capitalised R&D following the decision to end development of certain product lines and assets written off as part of the global footprint review. There is no direct payback in respect of these costs. Our intention when establishing the Growth Acceleration Programme was to fund the programme through working capital improvements. During the year we have begun to see some of those improvements with net working capital reducing from 29.3% to 27.7% of revenue. Inventory is the component of working capital which has received the most focus and an improvement in stock turns has generated £16m this year. Looking at the other elements of working capital on a constant currency basis, trade receivables have improved and generated £5m whilst trade payables have deteriorated slightly resulting in an outflow of £9m. As the central procurement team start to work through the wave 2 categories we expect to see this metric start to improve. The total cash generated from improved working capital in the year is £13m. Capital deployment strategy We remain a highly cash generative business and have returned to a net cash position. The priorities for use of our cash continue to be investing in organic growth (new markets, new product development or capital expenditure), then a progressive dividend policy, followed by M&A. Thereafter, if we decide at any point we have excess cash, we would look to return it to shareholders. We have a strong balance sheet which provides the Group with considerable optionality in uncertain market conditions. With the hiring of our new Group Director of Strategy and M&A, we will further refine Rotork’s strategy and will take our time to make sure we understand where Rotork has its most attractive opportunities for growth before pursuing acquisitions. We have enough medium to low hanging fruit to keep the team focused on delivering in the near term, such as supply chain and operational improvements, facility consolidations and pivoting our commercial organisation. There’s a lot of work to be done, and we intend to stay focused on the Growth Acceleration Programme initiatives whilst we evaluate M&A targets. Stakeholder engagement People and culture We recognise that there are several factors critical to the success of our Growth Acceleration Programme and internal communication is one of these. In order to ensure that we manage our programme effectively, we have hired a

12
Director of Internal Communications and focused on communication throughout the organisation to ensure that we bring our team along. We’ve created new messaging for the company consistent with our areas of focus: six key themes for the business, our vision, mission, and what we define as a good company. We have also produced several internal CEO videos to communicate where we’re going and what we need. Our new One Rotork theme is about working collaboratively and behaving as a single collective company. In addition to tackling structural inefficiencies, there was a need to build upon Rotork’s strong culture by introducing more of an operational performance mindset. Our training and development work, changes to the performance management system, our business intelligence dashboards and the external operating talent we have brought in have all contributed to a renewed focus on operational metrics. We did not undertake a formal employee engagement survey in 2018 as we wanted to allow time for the changes to bed in. Feedback from our town halls, dedicated email address for people to ask me questions, and my lunches with colleagues of differing seniority throughout Rotork demonstrate a real sense of excitement, optimism and renewed energy around the business. Customer satisfaction We have acted upon the feedback from the c. 200 customer interviews and first net promoter score assessment we undertook last year, seeking to build on our strengths and address the areas where our performance fell short of expectations. As I mentioned above, both our lead times and quote turn-around times have improved significantly over the last year. Our communities Corporate social responsibility remains core to our business model. Our CSR Committee considers the impact of our business on all our stakeholders and ways to improve our performance. This year we reviewed the charities we have been supporting and have now chosen areas that are more aligned to our business focus. We continue to work with Water Aid, but are pleased to have added Engineers Without Borders, Pump Aid and Renewable World to the causes we support with fundraising and volunteer resource. Summary We have made significant progress with our Growth Acceleration Programme, but this is only the beginning of a multi-year initiative. Under the commercial excellence pillar, we are focused on creating a more customer-oriented structure, which is ongoing and will take a year to execute, since we are taking great care to implement this in a measured, considered way. Under the operational excellence pillar of our Growth Acceleration Programme, our facility rationalisations are underway and on track. We have identified a specific set of initiatives to be driven by our nine largest facilities, and our largest subsidiary locations have teams focused on driving tangible operational improvements, including inventory optimisation to improve our cash generation. We will begin rolling out elements of our new IT platform within the next 6 months. Essentially, our current focus is on advancing the initiatives we have already started to implement. Whilst the macroeconomic outlook is difficult to predict, we are proactively planning for different scenarios and have a very good understanding of what we would do under different circumstances. After a very good performance in 2018 which exceeded our expectations, aided by a reduction in lead times, we expect revenues for 2019 to deliver modest OCC growth on 2018. However our self-help initiatives should mean that we see progress on margins in 2019. Whatever unfolds, the initiatives we are pursuing will strengthen Rotork’s cyclical resilience and position the Group to compete effectively in all economic contexts. I am confident that we can continue to build upon what is a strong foundation. I see clear opportunities and potential for Rotork. It is an honour to be steering the Group through the next stage of its development as a leading global flow

13
control and instrumentation company, capitalising on Rotork’s proud history while positioning the organisation for sustainable growth. I would like to thank my colleagues throughout the Group for their drive and enthusiasm in embracing the Growth Acceleration Programme. There is a lot to do, and we have a great team in place to achieve our goals. Financial Review Return on capital employed (ROCE) Our capital-efficient business model and strong profit margins mean Rotork generates a high ROCE. Our definition of ROCE is based on adjusted operating profit as a return on the average net assets excluding net cash and the pension scheme liability, net of the related deferred tax. This means that as we make acquisitions our capital base grows when the associated intangible assets and goodwill are recognised. The average capital employed decreased 4.3% over the year to £500m as there were no acquisitions during 2018 and we moved from a net debt to a net cash position. This, combined with the higher adjusted operating profit, resulted in an increase in ROCE to 29.2% (2017: 24.9%). Taxation The Group’s effective tax rate was mainly impacted this year by the reduction in US corporate tax rates. The headline rate decreased from 31.0% to 24.0% in 2018 as a result of non-taxable charges in 2017 not repeated in 2018. Removing the impact of the non-recurring adjustments provides a more reliable measure and on this basis the adjusted effective tax rate is 23.7% (2017: 26.3%). The Group expects its adjusted effective tax rate to continue to fall in line with the current trend in corporate tax rates where Rotork operates. This will still be higher than the standard UK rate due to higher rates of tax in China, the US, Canada, France, Germany, Italy, Japan and India. The Group’s approach to tax continues to be to operate on the basis of full disclosure and co-operation with all tax authorities and, where possible, to mitigate the burden of tax within the local legislation. Cash generation Our strong cash generation resulted in a movement from net debt of £12.6m to net cash of £43.6m at the end of the year. Our cash conversion KPI shows a conversion of 110.7% of adjusted operating profit into cash. The Group invested £10.4m in capital expenditure in 2018 although this was lower than anticipated due to our decision to defer plans for the redevelopment of the Bath factory site whilst options were considered. We continue to look at options for further expansion of this facility as part of the Growth Acceleration Programme. We have continued to invest in our engineering capability with our Research and Development cash spend increasing 10.8% to £15.5m. This represents 2.2% of revenue (2017: £14.0m and 2.2%). The most significant spend was associated with the development of Pakscan 4 which contributed a third of the £3.8m of capitalised R&D in the year. Cash of £4.3m has been realised from the disposal of the Hiller business and the Valvekits assets. Dividends of £48.3m and tax payments of £30.1m were the two other major outflows. Control of working capital as defined in the cash flow statement, using average exchange rates and excluding acquisitions, is key to achieving our cash generation KPI. The increased levels of revenue in the last quarter saw trade receivables grow £2.3m and when measured as days sales outstanding improved from 63 to 62 days. Net working capital in the balance sheet decreased to 27.7% of revenue compared with 29.3% in December 2017 but was a £9.0m outflow in the cash flow statement. Retirement benefits The Group accounts for post-retirement benefits in accordance with IAS 19, Employee Benefits. The balance sheet reflects the net deficit of these schemes at 31 December 2018 based on the market value of the assets at that date, and the valuation of liabilities using year end AA corporate bond yields. We closed both the main defined benefit pension schemes to new entrants; the UK scheme in 2003 and the US scheme in 2009 in order to reduce the risk of volatility of the Group’s liabilities. During 2018 we further reduced the risk of volatility when we completed the closure to future accrual of both the UK and US schemes. Members of the defined benefit schemes have been transferred onto the relevant defined contribution plan operating in their country. The closure of both of these

14
schemes has resulted in a curtailment gain in other income of £8.6m and is an adjusting item in the adjusted profit measure. The High Court judgement in the case of Lloyds Banking Group in October 2018 clarified that pension benefits under the UK Scheme need to be equalised for the effects of unequal guaranteed minimum pensions (GMP). The impact of GMP equalisation is a £0.9m cost and is shown as a past service cost in the income statement and is an adjusting item in the adjusted profit measure. The most recent triennial valuation of the UK scheme took place as at 31 March 2016 and showed an actuarial deficit of £32.5m and a funding level of 82%. The update to this actuarial valuation at 31 March 2018 showed the deficit had grown to £41.5m and funding level decreased slightly to 81%. A continued reduction in gilt yields, which is the key driver behind the value of the scheme’s liabilities, and higher inflation expectations were the main changes since the 2016 valuation. A recovery plan was agreed with the Trustees following the 2016 valuation, resulting in required annual contributions from the Company of £5.5m during 2016, 2017 and 2018. The next triennial valuation will be prepared as at 31 March 2019. On an accounting basis the deficit on the schemes decreased from £48.2m to £27.3m during the year and the funding level increased from 80% to 87%. In addition to the curtailment gains, GMP cost and contributions of £7.2m, the increase in the discount rate from 2.5% to 3.0% also contributed to the £20.9m reduction in the pension deficit. The accounting deficit is different to the actuarial deficit as on an accounting basis we are required to use AA corporate bond rates to value the liabilities. The actuarial valuation uses gilt yields since this most closely matches the investment strategy which is designed in part to hedge the interest rate and inflation risks borne by the scheme. Cash contributions are driven by the actuarial valuation.
Kevin Hostetler Chief Executive 4 March 2019

15
Consolidated income statement For the year ended 31 December 2018
Notes
2018
£000
2017
£000
Revenue 3 695,713 642,229
Cost of sales (384,253) (358,090)
Gross profit 311,460 284,139
Other income 8,990 10,651
Distribution costs (7,260) (6,271)
Administrative expenses (189,474) (202,233)
Other expenses (798) (314)
Adjusted operating profit 2,3 146,015 130,162
Adjustments
- Amortisation of acquired intangible assets 3 (20,284) (27,183)
- Other adjustments 4 (2,813) (17,007)
Operating profit 2,3 122,918 85,972
Finance income 5 2,278 1,381
Finance expense 5 (4,448) (6,767)
Profit before tax 120,748 80,586
Income tax expense 6 (29,004) (24,973)
Profit for the year 91,744 55,613
Basic earnings per share 8 10.5p 6.4p
Adjusted basic earnings per share 8 12.6p 10.6p
Diluted earnings per share 8 10.5p 6.4p
Adjusted diluted earnings per share 8 12.6p 10.5p
Consolidated statement of comprehensive income For the year ended 31 December 2018
2018
£000
2017
£000
Profit for the year 91,744 55,613
Other comprehensive income Items that may be subsequently reclassified to the income statement:
Foreign exchange translation differences 3,164 (376)
Effective portion of changes in fair value of cash flow hedges net of tax (6) 6,188
3,158 5,812
Items that are not subsequently reclassified to the income statement:
Actuarial gain in pension scheme net of tax 8,055 3,709
Income and expenses recognised directly in equity 11,213 9,521
Total comprehensive income for the year 102,957 65,134

16
Consolidated balance sheet At 31 December 2018
Notes
2018
£000
2017
£000
Non-current assets
Goodwill 230,157 228,028
Intangible assets 61,517 81,456
Property, plant and equipment 79,338 81,725
Deferred tax assets 17,337 21,218
Other receivables 352 142
Total non-current assets 388,701 412,569
Current assets
Inventories 94,739 91,908
Trade receivables 145,509 145,529
Current tax 1,429 2,726
Derivative financial instruments 308 3,468
Other receivables 23,161 19,202
Cash and cash equivalents 104,489 63,192
Total current assets 369,635 326,025
Total assets 758,336 738,594
Equity
Issued equity capital 7 4,358 4,352
Share premium 13,024 11,193
Reserves 35,421 32,263
Retained earnings 460,825 409,392
Total equity 513,628 457,200
Non-current liabilities
Interest bearing loans and borrowings 30,871 45,879
Employee benefits 9 31,274 52,293
Deferred tax liabilities 15,722 19,379
Derivative financial instruments - 245
Provisions 10 2,149 1,929
Total non-current liabilities 80,016 119,725
Current liabilities
Interest bearing loans and borrowings 30,010 29,928
Trade payables 47,332 49,183
Employee benefits 9 26,489 21,464
Current tax 11,792 13,093
Derivative financial instruments 2,682 1,521
Other payables 40,150 42,165
Provisions 10 6,237 4,315
Total current liabilities 164,692 161,669
Total liabilities 244,708 281,394
Total equity and liabilities 758,336 738,594
These financial statements were approved by the Board of Directors on 4 March 2019 and were signed on its behalf by:
KG Hostetler and JM Davis, Directors.

17
Consolidated statement of changes in equity
Issued
equity
capital
£000
Share
Premium
£000
Translation
Reserve
£000
Capital
redemption
reserve
£000
Hedging
Reserve
£000
Retained
Earnings
£000
Total
£000
Balance at 31 December 2016 4,350 10,482 32,142 1,644 (7,335) 392,803 434,086
Profit for the year – – – – – 55,613 55,613
Other comprehensive income
Foreign exchange translation differences – – (376) – – – (376)
Effective portion of changes in fair value of cash
flow hedges – – – – 7,546 – 7,546
Actuarial loss on defined benefit pension plans – – – – – 5,849 5,849
Tax on other comprehensive income – – – – (1,358) (2,140) (3,498)
Total other comprehensive income – – (376) – 6,188 3,709 9,521
Total comprehensive income – – (376) – 6,188 59,322 65,134
Transactions with owners, recorded directly in equity Equity settled share-based payments transactions – – – – – 1,089 1,089
Tax on equity settled share-based payment transactions – – – – – 252 252
Share options exercised by employees 2 711 – – – - 713
Own ordinary shares acquired – – – – – (1,157) (1,157)
Own ordinary shares awarded under share schemes – – – – – 2,301 2,301
Dividends – – – – – (45,218) (45,218)
Balance at 31 December 2017 4,352 11,193 31,766 1,644 (1,147) 409,392 457,200
Profit for the year – – – – – 91,744 91,744
Other comprehensive income
Foreign exchange translation differences – – 3,164 – – – 3,164
Effective portion of changes in fair value of cash
flow hedges – – – – (24) – (24)
Actuarial gain on defined benefit pension plans – – – – – 9,501 9,501
Tax on other comprehensive income – – – – 18 (1,446) (1,428)
Total other comprehensive income – – 3,164 – (6) 8,055 11,213
Total comprehensive income – – 3,164 – (6) 99,799 102,957
Transactions with owners, recorded directly in equity Equity settled share-based payments transactions – – – – – 2,457 2,457
Tax on equity settled share-based payment transactions – – – – – 98 98
Share options exercised by employees 6 1,831 – – – - 1,837
Own ordinary shares acquired – – – – – (4,850) (4,850)
Own ordinary shares awarded under share schemes – – – – – 2,217 2,217
Dividends – – – – – (48,288) (48,288)
Balance at 31 December 2018 4,358 13,024 34,930 1,644 (1,153) 460,825 513,628
Detailed explanations for equity capital, the translation reserve, capital redemption reserve and hedging reserve can be seen in note 7.

18
Consolidated statement of cash flows For the year ended 31 December 2018
Notes
2018
£000
2018
£000
2017
£000
2017
£000
Cash flows from operating activities
Profit for the year 91,744 55,613
Adjustments for:
Amortisation of intangibles 20,284 27,183
Other adjustments 4 2,813 17,007
Amortisation of development costs 2,575 2,699
Depreciation 11,642 12,232
Equity settled share-based payment expense 4,674 3,390
Profit on sale of property, plant and equipment (134) (147)
Finance income (2,278) (1,381)
Finance expense 4,448 6,767
Income tax expense 29,004 24,973
164,772 148,336
Increase in inventories (2,140) (7,390)
Increase in trade and other receivables (2,322) (13,172)
(Decrease)/increase in trade and other payables (5,761) 6,926
Restructuring costs paid (7,795) (2,775)
Difference between pension charge and cash contribution (5,809) (4,782)
Increase in provisions 2,333 147
Increase in employee benefits 4,690 7,158
147,968 134,448
Income taxes paid (30,084) (28,243)
Cash flows from operating activities 117,884 106,205
Investing activities
Purchase of property, plant and equipment (10,430) (12,457)
Development costs capitalised (3,831) (3,356)
Sale of property, plant and equipment 201 2,450
Disposal of businesses 4,340 –
Contingent consideration paid (10) (1,347)
Settlement of hedging derivatives (815) 662
Interest received 1,309 1,191
Cash flows from investing activities (9,236) (12,857)
Financing activities
Issue of ordinary share capital 1,837 713
Own ordinary shares acquired (4,850) (1,157)
Interest paid (2,837) (2,975)
Decrease in bank loans (14,934) (40,579)
Repayment of finance lease liabilities (3) (68)
Dividends paid on ordinary shares (48,288) (45,218)
Cash flows from financing activities (69,075) (89,284)
Increase in cash and cash equivalents 39,573 4,064
Cash and cash equivalents at 1 January 63,192 61,423
Effect of exchange rate fluctuations on cash held 1,724 (2,295)
Cash and cash equivalents at 31 December 104,489 63,192

19
Notes to the Group Financial Statements For the year ended 31 December 2018
Except where indicated, values in these notes are in £000.
Rotork plc is a company domiciled in England. The consolidated financial statements of the Company for the year ended 31
December 2018 comprise the Company and its subsidiaries (together referred to as the Group).
1. ACCOUNTING POLICIES
Basis of preparation
The consolidated financial statements of Rotork plc have been prepared and approved by the directors in accordance with
International Financial Reporting Standards as adopted by the European Union (IFRSs as adopted by the EU), IFRIC Interpretations
and the Companies Act 2006 applicable to companies reporting under IFRS.
New accounting standards and interpretations
i. IFRS 15 Revenue from Contracts with Customers
IFRS 15 was issued in May 2014 and amended in April 2016, and establishes a five-step model to account for revenue arising from
contracts with customers. Under IFRS 15, revenue is recognised at an amount that reflects the consideration to which an entity
expects to be entitled in exchange for transferring goods or services to a customer. The Group has adopted IFRS 15 from 1 January
2018, using the modified retrospective method (retrospectively with the cumulative effect at the date of initial application).
During 2017, the Group performed a detailed analysis of significant revenue streams, communicated to key stakeholders within the
business the key aspects of the accounting change and had specific targeted training for key finance employees. In early 2018,
further work targeted service revenue to assess the impact of the change over the transition date. The adoption of IFRS 15 had no
material impact on the recognition and measurement of the Group’s revenue and no adjustments to equity have been made.
ii. IFRS 9 Financial Instruments
In July 2014, the IASB issued the final version of IFRS 9 Financial Instruments that replaces IAS 39 Financial Instruments:
Recognition and Measurement and all previous versions of IFRS 9. IFRS 9 brings together all three aspects of the accounting for
financial instruments project: classification and measurement, impairment and hedge accounting. IFRS 9 introduced a new model for
classification and measurement of financial assets and financial liabilities, a single, forward-looking “expected loss” model for
measuring impairment of financial assets (including trade receivables) and a new approach to hedge accounting that is more closely
aligned with an entity’s risk management activities.
The Group has adopted IFRS 9 from 1 January 2018 and there has been no material impact on the Group’s results or financial
position.
iii. Other amendments A number of amended standards became applicable for the current reporting period. The application of these amendments has not had any material impact on the disclosures, net assets or results of the Group.
New standards and interpretations not yet adopted
Certain new accounting standards and interpretations have been published that are not mandatory for 31 December 2018 reporting
periods and have not been early adopted by the Group. An assessment of the impact of these new standards and interpretations is
set out below.
i. IFRS 16 Leases
IFRS 16 was issued in January 2016 and introduces a comprehensive model for the identification of lease arrangements and accounting treatments for both lessors and lessees. IFRS 16 will supersede the current lease guidance including IAS 17 Leases and the related interpretations when it becomes effective for annual periods beginning on or after 1 January 2019. IFRS 16 distinguishes leases and service contracts on the basis of whether an identified asset is controlled by a customer. Distinctions of operating leases (off balance sheet) and finance leases (on balance sheet) are removed for lessee accounting, and are replaced by a model where a right-of-use asset and a corresponding liability have to be recognised for all leases by lessees (i.e. all on balance sheet) except for short-term leases and leases of low value assets. The right-of-use asset is initially measured at cost and subsequently measured at cost (subject to certain exceptions) less accumulated depreciation and impairment losses, adjusted for any remeasurement of the lease liability. The lease liability is initially measured at the present value of the lease payments that are not paid at that date. Subsequently, the lease liability is adjusted for interest and lease payments, as well as the impact of lease modifications, amongst others. Furthermore, the classification of cash flows will also be affected as operating lease payments under IAS 17 are presented as operating cash flows; whereas under the IFRS 16 model, the lease payments will be split into a principal and an interest portion which will be presented as financing and operating cash flows respectively. Extensive disclosures are required by IFRS 16. As at 31 December 2018, the Group has non-cancellable operating lease commitments of £17,789,000. Of these commitments, approximately £4,800,000 relate to short-term leases and low value leases which will both be recognised on a straight-line basis as

20
an expense in the income statement, consistent with current accounting. For the remaining lease commitments the Group expects to recognise right-of-use assets of approximately £12,100,000 and lease liabilities of approximately £12,100,000 on 1 January 2019. The Group expects that the impact on profit after tax will not be material as a result of adopting the new rules. Operating cash flows will increase and financing cash flows decrease by approximately £4,000,000 as repayment of the principal portion of the lease liabilities will be classified as cash flows from financing activities. The Board has decided to apply the modified retrospective method when the standard is first adopted in its financial statements for the year ended 31 December 2019. Therefore, there will be no impact on any comparative accounting period, with any leases recognised on balance sheet on the adoption date of 1 January 2019.
ii. Other
There are no other standards that are not yet effective and that would be expected to have a material impact on the entity in the current or future reporting periods and on foreseeable future transactions.
Adjustments to profit
Adjustments to profit are items of income and expense which, because of the nature, size and/or infrequency of the events giving rise to them, merit separate presentation. These specific items are presented on the face of the income statement to provide greater clarity and a better understanding of the impact of these items on the Group’s financial performance. In doing so, it also facilitates greater comparison of the Group’s underlying results with prior periods and assessment of trends in financial performance. Th is split is consistent with how underlying business performance is measured internally. Adjustments to profit items may include but are not restricted to: costs of significant business restructuring, significant impairments of intangible or tangible assets, adjustments to the fair value of acquisition related items such as contingent consideration, acquired intangible asset amortisation and other items due to their significance, size or nature, and the related taxation.
Going concern
After carrying out a detailed review of the viability of the business, the directors have a reasonable expectation that the Group has
adequate resources to continue in operational existence for the foreseeable future. For this reason, they continue to adopt the going
concern basis in preparing the financial statements. In forming this view, the directors have considered trading and cash flow
forecasts, financial commitments, the significant order book with customers spread across different geographic areas and industries
and the net cash position.
Consolidation
The consolidated financial statements incorporate the financial statements of the Company and its subsidiaries for the year to 31
December 2018. The financial statements of subsidiaries are included in the consolidated financial statements from the date that
control commences until the date control ceases. Intra-group balances and any unrealised gains or losses or income and expenses
arising from intra-group transactions are eliminated in preparing the consolidated financial statements.
Status of this preliminary announcement
The financial information contained in this preliminary announcement does not constitute the Company's statutory accounts for
the years ended 31 December 2018 or 2017. Statutory accounts for 2017, which were prepared under International Financial
Reporting Standards as adopted by the EU, have been delivered to the registrar of companies, and those for 2018 will be
delivered in due course. The auditors have reported on those accounts; their reports were (i) unqualified, (ii) did not include a
reference to any matters to which the auditors drew attention by way of emphasis without qualifying their report and (iii) did not
contain a statement under section 498 (2) or (3) of the Companies Act 2006. Full financial statements for the year ended 31
December 2018 will shortly be posted to shareholders, and after adoption at the Annual General Meeting on 26 April 2019 will
be delivered to the registrar.

21
2. ALTERNATIVE PERFORMANCE MEASURES
The Group uses adjusted figures as key performance measures in addition to those reported under adopted IFRS, as management believe these measures facilitate greater comparison of the Group’s underlying results with prior periods and assessment of trends in financial performance. The key alternative performance measures that the Group use include adjusted profit measures and organic constant currency (OCC). Explanations of how they are calculated and how they are reconciled to IFRS statutory results are set out below. a. Adjusted operating profit
Adjusted operating profit is the Group’s operating profit excluding the amortisation of acquired intangible assets and other
adjustments that are considered to be significant and where treatment as an adjusted item provides stakeholders with additional
useful information to assess the trading performance of the Group on a consistent basis. Further details on the other adjustments
are given in note 4.
b. Adjusted profit before tax
The adjustments in calculating adjusted profit before tax are consistent with those in calculating adjusted operating profit above.
2018 2017
Profit before tax 120,748 80,586
Adjustments:
Amortisation of acquired intangible assets 20,284 27,183
Curtailment gain from the closure of defined benefit pension schemes to future accrual (8,575) -
Guaranteed Minimum Pension equalisation expense 920 -
Release of contingent consideration - (10,000)
Impairment of goodwill - 21,594
Consultancy costs associated with the Growth Acceleration Programme 4,052 1,630
Loss on disposal of businesses 658 -
Redundancy and executive change costs 2,896 1,980
Other restructuring costs 2,862 1,803
Adjusted profit before tax 143,845 124,776
c. Adjusted basic and diluted earnings per share
Adjusted basic earnings per share is calculated using the adjusted net profit attributable to the ordinary shareholders and dividing it by the weighted average ordinary shares in issue (see note 8). Adjusted net profit attributable to ordinary shareholders is calculated as follows:
2018 2017
Net profit attributable to ordinary shareholders 91,744 55,613
Adjustments:
Amortisation of acquired intangible assets 20,284 27,183
Curtailment gain from the closure of defined benefit pension schemes to future accrual (8,575) -
Guaranteed Minimum Pension equalisation expense 920 -
Release of contingent consideration - (10,000)
Impairment of goodwill - 21,594
Consultancy costs associated with the Growth Acceleration Programme 4,052 1,630
Loss on disposal of businesses 658 -
Redundancy and executive change costs 2,896 1,980
Other restructuring costs 2,862 1,803
Tax effect on adjusted items (5,025) (7,879)
Adjusted net profit attributable to ordinary shareholders 109,816 91,924
Diluted earnings per share is calculated by using the adjusted net profit attributable to ordinary shareholders and dividing it by the weighted average ordinary shares in issue adjusted to assume conversion of all potentially dilutive ordinary shares (see note 8). d. Adjusted dividend cover
Dividend cover is calculated as earnings per share divided by dividends per share. Adjusted dividend cover is calculated as
adjusted earnings per share as defined in note 2c above divided by dividends per share.

22
e. Return on capital employed
The return on capital employed ratio is used by management to help ensure that capital is used efficiently.
2018 2017
Adjusted operating profit 146,015 130,162
Capital employed
Shareholders' funds 513,628 457,200
Cash and cash equivalents (104,489) (63,192)
Interest bearing loans and borrowings 60,881 75,807
Pension deficit net of deferred tax 22,001 38,924
Capital employed 492,021 508,739
Average capital employed 500,380 522,141
Return on capital employed 29.2% 24.9%
Average capital employed is defined as the average of the capital employed at the start and end of the relevant year. f. Working capital as a percentage of revenue
Working capital as a percentage of revenue is monitored as control of working capital is key to achieving our cash generation
targets. It is calculated as inventory plus trade receivables, less trade payables, divided by revenue. g. Organic constant currency (OCC)
OCC results remove the results of businesses acquired or disposed of during the period that are not consistently presented in both periods' results. The 2018 results are restated at 2017 exchange rates. For businesses acquired, the full results are removed from the year of acquisition. In the following year, the results for the number of months equivalent to the pre-acquisition period In the prior year are removed. For disposals and closure of businesses, the results are removed from the current and prior periods. Key headings in the income statement are reconciled to OCC as follows:
31 December 2018
Currency adjustment
Impact of disposals
OCC 31 December
2018
Revenue 695,713 16,436 (3,145) 709,004
Cost of sales (384,203) (10,361) 1,943 (392,621)
Gross margin 311,510 6,075 (1,202) 316,383
Overheads (165,495) (2,404) 1,141 (166,758)
Adjusted operating profit 146,015 3,671 (61) 149,625
Interest (2,170) (136) (4) (2,310)
Adjusted profit before tax 143,845 3,535 (65) 147,315
Adjusted taxation (34,029) (838) 40 (34,827)
Adjusted profit after tax 109,816 2,697 (25) 112,488
31 December
2017 Currency
adjustment Impact of disposals
31 December 2017
Revenue 642,229 - (5,319) 636,910
Cost of sales (358,090) - 3,290 (354,800)
Gross margin 284,139 - (2,029) 282,110
Overheads (153,977) - 2,213 (151,764)
Adjusted operating profit 130,162 - 184 130,346
Interest (5,386) - (8) (5,394)
Adjusted profit before tax 124,776 - 176 124,952
Taxation (32,852) - 11 (32,841)
Adjusted profit after tax 91,924 -
187 92,111

23
3. OPERATING SEGMENTS
The Group has chosen to organise the management and financial structure by the grouping of related products. The four identifiable
operating segments for which the financial and operating performance is reviewed monthly by the chief operating decision maker are
as follows:
Controls – the design, manufacture and sale of electric actuators
Fluid Systems – the design, manufacture and sale of pneumatic and hydraulic actuators
Gears – the design, manufacture and sale of gearboxes, adaption and ancillaries for the valve industry
Instruments – the manufacture of high precision pneumatic controls and power transmission products for a wide range of industries
Unallocated expenses comprise corporate expenses.
Transfer prices between business segments are set on an arm’s length basis in a manner similar to transactions with third parties.
Geographic analysis
Rotork has a worldwide presence in all four operating segments through its subsidiary selling offices and through an agency
network. A full list of locations can be found at www.rotork.com.
Analysis by operating segment:
Controls
2018
Fluid
Systems
2018
Gears
2018
Instruments
2018
Elimination
2018
Unallocated
2018
Group
2018
Revenue from external customers 351,858 166,328 76,260 101,267 – – 695,713
Inter segment revenue – – 9,352 5,887 (15,239) – –
Total revenue 351,858 166,328 85,612 107,154 (15,239) – 695,713
Adjusted operating profit* 101,344 16,135 15,307 24,085 – (10,856) 146,015
Amortisation of acquired intangible assets (2,851) (779) (2,082) (14,572) – – (20,284)
Segment result before adjustments 98,493 15,356 13,225 9,513 – (10,856) 125,731
Other adjustments (2,813)
Operating profit 122,918
Net finance expense (2,170)
Income tax expense (29,004)
Profit for the year 91,744
Controls
2017
Fluid
Systems
2017
Gears
2017
Instruments
2017
Elimination
2017
Unallocated
2017
Group
2017
Revenue from external customers 325,174 150,117 72,814 94,124 – – 642,229
Inter segment revenue – – 11,086 6,498 (17,584) – –
Total revenue 325,174 150,117 83,900 100,622 (17,584) – 642,229
Adjusted operating profit* 92,903 9,019 15,724 20,457 – (7,941) 130,162
Amortisation of acquired intangible assets (2,888) (1,409) (2,021) (20,865) – – (27,183)
Segment result before adjustments 90,015 7,610 13,703 (408) – (7,941) 102,979
Other adjustments (17,007)
Operating profit 85,972
Net finance expense (5,386)
Income tax expense (24,973)
Profit for the year 55,613
*Adjusted operating profit is operating profit before the amortisation of acquired intangible assets and other adjustments (see note 4)

24
Controls
2018
Fluid
Systems
2018
Gears
2018
Instruments
2018
Unallocated
2018
Group
2018
Depreciation 5,113 2,507 2,374 1,616 32 11,642
Amortisation:
– Acquired intangible assets 2,851 779 2,082 14,572 – 20,284
– Development costs 1,463 216 242 654 – 2,575
Impairment of goodwill – – – – – –
Release of contingent consideration – – – – – –
Impairment of development cost assets 143 162 216 178 – 699
Impairment of property, plant and equipment 1,350 – – – – 1,350
Non-cash items: equity settled share-based payments 2,107 925 532 522 588 4,674
Net financing expense – – – – (2,170) (2,170)
Capital expenditure 5,201 1,598 2,023 1,606 – 10,428
Controls
2017
Fluid
Systems
2017
Gears
2017
Instruments
2017
Unallocated
2017
Group
2017
Depreciation 5,622 2,801 1,813 1,951 45 12,232
Amortisation:
– Acquired intangible assets 2,888 1,409 2,021 20,865 – 27,183
– Development costs 1,670 469 259 301 – 2,699
Impairment of goodwill – – 1,840 19,754 – 21,594
Release of contingent consideration – – – (10,000) – (10,000)
Non-cash items: equity settled share-based payments 1,515 652 418 545 260 3,390
Net financing expense – – – – (5,386) (5,386)
Capital expenditure 7,355 1,495 1,622 1,933 – 12,405
Balance sheets are reviewed by subsidiary and operating segment balance sheets are not prepared, therefore no further analysis of
operating segments assets and liabilities is presented.
Geographical analysis:
Revenue by location of subsidiary 2018 2017
UK 71,458 76,281
Italy 80,772 82,165
Rest of Europe 127,960 113,822
USA 149,180 149,526
Other Americas 42,235 31,549
Rest of World 224,108 188,886
695,713 642,229

25
4. OTHER ADJUSTMENTS
The other adjustments are adjustments that management consider to be significant and where separate disclosure enables stake-holders to assess the underlying trading performance of the Group on a consistent basis. The other adjustments to profit included in statutory profit are as follows: 2018 2017
Curtailment gain from the closure of defined benefit pension schemes to future accrual 8,575 -
Guaranteed Minimum Pension (GMP) equalisation expense (920) -
Release of contingent consideration - 10,000
Goodwill impairment - (21,594)
7,655 (11,594)
Consultancy costs associated with the Growth Acceleration Programme (4,052) (1,630)
Loss on disposal of businesses (658) -
Redundancy and executive change costs (2,896) (1,980)
Other restructuring costs (2,862) (1,803)
(10,468) (5,413)
(2,813) (17,007)
After the completion of consultation processes with members of the UK and US defined benefit pension schemes both schemes
were closed to future accrual on 31 March 2018 and 31 December 2018, respectively. The closure to future accrual of the two
schemes resulted in a one off, non-cash curtailment gain which reduced the defined benefit obligation by £8,575,000 (2017: £nil).
In October 2018 the High Court judgement in the case of Lloyds Banking Group clarified that pension benefits under the UK scheme
need to be equalised for the effects of unequal GMPs. An allowance of £920,000 (2017: £nil) has been included as a past service
cost within the UK scheme’s 2018 defined benefit pension expense for all such arrears.
Consultancy costs of £4,052,000 (2017: £1,630,000) were incurred on developing the growth acceleration programme. The
consultancy costs in the second half of the year reduced to £752,000.
The loss on disposal of £658,000 (2017: £nil) relates to the sale of the Hiller business, closure of an engineering office and the
closure of the Valvekits business. The assets of £3,831,000 disposed of included goodwill (£2,239,000), inventory (£1,541,000) and
a building (£474,000). Redundancy costs (£704,000) and asset write-downs specific to the disposals (£464,000) contributed to the
other costs of exiting the businesses. Proceeds of £3,010,000 were received in respect of the Hiller business and £1,330,000 in
respect of the assets of the Valvekits business. The impact of these disposals on revenue and profit in 2018 and the prior year is
shown in note 2.
The £2,896,000 (2017: £1,980,000) redundancy and executive change costs have been incurred as a result of the progress made
with the Growth Acceleration Programme.
Other restructuring costs include £700,000 (2017: £nil) related to ending development and sales of products for the containment
area of nuclear power plants and a £1,350,000 (2017: £nil) impairment charge resulting from the ongoing review of the global
footprint.
The £8,575,000 credit relating to the closure of the UK and US defined benefit pension schemes is included in other income. All
other adjustments are included in administrative expenses, with the exception of the loss on the disposal of businesses which is
included in other expenses. The asset write-downs relating to property, and certain of the costs relating to the closure and disposal
of businesses are not tax-deductible. The remaining adjustments are taxable or tax-deductible in the country in which the expense is
incurred.
5. FINANCE INCOME AND EXPENSE
Recognised in the income statement
2018 2017
Interest income 1,618 1,206
Foreign exchange gains 660 175
Finance income 2,278 1,381
2018 2017
Interest expense (3,072) (3,184)
Interest charge on pension scheme liabilities (1,055) (1,607)
Foreign exchange losses (321) (1,976)
Finance expense (4,448) (6,767)

26
6. INCOME TAX EXPENSE
2018 2018
2017 2017
Current tax:
UK corporation tax on profits for the year 3,476 3,407
Adjustment in respect of prior years (851) (974)
2,625 2,433
Overseas tax on profits for the year 27,646 27,386
Adjustment in respect of prior years (223) 343
27,423 27,729
Total current tax 30,048 30,162
Deferred tax:
Origination and reversal of other temporary differences (1,307) (6,711)
Impact of rate change 30 1,162
Adjustment in respect of prior years 233 360
Total deferred tax (1,044) (5,189)
Total tax charge for year 29,004 24,973
Profit before tax 120,748 80,586
Profit before tax multiplied by the blended standard rate of corporation tax in
the UK of 19.0% (2017: 19.25%) 22,942 15,513
Effects of: Different tax rates on overseas earnings 7,107 6,571
Permanent differences 1,015 138
Losses not recognised (90) 768
Tax incentives (1,159) (1,140)
Impact of rate change 30 1,162
Non-taxable contingent consideration - (1,925)
Non-deductible goodwill written off - 4,157
Adjustments to tax charge in respect of prior years (841) (271)
Total tax charge for year 29,004 24,973
Effective tax rate 24.0% 31.0%
Adjusted profit before tax (note 2b) 143,845 124,776
Total tax charge for the year 29,004 24,973
Amortisation of acquired intangible assets 4,499 6,664
Defined benefit pension schemes (note 4) (1,301) -
Restructuring costs (note 4) 1,827 1,215
Adjusted total tax charge for the year 34,029 32,852
Adjusted effective tax rate 23.7% 26.3%
A tax credit of £98,000 (2017: £252,000) in respect of share-based payments has been recognised directly in equity in the year.
The effective tax rate for the year is 24.0% (2017: 31.0%). The adjusted effective tax rate is 23.7% (2017: 26.3%) and is lower than
the effective tax rate for the year principally because of the geographic mix of those countries where certain of the adjusting items
were incurred.
The adjusted effective tax rate has fallen from 26.3% in 2017 to 23.7% in 2018, principally because of the reduction in the US
corporate tax rate from 35% to 21%, which came into effect on 1 January 2018. In 2017 this resulted in a one-off charge to tax of
£1,162,000 on the revaluation of the US net deferred tax asset, and in 2018 this has resulted in a reduction in the US tax charge
because of the lower rate of tax. The Group expects its adjusted effective tax rate to continue to fall in line with the current trend in
corporate tax rates where Rotork operates. However the adjusted effective tax rate will still be higher than the standard UK rate due
to higher rates of tax in China, the US, Canada, France, Germany, Italy, Japan and India.
There is an unrecognised deferred tax liability for temporary differences associated with investments in subsidiaries. Rotork plc
controls the dividend policies of its subsidiaries and the timing of the reversal of the temporary differences. The value of temporary
differences associated with unremitted earnings of subsidiaries for which deferred tax has not been recognised is £321,281,000
(2017: £305,277,000).

27
7. CAPITAL AND RESERVES
0.5p Ordinary
shares
issued
and fully
paid up
2018
£1 Non-
redeemable
preference
shares
2018
0.5p Ordinary
shares
issued
and fully
paid up
2017
£1 Non-
redeemable
preference
shares
2017
At 1 January 4,352 40 4,350 40
Issued under employee share schemes 6 – 2 –
At 31 December 4,358 40 4,352 40
Number of shares (000) 871,625 870,429
The ordinary shareholders are entitled to receive dividends as declared and are entitled to vote at meetings of the Company.
The Group received proceeds of £1,837,000 (2017: £713,000) in respect of the 1,197,838 (2017: 378,540) ordinary shares issued
during the year: £6,000 (2017: £2,000) was credited to share capital and £1,831,000 (2017: £711,000) to share premium.
The preference shareholders take priority over the ordinary shareholders when there is a distribution upon winding up the Company
or on a reduction of equity involving a return of capital. The holders of preference shares are entitled to vote at a general meeting of
the Company if a preference dividend is in arrears for six months or the business of the meeting includes the consideration of a
resolution for winding up the Company or the alteration of the preference shareholders’ rights.
Within the retained earnings reserve are own shares held. The investment in own shares held is £4,227,000 (2017: £1,594,000) and
represents 1,387,000 (2017: 566,000) ordinary shares of the Company held in trust for the benefit of directors and employees for
future payments under the Share Incentive Plan and Long Term Incentive Plan. The dividends on these shares have been waived.
Translation reserve
The translation reserve comprises all foreign exchange differences arising from the translation of the financial statements of foreign
operations.
Capital redemption reserve
The capital redemption reserve arises when the Company redeems shares wholly out of distributable profits.
Hedging reserve
The hedging reserve comprises the effective portion of the cumulative net change in the fair value of cash flow hedging instruments
that are determined to be an effective hedge.
Dividends
The following dividends were paid in the year per qualifying ordinary share:
2018
Payment date 2018 2017
3.35p final dividend (2017: 3.15p) 23 May 29,154 27,391
2.20p interim dividend (2017: 2.05p) 21 September 19,134 17,827
48,288 45,218
After the balance sheet date the following dividends per qualifying ordinary share were proposed by the directors. The dividends
have not been provided for and there are no corporation tax consequences.
2018 2017
Final proposed dividend per qualifying ordinary share
3.70p 32,250
3.35p 29,159
28
8. EARNINGS PER SHARE
Basic earnings per share
Earnings per share is calculated for both the current and previous years using the profit attributable to the ordinary shareholders for
the year. The earnings per share calculation is based on 869.9m shares (2017: 869.4m shares) being the weighted average number
of ordinary shares in issue (net of own ordinary shares held) for the year.
2018 2017
Net profit attributable to ordinary shareholders 91,744 55,613
Weighted average number of ordinary shares
Issued ordinary shares at 1 January 869,863 869,087
Effect of own shares held (115) 252
Effect of shares issued under Sharesave plans 123 95
Weighted average number of ordinary shares during the year 869,871 869,434
Basic earnings per share 10.5p 6.4p
Adjusted basic earnings per share
Adjusted basic earnings per share is calculated for both the current and previous years using the profit attributable to the ordinary
shareholders for the year after adding back the after tax impact of the adjustments. The reconciliation showing how adjusted net
profit attributable to ordinary shareholders is derived is shown in note 2.
2018 2017
Adjusted net profit attributable to ordinary shareholders 109,816 91,924
Weighted average number of ordinary shares during the year 869,871 869,434
Adjusted basic earnings per share 12.6p 10.6p
Diluted earnings per share
Diluted earnings per share is based on the profit for the year attributable to the ordinary shareholders and 874.0m shares (2017:
872.0m shares). The number of shares is equal to the weighted average number of ordinary shares in issue (net of own ordinary
shares held) adjusted to assume conversion of all potentially dilutive ordinary shares. The Company has two categories of
potentially dilutive ordinary shares: those share options granted to employees under the Sharesave plan where the exercise price is
less than the average market price of the Company’s ordinary shares during the year and contingently issuable shares awarded
under the Long Term Incentive Plan (LTIP).
2018 2017
Net profit attributable to ordinary shareholders 91,744 55,613
Weighted average number of ordinary shares (diluted)
Weighted average number of ordinary shares for the year 869,871 869,434
Effect of Sharesave options 1,583 1,583
Effect of LTIP share awards 2,514 993
Weighted average number of ordinary shares (diluted) during the year 873,968 872,010
Diluted earnings per share 10.5p 6.4p
Adjusted diluted earnings per share
2018 2017
Adjusted net profit attributable to ordinary shareholders 109,816 91,924
Weighted average number of ordinary shares (diluted) during the year 873,969 872,010
Adjusted diluted earnings per share 12.6p 10.5p

29
9. EMPLOYEE BENEFITS
2018 2017
Recognised liability for defined benefit obligations:
- Present value of funded obligations 207,021 237,054
- Fair value of plan assets (179,728) (188,844)
27,293 48,210
Other pension scheme liabilities 409 344
Employee bonuses 21,703 17,512
Long term incentive plan 641 331
Employee indemnity provision 2,677 2,823
Other employee benefits 5,040 4,537
57,763 73,757
Non-current 31,274 52,293
Current 26,489 21,464
57,763 73,757
10. PROVISIONS
Contingent
consideration
Warranty
provision
Restructuring
provision Total
Balance at 1 January 2018 397 5,847 – 6,244
Exchange differences 3 148 27 178
(Credit) / charge to the income statement (91) 3,641 2,674 6,224
Provisions utilised during the year (10) (2,766) (1,125) (3,901)
Disposal of business – (359) – (359)
Balance at 31 December 2018 299 6,511 1,576 8,386
Maturity at 31 December 2018
Non-current – 2,149 – 2,149
Current 299 4,362 1,576 6,237
299 6,511 1,576 8,386
Maturity at 31 December 2017
Non-current – 1,929 – 1,929
Current 397 3,918 – 4,315
397 5,847 – 6,244
The warranty provision is based on estimates made from historical warranty data associated with similar products and services.
The provision relates mainly to products sold during the last 12 months and the typical warranty period is 18 months.
The restructuring provision relates to amounts outstanding in respect of redundancy and other restructuring costs associated with
the Growth Acceleration Programme.
11. RELATED PARTIES
The Group has a related party relationship with its subsidiaries and with its directors and key management. Transactions between
two subsidiaries for the sale and purchase of products or the subsidiary and parent Company for management charges are priced
on an arm's length basis.
Evoqua Water Technologies LLC is a related party of Rotork plc by virtue of M Lamb's non-executive chairmanship. Sales to
subsidiaries and associates of Evoqua Water Technologies LLC totalled £80,000 during the year and £18,000 was outstanding at 31
December 2018.
Drax Group plc is a related party of Rotork plc by virtue of T Cobbold's non-executive directorship. Sales to subsidiaries and
associates of Drax Group plc totalled £475,000 during the year and £143,000 was outstanding at 31 December 2018.
TechnipFMC plc is a related party of Rotork plc by virtue of A Andersen's employment with the company. Sales to subsidiaries and
associates of TechnipFMC plc totalled £690,000 during the year and £289,000 was outstanding at 31 December 2018.
All the transactions above are on an arm's length basis and on standard business terms.

30
FINANCIAL CALENDAR
4 March 2019 Preliminary announcement of annual results for 2018
11 April 2019 Ex-dividend date for final proposed 2018 dividend
12 April 2019 Record date for final proposed 2018 dividend
26 April 2019 Announcement of trading update
26 April 2019 Annual General Meeting held at Bailbrook House Hotel, Eveleigh Avenue, London Road, Bath, BA1 7JD
6 August 2019 Announcement of interim financial results for 2019