ross f. walker · michio kumagai image analysis as a tool ... · ross f. walker · michio kumagai...
TRANSCRIPT

Limnology (2000) 1:107–115 © The Japanese Society of Limnology 2000
RESEARCH PAPER
Ross F. Walker · Michio Kumagai
Image analysis as a tool for quantitative phycology: a computationalapproach to cyanobacterial taxa identification
Received: September 6, 1999 / Accepted: February 6, 2000
Abstract In the following work we discuss the application ofimage processing and pattern recognition to the fieldof quantitative phycology. We overview the area of imageprocessing and review previously published literature per-taining to the image analysis of phycological images and,in particular, cyanobacterial image processing. We thendiscuss the main operations used to process images andquantify data contained within them. To demonstrate theutility of image processing to cyanobacteria classification,we present details of an image analysis system for automati-cally detecting and classifying several cyanobacterial taxa ofLake Biwa, Japan. Specifically, we initially target the genusMicrocystis for detection and classification from amongseveral species of Anabaena. We subsequently extend thesystem to classify a total of six cyanobacteria species. High-resolution microscope images containing a mix of the abovespecies and other nontargeted objects are analyzed, and anydetected objects are removed from the image for furtheranalysis. Following image enhancement, we measure objectproperties and compare them to a previously compiled data-base of species characteristics. Classification of an object asbelonging to a particular class membership (e.g., “Micro-cystis,” “A. smithii,” “Other,” etc.) is performed using para-metric statistical methods. Leave-one-out classificationresults suggest a system error rate of approximately 3%.
Key words Image processing · Pattern recognition ·Phycology · Cyanobacteria · Classification
Introduction
The application of engineering techniques to phycologycontinues to play a growing role in understanding the
R.F. Walker (*) · M. KumagaiLake Biwa Research Institute, 1-10 Uchidehama, Otsu 520-0806,JapanTel. 181-77-526-4690; Fax 181-77-526-4803e-mail: [email protected]
complex physical and biological relationships between al-gae and their environments. A brief survey of the literatureshows a steady rise in such applications since the early1980s, influenced in part by the availability of powerful yetinexpensive computing systems. A further reason is thecontinuing worldwide deterioration of environmentalhealth and a growing awareness among researchers andscholars that many areas of phycology (especially algae andits potential for environmental contamination) are little un-derstood. The past 20 years have seen a slow but gradualincrease in the frequency of use of image-processing tech-niques in the area of phycology and water analysis. Katsiniset al. (1984) used image processing to classify marine zoop-lankton into one of eight taxonomic groups, with 92% accu-racy. In the same year, Jeffries et al. (1984) used imageanalysis to automatically count, size, and identify zooplank-ton, with a reported 90% accuracy. Estep et al. (1986) usedimage processing to determine the abundance, size, shape,volume, and surface area of microorganisms ranging frombacteria to fish larvae. Schultze-Lam et al. (1992) usedelectron microscopy and image analysis to quantify the roleof the cyanobacteria Synechococcus spp. in lake mineralgrowth. More recently, artificial neural networks were usedby Blackburn et al. (1998) and Wilkins et al. (1999) toclassify images of stained bacterial plankton.
The increasing occurrence of algal bloom contaminationin both lakes and sea serves as a worrying indicator ofincreasing environmental stress on water ecosystems. LakeBiwa, Japan’s largest lake and source of drinking waterfor over thirteen million people, has experienced suchblooms with increasing frequency over the last decade. Themajority of these blooms are caused by three genera ofcyanobacteria – Microcystis, Anabaena, and Planktothrix– as well as one species of Chrysophyceae, Uroglenaamericana. A telling contrast to the deteriorating conditionof the lake’s waters can be seen in Nakanishi’s (1984) com-prehensive review of Lake Biwa’s 90 species of algae (in-cluding 12 Cyanophyceae), which makes no mention ofcyanobacterial blooms.
In the summer of 1994, the influences of a severe droughtand eutrophication produced serious algal blooms at vari-

108
ous locations in Lake Biwa and other water bodies through-out Japan. Lake Biwa’s Akanoi Bay was especially affected,with higher concentrations of cyanobacteria and longerbloom durations than elsewhere in the lake. There is strongpotential for the cyanobacteria produced in Akanoi Bay tospread to a huge area of Lake Biwa (Kumagai 1996). Tounderstand the environmental precursors to algal bloomsand to allow corrective measures to be implementedprior to bloom manifestation, quantitative measurement ofcyanobacteria species and population densities is essential.Such monitoring of water bodies (for the presence or ab-sence of targeted species) usually involves the manualanalysis of water samples by trained experts – a very time-consuming and, therefore, expensive operation. Because ofthis, considerable advantage can be gained by implementingan automated measurement system via image processingand pattern recognition. Recent advances in computerperformance and image analysis now allow the possibility ofassisted or “adjunct” screening of water samples by imageprocessing and pattern recognition systems. However, thisarea of research has seen slow progress over the last de-cade, with very little published literature. Apart from Thiel(1994), there appear to be no other major published worksor texts on this subject, and few active researchers areworking on this significant problem. We feel that the rapidtechnological advances in high-speed computers and high-resolution digital cameras will yield systems usable in real-world applications.
In this paper, we detail the implementation and evalua-tion of an image processing system for automaticallydetecting and classifying cyanobacteria taxa and report clas-sification results. We first introduce the topic of cyanobac-teria image analysis and discuss several problems that makesuch analysis inherently difficult. We then discuss the hard-ware, software, and image processing technology that hasresulted from the approximately 15-month life of this pro-ject. Finally, we present the significant results of our researchand discuss relevant points that need further investigation.
Cyanobacteria image analysis
Although very similar to other forms of image analysis,cyanobacteria classification presents the image analyst withits own inherent difficulties. The dynamic and variable na-ture of the lake microcosm creates a formidable challengeto designing a robust pattern recognition system with theideal characteristics of high analysis accuracy but with widegeneralization ability. Below we discuss a number of thesechallenges:
Intraspecies variation due to natural phenomena:life-cycle and environmental effects (seasonal change)
Pattern recognition relies on the accurate modeling of sta-tistical properties of population densities. The dynamic na-ture of living organisms such as cyanobacteria and algaeresults in properties such as cell area or colony volume
being statistically non-stationary (having statistical proper-ties that vary over time, etc.). For example, the averagecyanobacterium volume may be quite low during the earlystages of a bloom but may be orders of magnitude largerwhen the bloom has matured. Exceptionally favorablegrowing conditions may result in uncharacteristically largespecimens, resulting in data “outliers.” Ultimately, theclassification accuracy of an image processing system underthese circumstances will rely on the training databasecapturing as much of this variability as possible. That is,cyanobacteria samples contained in the database shouldreflect the variability that is found in the natural population.Figure 1 shows two images of Uroglena americana coloniesat differing stages in their life cycle.
Fig. 1. Intraspecies variation due to natural life cycle. Specimens of U.americana, differing in age by 2 weeks, and displayed at the samespatial resolution (2.0 µm), 310
Intraspecies variation due to predation, fragmentation,etc.
In simple words – body parts. Although algae generallyhave regular shapes (spherical, spiral, straight, oval), atypi-cal characteristics can occur due to predation, environ-mental factors, or aging. For example, Fig. 2 shows thedeterioration of a Uroglena americana colony due to unfa-vorable environmental conditions.
Fig. 2. Intraspecies variation due to damage. This image shows an U.americana specimen whose cell colony has started to disintegrate.Characteristics for this colony (such as colony shape and area) will bequite different from the norm, making such characteristics possiblestatistical outliers. Spatial resolution 2.0 µm, 310

109
To stain, or not to stain?
Some species appear clear or opaque at the resolutionsused, making imaging and analysis very difficult. Althoughit is common to stain specimen samples prior to analysis, thestaining process itself will negate the goal of fully auto-mated, in-situ, real-time analysis of water samples. A reviewof the literature suggests that the automated analysis ofunstained algae samples is currently rare.
Choosing an appropriate optical resolution for imagingspecimens
The wide variation in bulk size of targeted species necessi-tates a choice of optical magnification that may not be opti-mal for any of the species. For example, to analyze the fineinternal structures of species such as Anabaena, a spatialresolution of around 0.3µm is required (Fig. 3). (Spatialresolution is related to the optical microscope’smagnification via the imaging camera’s pixel pitch or spac-ing, and objective lens magnification.) However, at such ahigh spatial resolution, Microcystis colony specimens gener-ally cannot fit within the microscope’s field of view. Wehave found that a resolution of 2.0µm provides an unavoid-able compromise between imaging large targeted speciesand fine internal structures. Although a multi-resolutionapproach is theoretically possible (using two or moreobjective lenses), the difficulties in manufacturing andimplementing such a system are significant. In the future,mega-pixel digital cameras will help to alleviate this prob-lem by removing the requirement for several objectivelenses. However, in the meantime, one should ensure thattargeted species have bulk properties within an order ofmagnitude of each other, where possible.
Imaging of three-dimensional objects
Many species have significant length in the third dimension(along the optic or z axis), making their representation as atwo-dimensional image difficult. Although A. smithii can be
easily imaged, species like A. crassa (spiral) and Microcystisspp. (spherical colonies) often have z-axis propertiesgreater than the depth of field of the imaging device (Fig. 4).Therefore, significant areas of the specimen will be out offocus. The equation for an optical microscope’s depth-of-field df (the in-focus depth along the optic axis, inmicrometres) is:
d
Nf
a
5 λ
22( )
, (1)
where λ is the wavelength of incident light in micrometersand Na is the numerical aperture of the objective lens. Gen-eral microscope objective lenses having numerical aper-tures in the range of 0.3 to 1.3 only provide a focal depth ofapproximately 0.2 to 3µm, which is usually too small forimaging thick specimens.
Fig. 3. A portion of A. smithii, imaged at a resolution of 0.4µm (left)and 2.0µm (right). Note the loss of fine detail at the lower resolution of2.0 µm, making measurements such as akinete and heterocyst size ortexture analysis difficult. The higher resolution of 0.4µm tends to beinappropriate for larger species such as Microcystis
Fig. 4. This image illustrates the difficulties in imaging three-dimensional objects. Notice that several parts of the object (M.aeruginosa) are out of focus. Defocused areas may influence the accu-racy of statistical measures of image properties. Spatial resolution0.5 µm, 340
Water samples will contain a wide range of objects (or-ganic and inorganic), which the system will need to be able tohandle. Nontargeted species or objects will generally need tobe classified, because it is not known a priori by the systemthat an object is a nontargeted one. The infinite variability innontargeted object characteristics means that it is extremelydifficult to accurately quantify such characteristics in a statis-tical sense. This will be perhaps the most difficult problemfaced by designers of the image processing system.
Methods
System hardware
The work we present here represents the results of approxi-mately 15 months of system research and development.

110
Apart from the light microscope, the image processing sys-tem has been designed using readily available components,with the aim of keeping the overall system cost to a mini-mum. A fully self-contained submersible microscope willreplace the bench-mounted microscope in the near future,thus allowing fully automated in situ processing of watersamples. After training and calibration, the system can nowoperate almost autonomously. Water sample flow througha water channel cell is currently done manually; however,this operation can be easily automated. Figure 5 shows thesystem, consisting of purpose-built optical microscope withwater sample feed system, high-resolution gray-scale digitalimaging camera, digital frame grabber, and image process-ing computer. Image magnification and focus are controlledvia a single remote x-y joystick. However, once appropriatemagnification is chosen, it is not varied. Indeed, magnifica-tion should not be varied once set, because the reliability ofclassification depends on all objects being imaged at thesame magnification. Sample water is passed as a continuousstream through a channel cell under the microscope’s objec-tive. The water channel cell was manufactured with achannel depth of 0.8mm, to allow for large objects to flowthrough the cell channel without clogging. However, at themagnification used, the focal depth of the microscope opticswas low (ø25µm). Because we have no control over wherein the 0.8-mm channel depth objects will appear, poorlyfocused objects can and do occur. We handle this problemby measuring the focal accuracy of each image object beforeprocessing, and only classifying those objects with adequatefocus. We chose to image the lower portion of the 0.8-mmchannel depth, because gravity helps to shift floating objectsto this level. Digital images of this water are sequentiallycaptured and processed by a high-speed image proces-sing computer. Objects contained within any image areanalyzed, and the results of the analysis are stored anddisplayed. Figure 6 details the general processing steps in-volved in an image-processing system.
For the purposes of this study, we initially classifiedimage objects as being either from the class “Microcystis” or
from the class “Other.” By the class “Other” we mean allimage objects that are not from the genus Microcystis. Suchobjects include other cyanobacteria species (Anabaena flos-aquae, A. smithii, A. planctonica, and A. ucrainica), zoop-lankton, weed, sediment, air bubbles, etc. Because it wasnot necessary to classify specimens to the species level, animage spatial resolution of 3.5µm was adequate.
To determine the feasibility of a much finer classifica-tion, we implemented a second classification process involv-ing a total of seven object classes: A. flos-aquae, A. smithii,A. crassa, A. crassa MIK1, M. aeruginosa, M. wesenbergii,and “Other.” (A. crassa MIK1 was identified as A. crassa,but this strain was isolated from Lake Mikata in FukuiPrefecture, Japan. All other strains were isolated from LakeBiwa.) For this trial, we used images captured at a higherspatial resolution of 0.35µm. This allowed better character-ization of texture properties (higher-order spatial depen-dencies), which are ideal for discriminating between finedifferences in Microcystis spp. colony arrangements andAnabaena cell-structure properties.
Image-processing methods
Nonuniform illumination correction
Digital images received for analysis are preprocessed toreduce the effects of nonuniform illumination. Such anundesirable characteristic, which represents a nonlineartransformation of the true image intensity data, can presenta severe challenge to subsequent image processing algo-rithms, such as segmentation. In the present system, non-uniform illumination is corrected by using a sequence ofblank background images – images that contain no speci-mens or detritus, etc. These images are pixel-wise averagedto reduce the effects of pixel noise (due both to illuminationnoise and camera CCD electrical noise). This averagedbackground image IB is used to filter water sample images Iusing the following equation:
¢( ) ( ) ( )
( )ÏÌÔ
ÓÔ
¸˝ÔÔ
"I r c I r cI I r c
I r cB B
Br c, ,
,
,,max
,
5 1 2
1 (2)
where (r, c) represents a valid image pixel co-ordinate pair,IB max
is the maximum pixel intensity in the averaged back-
Fig. 5. Microscope and high-resolution digital imaging system. Micro-scope objective is an Optem Zoom 100 lens with 23 TV tube (N.A.0.1). The digital camera is a Hitachi KPF100 10-bit gray-scale high-resolution digital camera with pixel density of 1300 3 1024. Images arecaptured by an Epix PIXCID PCI bus imaging board
Fig. 6. Processing steps and data flow in a general-purpose image-processing system
Microscope lensand objective
Water sample flow control
Focus and magnification control
Fibre-optic light cable
Illumination source
Digital camera
111
ground image, and I9 is the resulting filtered image. As afurther step to make the system invariant to average illumi-nation intensity variation (which can vary daily or evenfrom image to image, if not specifically set), we apply afurther operation,
¢¢( ) ¢( )
¢"I r c
I r c
I r c,, *
,max
,
5 240
(3)
where I0 is the corrected image, and I9max is the maximumpixel intensity in I9. This final process normalizes the back-ground intensity of input images to a gray level of 240 (outof a maximum of 256 due to eight-bit photometric resolu-tion), regardless of the microscope’s illumination settings.The figure of 240 was chosen to allow a slight buffer be-tween the background intensity of images and image satura-tion. Figure 7 shows the illumination response of themicroscope currently in use.
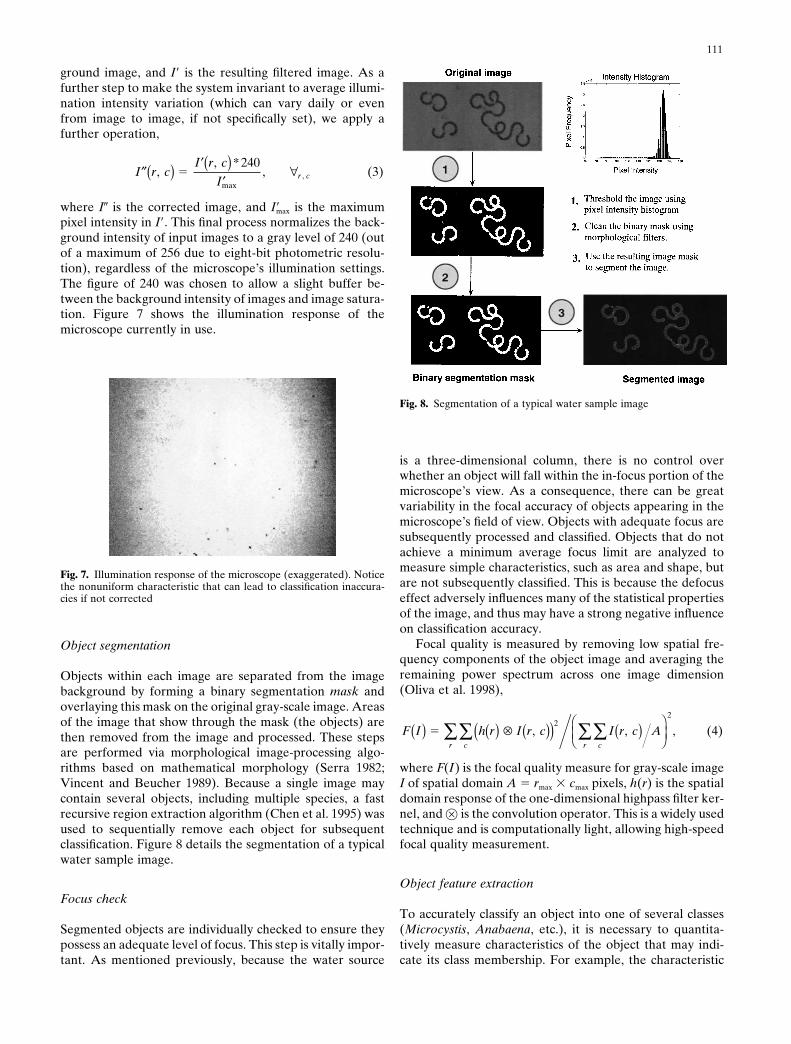
is a three-dimensional column, there is no control overwhether an object will fall within the in-focus portion of themicroscope’s view. As a consequence, there can be greatvariability in the focal accuracy of objects appearing in themicroscope’s field of view. Objects with adequate focus aresubsequently processed and classified. Objects that do notachieve a minimum average focus limit are analyzed tomeasure simple characteristics, such as area and shape, butare not subsequently classified. This is because the defocuseffect adversely influences many of the statistical propertiesof the image, and thus may have a strong negative influenceon classification accuracy.
Focal quality is measured by removing low spatial fre-quency components of the object image and averaging theremaining power spectrum across one image dimension(Oliva et al. 1998),
F I h r I r c I r c A
c crr
( ) ( ) ƒ ( )( ) ( )ÊËÁ
ˆ¯Â  5 , , ,
22
(4)
where F(I) is the focal quality measure for gray-scale imageI of spatial domain A 5 rmax 3 cmax pixels, h(r) is the spatialdomain response of the one-dimensional highpass filter ker-nel, and # is the convolution operator. This is a widely usedtechnique and is computationally light, allowing high-speedfocal quality measurement.
Object feature extraction
To accurately classify an object into one of several classes(Microcystis, Anabaena, etc.), it is necessary to quantita-tively measure characteristics of the object that may indi-cate its class membership. For example, the characteristic
Fig. 7. Illumination response of the microscope (exaggerated). Noticethe nonuniform characteristic that can lead to classification inaccura-cies if not corrected
Object segmentation
Objects within each image are separated from the imagebackground by forming a binary segmentation mask andoverlaying this mask on the original gray-scale image. Areasof the image that show through the mask (the objects) arethen removed from the image and processed. These stepsare performed via morphological image-processing algo-rithms based on mathematical morphology (Serra 1982;Vincent and Beucher 1989). Because a single image maycontain several objects, including multiple species, a fastrecursive region extraction algorithm (Chen et al. 1995) wasused to sequentially remove each object for subsequentclassification. Figure 8 details the segmentation of a typicalwater sample image.
Focus check
Segmented objects are individually checked to ensure theypossess an adequate level of focus. This step is vitally impor-tant. As mentioned previously, because the water source
Fig. 8. Segmentation of a typical water sample image

112
“area” is a good discriminator of class membership for clas-sifying Microcystis and Anabaena cyanobacteria, becausethese two genera differ substantially in size – Microcystisusually being an order of magnitude larger in area. Inpattern recognition terms, we call these characteristics“features,” and the process of measuring an object’s charac-teristics “feature extraction.”
We measured a total of 123 object features, includingmorphometric properties, object boundary shape proper-ties, frequency domain properties, and second-order statis-tical properties. A full list of features can be found inAppendix 1.
Feature selection
Without a priori knowledge, it is difficult to know which ofthe 123 feature properties will be useful for distinguishingbetween cyanobacteria species. By the term “useful,” wemean features whose statistical properties (mean and vari-ance/covariance, etc.) differ between the various classes ofdata we are trying to classify. We call such features “dis-criminatory,” in that they can be used to discriminate be-tween classes of data (Fig. 9).
Classification
We performed classification by using a general Bayes deci-sion function for assumed Gaussian feature distributionswith unequal variance-covariance matrices (Gonzalez andWoods 1993). The resulting decision surface (where d1 5 d2)is of hyperquadric form:
d P
i
i i i i iix C x x C x x( ) ( )¢ ( )È
Î͢˚
{ }
5 2 2 2 2
5
2log log ,
, ,
ω12
12
1
1
2(5)
where x is the feature vector of the object to be classified,di(x) represents the discriminant measure for x, Pωi
is the apriori probability of class ωi, and Ci and xi are the variance-covariance matrix and mean vector, respectively, for class idata (determined from a database of objects from knownclass). For the two-class trial (Microcystis vs. Other), onlyone such discriminant function need be determined. For theseven-class trial, classification was implemented by a hierar-chy of separate two-class Bayes quadratic classifier units,rather than a single seven-class classifier (Fig. 10). The highsimilarity of some interclass characteristics means that indi-vidual features may not discriminate well among all sevenclasses. Using a hierarchy of several classifier units allowedthe use of several feature sets highly optimized for detectingindividual or groups of species. Each classifier was designedby using an optimized subset of four features from theoriginal 123, using sequential-forward-selection/backward-elimination (Kittler 1978).
Fig. 9. An example that illustrates discriminatory power. The featureon the left possesses low discriminatory power because the two class-conditioned distributions have similar statistics (mean and variance).The one on the right possesses high discriminatory power – the twodistributions have little overlap. Features whose class-conditioned dis-tributions overlap the least will have greater discriminatory power
To find discriminatory features, we used a feature selec-tion process called sequential forward-selection/backward-elimination (Hand 1981). Specifically, our algorithmiteratively selects two new features and then removesone feature, thus capturing feature pairs that possesshigher-order discriminatory power. Kittler (1978) reportedthat this method almost always gave optimal results andcomputationally was comparable to less optimal ap-proaches. Using this method, we found that a total of fivefeatures from the original set of 123 provided sufficientdiscriminatory power to classify lower-resolution objectdata as being either from the classes Microcystis or fromOther (trial 1). For trial 2, where a much finer classificationwas undertaken (seven classes), discriminant analysis re-vealed that four features per discriminant function providedsufficient classification performance.
Fig. 10. Multiclass hierarchical classifier structure for trial 2. Usingseveral two-class classifier units (as opposed to a single seven-classclassifier) allows each unit to be optimized for the targeted genus/species
Estimating system performance
Measuring classifier performance generally entails quanti-fying how well the system classifies objects, and is usuallyexpressed in terms of misclassification rate or error rate, i.e.,the rate at which an object is allocated to the wrong objectclass. In our work, we have used the leave-one-out methodto estimate the real error rate. These methods are reviewedin depth in other published literature (Fukunaga 1990;Weiss and Kulikowski 1991), so we will limit our explana-tion to the basic principles of leave-one-out. Given a datasetof Ns samples, we train the classifier using Ns 2 1 samples,and test the system using the remaining sample. We repeatthis process a total of Ns times, each time leaving out a
113
different sample, until all samples have been classified once.It is important to note that for leave-one-out, the sample tobe classified is not used to train the system, and thus we canobtain an estimate of the real (as opposed to the apparent)classification performance of the system.
Results and discussion
Classification results – trial 1
A total of 1529 image objects were extracted from among1468 images of the five cyanobacteria species. Of these,1348 were found to have adequate focus and were subse-quently classified into the two classes of Microcystis orOther.
Classification results – trial 2
We extracted a total of 244 image objects of high focalquality from among 193 images of the six cyanobacteriataxa/strains. Extensive discriminant analysis indicated thatthree classes – A. smithii, A. flos-aquae, and Other – couldbe discriminated directly on an individual class basis withsufficient accuracy. (The features for each of these threeclasses exhibit statistical properties which are sufficientlydifferent from the remaining six classes, thus allowingdirect classification.) The four remaining classes weresubsequently classified based on genus (Anabaena vs.Microcystis) and finally on species (A. crassa vs. A. crassaMIK1; M. aeruginosa vs. M. wesenbergii) membership. Thehierarchical structure of the resulting classifier is detailed inFig. 10.
Following classifier training, leave-one-out classificationwas used to provide a robust estimation of the real classifi-cation error. A total of seven images were misclassified,indicating an error rate of approximately 3%. These results,in the form of a confusion matrix, are detailed in Fig. 12.Our image processing software GUI is shown in Fig. 13.
An analysis of the database features used to classify eachspecies is warranted. For the two-class classification of“Microcystis” vs. “Other,” the five optimal features used forclassification were all GLCM texture measures. The lack ofmorphological features (such as area) among these five mayat first seem surprising – after all, the characteristic shape ofMicrocystis spp. is quite different from that of Anabaenaspp. However, our feature selection algorithm searches forfeature sets that possess higher-order discriminatory power.That is, it searches for features that, as a team, discriminatethe most. So, although some morphometric features may,individually, discriminate well between the two classes ofdata, the texture features, in combination, provided an evenhigher discriminatory power. Also, Microcystis spp. cellcolony arrangement produces a strong textured appearancethat is significantly different from that of the other species,allowing texture features to provide good discrimination.
For the seven-class classification trial, four optimal fea-tures were extracted for each of the six classifier units. Ofthese 24 features, 30% were morphometric features, 5%were boundary shape features, 20% were Fourier boundaryfeatures, and 45% were GLCM texture features. Texturefeatures were predominantly used to distinguish Anabaenafrom Microcystis, and (as expected) to distinguish betweenthe two Microcystis species. It is important to note that,even to a trained bacterial expert, the visual appearances ofthe two Microcystis species are almost identical at the reso-lution used.
Conclusions
The initial intent of this research was to determine whetherit was feasible to automatically classify cyanobacteria spe-cies contained in lake or seawater samples by using image-processing and pattern-recognition techniques. If proven
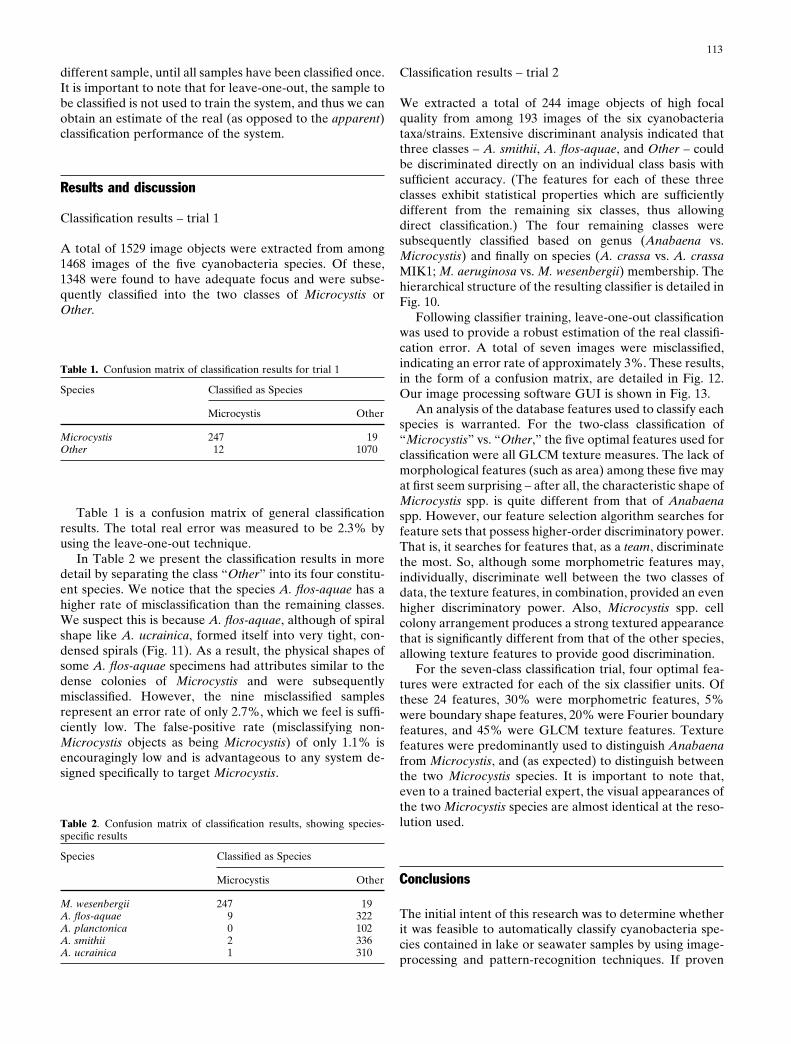
Table 1. Confusion matrix of classification results for trial 1
Species Classified as Species
Microcystis Other
Microcystis 247 19Other 12 1070
Table 2. Confusion matrix of classification results, showing species-specific results
Species Classified as Species
Microcystis Other
M. wesenbergii 247 19A. flos-aquae 9 322A. planctonica 0 102A. smithii 2 336A. ucrainica 1 310
Table 1 is a confusion matrix of general classificationresults. The total real error was measured to be 2.3% byusing the leave-one-out technique.
In Table 2 we present the classification results in moredetail by separating the class “Other” into its four constitu-ent species. We notice that the species A. flos-aquae has ahigher rate of misclassification than the remaining classes.We suspect this is because A. flos-aquae, although of spiralshape like A. ucrainica, formed itself into very tight, con-densed spirals (Fig. 11). As a result, the physical shapes ofsome A. flos-aquae specimens had attributes similar to thedense colonies of Microcystis and were subsequentlymisclassified. However, the nine misclassified samplesrepresent an error rate of only 2.7%, which we feel is suffi-ciently low. The false-positive rate (misclassifying non-Microcystis objects as being Microcystis) of only 1.1% isencouragingly low and is advantageous to any system de-signed specifically to target Microcystis.

114
Fig. 11. Examples of individual cyanobacteria that were extractedfrom high-resolution images, captured using the hardware described inthis document
Fig. 12. Classification results for trial 2 in the form of a confusionmatrix. Rows indicate the true class, while columns indicate classifiedclass
Fig. 13. The image analysis process. (1) Microscope image of water sample is transferred to computer for analysis; (2) segmentation mask isdetermined; (3) object to be classified is removed from the surrounding image background; (4–6) object characteristics are quantitativelymeasured; (7) relative distribution of species numbers found in the water sample; (8) distribution of species areas
115
successful, such a system could be used to augment workcurrently done by trained bacteria experts, with significantbenefits:
Automatic classification can reduce the tedium and fatigueassociated with manual classification;
The amount of time required to analyze a sample of watercan be significantly reduced;
The expense involved in the purchase of an image-process-ing system is offset by the significant reduction in laborcosts associated with manual classification. In fact, wefeel that using such a system will result in considerablecost reductions within several years (or equivalently,higher productivity);
The flexibility of such a system allows for targeted species tobe changed at will. The rapid decrease in cost/power ratiofor computers will facilitate both an increase in the num-ber of targeted taxonomic groups and more accurate clas-sification via new processing techniques;
Because species are classified using quantitative measuresof object characteristics (as opposed to the subjective,qualitative nature of manual classification by trained ex-perts), the system facilitates research by allowing the easycompilation of cyanobacteria characteristics into a data-base for future reference.
Our work has shown that the extension to classifyingmultiple species is both straightforward and relatively accu-rate when abundant images of high quality are used.
The cyanobacteria specimens used in this research werelaboratory cultured and may not contain the variabilityfound in lake specimens. Thus the results presented heremay degrade somewhat when natural lake water specimensare analyzed. However, we feel that the significantly lowerror rates reported indicate that automatic classification ofcyanobacteria is indeed a feasible and relatively accuratealternative to manual classification.
Acknowledgments The authors wish to thank the Japan Science andTechnology Corporation (JST) and the Science and TechnologyAgency (STA) for providing financial assistance for this project, andthe Lake Biwa Research Institute (LBRI) for providing the necessaryinfrastructure support. We would also like to thank Dr. Tsujimura ofLBRI and Yoshiaki Fukunaga of Kistem Ltd. for their technical assis-tance throughout this work. This paper is dedicated to the memory ofProf. Ryohei Tsuda, whose untimely death in 1996 robbed the researchcommunity of a valued colleague.
Appendix 1
List of features extracted from image objectsMorphometric features:Object areaObject boundary lengthCircularityCircularity
2
Boundary curvature features:Mean curvature
Minimum curvatureMaximum curvatureStandard deviation of curvatureNumber of boundary points with positive curvature
Frequency domain features:Components 2 to 15 of the one-dimensional complexdiscrete Fourier transform of object boundary
Texture features:20 gray level co-occurrence features calculated at fivedisplacements. For a complete description of thetexture features, see Walker (1997).
References
Blackburn N, Hagström A, Wikner J, Cuadros-Hansson R, BjørnsenPK (1998) Rapid determination of bacterial abundance, biovolume,morphology, and growth by neural network-based image analysis.Appl Env Microbiol 64:3246–3255
Chen YQ, Nixon MS, Thomas DW (1995) Statistical geometric fea-tures for texture classification. Patt Rec 28:537–552
Estep KW, Macintyre F, Hjörleifsson E, Sieburth J (1986) MacImage:a user-friendly image-analysis system for the accurate mensurationof marine organisms. Mar Ecol 33:243–253
Fukunaga K (1990) Statistical pattern recognition. Academic, NewYork
Gonzalez RC, Woods RE (1993) Digital image processing. Addison-Wesley, New York
Hand DJ (1981) Discrimination and classification. Wiley, ChichesterJeffries HP, Berman MS, Poularikas AD, Katsinis C, Melas I, Sherman
K, Bivins L (1984) Automated sizing, counting, and identification ofzooplankton by pattern Recognition. Mar Biol 78:329–334
Katsinis C, Poularikas AD, Jeffries HP (1984) Image processing andpattern recognition with applications to marine biological images.SPIE 28th Annual International Technical Symposium on Opticsand Electro-optics, San Diego, Aug pp 150–155
Kittler J (1978) Feature set search algorithms. In: Chen CH (ed)Pattern recognition and signal processing. Sijthoff and Noordhoff,Alphen ann den Rijn
Kumagai M (1996) Study on climate-induced water quality change inthe south basin of Lake Biwa. Lake Biwa Research Institute Bulletin13:16–19
Nakanishi M (1984) Phytoplankton. In: Horie S (ed) Lake Biwa. Dr W.Junk Publishers, The Hague
Oliva MA, Bravo-Zanoguera M, Price JH (1998) Autofocus for phase-contrast microscopy: investigation of causes of non-unimodality.SPIE Proc Adv Techn Analyt Cytol 3260
Schultze-Lam S, Harauz G, Beveridge T (1992) Participation of acyanobacterial S layer in fine-grain mineral formation. J Bacteriol174:7971–7981
Serra J (1982) Image analysis and mathematical morphology. Aca-demic, London
Thiel SU (1994) The use of image processing techniques for the auto-mated detection of blue-green algae. Ph.D. dissertation, Universityof Glamorgan, UK
Vincent L, Beucher S (1989) The morphological approach to segmen-tation: an introduction. Mathematische Morphologie und DigitaleBildverarbeitung (Munich):25–27
Walker RF (1997) Adaptive multi-scale texture analysis with app-lication to automated cytology. Ph.D. dissertation, University ofQueensland, Australia
Weiss SM, Kulikowski CA (1991) Computer systems that learn: classi-fication and prediction methods from statistics, neural networks,machine learning, and expert systems. Morgan Kaufmann, SanMateo
Wilkins MF, Boddy L, Morris CW, Jonker RR (1999) Identification ofphytoplankton from flow cytometry data by using radial basis func-tion neural networks. Appl Env Microbiol 65:4404–4410