root cause analysis
TRANSCRIPT

ROOT CAUSE ANALYSISDr. Mohamed Mosaad Hasan
MD, MPH, CPHQ, CPPS, GBSS

SENTINEL EVENTS
Rosie King’s video
ROOT CAUSE ANALYSIS
Is a process done in response to
occurrence of sentinel event or near
miss.
The aim of root cause analysis is to
conduct intensive analysis to reach the
embedded problems in the system and
solve it.
RCA- SEQUENTIAL STEPS1- Define the problem
Ask what is wrong, what is involved: conditions, activities,materials.
Ask when: day ,date, time, shift, time pattern, schedule.
Ask where: site, area department, physical environment, stepin process.
Ask how the what or who is affected, how much, how many,work practice, omission / commission.
Ask who is involved: patients, caregivers, other staff, vendors,visitors.
Review relevant documents.
Consider other data collection options: surveys, observations,interviews.
RCA- SEQUENTIAL STEPS
2- perform task / process analysis
divide a process into steps by sequencing actions,
instructions, conditions ,tools , and materials associated
with the performance of the task (flowchart).
learn exactly what was supposed to happen.
contrast the baseline with what actually happened (based
on initial data collection).
RCA- SEQUENTIAL STEPS
3- perform change /different analysis:
compare the task /steps successfully performed to
the same task /steps when unsuccessful.
analyze the difference.
describe for each difference its effect on the
situation.
RCA- SEQUENTIAL STEPS
4- perform control barriers/ safe guard analysis:
analyze safeguards needed to prevent the event.
analyze missing or ineffective safeguards.
Safeguards may be :
physical: safety equipment and devices; locks, walls.
Natural: distance and time (limited exposure).
information: caution such as labels , alarms.
knowledge: making information constantly available.
administrative: safety policies and procedures,regulations, supervisory practices, training, education,communication process.
RCA- SEQUENTIAL STEPS
5- Begin cause and effect analysis
List each undesirable step of the occurrence
considering each a primary effect
using data collected to date , determine what
causes allowed or forced each effect to occur
show the relationship between each cause and
effect
RCA- SEQUENTIAL STEPS
continue the cause and effect analysis until :
Cause is outside the organization control to
correct.
Primary effect is fully explained.
No other causes can be found to explain the
effect.
Further analysis will yield no additional benefit
in correcting the problem.
List all validated causes.

QUALITY TOOLS
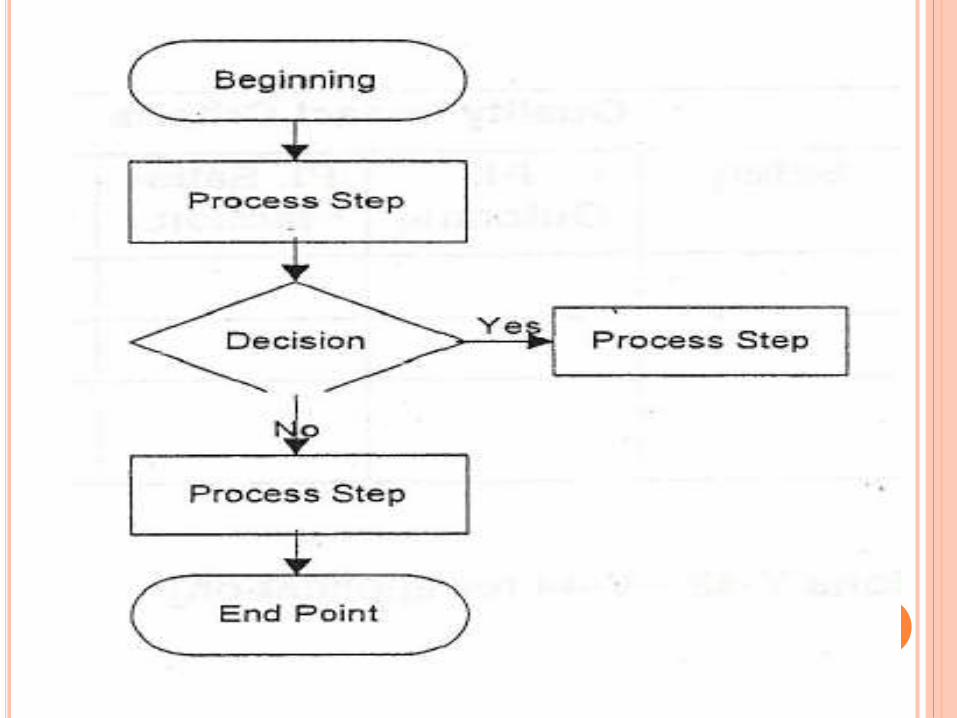
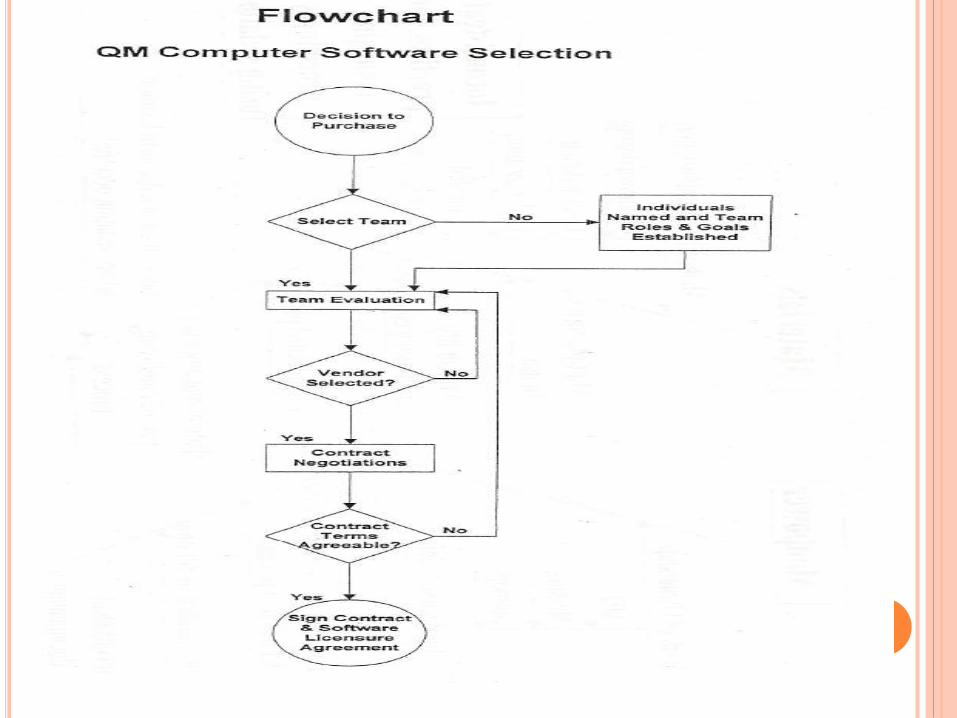
FLOWCHART
Definition: A flowchart is a pictorial representation displaying the:
Actual sequence of steps and their inter-relationships in a specific process in order to identify hand-off (appropriate and inappropriate), inefficiencies, redundancies, inspections, and waiting steps; and/or
Ideal sequence of steps, once the actual process is known.
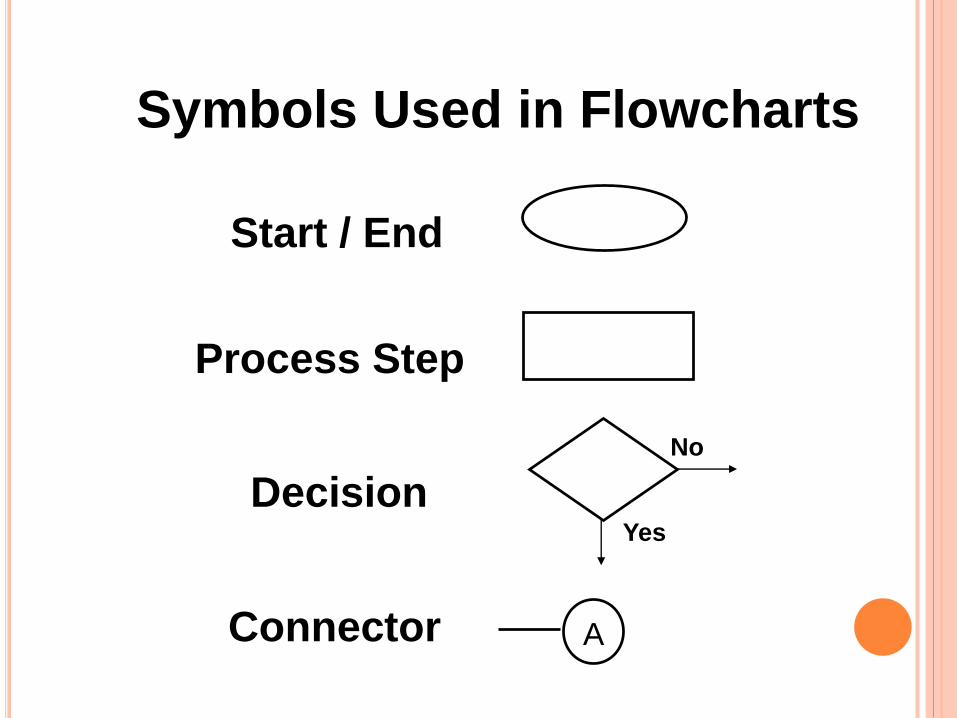
Symbols Used in Flowcharts
Start / End
Process Step
Decision
Connector
No
Yes
A
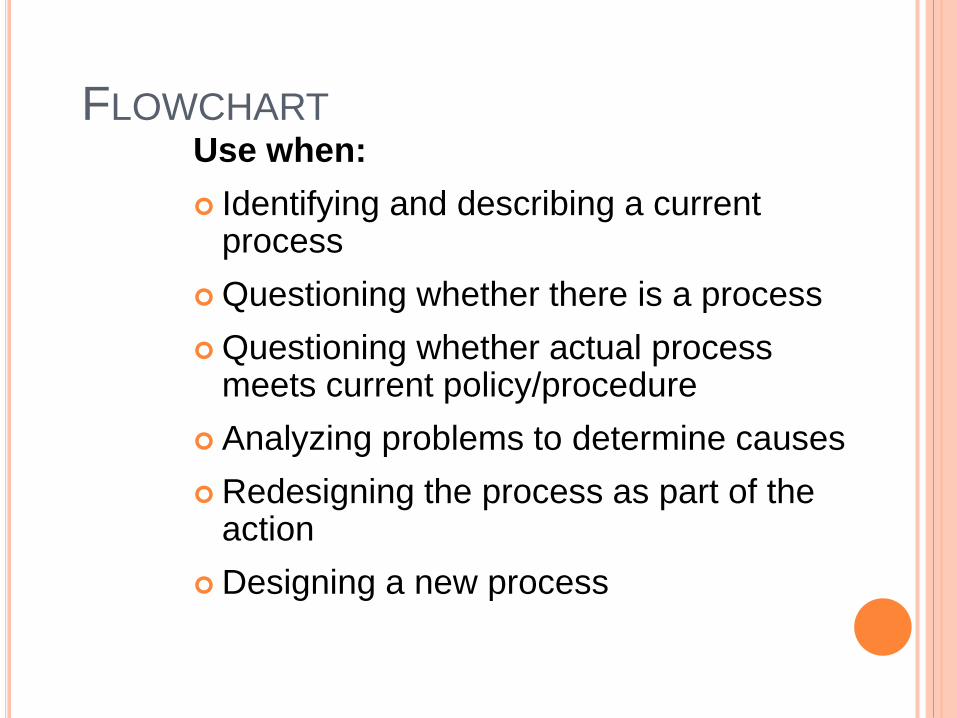
FLOWCHARTUse when:
Identifying and describing a current process
Questioning whether there is a process
Questioning whether actual process meets current policy/procedure
Analyzing problems to determine causes
Redesigning the process as part of the action
Designing a new process
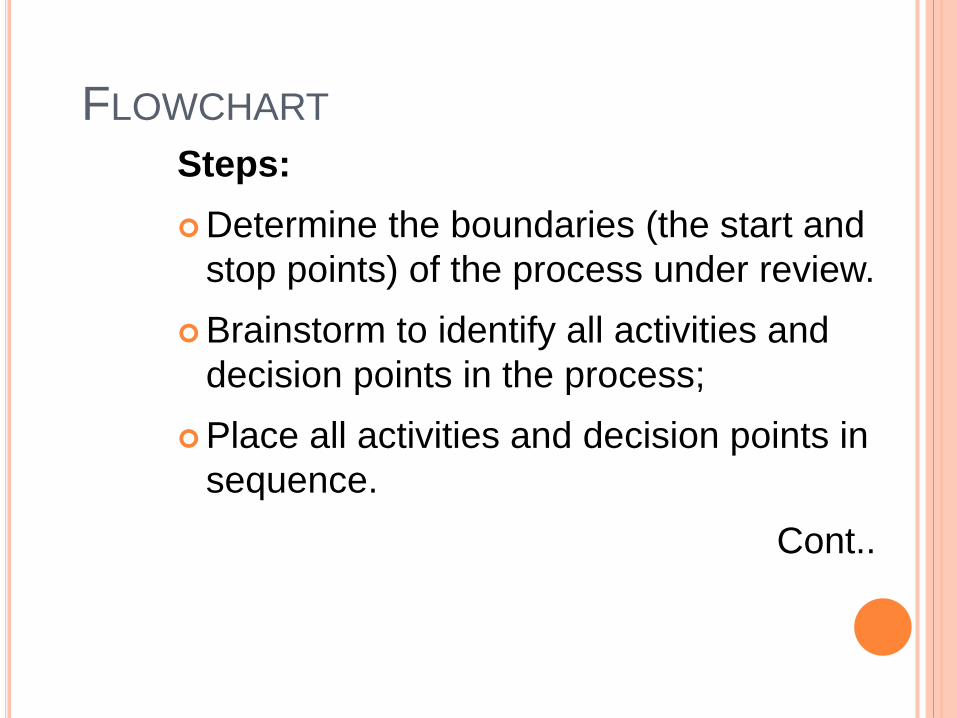
FLOWCHART
Steps:
Determine the boundaries (the start and
stop points) of the process under review.
Brainstorm to identify all activities and
decision points in the process;
Place all activities and decision points in
sequence.
Cont..
FLOWCHART
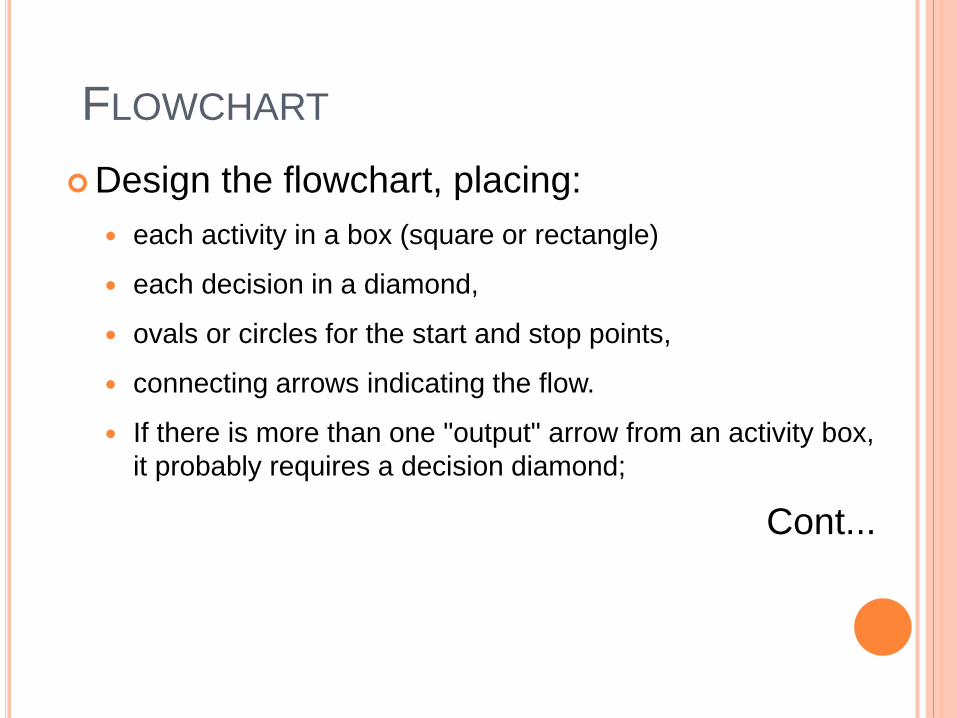
Design the flowchart, placing:
each activity in a box (square or rectangle)
each decision in a diamond,
ovals or circles for the start and stop points,
connecting arrows indicating the flow.
If there is more than one "output" arrow from an activity box,
it probably requires a decision diamond;
Cont...
FLOWCHART
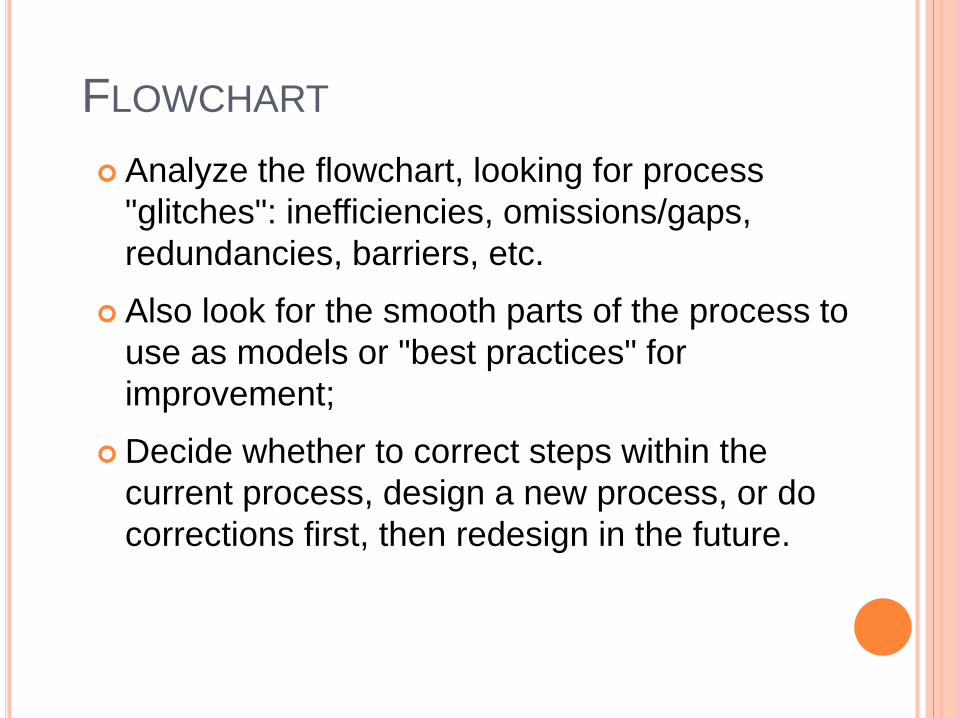
Analyze the flowchart, looking for process
"glitches": inefficiencies, omissions/gaps,
redundancies, barriers, etc.
Also look for the smooth parts of the process to
use as models or "best practices" for
improvement;
Decide whether to correct steps within the
current process, design a new process, or do
corrections first, then redesign in the future.
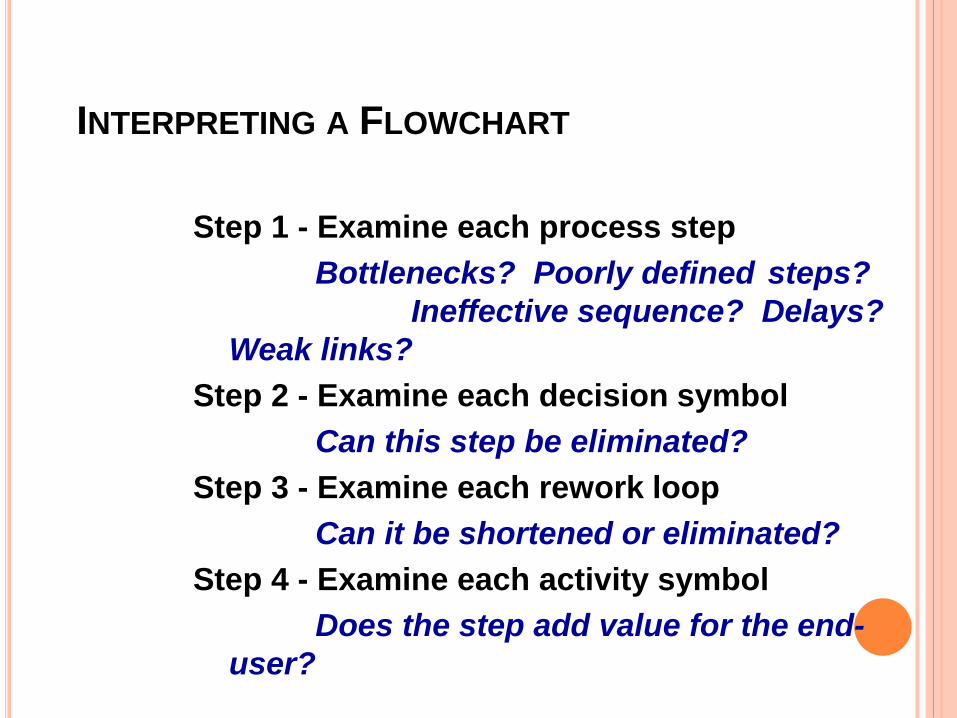
INTERPRETING A FLOWCHART
Step 1 - Examine each process step
Bottlenecks? Poorly defined steps?
Ineffective sequence? Delays?
Weak links?
Step 2 - Examine each decision symbol
Can this step be eliminated?
Step 3 - Examine each rework loop
Can it be shortened or eliminated?
Step 4 - Examine each activity symbol
Does the step add value for the end-
user?
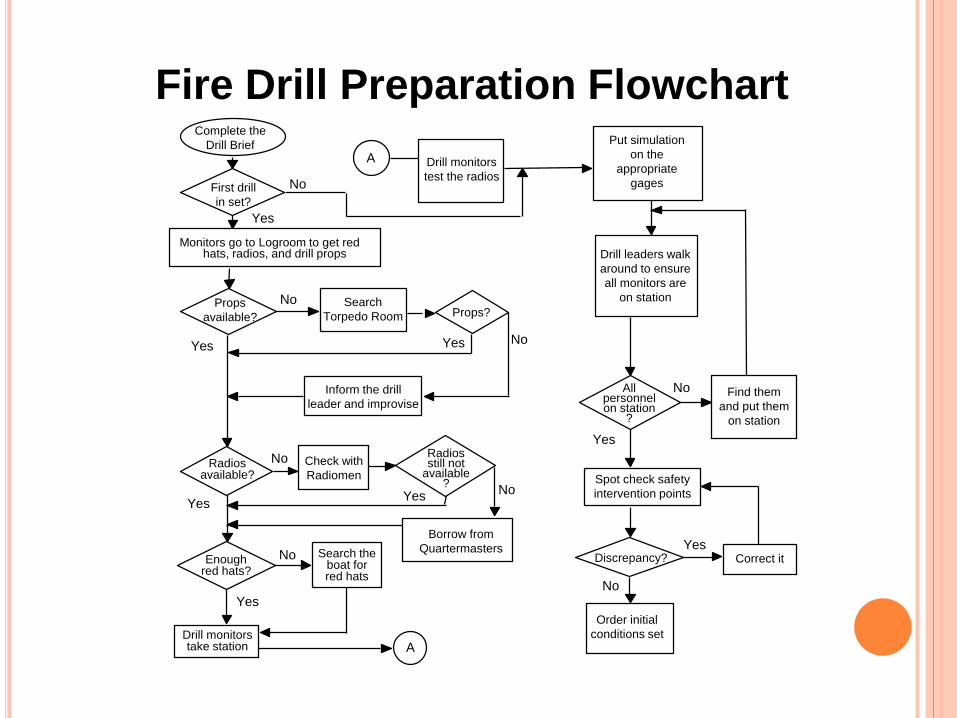
Fire Drill Preparation Flowchart
A
YesNo
Yes
No
Yes
No
NoYesYes
No
Yes
NoFirst drill
in set?
A
Inform the drill
leader and improvise
Props?Search
Torpedo Room
Radiosstill not
available?
Borrow from
Quartermasters
Check with
RadiomenRadios
available?
Props
available?
Enoughred hats?
Drill monitors
test the radios
Monitors go to Logroom to get redhats, radios, and drill props
Complete the
Drill Brief
Drill monitorstake station
Search theboat forred hats
No
No
Yes
YesDiscrepancy?
Allpersonnelon station
?
Correct it
Put simulation
on the
appropriate
gages
Drill leaders walk
around to ensure
all monitors are
on station
Spot check safety
intervention points
Order initial
conditions set
Find them
and put them
on station
CAUSE AND EFFECT DIAGRAM
Also called Ishikawa or Fishbone
CAUSE-AND-EFFECT DIAGRAM
Definition: The cause-and-effect diagram is a
tool generally used to gather all possible
causes as an overview,
The ultimate goal being to uncover the root
cause(es) of a problem.
The specific problem is usually stated as a
negative outcome ("effect") of a process, e.g.,
late transfer of patients from the inpatient
facility to skilled nursing facilities.
CAUSE-AND-EFFECT DIAGRAM
The diagram is a visualization of relationships between the outcome of a particular system or process, the major categories of that system or process (the main branches), and causes and subcauses (sub-branches off main branches).
Steps
Start with the outcome (problem statement) on the right of the paper, halfway down; draw a horizontal line across the middle of the paper with an arrow pointing to the outcome;
CAUSE-AND-EFFECT DIAGRAM
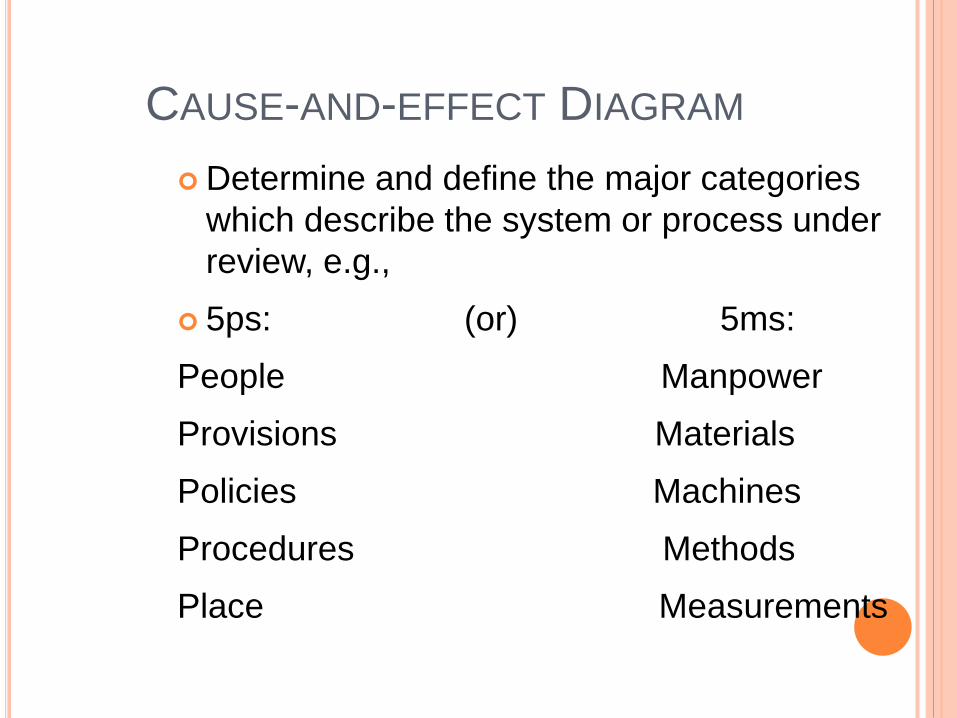
Determine and define the major categories
which describe the system or process under
review, e.g.,
5ps: (or) 5ms:
People Manpower
Provisions Materials
Policies Machines
Procedures Methods
Place Measurements
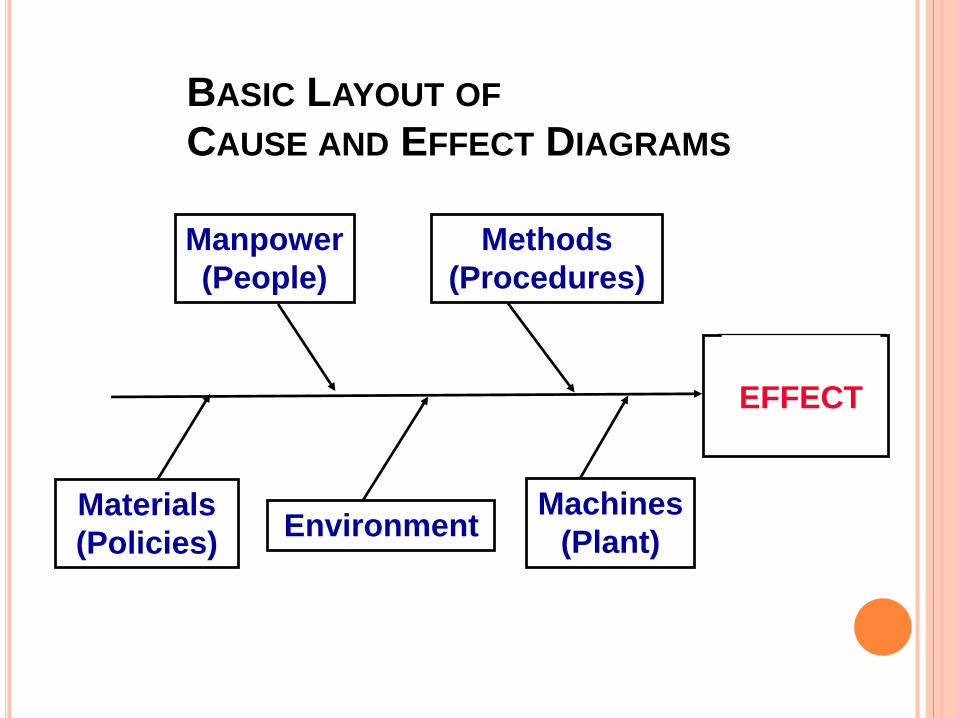
BASIC LAYOUT OF
CAUSE AND EFFECT DIAGRAMS
EFFECT
Manpower
(People)
Methods
(Procedures)
Materials
(Policies)
Machines
(Plant)Environment
CAUSE-AND-EFFECT DIAGRAM
Link the major categories (representing
process and structure) to the outcome with
diagonal lines angled from the horizontal
line away from the outcome;
Brainstorm to identify possible main causes
of the negative outcome and link each to
one of the major categories, using
horizontal lines (parallel to the main
outcome line) touching the appropriate
diagonal line;
CAUSE-AND-EFFECT DIAGRAM
Identify any possible sub-causes of main
causes by using the "Five-Why" technique.
Evaluate the draft diagram as a team to
determine the accuracy of the placement of
issues and lines;
CAUSE-AND-EFFECT DIAGRAM
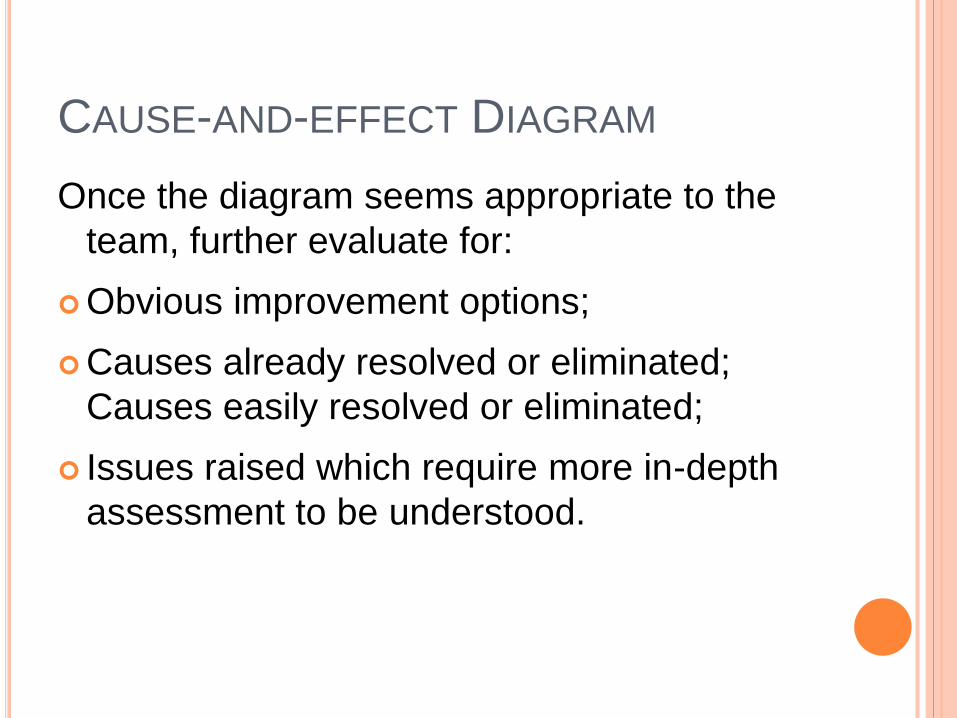
Once the diagram seems appropriate to the
team, further evaluate for:
Obvious improvement options;
Causes already resolved or eliminated;
Causes easily resolved or eliminated;
Issues raised which require more in-depth
assessment to be understood.
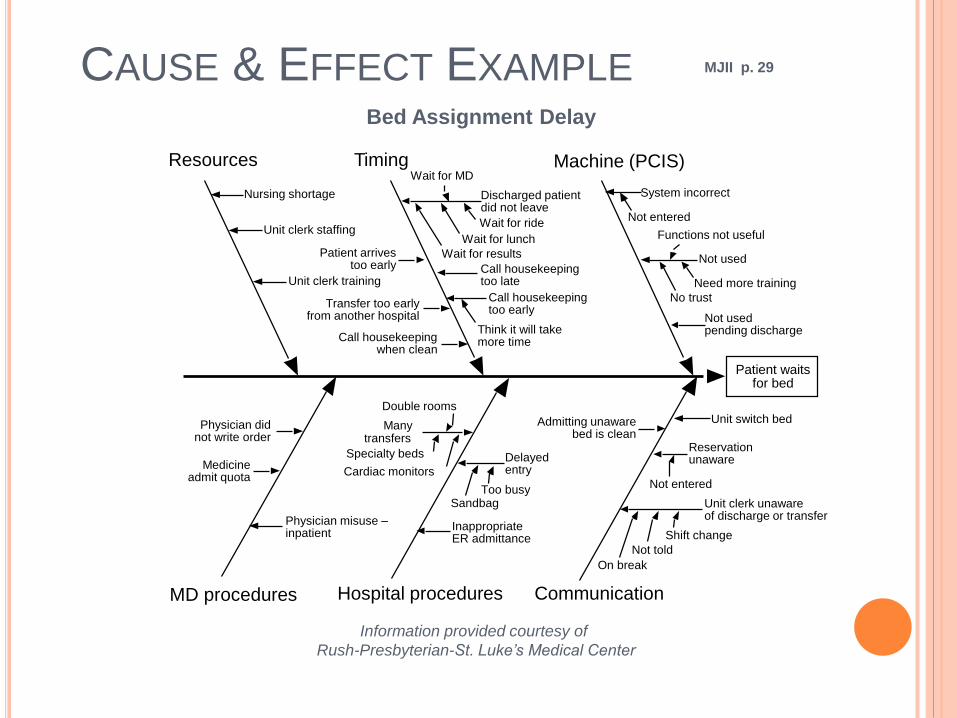
CAUSE & EFFECT EXAMPLE MJII p. 29
Bed Assignment Delay
Information provided courtesy of
Rush-Presbyterian-St. Luke’s Medical Center
System incorrect
Machine (PCIS)Timing
Hospital procedures Communication
Patient waitsfor bed
Not entered
Not used
No trust
Need more training
Functions not useful
Not usedpending discharge
Discharged patientdid not leave
Wait for results
Wait for lunch
Wait for ride
Call housekeepingtoo late
Wait for MD
Call housekeepingtoo early
Think it will takemore time
Patient arrivestoo early
Transfer too earlyfrom another hospital
Call housekeepingwhen clean
Nursing shortage
Unit clerk staffing
Unit clerk training
Resources
Unit clerk unawareof discharge or transfer
On break
Not told
Shift change
Reservationunaware
Not entered
Unit switch bedAdmitting unawarebed is clean
Delayedentry
SandbagToo busy
InappropriateER admittance
Manytransfers
Specialty beds
Cardiac monitors
Double rooms
Physician didnot write order
Medicineadmit quota
Physician misuse –inpatient
MD procedures
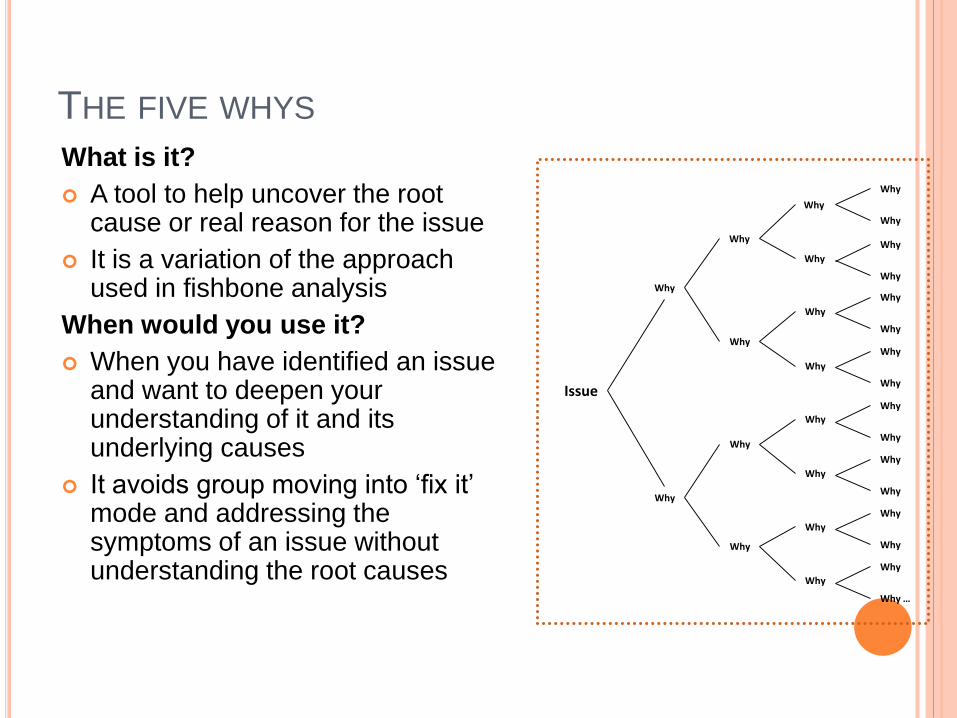
THE FIVE WHYS
What is it?
A tool to help uncover the root cause or real reason for the issue
It is a variation of the approach used in fishbone analysis
When would you use it?
When you have identified an issue and want to deepen your understanding of it and its underlying causes
It avoids group moving into ‘fix it’ mode and addressing the symptoms of an issue without understanding the root causes
Issue
Why
Why
Why
Why
Why
Why
Why
Why
Why
Why
Why
Why
Why
Why
Why
Why
Why
Why
Why
Why
Why
Why
Why
Why
Why
Why
Why
Why
Why
Why …
PROCESS OF FIVE WHYS
• Clearly define the issue to be tackled and write it on the leftside of the paper
• Complete the diagram by moving from left to right. Move fromthe problem/issue statement by asking the question “why?”
• Ask the group “why?” and capture the responses
• For each response, again ask the question “why?”. Continue torecord responses and move across to the right of the diagram.Try to go to five levels of “why?”
• At the end of the analysis it is often helpful to circle the mostsignificant insights that have been gained
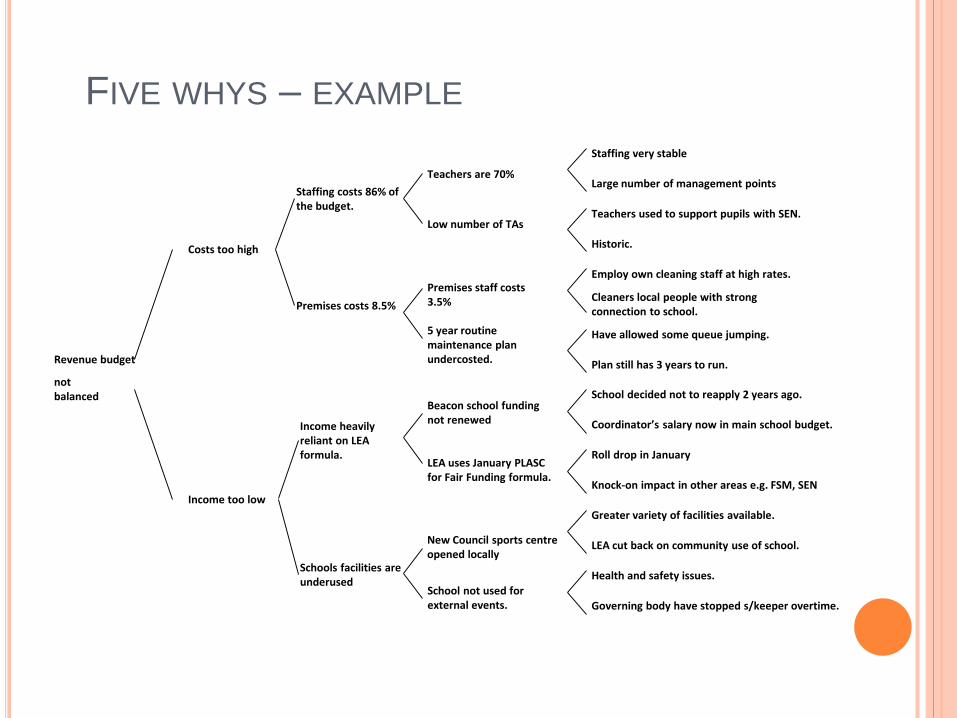
FIVE WHYS – EXAMPLE
Revenue budget
not balanced
Costs too high
Income too low
Premises costs 8.5%
Staffing costs 86% of the budget.
Income heavily reliant on LEA formula.
Schools facilities are underused
Teachers used to support pupils with SEN.
Large number of management points
Staffing very stable
Historic.
Have allowed some queue jumping.
Cleaners local people with strong connection to school.
Employ own cleaning staff at high rates.
Plan still has 3 years to run.
Roll drop in January
Coordinator’s salary now in main school budget.
School decided not to reapply 2 years ago.
Knock-on impact in other areas e.g. FSM, SEN
Health and safety issues.
LEA cut back on community use of school.
Greater variety of facilities available.
Governing body have stopped s/keeper overtime.
Premises staff costs 3.5%
Low number of TAs
Teachers are 70%
5 year routine maintenance plan undercosted.
New Council sports centre opened locally
LEA uses January PLASC for Fair Funding formula.
Beacon school funding not renewed
School not used for external events.
KEPNET-TREGOE (IS-IS NOT) MATRIX
Purpose : Isolate and Identify causes of quality problems
by assisting managers in recognizing factors that
underlie defects in a process.
Advantages
Relates possible causes to specific categories
Identifies process problems
Simplifies development of ways to resolve the problems
KEPNET-TREGOE (IS-IS NOT) MATRIX
Creation Steps
Characterize the problem
Easily understood by QI team
Create agreement on the nature of the predicament
Create the Is-Is Not Matrix
Who is involved in the process or problem? (No blame game)
What inputs or outputs are involved in the process or problem?
When does the problem occur? In what portion of the process?
Where does the problem occur? In what part of the organization or
what location?
How important is the problem to the process? How extensive is the
problem?
QI Team formulates entries for each cell
Emerging patterns identify deficiencies in the process
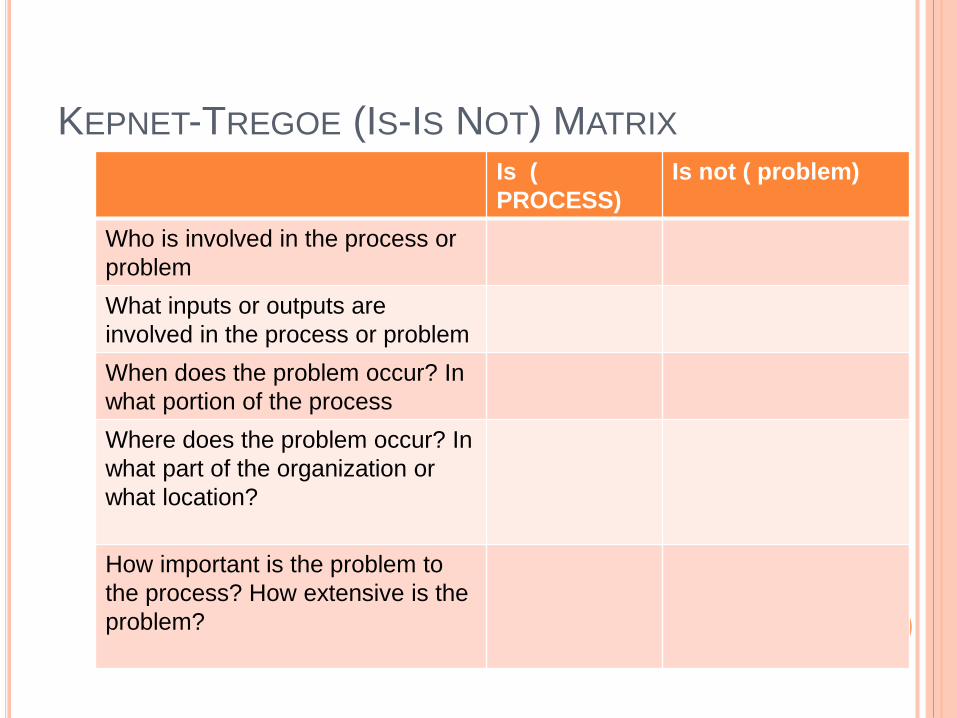
KEPNET-TREGOE (IS-IS NOT) MATRIX
Is (
PROCESS)
Is not ( problem)
Who is involved in the process or
problem
What inputs or outputs are
involved in the process or problem
When does the problem occur? In
what portion of the process
Where does the problem occur? In
what part of the organization or
what location?
How important is the problem to
the process? How extensive is the
problem?
SPECIFY THE SOLUTION
Brainstorming.
Affinity Diagram.
Multi- voting.
BRAINSTORMING
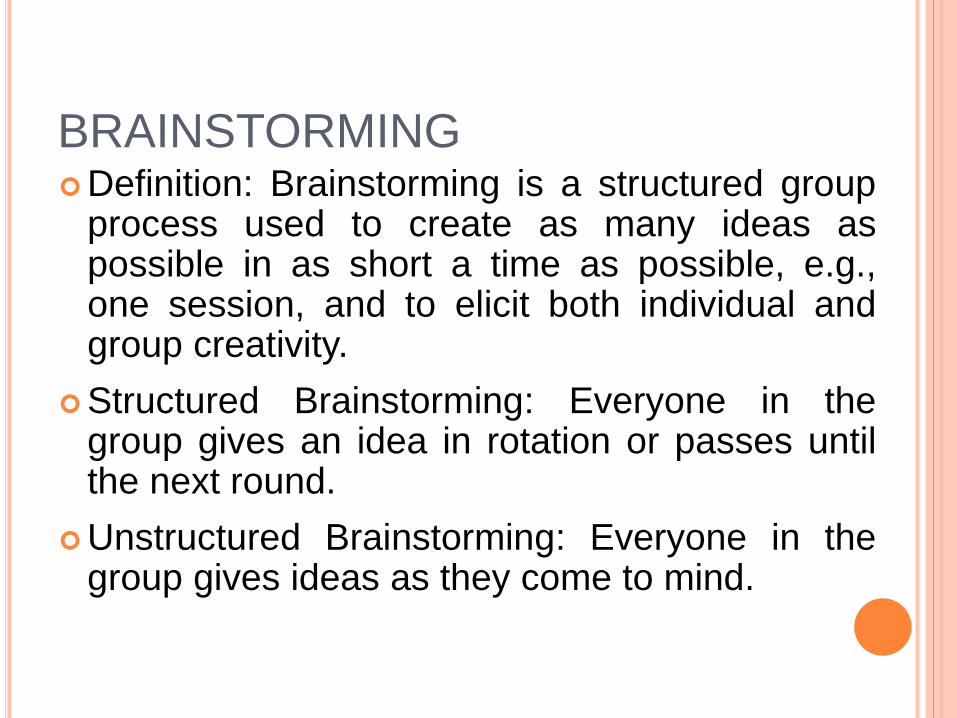
BRAINSTORMINGDefinition: Brainstorming is a structured group
process used to create as many ideas aspossible in as short a time as possible, e.g.,one session, and to elicit both individual andgroup creativity.
Structured Brainstorming: Everyone in thegroup gives an idea in rotation or passes untilthe next round.
Unstructured Brainstorming: Everyone in thegroup gives ideas as they come to mind.
EXPERIMENTS HAVE SHOWN---
BRAINSTORMING WILL
TYPICALLY GENERATE THREE TIMES
THE QUANTITY OF IDEAS THAN THAT
GENERATED BY THE SAME INDIVIDUAL
WORKING SEPERATELY
BRAINSTORMING
Lists generated may relate to:
Problems or topics
Components of a process
Indicators, criteria, elements for data
collection
Possible solutions Structure
RULES
1. PEOPLE MUST FEEL SAFE TO
PARTICIPATE
2. DURING BRAINSTORMING---
NO JUDGEMENT
NO CRITICISM
3. GENERATE AS MANY IDEAS AS POSSIBLE
4. ENCOURAGE TO BE CREATIVE
5. BUILD ON EACH OTHER’S IDEAS
6. WRITE DOWN EXACTLY WHAT IS SAID
DO NOT DISCUSS IDEAS
FIVE STEPS OF BRAINSTORMING
Define the subject and direction of the session;
Allow time for initial, individual thought;
Establish a time limit for the entire session;
Request ideas according to the predetermined
structure; keep circling the issue until all ideas
are recorded
Clarify all ideas generated to assure accuracy
and understanding.
ADVANTAGES
1. ENCOURAGES CREATIVE THINKING
2. HELPS TO IDENTIFY
=POSSIBLE CAUSES
=AREAS FOR IMPROVEMENT
=POSSIBLE SOLUTIONS
3. ALLOWS FOR DIFFERENT POINTS
OF VIEW
4. ENCOURAGES PARTICIPATION
AFFINITY DIAGRAM
Definition: An affinity diagram is an organizational
tool most often used at the beginning of a team's
work to organize large volumes of ideas or issues
into major categories.
The ideas may have come from the group's initial
brainstorming session.
AFFINITY DIAGRAM
"Affinity" means close relationship or
connection, or similarity of structure;
When developing an Affinity Diagram, it is
most important to determine the primary
issue and major related subgroups in order
to grasp the appropriate relationships, links,
or connections.
AFFINITY DIAGRAM
Steps:
Define the primary issue, using neutral, broadlanguage;
Brainstorm - use cards or adhesive notes whichcan be moved and sorted;
Display in random fashion all ideas for the team(on a wall or table);
Cont..
AFFINITY DIAGRAM
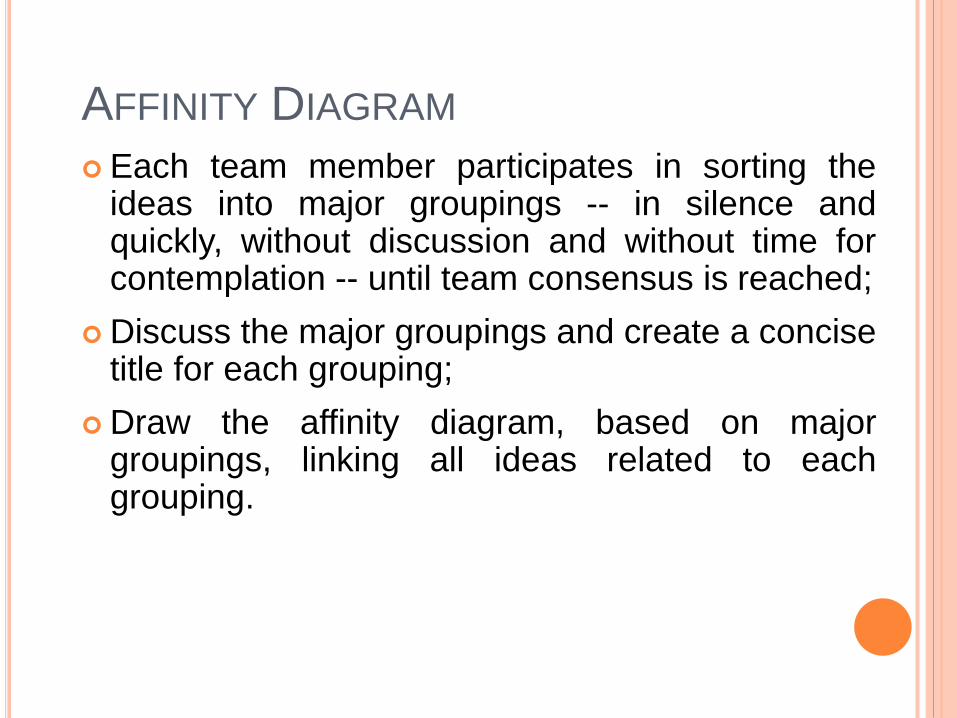
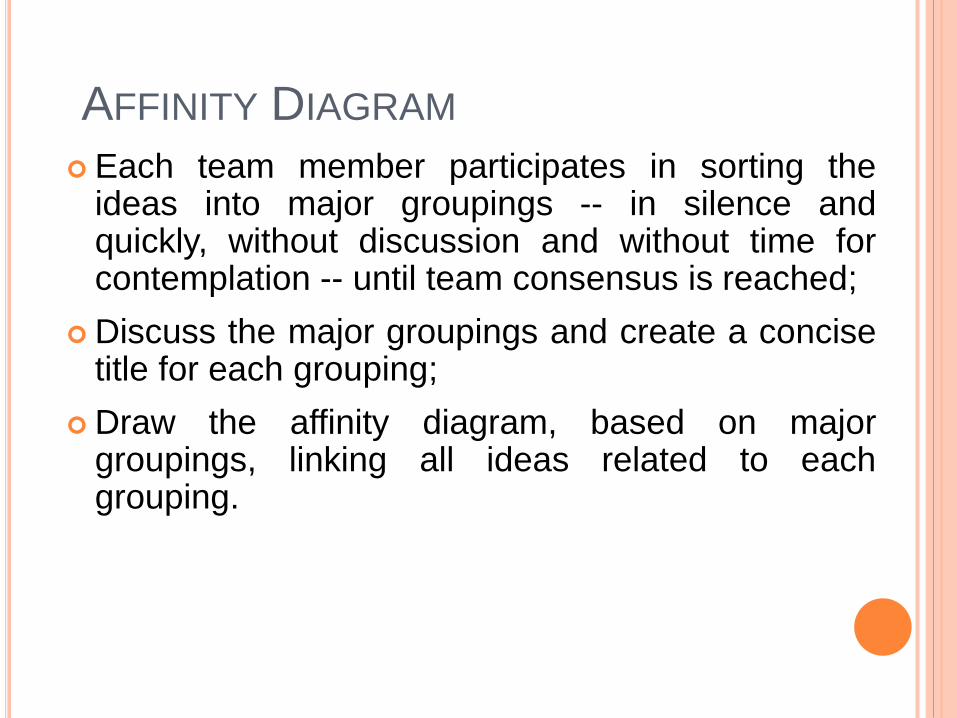
Each team member participates in sorting theideas into major groupings -- in silence andquickly, without discussion and without time forcontemplation -- until team consensus is reached;
Discuss the major groupings and create a concisetitle for each grouping;
Draw the affinity diagram, based on majorgroupings, linking all ideas related to eachgrouping.
AFFINITY DIAGRAM
Each team member participates in sorting theideas into major groupings -- in silence andquickly, without discussion and without time forcontemplation -- until team consensus is reached;
Discuss the major groupings and create a concisetitle for each grouping;
Draw the affinity diagram, based on majorgroupings, linking all ideas related to eachgrouping.
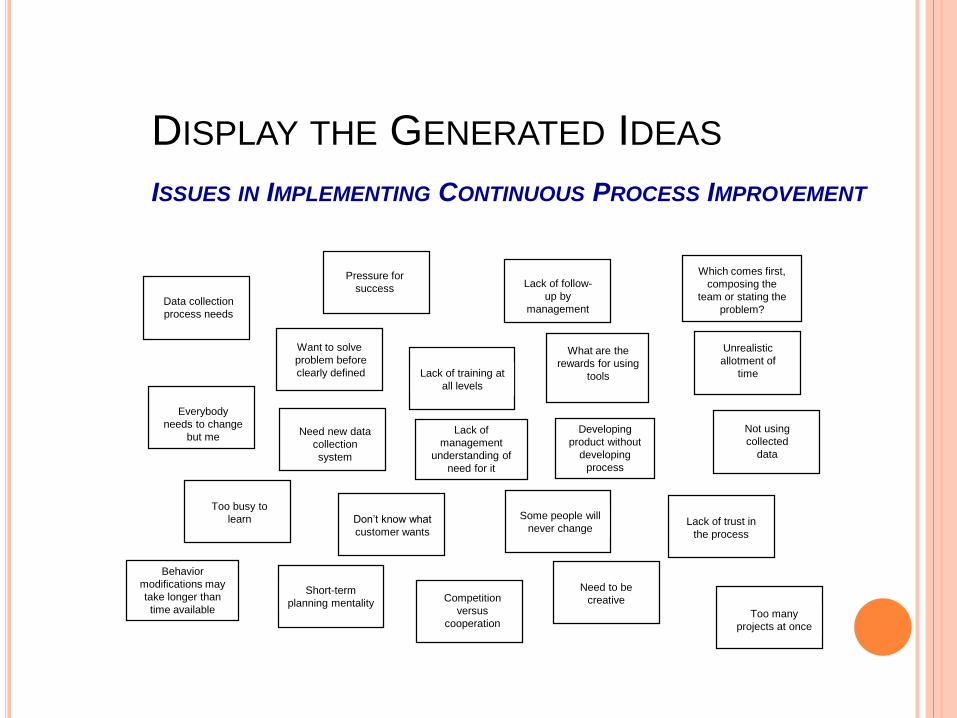
DISPLAY THE GENERATED IDEAS
ISSUES IN IMPLEMENTING CONTINUOUS PROCESS IMPROVEMENT
Behavior
modifications may
take longer than
time available Too many
projects at once
Everybody
needs to change
but me
Data collection
process needs
Need new data
collection
system
Developing
product without
developing
process
Too busy to
learn Don’t know what
customer wants
Short-term
planning mentality
Pressure for
success
Lack of training at
all levels
Lack of
management
understanding of
need for it
Competition
versus
cooperation
Need to be
creative
Some people will
never change
What are the
rewards for using
tools
Lack of follow-
up by
management
Unrealistic
allotment of
time
Lack of trust in
the process
Not using
collected
data
Which comes first,
composing the
team or stating the
problem?
Want to solve
problem before
clearly defined
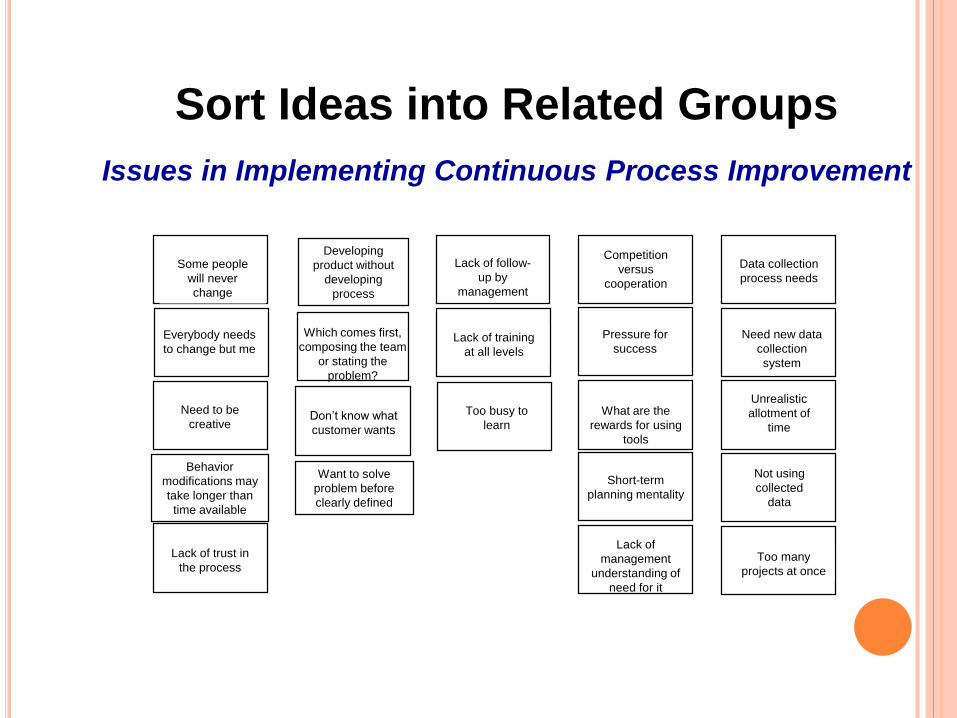
Sort Ideas into Related Groups
Issues in Implementing Continuous Process Improvement
Want to solve
problem before
clearly defined
Too many
projects at once
Data collection
process needs
Need new data
collection
system
Developing
product without
developing
process
Too busy to
learnDon’t know what
customer wants
Behavior
modifications may
take longer than
time available
Pressure for
success
Short-term
planning mentality
Lack of
management
understanding of
need for it
Lack of training
at all levels
Need to be
creative
Competition
versus
cooperation
Some people
will never
change
What are the
rewards for using
tools
Lack of follow-
up by
management
Unrealistic
allotment of
time
Lack of trust in
the process
Not using
collected
data
Which comes first,
composing the team
or stating the
problem?
Everybody needs
to change but me
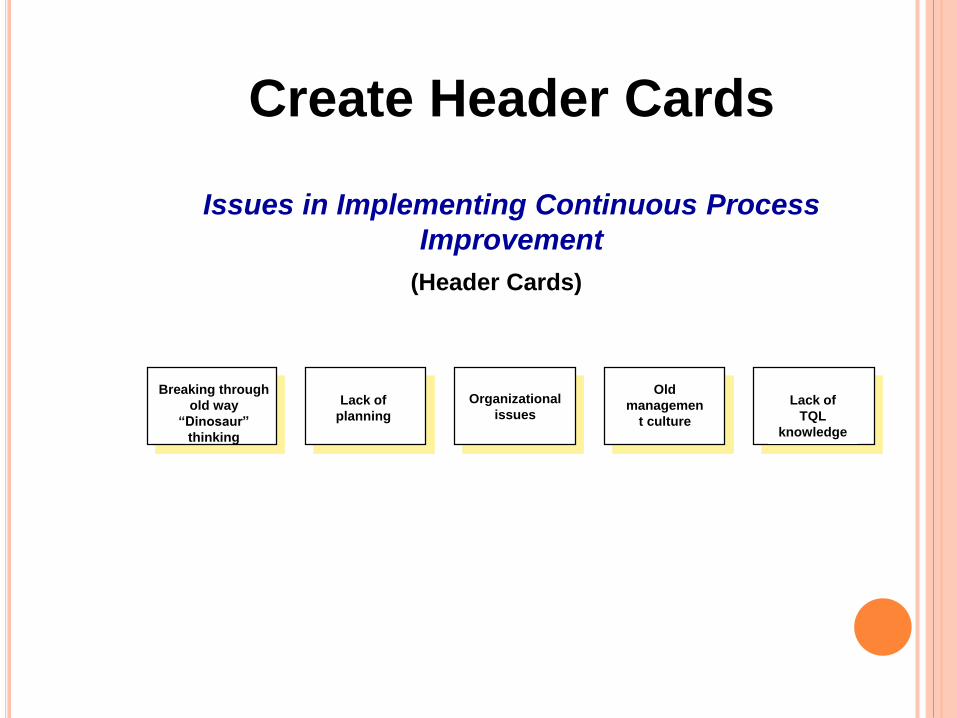
Create Header Cards
Issues in Implementing Continuous Process
Improvement
(Header Cards)
Breaking through
old way
“Dinosaur”
thinking
Lack of
planning
Organizational
issues
Old
managemen
t culture
Lack of
TQL
knowledge
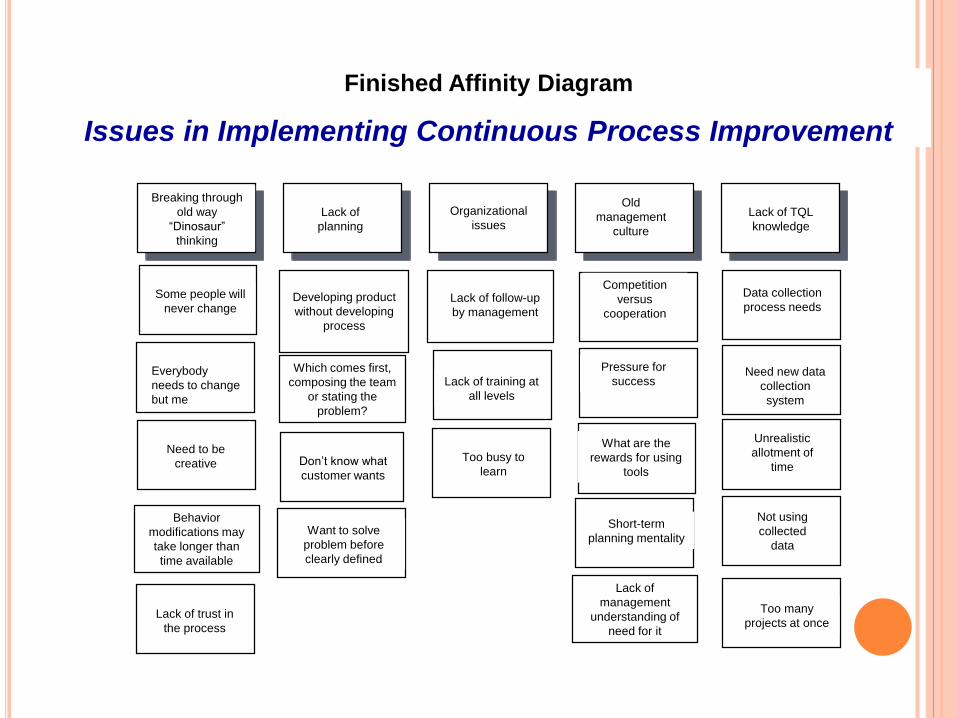
Finished Affinity Diagram
Issues in Implementing Continuous Process Improvement
Breaking through
old way
“Dinosaur”
thinking
Lack of
planning
Organizational
issues
Old
management
culture
Lack of TQL
knowledge
Want to solve
problem before
clearly defined
Too many
projects at once
Everybody
needs to change
but me
Data collection
process needs
Need new data
collection
system
Developing product
without developing
process
Too busy to
learnDon’t know what
customer wants
Behavior
modifications may
take longer than
time available
Pressure for
success
Short-term
planning mentality
Lack of
management
understanding of
need for it
Lack of training at
all levels
Need to be
creative
Competition
versus
cooperation
Some people will
never change
What are the
rewards for using
tools
Lack of follow-up
by management
Unrealistic
allotment of
time
Lack of trust in
the process
Not using
collected
data
Which comes first,
composing the team
or stating the
problem?
MULTI-VOTING
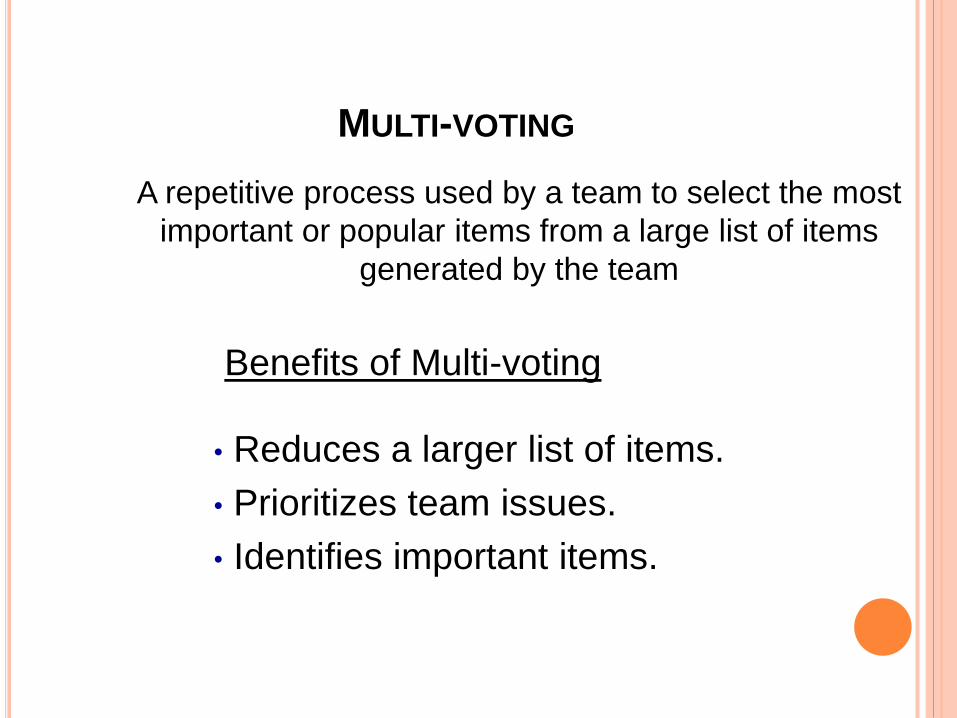
MULTI-VOTING
A repetitive process used by a team to select the most
important or popular items from a large list of items
generated by the team
Benefits of Multi-voting
• Reduces a larger list of items.
• Prioritizes team issues.
• Identifies important items.
PROCEDURES FOR MULTI-VOTING
Step 1 - Work from a large list
Step 2 - Assign a letter to each item
Step 3 - Tally the votes
Step 5 - Repeat the process
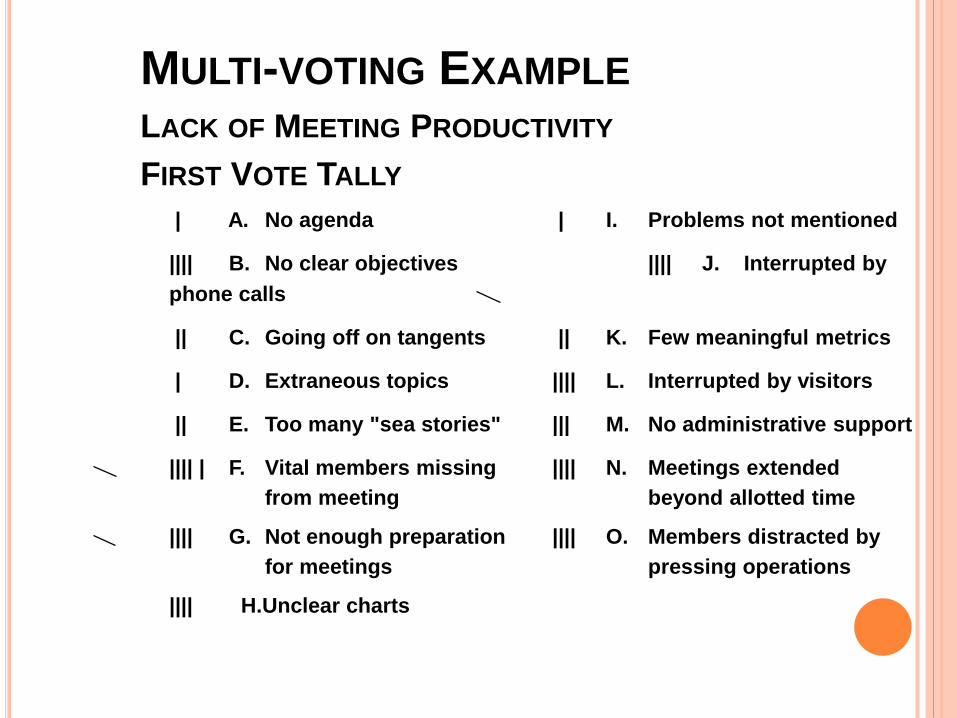
MULTI-VOTING EXAMPLE
LACK OF MEETING PRODUCTIVITY
FIRST VOTE TALLY
| A. No agenda | I. Problems not mentioned
|||| B. No clear objectives |||| J. Interrupted by
phone calls
|| C. Going off on tangents || K. Few meaningful metrics
| D. Extraneous topics |||| L. Interrupted by visitors
|| E. Too many "sea stories" ||| M. No administrative support
|||| | F. Vital members missing |||| N. Meetings extended
from meeting beyond allotted time
|||| G. Not enough preparation |||| O. Members distracted by
for meetings pressing operations
|||| H.Unclear charts
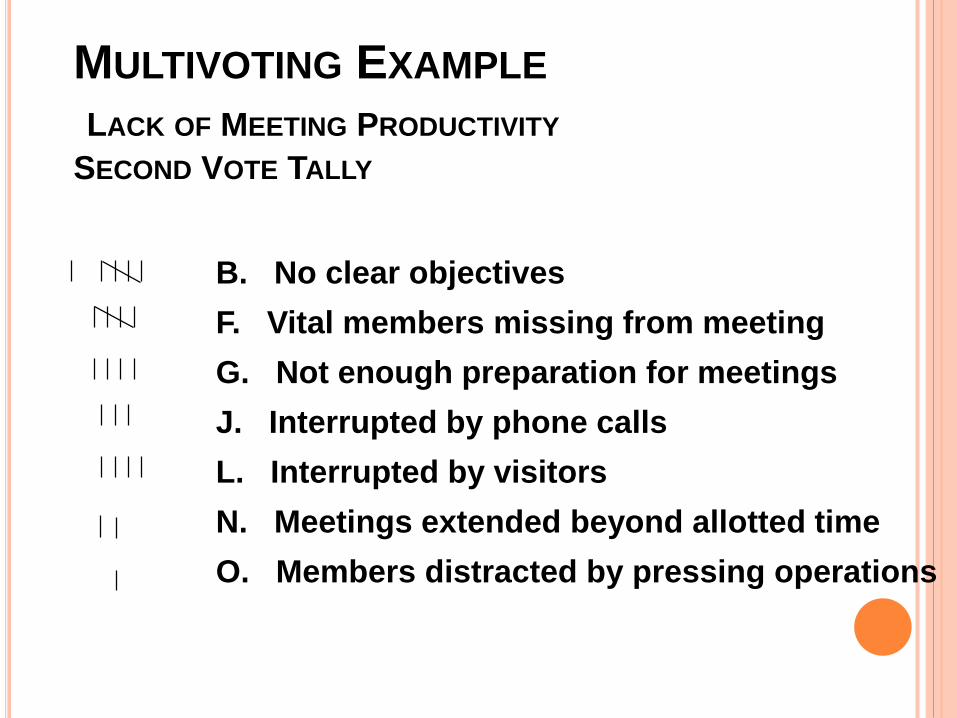
MULTIVOTING EXAMPLE
LACK OF MEETING PRODUCTIVITY
SECOND VOTE TALLY
B. No clear objectives
F. Vital members missing from meeting
G. Not enough preparation for meetings
J. Interrupted by phone calls
L. Interrupted by visitors
N. Meetings extended beyond allotted time
O. Members distracted by pressing operations
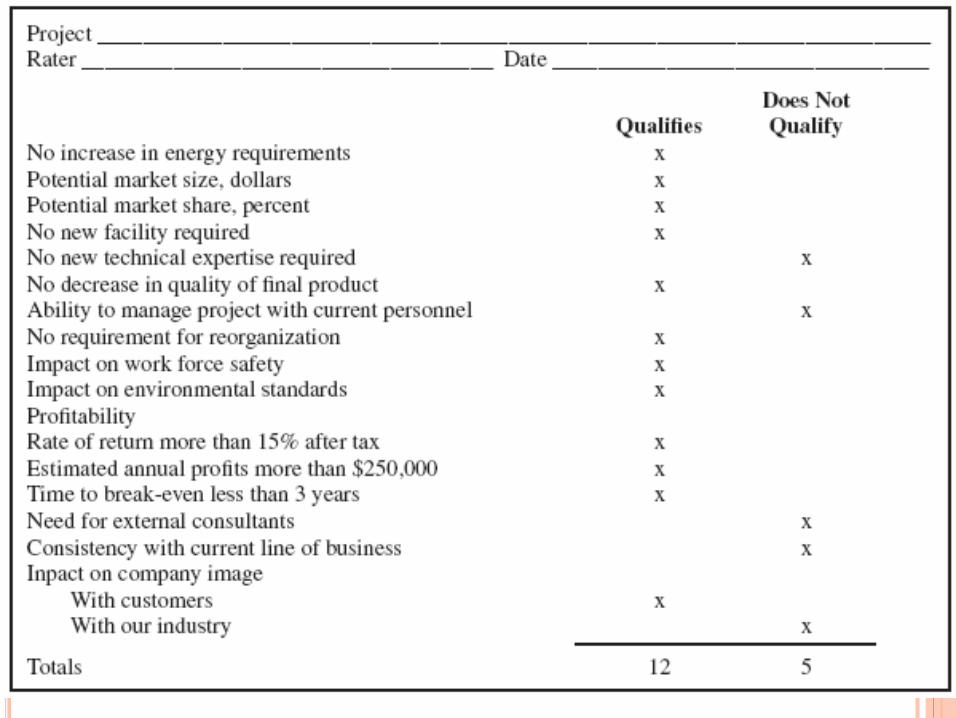
PRIORITIZATION MATRIX
Definition: A Prioritization matrix is a tool used
to select one option from a group of
alternatives, be they problems or solutions.
It promotes objective decision making.
PRIORITIZATION MATRIX
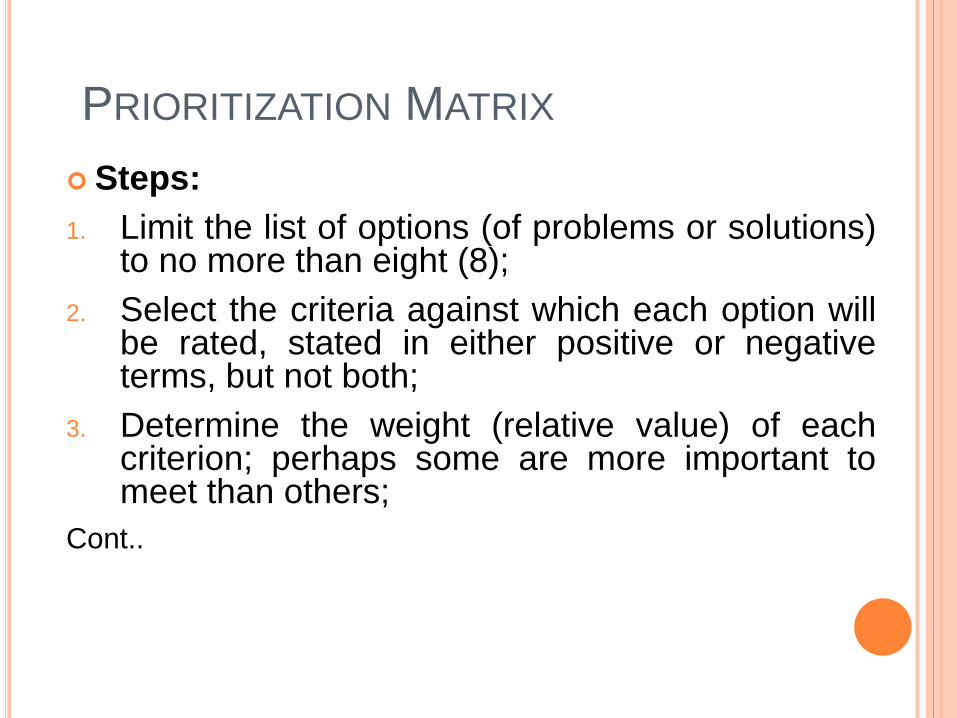
Steps:
1. Limit the list of options (of problems or solutions)to no more than eight (8);
2. Select the criteria against which each option willbe rated, stated in either positive or negativeterms, but not both;
3. Determine the weight (relative value) of eachcriterion; perhaps some are more important tomeet than others;
Cont..
PRIORITIZATION MATRIX
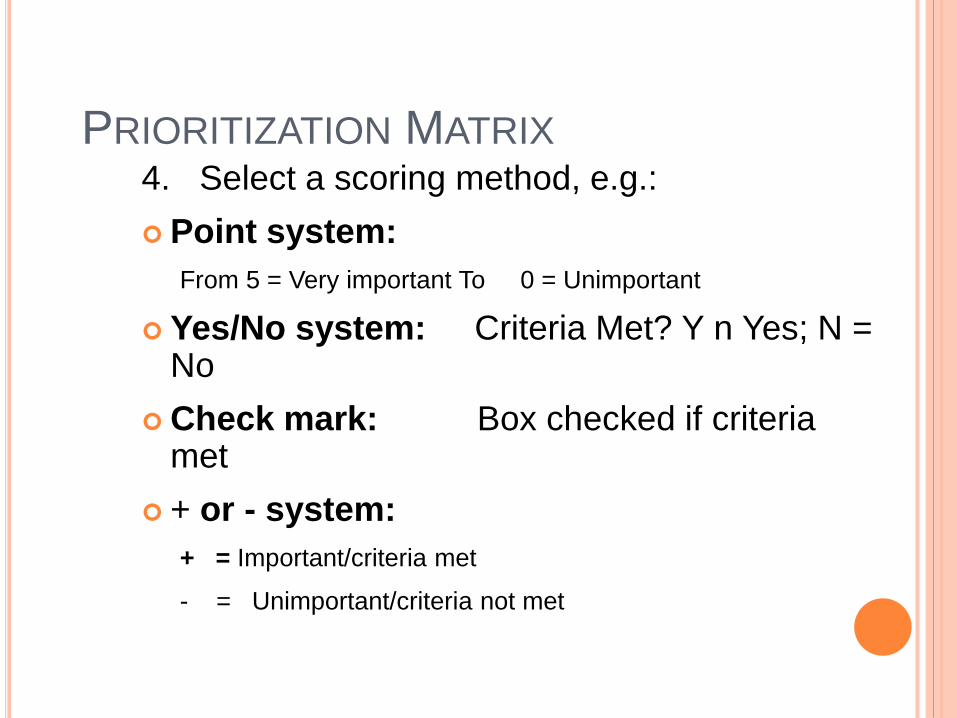
4. Select a scoring method, e.g.:
Point system:
From 5 = Very important To 0 = Unimportant
Yes/No system: Criteria Met? Y n Yes; N = No
Check mark: Box checked if criteria met
+ or - system:
+ = Important/criteria met
- = Unimportant/criteria not met
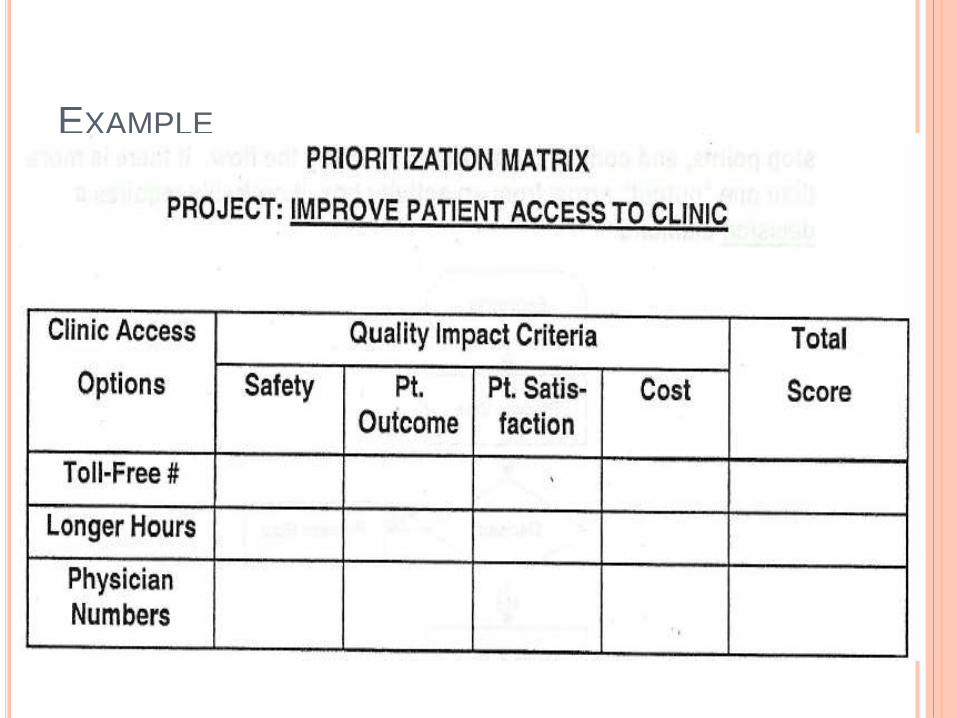
EXAMPLE
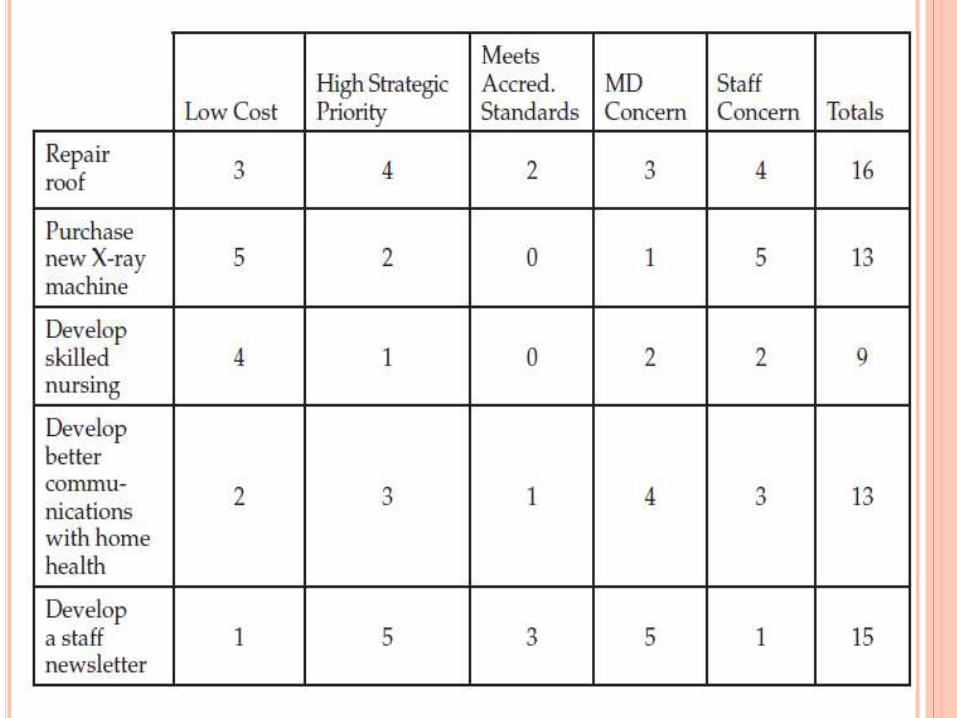
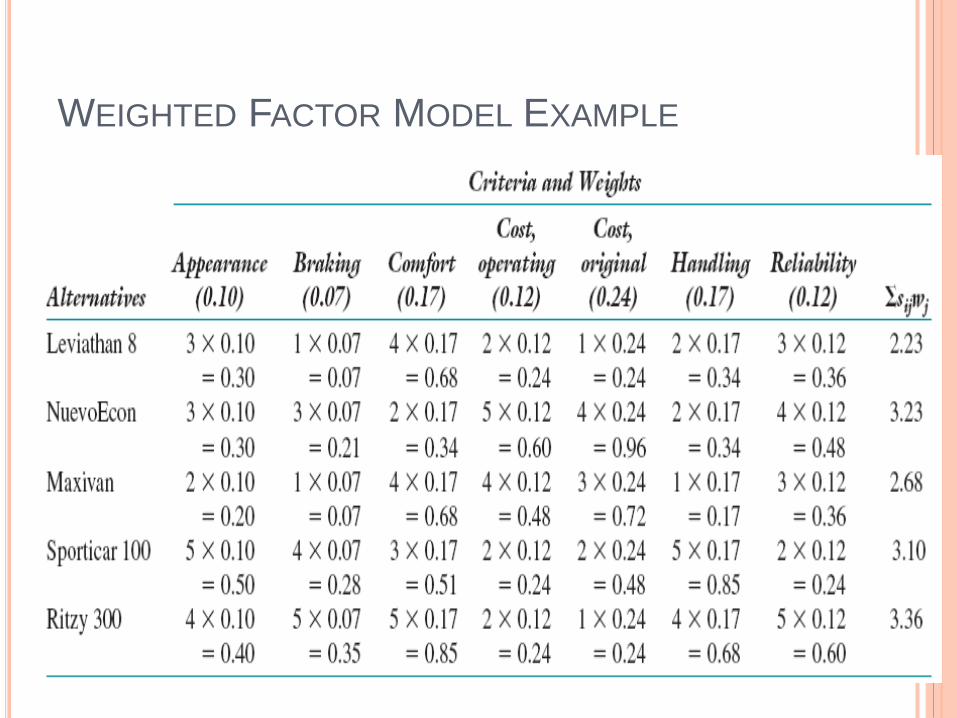
WEIGHTED FACTOR MODEL EXAMPLE
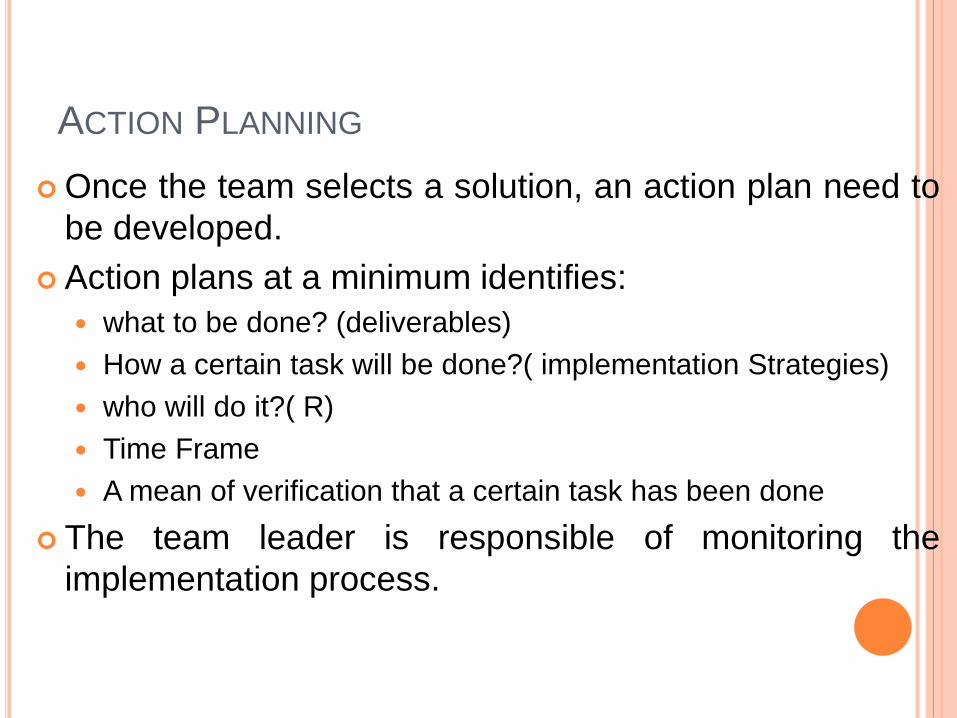
ACTION PLANNING
Once the team selects a solution, an action plan need to
be developed.
Action plans at a minimum identifies:
what to be done? (deliverables)
How a certain task will be done?( implementation Strategies)
who will do it?( R)
Time Frame
A mean of verification that a certain task has been done
The team leader is responsible of monitoring the
implementation process.
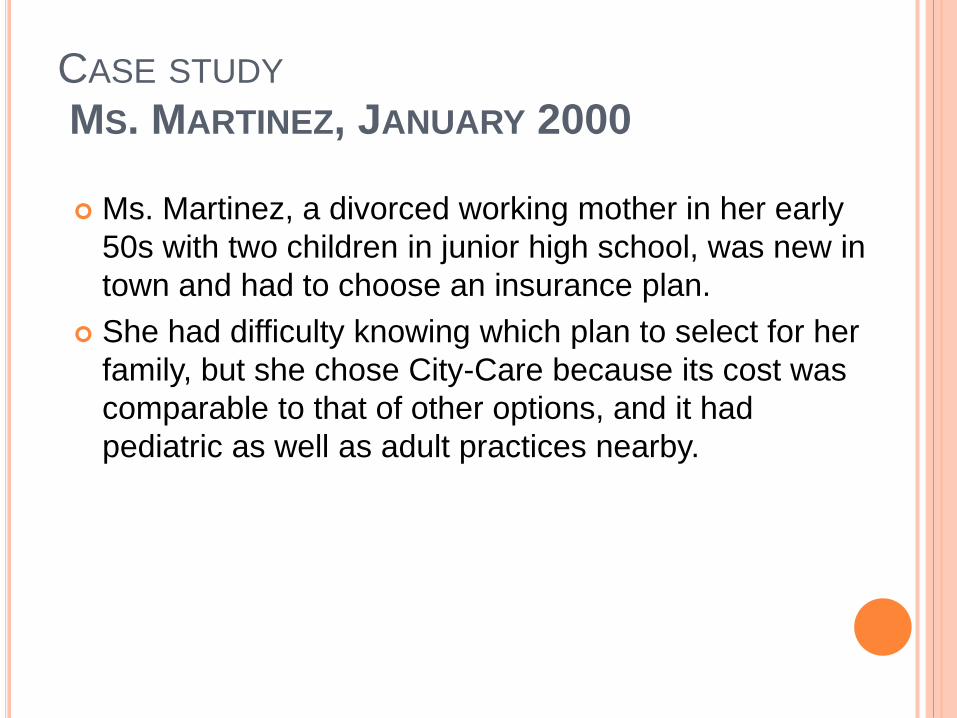
CASE STUDY
MS. MARTINEZ, JANUARY 2000
Ms. Martinez, a divorced working mother in her early
50s with two children in junior high school, was new in
town and had to choose an insurance plan.
She had difficulty knowing which plan to select for her
family, but she chose City-Care because its cost was
comparable to that of other options, and it had
pediatric as well as adult practices nearby.
Once she had joined CityCare, she was asked to
choose a primary care physician. After receiving
some recommendations from a neighbor and
several coworkers, she called several of the offices
to sign up. The first two she called were not
accepting new patients. She finally found one.
Juggling repairs on their new apartment, finding the best
route to work, getting the children’s immunization records
sent by mail, and making other arrangements to get them
into a new school, Ms. Martinez delayed calling her new
doctor’s office for several months. When she called for an
appointment, she was told that the first available non
urgent appointment was in 2 months; she hoped she
would not run out of her blood pressure medication in the
interim.
When she went for her first appointment, she was
asked to complete a patient history form in the waiting
room. She had difficulty remembering dates and
significant past events and doses of her medications.
After waiting for an hour, she met with Dr. McGonagle
and had a physical exam. Although her breast exam
appeared to be normal, Dr. McGonagle noted that she
was due for a mammogram.
Ms. Martinez called a site listed in her provider
directory and was given an appointment for a
mammogram in 6 weeks. The staff suggested that
she arrange to have her old films mailed to her.
Somehow, the films were never sent, and distracted
by other concerns, she forgot to follow up.
A week after the mammogram, she received a call
from Dr. McGonagle’s office notifying her of an
abnormal finding and saying that she should make an
appointment with a surgeon for a biopsy.
The first opening with the surgeon was 9 weeks later.
By now, she was very anxious. She hated even to
think about having cancer in her body, especially
because an older sister had died of the disease.
For weeks she did not sleep, wondering what would
happen to her children if she were debilitated or to
her job if she had to have surgery and lengthy
treatment. She was reluctant to call her mother,
who was likely to imagine the worst, and did not
know her new coworkers well enough to confide in
them.
After numerous calls, she was finally able to track
down her old mammograms. It turned out that a
possible abnormal finding had been circled the
previous year, but neither she nor her primary care
physician had ever been notified.
Finally, Ms. Martinez had her appointment with the
surgeon, and his office scheduled her for a biopsy.
The biopsy showed that she had a fairly unusual
form of cancer, and there was concern that it might
have spread to her lymph nodes.
She felt terrified, angry, sad, and helpless all at
once, but needed to decide what kind of surgery to
have. It was a difficult decision because only one
small trial comparing lumpectomy and mastectomy
for this type of breast cancer had been conducted.
She finally decided on a mastectomy.
Before she could have surgery, Ms. Martinez needed
to have bone and abdominal scans to rule out
metastases to her bones or liver. When she arrived at
the hospital for surgery, however, some of this
important laboratory information was missing. The
staff called and hours later finally tracked down the
results of her scans, but for a while it looked as though
she would have to reschedule the surgery.
During her mastectomy, several positive lymph nodes
were found. This meant she had to see the surgeon,
an oncologist, and a radiologist, as well as her primary
care physician, to decide on the next steps.
At last it was decided that she would have radiation
therapy and chemotherapy. She was given the phone
number for the American Cancer Society.
Before 6 months had gone by, Ms. Martinez found
another lump, this time under her arm. Cancer had
spread to her lung as well.
She was given more radiation, then more
chemotherapy.
Unfortunately, the condition worsened steadily and
cancer had spread leading to her death.
With your team conduct a root cause analysis for this
case.