roles of individual perception in technology adoption at
TRANSCRIPT

97
Roles of Individual Perception in Technology
Adoption at Organization Level: Behavioral Model
versus TOE Framework
Jerry C.F. Li
ADS Management Research
Abstract. It is generally accepted that two different groups of theories are
required in order to explain technology adoption at individual level and at
organization level. For individuals, behavioral theories including technology
acceptance model (TAM), theory of planned behavior (TPB), unified theory of
acceptance and use of technology (UTAUT) are frequently used to predict
intention and actual behavior. For organizations, diffusion of innovation (DOI)
model and technology-organization-environment (TOE) framework are
commonly applied for predicting adoption. While this divide appears to be
reasonable, the process of investigating an organization is, inevitably, done
through collecting opinions of the people in the organization. This leads to the
question how individual’s perception affects the application of DOI and TOE for
understanding organizational technology adoption. To extend further, what is an
"objective" measure of organizational characteristics and who can provide it? In
previous studies, researchers obtain feedback primarily only from decision
makers when applying TOE. This paper examines if a decision-maker-centered-
TOE analysis is consistent with the results obtained by directly applying behavior
model to predict individual decision maker's action, and hence further justify
TOE framework application. For this exploratory study, high degree of
consistency is observed.
Keywords: Technology adoption, theory of reasoned action, theory of planned behavior,
technology acceptance model, technology-organization-environment framework.
1. Introduction
Understanding why customers adopt a technological product or service is critical to
the supplier. When target customers are individuals, behavioral models such as
technology acceptance model (Davis, 1985; Davis, 1989; Davis and Venkatesh,
1996), theory of planned behavior (Ajzen, 1991), unified theory of acceptance and
ISSN 1816-6075 (Print), 1818-0523 (Online)
Journal of System and Management Sciences
Vol. 10 (2020) No. 3, pp. 97-118
DOI:10.33168/JSMS.2020.0308
Li / Journal of System and Management Sciences Vol. 10 (2020) No. 3, pp. 97-118
98
use of technology (Venkatesh, Morris, Davis & Davis, 2003) are frequently used for
analyzing the adoption decision (Koul & Eydgahi, 2017). These models are rooted
in psychological theories and hence suitable for investigating individual decision,
but not directly applicable to organization decision (Ajzen & Fishbein, 1977; Ajzen,
1991; Karahanna & Straub, 1999). Thus, when target customers are organizations,
the problem is analyzed by a different category of theory. Common theories for this
scenario include diffusion of innovation (Rogers, 1962) and technology-
organization-environment framework (Tornatzky and Fleischer, 1990). In these
theories, several organization characteristics have to be identified in order to predict
technology adoption (Oliveira & Martins, 2011; Hoti, 2015).
While using the two groups of theories to correspondingly analyze individual
and organization adoption is a generally accepted practice, there is no serious study,
as far as the author aware of, regarding how to fairly obtain the required
organization characteristics when the target of analysis is an organization.
Inevitably, these characteristics can only be obtained by surveying people in the
organization. However, different members in the same organization may have very
different assessments. For example, CEO of a company, head of IT, and a
programmer may have completely different views on these organization
characteristics when evaluating a software. These characteristics can be readiness to
adopt, realizable advantages, competitive regime, etc. Surveying different people
may produce significantly different predictions. Without a proven methodology to
fairly determine these organization characteristics, most researchers choose to
survey decision makers who have the power to approve final purchase (Oliveira &
Martins, 2010; Kuan & Chau, 2001). This appears to be a reasonable approach, but
also leads to a concern about the roles of individual perception in organization level
theories. Afterall, the outcome of these theories will be dependent on the view of an
individual (or a few individuals) on these organization characteristics. As such, the
question is whether these organization level theories are fundamentally different
from individual level theories, or they are simply alternative manifestations of
individual level theories? Clarifying this issue is not only theoretically important,
but also provides vital insights for practical research model design.
This paper explores the question by mapping selected results from a
questionnaire-based survey into both behavioral model and TOE framework, and
then compares their predictions. The survey was conducted last year, and results
had been analyzed using a specific, individual level, behavioral model (Li, 2020).
Out of 263 responses obtained, 117 are from decision makers. It has been
demonstrated that the model can effectively predict organization adoption of
blockchain technology when only responses from decision makers are taken into
account. However, predictive power quickly deteriorates when other respondents
are included. The observation suggests that, by carefully grouping and using the
responses, individual level theories may also be applied for predicting organization
Li / Journal of System and Management Sciences Vol. 10 (2020) No. 3, pp. 97-118
99
level adoption. This study continues with the exploration by analyzing the same
survey results under TOE framework and examines if the theory gives a
complementary or competing explanation against the behavioral model.
This paper is organized as follow: In section 2, the relevant theories are briefly
reviewed. Section 3 summarizes the analysis based on the behavioral model
developed by Li (2020). Section 4 remaps the survey results into TOE framework
and performs the necessary analyses for comparison. Finally, predictions from the
two theories and implications are examined in Section 5.
2. Relevant theories
Relevant theories are briefly reviewed in this section.
2.1. Predicting adoption by individual level theories
Most individual level theories are behavioral models in nature. Starting from the
theory of reasoned action (TRA), which is a generic model for predicting behavior,
some important derived models had emerged. The theory of planned behavior (TPB)
is a refined generic behavioral model evolved from TRA. Another model developed
from TRA is technology acceptance model (TAM), which is, as its name has
implied, a specialized model for predicting technology adoption. Unified theory of
acceptance and use of technology (UTAUT) is a further enhancement of TAM.
Each of these models also has some derivatives or refinements. Figure 1 depicts the
relationships of the major models.
Developed by Ajzen and Fishbein (1977), TRA (Figure 1(a)) is the first theory
systematically illustrated that an individual performing a particular behavior is not
only influenced by his/her attitude towards that behavior, but also the subjective
norm with respect to this behavior. Subjective norm refers to the individual’s belief
on how other relevant people think about him/her if he/she performs that behavior.
With proper research design, TRA quantifies the influences of attitude and
subjective norm, and explains many inconsistent behaviors observed in social
science research (Ajzen and Fishbein, 1980).
Ajzen (1991) refined TRA by introducing an additional component known as
perceived behavioral control (PBC), leading to the TPB model (Figure 1(b)). PCB
refers to the individual’s perception on how much control does he/she have to
perform a certain behavior. There are two aspects of PBC (Ajzen, 2002; Ajzen and
Madden, 1986): whether the individual perceives that he/she can access to the
resources to perform the behavior, and whether he/she perceives there are
opportunities to perform the behavior. A salient feature of PCB is its direct linkage
to actual behavior: if the individual perceives that there is no opportunity to perform
the behavior, he/she may actually not perform even though he/she has a positive
behavioral intention to do so.
Both TRA and TPB are generic in nature and not specifically designed for
particular situations. These theories have been extensively used to understand

Li / Journal of System and Management Sciences Vol. 10 (2020) No. 3, pp. 97-118
100
individual behavior in health-related issues, work-related issues, investment,
product preference, eating habit, travelling and, of course, technology adoption. In
order to apply these theories, researchers have to identify the appropriate variables
for their study topics. In contrast, TAM (Figure 1(c)) uses two pre-determined
constructs, perceived usefulness (PU) and perceived ease of use (PEOU), to predict
adoption. The model shown is the original version of TAM, which was developed
based on investigating adoption of word-processing software (Davis, 1985). In light
of experiences gained from more applications, the inventor had revised the model a
few times (Davis, 1989; Davis and Venkatesh, 1996). These revisions remain using
PU and PEOU as the only two constructs for predicting adoption. Final version of
TAM is shown in Figure 2 (Davis and Venkatesh, 1996). In addition, there are two
expanded versions of TAM, namely TAM2 and TAM3, that include more
constructs such as subjective norm, computer anxiety, etc. Details are provided in
Venkatesh & Davis (2000) and Venkatesh & Bala (2008).
Fig. 1: Individual level models.
Fig. 2: Final version of technology acceptance model.
Li / Journal of System and Management Sciences Vol. 10 (2020) No. 3, pp. 97-118
101
While TAM is the most frequently used model for analyzing information
technology adoption, the model has been frequently refined, expanded and modified
since its deployment. This is not surprising because the model was originated from
studying word-processing software acceptance in office environment in 1980s,
which is relatively simple compared to the subsequent technology adoption
problems down the timeline. Having examined TAM applications under different
scenarios, researchers (Venkatesh & Davis, 2000; Bagozzi, 2007; Venkatesh & Bala,
2008) suggested that the model has left out important variables and processes for
effective analysis for some cases. Another concern is appropriateness of the two
constructs, PU and PEOU, under different applications. Researchers (Legris,
Ingham & Collerette, 2003; Ma & Liu 2004; King & He, 2006; Yousafzai, Foxall &
Pallister, 2007) conducted numerous meta-analyses covering TAM applications for
various technologies, geographies, and participants. These studies indicated that PU
remains as a significant predictor of behavioral intention in most cases, but the
relative importance and significance of PEOU could be less concrete. This is
consistent with Gefen and Straub’s (2000) interpretation that PEOU is a dynamic
construct and its influence is highly dependent on the nature of the problem under
investigation, the technology, and the survey targets.
To address these difficulties, UTAUT (Figure 1(d)) is introduced as an
enhancement (Venkatesh, Morris, Davis & Davis, 2003). The model utilizes more
generalized constructs and moderators to cater for wider range of applications, and
explained about 70% of the variance in behavioral intention and 50% of the
variance of actual usage in longitudinal field studies of employee technology
acceptance. To further improve explanation of variance, an extended model,
UTAUT2, had been proposed (Venkatesh, Thong & Xu, 2012; 2016). Despite the
apparent advantages, however, Bagozzi (2007) criticized the large number of
variables used in UTAUT has led the study of technology adoption to a stage of
chaos. van Raaij and Schepers (2008) challenged the grouping of many variables to
represent a single psychometric construct, and pointed out that the high R2 is only
achieved by excessive use of moderators. Li (2020) commented that conducting a
lengthy survey with many variables is impractical under most real-life business
settings.
2.2. Predicting adoption by organization level theories
Technology adoption in an organization is a two-folded problem. In one case, the
research problem is to predict whether a company will purchase a certain
technology. This is obviously a critical question for the supplier of that technology.
In the other case, the company is aware about a technology and want to understand
if most employees will adopt it over a period of time so as to consider purchasing.
While these two problems are related, they are not the two sides of the same coin
because the purchasing decision will not be made solely based on employee’s
acceptance of the technology. Other factors including the organization’s business

Li / Journal of System and Management Sciences Vol. 10 (2020) No. 3, pp. 97-118
102
strategies, operation goals, vendor relationship, competitive environment,
regulations, etc. must also be considered. It is worth pointing out that the second
problem (i.e. employee adoption over a period of time) is essentially a collection of
individual technology adoption problems under organizational constraints. For easy
reference, the first problem (i.e. organization making purchase decision) is referred
as Type I problem, and the second problem (i.e. employee adoption over a period of
time) is referred as Type II problem.
Compared to individual level technology adoption, organizational level
adoption is a less researched area. Two major models, diffusion on innovation (DOI,
also known as innovation diffusion theory, IDT) model and technology-
organization-environment (TOE) framework, have been used for investigation.
These models assume some specific characteristics of an organization are known or
quite concretely determinable, and use them to infer technology adoption.
Originally a theory about social change, DOI model (Rogers, 1962) has a
successful history of explaining social adoption of innovations. The theory
examines adoption on a voluntary base, and describes the process as an information
seeking and processing for an individual to reduce uncertainty about the advantages
and disadvantages of an innovation (Figure 3). Furthermore, the theory outlines five
attributes that promote adoption: (a) showing relative advantages over the existing
approach; (b) compatible with existing values and practices; (c) simple and ease of
use; (d) can be tried on a limited bias in order to reduce uncertainty; and (e) results
are easily observable.
Fig. 3: Information seeking and processing in DOI model.
Unlike the behavioral models discussed in Section 2.1, this information seeking
and processing exercise does not stop at the decision stage when an adopt or reject

Li / Journal of System and Management Sciences Vol. 10 (2020) No. 3, pp. 97-118
103
decision has been made. Instead, communication channels will drive the process to
continue and decisions can change down the road. This indeed reflects the reality of
changing individual technology acceptance decision in organization: some
individual will adopt (or abandon) a technology faster than others, and the others
may change their mind through the continuous information seeking and processing
exercise. Thus, DOI model projects that the overall adoption in an organization will
display a pattern as shown in Figure 4.
It should be clear that while both DOI model and the behavioral models in
Section 2.1 are focusing on individual adoption, DOI model provides a continuous
view on how technology adoption changes in an organization over a period. The
behavioral models, on the other hand, are focusing on predicting individual decision
at a specific timeslot. Thus, applying DOI model to Type II problem is more
appropriate. However, DOI model is high level in nature and therefore researchers
usually use the model in conjunction with TAM or other behavioral models in order
to develop practically verifiable hypotheses for organization adoption (Dibra, 2015;
Yu & Tao, 2009; Zhou Y, 2008).
Fig. 4: Innovation adoption pattern in DOI.
TOE framework (Tornatzky & Fleischer, 1990) responses to Type I problem by
investigating organization technology adoption decision bases on organization
characteristics. As the name of the framework implies, these characteristics are
categorized as (a) technological; (b) organizational; and (c) environmental (Figure
5).

Li / Journal of System and Management Sciences Vol. 10 (2020) No. 3, pp. 97-118
104
Fig. 5: TOE framework.
While the framework appears to be straightforward, determining these
characteristics could be challenging because they can only be understood by
collecting opinions from the members of the organization. It is obvious that
members of the same organization can have different, or even contradicting, views
about these characteristics. Averaging the opinions would not be helpful because
purchasing a technology (and hence adopting that technology from the
organization’s viewpoint) is usually not based on average opinion but the consent of
a small group or even the opinion of a single decision maker. To avoid such
ambiguity, most TOE-framework-based researches would only rely on input from
decision makers (Awa, Ukoha & Igwe, 2017; Yeh, Lee & Pai, 2016; Hoti, 2015;
Oliveira & Martins, 2011; Oliveira & Martins, 2010; Kuan & Chau, 2001).
With this limitation, a question of choosing research model naturally arises: For
Type I problem (i.e. organization purchasing a technology), is using TOE
framework to predict an organization’s decision practically equivalent to applying
behavioral models to predict the behavior of the organization’s decision maker?
That is, will these two approaches lead to the same conclusion? As an exploratory
analysis, this study developed a TRA model and a TOE model based on the same
survey instrument and compared their predictions. The TRA model had been
published in an earlier paper (Li, 2020) and the results are summarized in Section 3.
Development and validation of the TOE model are illustrated in Section 4.
3. TRA model for blockchain technology adoption: a summary
A survey about blockchain technology adoption among small-to-medium size
Li / Journal of System and Management Sciences Vol. 10 (2020) No. 3, pp. 97-118
105
enterprises (SME) in Hong Kong was conducted from February to July of 2019.
Anonymous questionnaires were distributed to audiences of a number of
information technology seminars for SMEs. Surveys were administrated during the
break. Numerous research studies (Gibson & Bowling, 2020; Yan, Conrad,
Tourangeau & Couper, 2011; Galesic & Bosnjak, 2009) had shown that length of
questionnaire would adversely affect response rate and also induce careless
responding. This is paticularly true in business environment. To ensure relevancy of
responses, the questionnaire was brief and should take less then 10 minutes to
answer.
Since this study intended to compare the outcome of behavioral model and TOE
model, the questionnaire was designed to fit into both frameworks. Given the 10
minutes time constraint for answering the questionnaire, complex behavioral
models such as TAM2, TAM3, UTAUT or UTAUT2 are impractical because too
many variables and hence too many questions would be required. On the other hand,
TAM, although simple, might not be a good choice because of the restriction of
using only PU and PEOU as input constructs (Section 2.1). Considering simplicity
as well as the flexibility to include additional constructs, TRA had been chosen as
the behavioral model for this study.
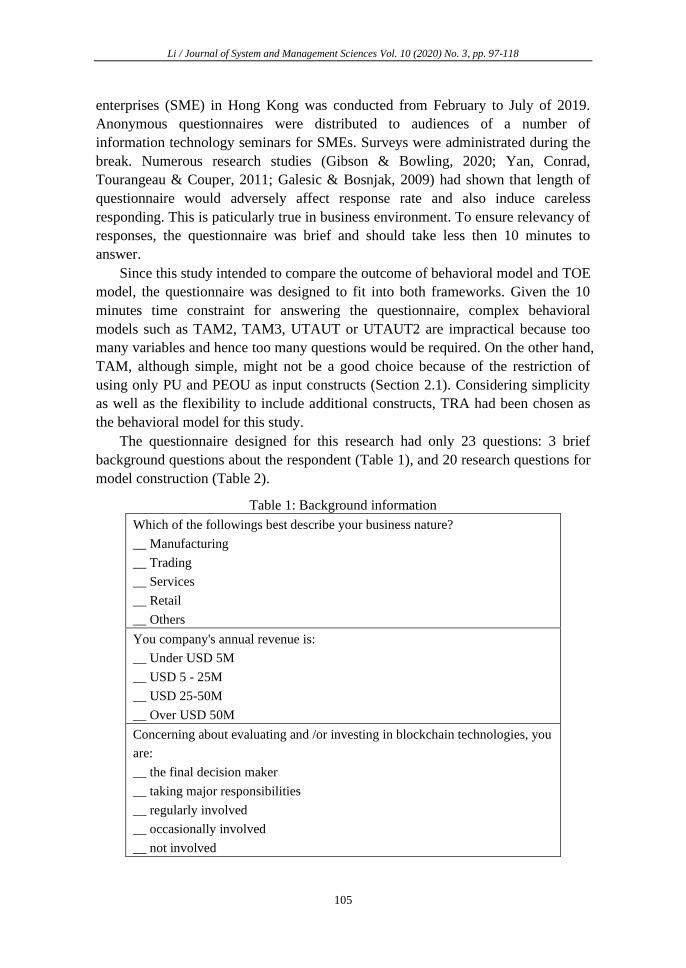
The questionnaire designed for this research had only 23 questions: 3 brief
background questions about the respondent (Table 1), and 20 research questions for
model construction (Table 2).
Table 1: Background information
Which of the followings best describe your business nature?
__ Manufacturing
__ Trading
__ Services
__ Retail
__ Others
You company's annual revenue is:
__ Under USD 5M
__ USD 5 - 25M
__ USD 25-50M
__ Over USD 50M
Concerning about evaluating and /or investing in blockchain technologies, you
are:
__ the final decision maker
__ taking major responsibilities
__ regularly involved
__ occasionally involved
__ not involved

Li / Journal of System and Management Sciences Vol. 10 (2020) No. 3, pp. 97-118
106
Table 2: Research questions for TRA model construction
Item Description TRA
Construct Variable
1 In our business, some process improvements CANNOT be made without blockchain technologies.
PU
PU_1
2 Adopting blockchain technologies will enable our company to offer new products / services that CANNOT be provided in the past.
PU_2
3 Blockchain technologies can provide a justifiable return on investment in a reasonable period of time.
PU_3
4 In our sector, companies who have implemented blockchain technologies have gained competitive advantages.
PU_4
5 Blockchain technologies are safe and reliable.
PEOU
PEOU_1
6 For our business, there is no major operational barrier for adopting blockchain technologies.
PEOU_2
7 Our employees can quickly cope with changes due to deploying blockchain technologies.
PEOU_3
8 If needed, external implementation consultants are readily available at a reasonable fee.
PEOU_4
9 At a regional / country level, authorities are encouraging companies to adopt blockchain technologies.
PTRD
PTRD_1
10 Adopting blockchain technologies is becoming a trend in many business sectors.
PTRD_2
11 More companies in OUR sector will adopt blockchain technologies in the NEAR future.
PTRD_3
12 Our customers would expect our company to use blockchain technologies.
NOR
NOR_1
13 Our suppliers would expect our company to use blockchain technologies.
NOR_2
14 Our employees would expect our company to use blockchain technologies.
NOR_3
15 Blockchain technologies can improve our operation
ATT
ATT_1
16 In an overall sense, blockchain technologies are good for our company.
ATT_2
17 I believe our company should implement blockchain technologies in NEAR future.
BI
BI_1
18 I am actively cultivating agreement among other relevant members in the company to adopt blockchain technologies.
BI_2
19 We are working out / already have an implementing plan with budget for blockchain technologies.
B
B_1
20 We have spent / scheduled to spend remarkably on implementing blockchain technologies.
B_2

Li / Journal of System and Management Sciences Vol. 10 (2020) No. 3, pp. 97-118
107
By the end of the survey period, 263 valid responses had been collected. For the
purpose of this study, only responses from “final decision makers” and those who
claimed to be “taking major responsibilities” (Table 3.1) for technology adoption in
their organizations were used for model construction. In the context of this research,
these respondents were collectively referred as decision makers. Additionally, since
big companies and small companies could have very different resources for
technology deployment, responses from companies with annual revenue less than
USD 5M or more than USD 50M were excluded (Table 3.1). Under these criteria,
117 responses were considered as vital responses from decision makers. After
standard validation and statistical analysis, a TRA model based on these 117
responses was obtained (Figure 6, referred as Model 1). While most hypotheses in
the proposed model (Li, 2020) were supported, it is interesting to note that PEOU is
not a significant predictor of attitude to adopt (ATT). As discussed in Section 2.1,
the same phenomenon had been observed in many previous meta-analyses on TAM
applications (Legris, Ingham & Collerette, 2003; Ma & Liu 2004; King & He, 2006;
Yousafzai, Foxall & Pallister, 2007). In this study, the observation could possibly
be accounted by the fact that decision makers may not be the one who actual use the
technology so they may not consider, or even not aware, ease of use as a crucial
factor. Alternatively, other factors such as market trend, financial return, etc. could
be far more important in the mind of decision makers so PEOU had insignificant
effect in the model.
Fig. 6: TRA model based solely on responses from decision makers (Model 1)
As exploratory analyses, two additional trial models utilizing responses from

Li / Journal of System and Management Sciences Vol. 10 (2020) No. 3, pp. 97-118
108
more respondents were computed. In model 2, answers from respondents who
claimed to be “regularly involved” (Table 3.1) in technology adoption had been
included. In model 3, all responses had been included. Predictive power of the three
models were compared (Table 3). Details are provided in Li (2020).
Table 3: Indicative predictive power comparison
R2
Model 1
(N=117)
Model 2
(N=159)
Model 3
(N=263)
Decision
makers
only
Decision makers and
those with regular
involvement
All respondents
Behavior to adopt (B) 70.2% 29.3% 18.2%
Behavioral intention to adopt (BI) 72.6% 73.0% 65.3%
While all three models can reasonably predict behavioral intention (BI), only
Model 1 can meaningfully predict actual adopt (B). Since responses were collected
during IT seminars, most participants would have good IT literacy and therefore
high R2 for BI should not be surprising. For implementation, however, R2 for B
dropped very remarkably when responses from non-decision-makers were included.
This could be an indication that behavioral intentions of most non-decision-makers
could not be translated into actual adoption (or rejection) due to lack of power to
make actual decision.
4. TOE model for blockchain technology adoption
The current scenario of housing affordability situation of middle-income group
in Son The questionnaire in Section 3 was designed to fit into both TRA model and
TOE model. In this section, the questionnaire is remapped into TOE categories,
followed by a preliminary data analysis. A TOE model is then proposed and
validated.
To remap the questionnaire, five TOE categories are defined. These five
constructs are:
(a) Technical advantage (TADV) – this construct accounts for, from technical
perspectives, process improvement, new product offering, cost reduction, enhanced
reliability, and other advantages that the concerned technology may lead to;
(b) Organization readiness (ORDY) – this construct examines if the
organization is ready to adopt the technology base on operation, human resources,
and other supporting requirements;
(c) Management support (OMSP) – this construct measures the management’s
willingness to adopt the technology via general impression, investment justification,
actions taken, etc.
(d) General trend (EGEN) – this construct represents the broad impression
about the development direction of the technology under examination;
Li / Journal of System and Management Sciences Vol. 10 (2020) No. 3, pp. 97-118
109
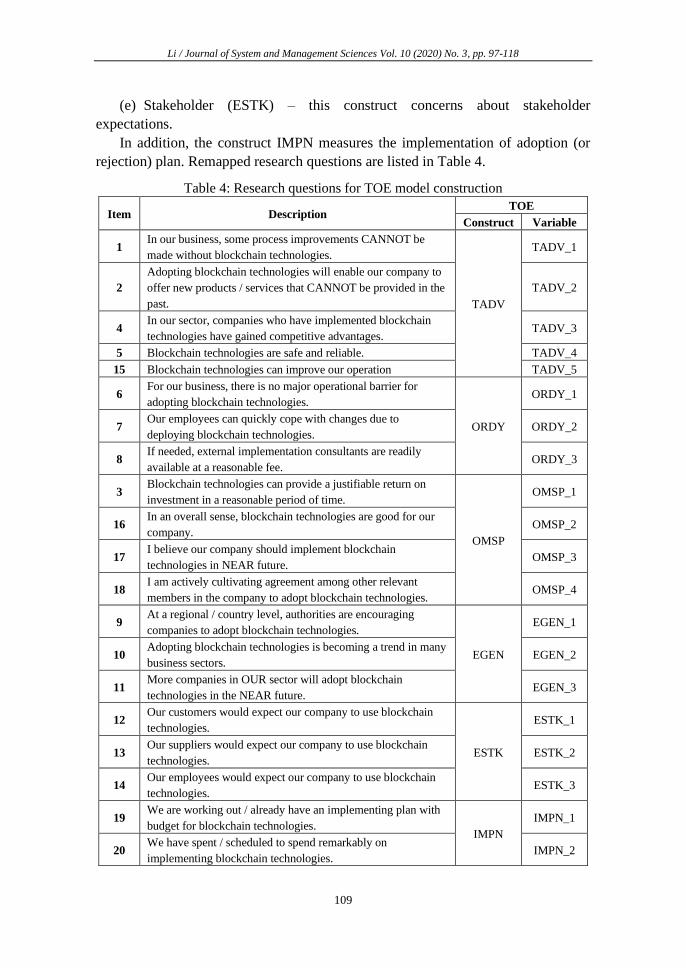
(e) Stakeholder (ESTK) – this construct concerns about stakeholder
expectations.
In addition, the construct IMPN measures the implementation of adoption (or
rejection) plan. Remapped research questions are listed in Table 4.
Table 4: Research questions for TOE model construction
Item Description TOE
Construct Variable
1 In our business, some process improvements CANNOT be
made without blockchain technologies.
TADV
TADV_1
2
Adopting blockchain technologies will enable our company to
offer new products / services that CANNOT be provided in the
past.
TADV_2
4 In our sector, companies who have implemented blockchain
technologies have gained competitive advantages. TADV_3
5 Blockchain technologies are safe and reliable. TADV_4
15 Blockchain technologies can improve our operation TADV_5
6 For our business, there is no major operational barrier for
adopting blockchain technologies.
ORDY
ORDY_1
7 Our employees can quickly cope with changes due to
deploying blockchain technologies. ORDY_2
8 If needed, external implementation consultants are readily
available at a reasonable fee. ORDY_3
3 Blockchain technologies can provide a justifiable return on
investment in a reasonable period of time.
OMSP
OMSP_1
16 In an overall sense, blockchain technologies are good for our
company. OMSP_2
17 I believe our company should implement blockchain
technologies in NEAR future. OMSP_3
18 I am actively cultivating agreement among other relevant
members in the company to adopt blockchain technologies. OMSP_4
9 At a regional / country level, authorities are encouraging
companies to adopt blockchain technologies.
EGEN
EGEN_1
10 Adopting blockchain technologies is becoming a trend in many
business sectors. EGEN_2
11 More companies in OUR sector will adopt blockchain
technologies in the NEAR future. EGEN_3
12 Our customers would expect our company to use blockchain
technologies.
ESTK
ESTK_1
13 Our suppliers would expect our company to use blockchain
technologies. ESTK_2
14 Our employees would expect our company to use blockchain
technologies. ESTK_3
19 We are working out / already have an implementing plan with
budget for blockchain technologies. IMPN
IMPN_1
20 We have spent / scheduled to spend remarkably on
implementing blockchain technologies. IMPN_2

Li / Journal of System and Management Sciences Vol. 10 (2020) No. 3, pp. 97-118
110
Based on the 117 responses from decision makers, Cronbach’s alpha test (Table
5) and discriminant validity test (Table 6) are performed.
Table 5: Cronbach’s alpha test
No. of variables No. of data Cronbach's alpha
TADV 5 117 0.83
ORDY 3 117 0.76
OMSP 4 117 0.90
EGEN 3 117 0.71
ESTK 3 117 0.89
IMPN 2 117 0.92
Cronbach’s alpha greater than 0.7 indicates satisfactory internal reliability
(Nunnaly, 1978). Thus, numerical average of the variables in a category can
properly represent their corresponding construct.
Table 6: Discriminant Validity
Correlation
coefficient (r)
Standard Error
(SE) 1 - r - 2*SE
TADV - ORDY 0.41 0.08 0.44
TADV - OMSP 0.85 0.04 0.08
TADV - EGEN 0.77 0.07 0.10
TADV - ESTK 0.75 0.05 0.16
TADV - IMPN 0.75 0.04 0.17
ORDY - OMSP 0.64 0.06 0.24
ORDY - EGEN 0.48 0.10 0.32
ORDY - ESTK 0.61 0.06 0.26
ORDY - IMPN 0.63 0.05 0.27
OMSP - EGEN 0.72 0.10 0.08
OMSP - ESTK 0.89 0.05 0.02
OMSP - IMPN 0.84 0.05 0.07
EGEN - ESTK 0.75 0.04 0.17
EGEN - IMPN 0.55 0.05 0.36
ESTK - IMPN 0.77 0.05 0.13
According to Bagozzi and Warshaw (1980), discriminant validity can be
claimed if
1 – r – SE > 0 (1)
where r is the correlation coefficient. SE is the standard error
Li / Journal of System and Management Sciences Vol. 10 (2020) No. 3, pp. 97-118
111
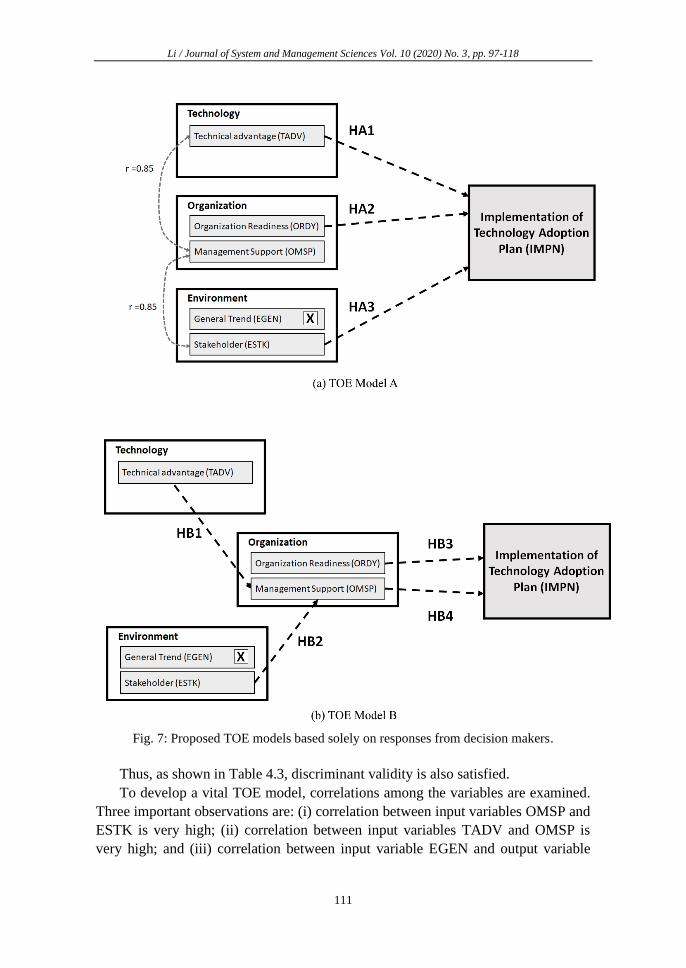
Fig. 7: Proposed TOE models based solely on responses from decision makers.
Thus, as shown in Table 4.3, discriminant validity is also satisfied.
To develop a vital TOE model, correlations among the variables are examined.
Three important observations are: (i) correlation between input variables OMSP and
ESTK is very high; (ii) correlation between input variables TADV and OMSP is
very high; and (iii) correlation between input variable EGEN and output variable
Li / Journal of System and Management Sciences Vol. 10 (2020) No. 3, pp. 97-118
112
IMPN is low.
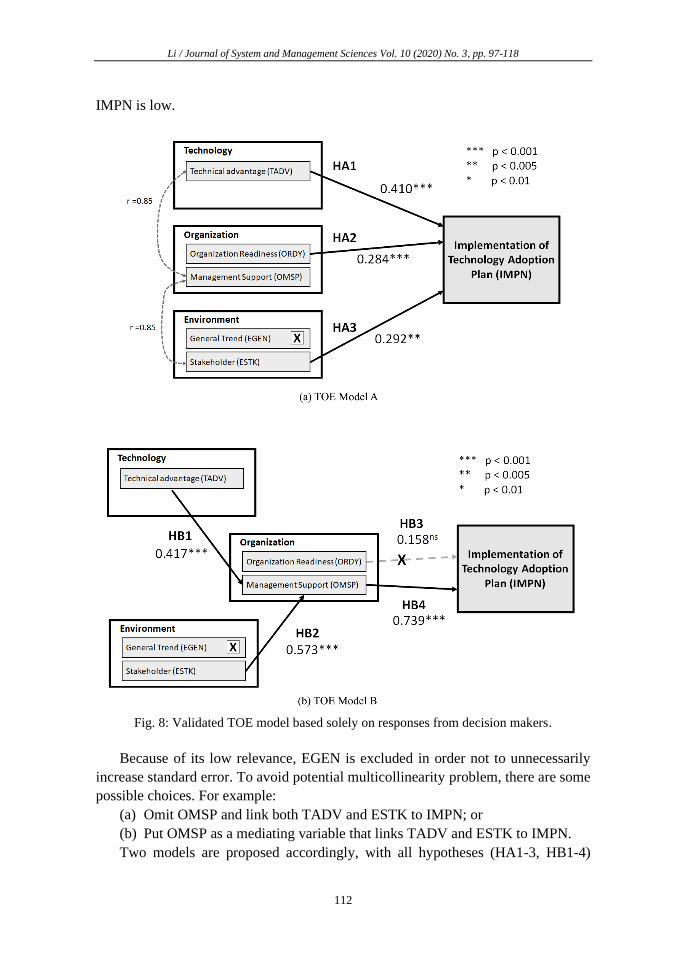
Fig. 8: Validated TOE model based solely on responses from decision makers.
Because of its low relevance, EGEN is excluded in order not to unnecessarily
increase standard error. To avoid potential multicollinearity problem, there are some
possible choices. For example:
(a) Omit OMSP and link both TADV and ESTK to IMPN; or
(b) Put OMSP as a mediating variable that links TADV and ESTK to IMPN.
Two models are proposed accordingly, with all hypotheses (HA1-3, HB1-4)

Li / Journal of System and Management Sciences Vol. 10 (2020) No. 3, pp. 97-118
113
postulating positive correlations between concerned variables (Figure 7).
Multiple regression is used to analyze the hypotheses. Results are summaries in
Figure 8.
While all hypotheses in Model A are supported, HB3 (i.e. effect of ORDY) in
Model B is not. The apparent inconsistency suggests that effect of ORDY may
mediate through OMSP. A mediation test (Baron and Kenny, 1986; Judd and Kenny,
1981) has verified this assumption (Table 7).
Table 7: Mediation test (non-significant when p > 0.01)
Constructs Correlation Coefficient p-value Mediation
ORDY – IMPN 0.633 0.000
Full ORDY – OMSP 0.642 0.000
ORDY - IMPN
0.158 0.015
OMSP 0.739 0.000
Accordingly, Model B has been modified to reflect the mediation relation. The
resulting model (Model C, Figure 9) has been satisfactorily validated.
Fig. 9: Validated TOE Model C.
Thus, two vital models, Model A and Model C, are obtained base on the TOE
framework.
5. Discussions and Conclusion
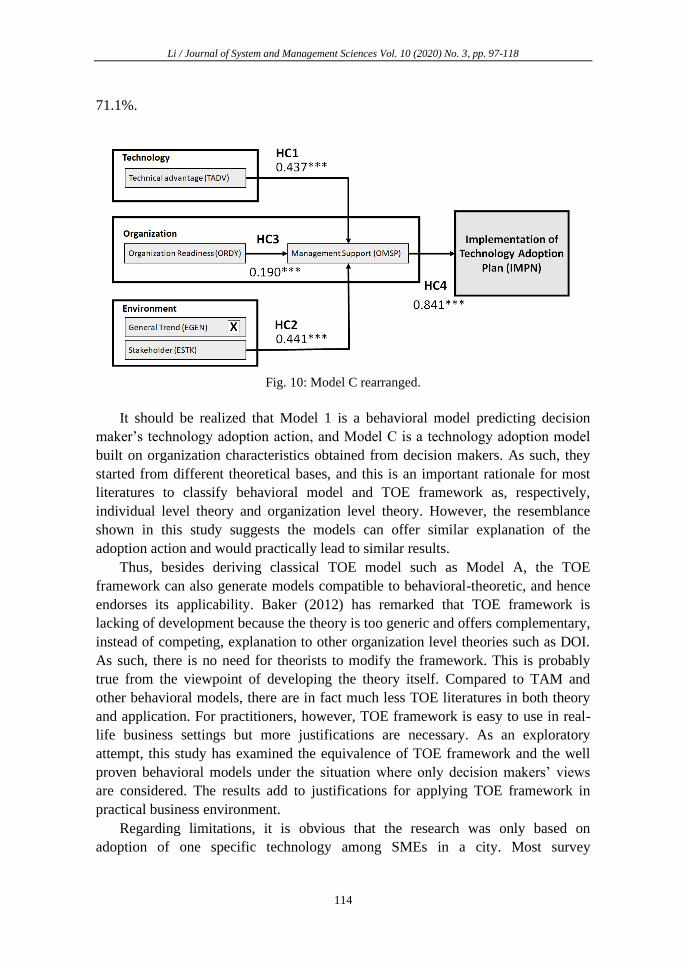
Model C resembles, to a good degree, Model 1 in Figure 6 after slight
rearrangement (Figure 9). Comparing the two models, TADV’s role is similar to PU,
ORDY to PEOU, and ESTK to SN. Other mediating variables in Model 1 are
replaced by OMSP in Model C. R2 of Model 1 is 70.2% and that of Model C is
Li / Journal of System and Management Sciences Vol. 10 (2020) No. 3, pp. 97-118
114
71.1%.
Fig. 10: Model C rearranged.
It should be realized that Model 1 is a behavioral model predicting decision
maker’s technology adoption action, and Model C is a technology adoption model
built on organization characteristics obtained from decision makers. As such, they
started from different theoretical bases, and this is an important rationale for most
literatures to classify behavioral model and TOE framework as, respectively,
individual level theory and organization level theory. However, the resemblance
shown in this study suggests the models can offer similar explanation of the
adoption action and would practically lead to similar results.
Thus, besides deriving classical TOE model such as Model A, the TOE
framework can also generate models compatible to behavioral-theoretic, and hence
endorses its applicability. Baker (2012) has remarked that TOE framework is
lacking of development because the theory is too generic and offers complementary,
instead of competing, explanation to other organization level theories such as DOI.
As such, there is no need for theorists to modify the framework. This is probably
true from the viewpoint of developing the theory itself. Compared to TAM and
other behavioral models, there are in fact much less TOE literatures in both theory
and application. For practitioners, however, TOE framework is easy to use in real-
life business settings but more justifications are necessary. As an exploratory
attempt, this study has examined the equivalence of TOE framework and the well
proven behavioral models under the situation where only decision makers’ views
are considered. The results add to justifications for applying TOE framework in
practical business environment.
Regarding limitations, it is obvious that the research was only based on
adoption of one specific technology among SMEs in a city. Most survey

Li / Journal of System and Management Sciences Vol. 10 (2020) No. 3, pp. 97-118
115
respondents have relatively high level of IT proficiency, which might make their
responses different from a wider range of general IT users. Thus, the findings in this
study cannot be over-generalized and further researches covering different range of
participants for other products/services and geographies are essential.
References
Ajzen I. (1991). The theory of planned behaviour. Organizational Behavior and
Human Decision Processes, 50, 179-211.
Ajzen I. (2002). Perceived behavioral control, self-efficacy, locus of control, and
the theory of planned behavior. Journal of Applied Social Psychology, 32, 665-683.
Ajzen I and Fishbein M. (1977). Attitude-behavior relations: A theoretical analysis
and review of empirical research. Psychological Bulletin, 85(5), 888-918.
Ajzen I and Fishbein M. (1980). Understanding attitudes and predicting social
behaviour. Prentice-Hall, Inc.
Ajzen I and Madden T. (1986). Prediction of goal directed behavior: Attitudes,
intentions, and perceived behavioral control. Journal of Experimental Social
Psychology, 22, 453-474.
Awa H, Ukoha O & Igwe S. (2017). Integrated technology-organization-
environment (T-O-E) taxonomies for technology adoption. Journal of Enterprise
Information Management, 30(6), 893-921.
Bagozzi R and Warshaw P. (1980). Trying to Consume. Journal of Consumer
Research, 17,127-140.
Bagozzi R. (2007). The legacy of the technology acceptance model and a proposal
for a paradigm shift. Journal of the Association for Information Systems, 8(4), 244–
254.
Baker J. (2012). The Technology-Organization-Environment Framework, section
12.3.1. Information Systems Theory: Explaining and Predicting Our Digital Society,
Editor: Dwivedi Y, et. al., Springer, 237-241.
Baron R and Kenny D. (1986). The moderator-mediator variable distinction in
social psychological research: Conceptual, strategic, and statistical considerations.
Journal of Personality and Social Psychology, 51, 1173-1182.

Li / Journal of System and Management Sciences Vol. 10 (2020) No. 3, pp. 97-118
116
Davis F. (1985). A technology acceptance model for empirically testing new end-
user information systems: theory and results. doctoral dissertation, MIT Sloan
School of Management, Cambridge, MA.
Davis F. (1989). Perceived usefulness, perceived ease of use, and user acceptance of
information technology. Management Information Systems (MIS) Quarterly, 13(3),
319–340.
Davis F and Venkatesh V. (1996). A critical assessment of potential measurement
biases in the technology acceptance model: three experiments. International
Journal of Human-Computer Studies, 45(1), 19-45.
Dibra M. (2015). Rogers Theory on Diffusion of Innovation – the most appropriate
theoretical model in the study of factors influencing the integration of sustainability
in tourism businesses. Procedia – Social and Behavioral Sciences, 195, 1453-1462.
Galesic M and Bosnjak M. (2009). Effects of Questionnaire Length on Participation
and Indicators of Response Quality in a Web Survey. Public Opinion Quarterly,
73(2), 349-360.
Gefen D and Straub D. (2000). The Relative Importance of Perceived Ease of Use
in IS Adoption: A Study of E-Commerce Adoption. Journal of the Association for
Information Systems, 1(1), Article 8.
Gibson A and Bowling N. (2020). The Effects of Questionnaire Length and
Behavioral Consequences on Careless Responding. European Journal of
Psychological Assessment, 36(2), 410–420.
Hoti E. (2015). The technological, organizational and environmental framework of
IS innovation adoption in small and medium enterprises: evidence from research
over the last 10 years. International Journal of Business and Management, III(4), 1-
14.
Judd C and Kenny D. (1981). Process analysis: Estimating mediation in treatment
evaluations. Evaluation Review, 5, 602-619.
Karahanna E and Straub D. (1999). The psychological origins of perceived
usefulness and ease-of-use. Information and Management, 35, 237-250.
King W and He L. (2006). A meta-analysis of the technology acceptance model.
Information and Management, 43(6), 740-755.
Li / Journal of System and Management Sciences Vol. 10 (2020) No. 3, pp. 97-118
117
Koul S and Eydgahi A. (2017). A systematic review of technology adoption
frameworks and their applications. Journal of Technology Management &
Innovation, 12(4), 106-112.
Kuan K and Chau P. (2001). A perception-based model for EDI adoption in small
businesses using a technology-organization-environment framework. Information
and Management, 38, 507-521.
Legris P, Ingham J & Larsen K. (2003). Why do People Use Information
Technology? A Critical Review of the Technology Acceptance Model. Information
and Management, 40, 191-204.
Li J. (2020). Blockchain Technology Adoption: Examining the Fundamental
Drivers”, Proceedings of the 2020 2nd International Conference on Management
Science and Industrial Engineering, ACM Publication, 253–260.
Ma Q and Liu L. (2004). The technology acceptance model: a meta-analysis of
empirical findings. Journal of Organizational and End User Computing, 16(1), 59-
72.
Nunnaly, J. (1978). Psychometric Theory. New York: McGraw Hill.
Oliveira T and Martins M. (2010). Understanding e-business adoption across
industries in European countries. Industrial Management and Data Systems, 110(9),
1337-11354.
Oliveira T and Martins M. (2011). Literature Review of Information Technology
Adoption Models at Firm Level. The Electronic Journal Information Systems
Evaluation, 14(1), 110-121.
Rogers E. (1962). Diffusion of innovations. 1st Ed., Free Press of Glencoe, New
York.
Tornatzky L and Fleischer M. (1990). The processes of technological innovation.
Lexington, MA.
van Raaij E and Schepers J. (2008). The acceptance and use of a virtual learning
environment in China.Computers & Education, 50(3), 838–852.
Venkatesh V and Bala H. (2008). Technology Acceptance Model 3 and a Research
Agenda on Interventions. Decision Sciences, 39(2), 273–315.

Li / Journal of System and Management Sciences Vol. 10 (2020) No. 3, pp. 97-118
118
Venkatesh V and Davis F. (2000). A Theoretical Extension of the Technology
Acceptance Model: Four Longitudinal Field Studies. Management Science, 46(2),
186–204.
Venkatesh V, Morris M, Davis G & Davis F. (2003). User Acceptance of
Information Technology: Toward a Unified View. Management Information
Systems (MIS) Quarterly, 27(3), 425–478.
Venkatesh V, Thong J & Xu X. (2012). Consumer acceptance and use of
information technology: Extending the unified theory of acceptance and use of
technology. Management Information Systems (MIS) Quarterly, 36(1), 157–178.
Venkatesh V, Thong J & Xu X. (2016). Unified theory of acceptance and use of
technology: a synthesis and the road ahead. Journal of the Association for
Information Systems, 17(5), 328-376.
Yeh C, Lee G & Pai J. (2016). Using a technology-organization-environment
framework to investigate the factors influencing e-business information technology
capabilities. Information Development, 31(5), 435-450.
Yousafzai S, Foxall G, and Pallister J. (2007). Technology acceptance: a meta-
analysis of the TAM: Part 1”, Journal of Modelling in Management, 2(3), 252-280.
Yan T, Conrad F, Tourangeau R & Couper M. (2011). Should I Stay or Should I go:
The Effects of Progress Feedback, Promised Task Duration, and Length of
Questionnaire on Completing Web Surveys. International Journal of Public
Opinion Research, 23(2), 131-147.
Yu C and Tao Y. (2009). Understanding business-level innovation technology
adoption. Technovation, 29, 92-109,
Zhou Y. (2008). Voluntary adopters versus forced adopters: integrating the
diffusion of innovation theory and the technology acceptance model to study intra-
organization adoption. New Media & Society, 10(3), 475-496.