role of tropomyosin2 in cell proliferation and survival of...
TRANSCRIPT

UNIVERSIDADE DE LISBOA
FACULDADE DE CIÊNCIAS
DEPARTAMENTO DE BIOLOGIA ANIMAL
Role of Tropomyosin2 in cell proliferation and survival of
Drosophila melanogaster
Filipe Paulos e Cruz Oliveira Viegas
Mestrado em Biologia Evolutiva e do Desenvolvimento
Dissertação orientada por:
Doutora Florence Janody, IGC
Doutora Gabriela Rodrigues, FCUL
2016

I
Acknowledgements
The work before you would not be the same, or even exist, if not for several people. Though
many deserve my gratitude, I can only thank so many without making this too long.
First of all, I’d like to thank my supervisor, Florence. Thank you for this amazing opportunity.
I wholeheartedly thank you for accepting me in your laboratory and providing me with this enticing and
really cool work. Thank you for your patience and perseverance, they did not go unnoticed. Most of all,
thank you for teaching me so much.
I’d also like to thank the members of the Actin dynamics Lab that accompanied me throughout
this journey: Catarina, Sandra, Prachii, Margarida and Clara. Your help and friendship was crucial to
my work and learning process. I’m very grateful.
To Sónia, Liliana, Pedro and Gaston: you may not realize it, but you helped. A lot. I can’t thank
you enough for your support and companionship.
To Nuno and Ania. Without you, I’d still be struggling with the microscopes. Thank you so
much for your help.
To Professor Gabriela. For accepting me as her external student but most of all for being a
wonderful and inspiring teacher throughout my Biology course and masters. You are part of the reason
I love developmental biology and for that, I can’t thank you enough.
The other part responsible for my love of developmental biology would be Professor Solveig.
From the first few lessons of animal developmental biology, I knew exactly what I wanted to dedicate
my career to. It wasn’t just that development is really, really cool and fascinating. It was the way you
taught it. Thank you.
To my family and closest friends. Thank you for your support, it’s what got me through this
journey with my sanity (somewhat) intact. I’m sorry for neglecting you while writing this.
Last of all, Ana. Without you none of this would be possible. Thank you for everything.

II
Abstract
The Actin cytoskeleton is a vital cell component that controls a large number of cellular
processes, including cell shape, mobility and intracellular transport. The cytoskeleton also transmits
external forces into signaling activity, such as Hippo pathway signaling, which controls tissue growth
and cell fate decision during development and adult homeostasis. Tropomyosins belong to a highly
conserved and diverse family of actin-binding proteins (ABPs), which stabilize and regulate the
functional diversity of actin filaments, by mediating their interaction with other ABPs Additionally,
Tropomyosins contribute to tumorigenesis, though the mechanisms remain unclear. In our lab,
Tropomyosin2 (tm2) was identified as an ABP that seems to restrict Drosophila wing imaginal disc
growth. This presented the opportunity to further investigate if tm2 restricts wing disc growth and to
identify if the underlying mechanism could be Hippo pathway activity regulation. tm2 downregulation
promotes larval wing disc and adult wing overgrowth. The solicited overgrowth displayed phenotypic
variability, from no apparent overgrowth to heavily affected tissue size and morphology. The effect of
tm2 downregulation on F-actin levels also seems to be linked to this phenotypic penetrance effect as
discs with no overgrowth appeared to have less actin while those with overgrowth had F-actin
accumulation. Moreover, when tm2 downregulation induced tissue overgrowth, there is upregulation of
Hippo target genes. Taken together, these observations suggest that tm2 could be necessary to prevent
wing disc overgrowth by regulating F-actin levels and Hippo pathway activity. In Drosophila,
Tropomyosin had yet to be linked to tissue growth, which suggests a novel regulatory function of tm2
in vivo and while the actin cytoskeleton is known to regulate Hippo pathway activity, this work present
novel evidences for a possible role of Tropomyosins intervening in this regulation. Finally, I hypothesize
that tm2 could be necessary to translate external cues, such as mechanical force, into wing disc growth
termination by triggering Hippo pathway activity.
Key-words: Actin cytoskeleton; Hippo pathway; Tropomyosin; Growth control; Drosophila
melanogaster

III
Sumário
O citoesqueleto de actina é responsável por um grande número de processos celulares, tais como
a forma e a mobilidade celular, o transporte intracelular, a citocinese. Este também traduz forças
mecânicas exteriores à célula em sinalização bioquímica, modulando a expressão genética. O
citoesqueleto de actina é formado por filamentos de actina (F-actina) que por sua vez são compostos por
monómeros de actina globular (G-actina) e é a organização destes filamentos em arquiteturas
especializadas e distintas que definem as propriedades mecânicas destas. A organização e função de
diferentes arquiteturas de F-actina depende da interação e ligação destas com proteínas especializadas,
as actin binding proteins – ABPs que estão divididas em famílias consoante a sua função. Estas proteínas
ao interagirem com a F-actina, levam à formação de redes de F-actina distintas e especializadas. Uma
família particular de ABPs são as Tropomiosinas.
As Tropomiosinas são uma família conservada à qual é atribuída um papel fundamental na
regulação funcional de filamentos de actina em células musculares e não-musculares. As proteínas desta
família regulam uma larga variedade de funcionalidades do citoesqueleto ao recrutar, de modo
específico, outras ABPs para a F-actina. Os mamíferos possuem quatro genes de Tropomiosina – TPM1,
TPM2, TPM3 e TPM4 – que, dão origem a mais de 40 isoformas através de splicing alternativo, mas
apenas metade destas estão confirmadas. Estas isoformas são normalmente divididas em duas
categorias, segundo o seu peso molecular: as high molecular weight (HMW) e as low molecular weight
(LMW). A Drosophila melanogaster possui apenas dois genes de Tropomiosina – tm1 e tm2. A tm2 dá
origem à isoforma Tm2-A/B e à isoforma Tm2-C. Ao regular a funcionalidade do citoesqueleto, as
Tropomiosinas tornam-se essenciais ao correto funcionamento celular. A sua importância, leva a que as
Tropomiosinas estejam associadas a várias patologias humanas, uma das quais o cancro. Na verdade,
diversos estudos já correlacionaram alterações na expressão genética de Tropomiosinas com fenótipos
em células cancerígenas. Curiosamente, os mesmos estudos encontraram que existem isoformas
especificas que se encontram altamente expressas em células cancerígenas, enquanto outras isoformas
se encontram silenciadas.
Num estudo de microarray para ABPs desreguladas numa linha celular com transformação
induzível, bem como em amostras tumorais de pacientes humanos, o Laboratório Actin Dynamics
identificou que a TPM2 se encontrava sub-expressa em ambos os casos. Em Drosophila, a tm2 mostrou
ser necessária para prevenir o crescimento excessivo em discos imaginais de asa. Estas observações
sugerem que a tm2 pode ter um papel em restringir a proliferação celular, tal como acontece em
Tropomiosinas HMW humanas. Para além disso, a proliferação celular desregulada e excessiva é uma
das principais características em tumores.

IV
Um dos muitos papeis do citoesqueleto de actina passa por regular o crescimento de tecidos e
órgãos através da via de sinalização de supressão de tumores Hippo. Esta via de sinalização é constituída
por uma cascata de cinases composta por Hippo (Hpo), Salvador (Sav), Mob as Tumor Supressor (Mats)
e Warts (Wts). Hpo fosforila Wts, que por sua vez fosforila e inativa Yorkie (Yki). Yki é um cofator de
transcrição cuja atividade leva à expressão de genes de proliferação e anti-apoptose, levando assim ao
crescimento de tecidos e órgãos. Deste modo, quando a via de sinalização Hippo não está ativa, Yki está
no núcleo a promover a proliferação celular e a sobrevivência. Quando a via Hippo está ativa, Wts
fosforila Yki e impede este de entrar no núcleo e levar a expressão dos seus genes-alvo.
Visto que o citoesqueleto regula a atividade desta via de sinalização e que as Tropomiosinas
regulam a funcionalidade do citoesqueleto, existe a possibilidade de tm2 restrinja o crescimento de
tecidos por regular a atividade da via de sinalização Hippo. Assim, o presente estudo pretende validar o
papel da tm2 no crescimento de discos imaginais de asa de Drosophila tal como averiguar se a restrição
do crescimento se faz através da via de sinalização Hippo.
De modo a validar o papel que a tm2 tem em limitar o crescimento em discos imaginais de asa
e em asas adultas, foram utilizadas duas linhas de moscas com transgenes que expressam RNAi: a linha
tm2-IRJF01095 e a linha tm2-IRHMS02260. Os resultados parecem indicar que a sub-expressão de tm2 levou
a um aumento significativo no tamanho do domínio distal do disco de asa e de asas adultas.
Surpreendentemente, o crescimento excessivo em discos que sub-expressam tm2 não foi igual em todos
os discos, levantando assim a possibilidade da tm2 apenas contribuir para a restrição do crescimento no
fim do desenvolvimento do disco, quando este para de crescer. Assim, a tm2 restringe o crescimento
excessivo na asa. Adicionalmente, quando a sub-expressão de tm2 leva a crescimento excessivo, este é
acompanhado de um aumento nos níveis de F-actina, mas quando não há crescimento excessivo existe
um decréscimo nos níveis de F-actina. A sub-expressão de tm2 também levou ao aumento do nível de
expanded, four-jointed e Wingless, todos genes-alvo da atividade de Yki, indicando assim que tm2
contribui para limitar a expressão de alvos transcricionais de Yki.
Para além destes resultados, também foi feita uma comparação entre os genes de Tropomiosina
humanos e de Drosophila. Nesta análise foram comparados os exões codificantes de todos os genes
humanos (TPM1, TPM2, TPM3 e TPM4) com cada exão dos genes de Drosophila (tm1 e tm2). Esta
análise permitiu verificar que as isoformas de tm2 parecem ser mais comparáveis às Tropomiosinas
humanas HMW do que às LMW.
Estes resultados parecem sugerir que a tm2 pode ser responsável por restringir o crescimento
excessivo no disco de asa de Drosophila. Adicionalmente, parece também haver um efeito oposto no
que toca à regulação dos níveis de F-actina entre as duas isoformas da tm2, a Tm2-A/B e a Tm2-C. Este
efeito provavelmente é devido a uma regulação diferencial de ABPs e o facto de haver efeitos opostos
vai de encontro a estudos prévios que constataram que diferentes isoformas do mesmo gene de
Tropomiosina podem ter efeitos distintos na regulação de ABPs.

V
No entanto, é provável que o papel que a isoforma Tm2-A/B tem em prevenir a acumulação
excessiva de F-actina e em regular o crescimento da asa estejam ligados, o que vai de encontro com o
facto de que o citoesqueleto de actina regula a atividade da via de sinalização Hippo. Para além disso, a
Tm2-A/B parece ter um papel em regular a atividade transcricional de Yki.
Assim, uma rede de F-actina definida pela presença de Tm2-A/B poderá receber informação
exterior e levando à regulação da via de sinalização Hippo de modo a controlar a atividade transcricional
de Yki, parando assim o crescimento no fim do desenvolvimento do disco de asa de Drosophila. Tendo
em conta que um dos papeis centrais do citoesqueleto de actina é mediar e contribuir para a geração de
forças mecânicas no ambiente celular, estas mesmas forças poderão ser persentidas pela rede de F-actina
contendo Tm2-A/B e traduzidas em regulação da atividade da via de sinalização Hippo. Deste modo,
quando o disco imaginal da asa se encontra a desenvolver, esta rede de F-actina não afeta o crescimento
e a via de sinalização Hippo está inativa, permitindo assim que os tecidos cresçam. Mais tarde, à medida
que os tecidos crescem, existe uma acumulação de forças compressivas que são persentidas pela rede
de F-actina que contém Tm2-A/B, ativando assim a via de sinalização Hippo e consequente cessar do
crescimento.
Palavras-chave: Citoesqueleto de actina; Via de sinalização Hippo; Tropomiosina; Controlo de
crescimento; Drosophila melanogaster

VI
Table of Contents
Acknowledgments ............................................................................................ I
Abstract .......................................................................................................... II
Sumário .........................................................................................................III
I. Introduction .............................................................................................. 1
1. The Actin Cytoskeleton ............................................................................................. 1
1.1 Actin binding proteins drive F-actin dynamics ...............................................................1
2. Tropomyosin – Regulators of Actin Cytoskeletal Function ...................................... 2
2.1 Gene and protein structure ..............................................................................................2
2.2 Tropomyosins regulate F-actin dynamics .......................................................................4
2.3 Tropomyosins role in cell function...................................................................................5
3. Drosophila Wing Imaginal Disc – In vivo Epithelial Model to Study Growth ......... 6
4. Hippo Tumor Suppressor Pathway ............................................................................ 7
4.1 Regulation of Hippo signaling by F-actin dynamics .......................................................8
5. Linking Tropomyosins and Tumorigenesis ............................................................. 10
5.1 Human Tropomyosins in cancer ............................................................................. 10
5.2 Tropomyosin and tissue growth in Drosophila ........................................................ 10
6. Aims ......................................................................................................................... 12
II. Material and Methods ........................................................................... 13
1. Fly Strains and Genetics .......................................................................................... 13
1.1 The Gal4-UAS system .................................................................................................13
1.2 Fly husbandry, maintenance and stocks ......................................................................14
1.3 Crosses and stock generation ......................................................................................14
2. Immunohistochemistry ............................................................................................. 15
3. Image Acquisition and Analysis ............................................................................. 16
4. Quantification and Statistical Analysis ................................................................... 16
5. Tropomyosin Peptide Sequence Alignment and Analysis ...................................... 17
III. Results ..................................................................................................... 18
1. Two RNAi Fly Lines Target Distinct tropomyosin2 Isoform Subsets .................... 18
2. tropomyosin2 Limits Wing Overgrowth ................................................................. 19
2.1 tropomyisin2 prevents tissue overgrowth in the larval wing disc ................................19
2.2 tropomyosin2 restricts the size of adult wings .............................................................21

VII
3. tropomyosin2 limits the expression of Hippo pathway transcriptional targets ....... 22
3.1 expanded, wingless and four-jointed expression increase upon tropomyosin2
downregulation ..................................................................................................................................23
4. Apical F-actin Accumulation is Regulated by tropomyosin2 ................................. 25
5. tropomyosin2 Interacts with warts, an Upstream Regulator of Yorkie Activity ..... 27
5.1 tropomyosin2 interacts with warts, but not expanded in regulating adult wing size .....27
5.2 tropomyosin2 does not interact with expanded in regulating wing imaginal disc size .29
IV. Discussion ................................................................................................ 31
1. Tm2-A/B May be Responsible for Restricting Wing Disc Growth ...................... 31
2. Tm2-A/B and Tm2-C May Have Opposite Effects on F-actin Levels ................. 32
3. Tm2-A/B: a Link Between Mechanical Force and Growth .................................. 34
4. Drosophila as a Model in the Study of Tropomyosins in Cancer ......................... 38
5. Final Remarks ....................................................................................................... 39
V. Bibliography ........................................................................................... 40
Supplementary Information ........................................................................ 46

VIII
Figure Index
Figure 1 | Actin dynamics regulation by ABPs ......................................................................................1
Figure 2 | Mammalian TPM exon structure ............................................................................................3
Figure 3 | Exon structure of Drosophila Tropomyosin genes ................................................................4
Figure 4 | Expression domains of key morphogenetic molecules in Drosophila wing imaginal disc
during larval development .......................................................................................................................6
Figure 5 | Hippo pathway: similarities and differences between Drosophila and mammals .................8
Figure 6 | Actin cytoskeleton regulation of Hippo pathway in Drosophila ............................................9
Figure 7 | Tm2 downregulation results in a significant increase in size of the wing blade ..................11
Figure 8 | Cross schematic for stock establishment .............................................................................15
Figure 9 | Drosophila tm2 isoforms are differentially target by three RNAi constructs ......................18
Figure 10 – Depleting tm2 in Drosophila wing imaginal discs causes tissue overgrowth ...................20
Figure 11 – Depleting tm2 in the Drosophila wing imaginal discs increases adult wing size .............22
Figure 12 – tm2 depletion restricts the expression of a subset of Yki transcriptional targets ..............24
Figure 13 – Apical F-actin accumulation is affected upon tm2 depletion .............................................26
Figure 14 – Depleting tm2 in wts-overexpressing wings heavily affects wing morphology and size ...28
Figure 15 – Depleting tm2 has no effect on ex-induced growth suppression in the wing pouch ..........30
Figure 16 – Hippo pathway regulation by distinct F-actin networks ...................................................35
Figure 17 – Model of a Tm2-A/B-dependent F-actin network which translates forcer into Hippo
pathway activation, halting wing disc growth in late development of wing imaginal discs .................36
Table Index
Table 1 | Gal4 drivers, LacZ and UAS reporters used in this study .......................................................2

Role of Tropomyosin2 in cell proliferation and survival of Drosophila melanogaster
Page | 1
I Introduction
1. The Actin Cytoskeleton
The ability of animal cells to change their shape, move and divide allow them to adapt to their
environment. The mechanisms behind these structural changes rely on a complex network of protein
filaments in the cytoplasm, the actin cytoskeleton that organize into a wide range of complex
structures[1,2].
1.1 Actin binding proteins drive F-actin dynamics
In cells, actin exists in two forms: globular actin (G-actin) monomers and filamentous actin (F-
actin) polymers, assembled from G-actin monomers[1,3] . Actin cytoskeletal dynamics are established by
the homeostatic balance between these two forms, where ATP-bound G-actin is added to the fast-
growing barbed-end (+) of F-actin while ADP-bound G-actin dissociates from the slow-growing
pointed-end (-)[3,4]. This process, known as “treadmilling”, is spatiotemporally regulated by a plethora
of different actin-binding proteins (ABPs)[3,4] (Fig.1). By promoting and controlling F-actin nucleation,
dissociation, bundling and crosslinking, ABPs are crucial in determining architectures of functionally
distinct F-actin networks which make up essential cytoskeletal structures such as filopodia, lamellipodia,
stress fibers and the actin cortex[1,4] (Fig.1).
Figure 1 | Actin dynamics regulation by ABPs[5]

Filipe Viegas Master Thesis 2016
Page | 2
The assembly of F-actin networks relies mainly on nucleation and elongation factors, such as
Formins and the Arp2/3 complex[1,3]. Formins mediate the assembly of unbranched actin networks by
stabilizing an actin dimer polymerization nucleus and promoting its elongation at the barbed-end.
The Arp2/3 complex mediates the formation of branched actin networks[1,6,7]. When activated,
Arp2/3 nucleates new actin filaments by binding to the side of a pre-existing filament[6]. Capping Protein
(CP) forms a protein cap that arrests actin polymerization by preventing further addition and loss of
actin monomers[3].
The main contributors towards disassembly of F-actin networks are the ADF/Cofilin family of
ABPs[3,4,8]. ADF/Cofilin is a disassembly factor that uses fragmentation or severing to break down actin
organizations[1]. Therefore, ADF/Cofilin-mediated disassembly facilitates network turnover thus
contributing to higher-order structures like lamellipodia[1].
A special group of ABPs are the members of the myosin superfamily[4,9], which are molecular
motors responsible for global cell contraction and tension at focal adhesion sites. Myosins have also
been recently identified as F-actin disassembly agents, where their contractile function causes filament
buckling and fragmentation[1].
The above-mentioned ABPs are some of the most studied for proper cytoskeleton architecture.
One of the ABP families that was not mentioned above is the Tropomyosin family, pervasive in actin
cytoskeletal function[10-12].
2. Tropomyosin – Regulators of Actin Cytoskeletal Function
Tropomyosins are conserved ABPs that were first described as regulators of skeletal muscle
contraction[13] and for a long time they were thought to only exist associated to the contractile apparatus
in muscle cells. However, Tropomyosins were recently described as having a key role in regulating the
function of actin filaments in both muscle and non-muscle cells[14,15]. In fact, more complex roles for
Tropomyosins in non-muscle cells have recently emerged, demonstrating that Tropomyosins regulate a
wide range of cytoskeletal functions by differentially recruiting other ABPs on F-actin. Still, the precise
roles of Tropomyosin in non-muscle cells are far from resolved[11,12].
2.1 Gene and protein structure
Mammals have four Tropomyosin genes – TPM1, TPM2, TPM3, TPM4[11,16]. Mainly through
the use of alternative splicing, each gene gives rise to a variable number of isoforms, expressed in both
muscle and non-muscle cells, with over 20 Tropomyosin isoforms identified by RT-PCR. However, the
existence of only half these isoforms have been confirmed at the protein level or with Northern blots[16].

Role of Tropomyosin2 in cell proliferation and survival of Drosophila melanogaster
Page | 3
Exon organization of the four mammalian Tropomyosin genes is extremely similar, as is their
sequence homology[16,17]. Exons 3,4,5,7 and 8 have a high degree of sequence conservation and are
present in all mammalian isoforms (Fig.2) while exons 1a/1b, 2a/2b, 6a/6b, 9a/9b/9c/9d have a much
lower degree of conservation among the different TPM genes. The presence of exons 1a/1b, 2a/2b,
6a/6b, 9a/9b/9c/9d is the source of isoform variability and their lower sequence conservation is the main
source of divergence between isoforms from different genes[18-20] (Fig.2). The isoforms generated this
way are usually classified by their molecular weight as either low molecular weight (LMW) or high
molecular weight (HMW)[11]. LMW isoforms are approximately 248 amino acids in length and their N-
termini contains exon 1b but not 2a or 2b, while HMW isoforms have an approximate length of 284
amino acids. and their N-termini contains exon 1a and either 2a or 2b[11,18].
Figure 2 | Mammalian TPM exon structure[11,18]
Black – exons present in all isoforms of all genes. Colored – alternatively spliced exons.

Filipe Viegas Master Thesis 2016
Page | 4
While not as extensively studied as mammalian Tropomyosins, there has been a recent surge of
studies concerning cytoskeletal Tropomyosin function in the fruit fly[20-24]. Unlike mammals, Drosophila
melanogaster has two Tropomyosin genes – tm1 and tm2 and bioinformatics analyses predict 17
isoforms for tm1 and 6 isoforms for tm2[25,26]. tm2 has 4 coding exons, which give rise to six splice
variants that vary in 5’ and 3’ UTR as well as in coding exon composition in the case of splice variant
C (Fig.3). However, these six splice variants give rise to only two different proteins – splice variants A,
B, E, F and G all give rise to isoform Tm2-A/B and splice variant C gives rise to isoform Tm2-C. Both
isoforms differ only in the use of exon 3 or 4 – Tm2-A/B uses exons 1,2 and 4 while Tm2-C uses exons
1,2,3 (Fig.3).
2.2 Tropomyosins regulate F-actin dynamics
Tropomyosin proteins form coiled-coil dimers linked end-to-end, which polymerize along the
major grove of F-actin, cooperatively associating with actin[27]. In spite of this, individual interactions
between tropomyosin molecules and F-actin are very weak[28,29].
Tropomyosins have been proposed to regulate actin dynamics by mediating the interaction of
F-actin with ABPs, including the Arp2/3 complex, Formins, ADF/Cofilin, Myosin II, among others[11,30].
Several studies have reported Tropomyosins as inhibitors of Arp2/3-mediated actin
nucleation[31-33]. Actin filaments decorated by HMW Tpm1.1 and Tmp1.7 exclude Arp2/3while HMW
Tpm1.6 and LMW Tpm1.8 reduce the branching properties of Arp2/3[31,33]. In a recent study, two LMW
Tpm isoforms (1.8 and 1.9) were also shown to exclude Arp2/3 nucleation, though they were also
excluded from populating Arp2/3-branched actin networks[34].
Figure 3 | Exon structure of Drosophila Tropomyosin genes
A-G – Predicted splice variants of Drosophila tm2. Grey – Untranslated regions (UTR). Colored – Coding exons.

Role of Tropomyosin2 in cell proliferation and survival of Drosophila melanogaster
Page | 5
Formins have also been shown to interact with Tropomyosins[30]. In vitro, mammalian Tpm1.8
activates formin-mediated elongation while Tpm1.6 does so to a lesser extent[35]. Formins also recruit
Tpm4.2 to actin filament arcs in osteosarcoma cells[36] and in budding yeast, which has only two
tropomyosins (Tpm1p and Tm2p), Formin-nucleated F-actin recruits both Tropomyosins, thus enabling
rapid filament elongation[37].
Tropomyosin has contrasting, isoform-specific effects on ADF/cofilin-mediated actin filament
disassembly[11,12]. The stabilizing effects of Tropomyosins on filaments have been shown to protect
against the effects of ADF/Cofilin as both proteins compete for binding on actin[11]. Thus, mammalian
Tpm3.1 and C. elegans Tropomyosins (CeTMI, II, III, IV) have an antagonistic relationship with
ADF/Cofilin in regulating F-actin dynamics[38]. In contrast, Tpm1.12, Tpm1.7, Tpm2.1 and Tpm4.2
have been reported to actively recruit ADF/Cofilin[11,30].
Finally, Tropomyosin regulation of Myosin activity has been extensively studied and more
recently, Tropomyosins have been shown to have an isoform-specific impact on the activity and location
of Myosins in many studies and organisms[11,12,30]. For example, in budding yeast one Tropomyosin
(Tpm2p) prevents Myosin1p activity while the other (Tpm1p) promotes MyosinV activity[12]. In another
case, Tpm3.1 recruits MyosinIIA but excludes Myosin1c from binding to F-actin in mouse
adipocytes[12]. While not mentioned in detail, other ABPs such as Gelsolin, Tropomodulin, Caldesmon
and Drebrin, are also regulated by Tropomyosin[11,30,39].
By regulating the activity of specific ABPs, Tropomyosins contribute towards the construction
and maintenance of fundamental cytoskeletal structures [11,12,20].
2.3 Tropomyosins role in cell function
A significant body of work has established that Tropomyosins are vital for normal cell
function[11,12]. Owing to a precise temporal expression and spatial distribution of Tropomyosin[11], they
contribute to a wide variety of critical processes in the organism, including embryogenesis,
morphogenesis, cell trafficking, glucose metabolism, cell biomechanics and muscle function[12].
Given the importance of Tropomyosins in cytoskeletal function and their contribution to major
cell functions, Tropomyosins have been associated with human disease, from neuropathologies like
Alzheimer’s disease to cardiac and skeletal muscle diseases[11]. In addition, Tropomyosins have been
directly and intimately linked to cancer progression[11,40,41].

Filipe Viegas Master Thesis 2016
Page | 6
3. Drosophila Wing Imaginal Disc – In vivo Epithelial Model to Study
Growth
Drosophila melanogaster is one of the most used model organisms worldwide. Drosophila life-
cycle consists of an embryonic stage, after which there are three larval stages L1, L2 and L3 followed
by pupa formation, form which fully-formed adults emerge[42].
Imaginal discs are precursor epithelial tissues that develop during the larval stages and
ultimately give rise to major adult structures such as legs, eyes or wings[43]. The wing imaginal disc is a
bi-layered epithelial tissue consisting of a columnar monolayer epithelium with a characteristic apical-
basolateral architecture[44], covered by a thin outer layer of squamous epithelium called the peripodial
membrane[44].
The adult Drosophila wing stems from the wing imaginal disc, which contains about 40 cells in
L1 larvae[44]. Until the final larval stage, cell divisions occur all over the wing disc and in the final larval
stages, there are areas with different patterns of cell growth and division[44].
Throughout this process, wing discs proliferate to a final size of approximately 50,000 cells[43,44].
The size and shape of the adult wing is therefore predetermined by the patterns of cell growth, division
and death in the disc[45].
In early larval stages, discs are subdivided into spatially distinct compartments where
developmental signaling takes place[43,44]. This compartmentalized expression of patterning-genes
makes the wing disc an appealing model to carry out gene-function assays. Thus, genes such as engrailed
(en), hedgehog (hh), wingless (wg) and apterous (ap) (Fig.4) – which play key roles in Anterior-
Posterior and Dorsal-Ventral patterning – are commonly used to drive gene expression using the Gal4-
UAS system [43].
Figure 4 | Expression domains of key morphogenetic molecules in Drosophila wing imaginal disc during
larval development[44]

Role of Tropomyosin2 in cell proliferation and survival of Drosophila melanogaster
Page | 7
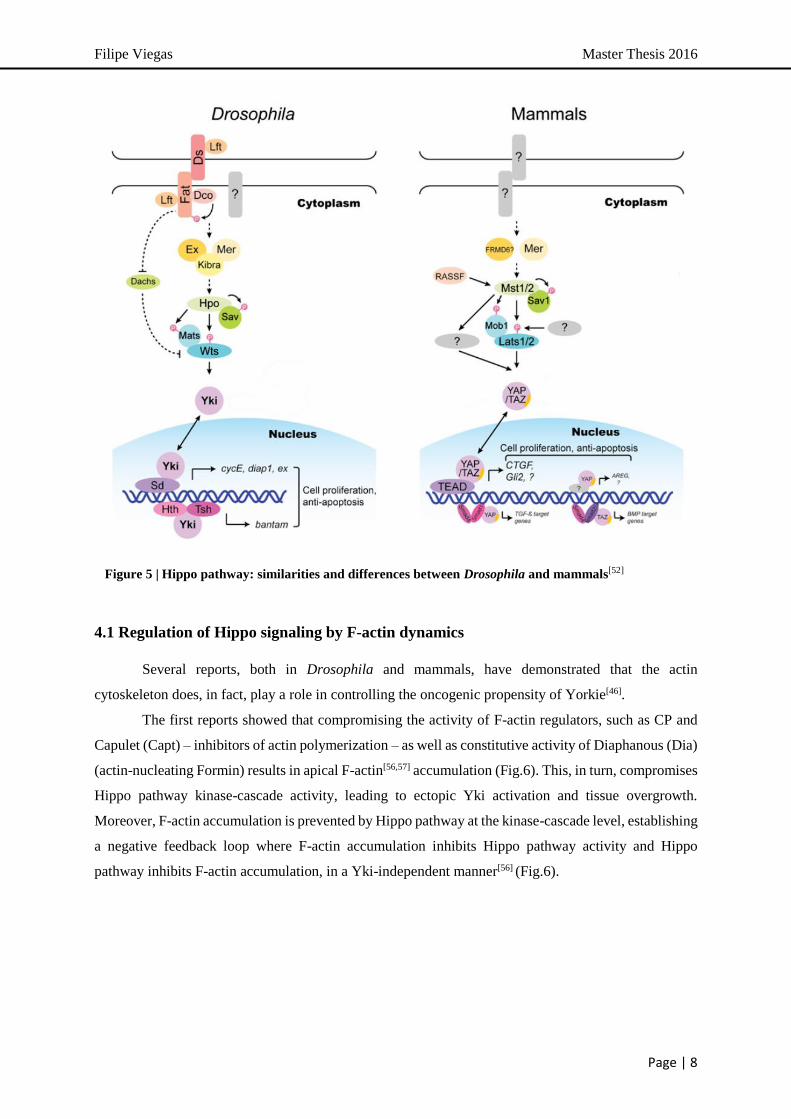
4. Hippo Tumor Suppressor Pathway
The Hippo tumor suppressor pathway is a conserved regulator of organ size discovered in
Drosophila[46-49]. The central component of this pathway is a kinase cascade composed by 4 tumor
suppressors – Hippo (Hpo), Salvador (Sav), Warts (Wts) and Mob as Tumor Suppressor (Mats) – where
the Hpo-Sav complex phosphorylates and activates the Wts-Mats kinase complex[46] (Fig.5). The
downstream effectors of this kinase cascade is Yorkie (Yki), a transcriptional co-activator. When Hippo
pathway is active, Wts directly phosphorylates and inactivates Yki. Being a transcriptional co-activator,
Yki binds to transcription factors, such as Scalloped, to drive the expression of genes with roles in cell
proliferation and survival[47,49]. Yki has been shown to function as an oncogene and its overexpression
leads to over-proliferation and prevents cell death, thus phenocopying loss of Hippo signaling[47] (Fig.5).
Upstream regulation of Hpo kinase cascade activity is mainly directed by an apical complex
consisting of Expanded (Ex), Merlin (Mer) and Kirba[47,48] (Fig.5). Independently from Mer and Kirba,
Ex has been shown to regulate Yki activity independently of Hpo kinase cascade function, by directly
binding and sequestering Yki in the cytoplasm[46]. Other upstream regulators are still emerging, such as
the transmembrane protein Fat – an atypical cadherin involved in planar cell polarity (PCP) – which
feeds into Hpo upstream regulation by localizing Ex[47] (Fig.5).
Mammals have two Hpo homologs (Mst1 and Mst2), one Sav homolog (Sav1), two Wts
homologs (Lats1 and Lats2) and two Mats homologs (MOBKL1A and MOBKL1B). These proteins
form a conserved kinase cassette that phosphorylates and inactivates the mammalian Yki homologs,
YAP and TAZ[47,49] (Fig.5). There also appear to be tissue-specific requirements for pathway
components, as YAP phosphorylation requires Mst1/2 in mouse liver but not in mouse embryonic
fibroblasts[50].
Another particular aspect of the mammalian Hippo kinase cascade concerns the mechanism of
YAP/TAZ inactivation. YAP nuclear-cytoplasmic translocation is seen as a major mechanism of YAP
inactivation, though a recent report described an additional mode of regulation in which Lats1/2 primes
YAP for subsequent degradation[51]. This mechanism is not conserved in Yki, revealing an important
divergence between Drosophila and mammals[47]. Moreover, YAP/TAZ have more DNA-binding TF
partners than Yki. Among these however, the TEAD/TEF TF family, homologs of Drosophila Sd
protein, have emerged as the prime mediators of both YAP and TAZ function in Hippo signaling[47,48].
A remarkable feature of Hippo signaling is the fact it integrates growth control signals such as
cell polarity, adhesion and contact, as well as mechanical forces have also been shown to affect Hippo
signaling[49,53-55]. In fact, the actin cytoskeleton has been proposed as the link between mechanical force
and Hippo pathway activity and the actin cytoskeleton is poised as a de facto regulator of Hippo pathway
activity[54,55].
Filipe Viegas Master Thesis 2016
Page | 8
4.1 Regulation of Hippo signaling by F-actin dynamics
Several reports, both in Drosophila and mammals, have demonstrated that the actin
cytoskeleton does, in fact, play a role in controlling the oncogenic propensity of Yorkie[46].
The first reports showed that compromising the activity of F-actin regulators, such as CP and
Capulet (Capt) – inhibitors of actin polymerization – as well as constitutive activity of Diaphanous (Dia)
(actin-nucleating Formin) results in apical F-actin[56,57] accumulation (Fig.6). This, in turn, compromises
Hippo pathway kinase-cascade activity, leading to ectopic Yki activation and tissue overgrowth.
Moreover, F-actin accumulation is prevented by Hippo pathway at the kinase-cascade level, establishing
a negative feedback loop where F-actin accumulation inhibits Hippo pathway activity and Hippo
pathway inhibits F-actin accumulation, in a Yki-independent manner[56] (Fig.6).
Figure 5 | Hippo pathway: similarities and differences between Drosophila and mammals[52]

Role of Tropomyosin2 in cell proliferation and survival of Drosophila melanogaster
Page | 9
Another study shows that ABP Zyxin (Zyx) is directly involved in growth control by
establishing a link between F-actin polymerization and Yki activity[58]. Zyx was shown to regulate Yki
activity by antagonizing the effect Ex has on growth through F-actin accumulation, independently of
Hippo kinase cascade activity (Fig.6). Another study in Drosophila has cytoskeletal tension modulate
Yki activity by affecting MyoII activity[59].
Several studies in human cells have also linked F-actin dynamics to YAP/TAZ activity[49,53,54].
These studies generally report that an increase in F-actin seems to activate YAP/TAZ while destabilizing
F-actin inhibits YAP/TAZ[49].
All together, these studies argue that different F-actin networks may translate upstream
signaling and environmental cues into Hippo activity modulation, thereby regulating proliferation and
cell survival.
Figure 6 | Actin cytoskeleton regulation of Hippo pathway in Drosophila
Orange Box - Zyx promotes growth by antagonizing Ex-mediated F-actin regulation. Blue box - Actin
filament networks where CP and Capt prevents and Dia promotes F-actin accumulation; Beige box –
Simplified Hippo pathway schematic.

Filipe Viegas Master Thesis 2016
Page | 10
5. Linking Tropomyosins and Tumorigenesis
5.1 Human Tropomyosins in cancer
Cancer cells show compromised developmental and genetic programs. These cells acquire a
variety of alterations that allow them to sustain proliferative signaling, evade growth suppressors,
activate invasion and metastasis, enable replicative immortality, induce angiogenesis and resist cell
death[40,41,60].
Altered Tropomyosin expression profiles in transformed states have been observed in vitro and
in vivo, where the expression of HMW Tropomyosin isoforms – Tpm1.4, Tpm1.6, Tpm1.7 and Tpm2.1
– is decreased[40]. HMW Tropomyosin downregulation has been observed in cells transformed with a
wide variety of carcinogens and oncogenes[61] and in vivo, as tumor samples from breast, urinary bladder,
central nervous system and colon have also shown a decrease in HMW Tropomyosin expression[40]. The
loss of HMW Tropomyosins in transformed cells is thought to contribute to the improper assembly of
microfilaments and adhesive structures, thereby contributing to the invasive and metastatic properties
of cancer cells[40]. In addition, Tropomyosins are known to play a role in several cancer-associated cell
phenotypes, such as anchorage-independent growth, apoptosis, cell division, migration and invasion[41].
The role Tropomyosin isoforms play in transformation is isoform specific, given that some
isoforms can prevent transformation while others have the opposite effect[12,40,61]. More specifically,
HMW Tmp2.1 and Tmp1.6 have been widely described as tumor suppressors[11,40,61]. Their expression
is downregulated in transformed cells and tumor samples, as stated above, while restoring their
expression prevented anchorage-independent growth, restored stress fiber formation and reduced cell
motility – characteristics intimately tied with cell transformation[62,63].
On the other hand, Tmp3.1 expression is increased in all cancer cells of a large range of
transformed cell lines, cultured cancer cells and patient tumor material[12,61] and contributes towards
transformation and cell-motility. A recent report confirmed Tpm3.1 regulates cell proliferation and is
requires for survival of neuroblastoma cells[61,64].
5.2 Tropomyosin and tissue growth in Drosophila
The study of Tropomyosins in Drosophila has mostly focused on the role this family of ABPs
has in muscle contraction. Recently however, there have been a few studies concerning Drosophila
Tropomyosins regarding their function in processes relevant to cancer[21,23,34].
Both tm1 and tm2 were seen to contribute in regulating chromosomal stability and nuclear
integrity[21]. In a different study[23], a specific tm1 isoform – Tm1-J – was found to localize to the mitotic
spindle and promote proper chromosome segregation.

Role of Tropomyosin2 in cell proliferation and survival of Drosophila melanogaster
Page | 11
Another tm1 isoform – Tm1-A – as well as Tm2-A/B (tm2 isoform) were found surrounding the
Golgi complex, where these isoforms influence cell-cycle progression. Genomic instability and cell-
cycle misregulation are considered a key step in tumorigenesis and are considered characteristic of the
cancer state[60]. Tm1-A has also been described to dynamically establish the border between the
lamellipod and the lamellum in the leading edge of cells[34], structures which contribute to an invasive
and metastatic cell state, common in transformed cells[1]. In spite of these observations and the
impressive body of knowledge on Tropomyosins in cancer, further studies are still required to determine
the mechanisms by which Tropomyosins differentially contribute to the transformed phenotype[40].
In a microarray screen for ABPs misregulated in pre-invasive Ductal Carcinoma in situ (DCIS)
human tumor samples and in a Tamoxifen-induced MCF10A-ER-Src cell line, which recapitulates the
multistep nature of breast cancer, the Actin Dynamics lab identified TPM2, which was downregulated
in both cases. Strikingly, Drosophila tm2 appeared to restrict growth of the distal part of the wing
imaginal disc, as expressing a RNAi construct that target tm2 to degradation, using the nubbin-Gal4
driver (nub-Gal4) that target gene expression in the distal wing imaginal disc domain[65] led to tissue
overgrowth (Fig.7). Thus, these observations point towards a role of tm2 in restricting proliferation, a
feature shared with tumors[60].
Figure 7 | Tm2 downregulation results in a significant increase in size of the wing blade
A – Standard confocal projections of wing imaginal discs from 3rd instar Drosophila larvae where nub-Gal4
is driving UAS-GFP (i), UAS-GFP and UAS-tm2-IRKK (ii); nub-expressing domain is marked by GFP
expression (green) and F-actin is marked by TRITC-conjugated Phalloidin (magenta). B– Scatterplot of the
ratio between the nub-expressing domain (GFP) and total disc area (Phalloidin) for each condition; horizontal
bars represent mean value and SD; ****-p<0.0001;
B
Win
g b
lad
e A
rea/T
ota
l w
ing A
rea
A
**** i
ii

Filipe Viegas Master Thesis 2016
Page | 12
6. Aims
While it has been known for decades that Tropomyosins are linked to cancer states, where most
studies show a causal relationship between a differential Tropomyosin expression and transformation,
there is still much work to be done as to the mechanism behind Tropomyosins effect on carcinogenic
transformation.
My study aims to investigate whether a Tropomyosin, Drosophila Tm2, affects tissue
overgrowth and to uncover a possible underlying mechanism – Hippo tumor suppressor pathway.
Using Drosophila wing imaginal discs of 3rd instar larvae, I sought to: validate the role of Tm2
on tissue growth using independent double-strand RNA interference constructs (tm2-IR), targeting tm2
to degradation (i); see if this role is isoform-specific (ii); investigate the effects of tm2 on F-actin levels
(iii); determine if Tm2 regulates Yki activity by analyzing the effect of tm2 depletion on the expression
of Yki target genes and by investigating genetic interactions between Tm2 and Hippo pathway
components (iv); Finally, compare Drosophila and human Tropomyosin exon structures in an attempt
to gain insight into any functional equivalence between them (v).

Role of Tropomyosin2 in cell proliferation and survival of Drosophila melanogaster
Page | 13
II Material and Methods
1. Fly Strains and Genetics
1.1 The Gal4-UAS system
The Gal4-UAS system is a binary transcriptional activation system native to yeast, which has
been adapted to drive targeted gene expression in Drosophila[66]. This system consists of a
transcriptional activator – Gal4 – that selectively activates any gene coding sequence (cds) that has been
cloned downstream of an upstream activating system – UAS – sequence[67]. Gal4 does so according to
the characteristics of its promotor or enhancer and thus several enhancer sequences have been “trapped”
by the Gal4 gene to confer the tissue/time/position specificity of a particular enhancer[67]. As it is a
binary system, the Gal4-driver component is usually physically separated from the UAS-cds in two
distinct fly lines to avoid expression leakiness – the target gene associated with UAS is silent in the
absence of its activator[66]. This allows for the easy and indefinite maintenance of both driver and
reporter stocks and one driver line can be used to drive an immensity of different UAS reporter
constructs widely available to the Drosophila community[66]. The different drivers and reporters used in
this study are briefly explained in Table 1.
Table 1 | Gal4 drivers, LacZ and UAS reporters used in this study.

Filipe Viegas Master Thesis 2016
Page | 14
1.2 Fly husbandry, maintenance and stocks
Fly stocks used in this study were maintained at RT (22-23ºC), according to standard
conditions[74]. Fly line crosses were performed at 25ºC in small vials containing a yeast-glucose-agar
medium with six female (F) and three male (M) flies (2:1 F/M ratio). All fly lines used in this study are
in Table S1.
1.3 Crosses and stock generation
Several crosses were performed to answer specific questions.
To analyze the effect of downregulating tm2 in the distal wing disc had on wing pouch and adult
wing size, the following crosses were performed:
[ w- ; nub-Gal4 ; UAS-GFP ] X [ w- ; ; ]
[ w- ; nub-Gal4 ; UAS-GFP ] X [ w- ; UAS-tm2-IRKK ]
[ w- ; nub-Gal4 ; UAS-GFP ] X [ y- v- ; ; UAS-tm2-IRJF ]
[ w- ; nub-Gal4 ; UAS-GFP ] X [ y- v- ; ; UAS-tm2-IRHMS ]
To analyze the effect of systemic tm2 downregulation, the following crosses were performed:
[ w- ; ; tub-Gal4/TM6B ] X [ w- ; UAS-tm2-IRKK ]
[ w- ; ; tub-Gal4/TM6B ] X [ y- v- ; ; UAS-tm2-IRJF ]
[ w- ; ; tub-Gal4/TM6B ] X [ y- v- ; ; UAS-tm2-IRHMS ]
To investigate if tm2 downregulation had an effect on Yki transcriptional targets, the following
crosses were performed:
[ w- ; ap-Gal4, ex-LacZ/CyO ] X [ y- v- ; ; UAS-tm2-IRJF ]
[ w- ; ex-LacZ/CyO, wg-LacZ ; hh-Gal4, UAS-GFP/TM6B ] X [ y- v- ; ; UAS-tm2-IRJF ]
[ w- ; fj-LacZ/CyO, wg-LacZ ; hh-Gal4, UAS-GFP/TM6B ] X [ y- v- ; ; UAS-tm2-IRJF ]
[ w- ; shg-LacZ/CyO, wg-LacZ ; hh-Gal4, UAS-GFP/TM6B ] X [ y- v- ; ; UAS-tm2-IRJF ]
To examine the effect tm2 downregulation on F-actin levels, the following cross was performed:
[ w- ; ; hh-Gal4, UAS-GFP/TM6B ] X [ y- v- ; ; UAS-tm2-IRJF ]
To study the genetic interaction between tm2 and upstream regulators of Yki transcriptional
activity, the following crosses were performed:
[ w- ; nub-Gal4, UAS-ex ] X [ y- v- ; ; UAS-tm2-IRJF ]
[ w- ; nub-Gal4, UAS-ex ] X [ w- ; UAS-mCherry ]
[ w- ; nub-Gal4, UAS-ex ] X [ w- ; UAS-RFP/CyO ; UAS-tm2-IRJF/TM6B ]
[ w- ; nub-Gal4,UAS-wts::Myc/CyO ] X [ y- v- ; ; UAS-tm2-IRJF ]
[ w- ; nub-Gal4,UAS-wts::Myc/CyO ] X [ w- ; UAS-mCherry ]

Role of Tropomyosin2 in cell proliferation and survival of Drosophila melanogaster
Page | 15
In order to measure the fluorescent area of the distal wing disc domain where both ex and tm2-
IRJF are ectopically expressed, the [ w- ; UAS-RFP/CyO ; UAS-tm2-IRJF/TM6B ] stock was generated
(Fig.8). First, [ w- ; IF/CyO ; MKRS/TM6B ] flies were crossed with [ y- v- ; ; UAS-tm2-IRJF01095 ] flies
(Fig.8 green box). Resulting F1 [ w- ; IF/+ ; UAS-tm2-IRJF01095/TM6B ] and [ w- ; +/CyO ; UAS-tm2-
IRJF01095/TM6B ] progeny were crossed (Fig.8 blue box) to establish the [ w- ; IF/CyO ; UAS-tm2-
IRJF/TM6B ] stock (Fig.8 red box). Finally, [ w- ; IF/CyO ; UAS-tm2-IRJF/TM6B ] flies were crossed
with [ w- ; UAS-RFP/CyO ; MKRS/TM6B ] (Fig.8 yellow box) and the resulting F1 [ w- ; UAS-
RFP/CyO ; UAS-tm2-IRJF/TM6B ] progeny was used to establish a stock (Fig.8 orange box).
2. Immunohistochemistry
Third instar larvae were dissected in phosphate buffer solution and fixed in 4% formaldehyde
in PEM (0.1M PIPES pH7,0; 2mM MgSO4; 1mM EGTA) solution for 30 minutes on ice followed by a
15-minute wash in phosphate buffer + 0,2% Triton X-100 (PBT) on ice. From this point, dissected larvae
were maintained in the dark. Larval remains were then left to incubate with primary antibodies in PBT
and 10% donkey serum O/N at 4ºC. The following day larval remains were washed in PBT (three times,
10 minutes each) and incubated with secondary antibodies in PBT and 10% donkey serum for two hours
at 4oC. Afterwards, imaginal discs were extracted from remains and mounted between slide and
coverslip in 80% Glycerol.
Figure 8 | Cross schematic for stock establishment

Filipe Viegas Master Thesis 2016
Page | 16
Primary antibodies: mouse α-Wg (1:10, 4D4 DSHB), mouse α-β-Galactosidase (1:200, Z378B
Promega), rabbit α-β-Galactosidase (1:1000, 55976, Cappel).
Secondary antibodies: α-mouse (TRITC, 1:200, Jackson Immunoresearch; Alexa 647,
1:1000), α-rabbit (FITC, 1:200, Jackson Immunoresearch).
For fluorophore-conjugated Phalloidin staining, the above protocol was followed until fixation.
Then, larval remains were incubated with either TRITC-Phalloidin (1:200, Sigma) or FITC-Phalloidin
(1:50, Sigma) in PBT and 10% donkey serum for two hours at 4oC. After washing in PBT (three times
for 10 minutes each) wing discs were mounted in 80% Glycerol. When Phalloidin staining was coupled
to immunohistochemistry, fluorophore-conjugated Phalloidin was incubated with the secondary
antibodies.
3. Image Acquisition and Analysis
Confocal Z-series fluorescent images of wing imaginal discs were acquired using a confocal
microscope (Leica SP5 confocal and Zeiss LSM 510 META) and low-magnification images of adult
wings were acquired using a stereoscope (Leica Stereo LUMAR). Images were processed using FIJI
(NIH) software and Imaris 6.4 (Bitplane) software. Standard Z-projections and cross-sections were
selected and brightness and contrast was adjusted to enhance visual acuity of fluorescence.
4. Quantification and Statistical Analysis
Grayscale stereoscope images of isolated wings were processed in FIJI (NIH), where contrast
was enhanced and threshold was adjusted to accurately define the contour of adult wings. The wing
hinge was excluded from all measurements. The area of the wing contour was obtained using the
Measure feature.
For area measurements of 3rd instar wing imaginal discs, projections of confocal Z-series,
multichannel fluorescent images were also processed in FIJI.
For each channel, contrast was enhanced and threshold was adjusted to accurately define the
contour of the whole wing disc (Outlined with TRITC- or FITC-conjugated Phalloidin) or of the wing
pouch (nubbin domain marked by GFP/RFP/mCherry fluorescence). The area of the contours was
obtained using the measure feature and the ratio between them was calculated as the quotient of the area
of the wing pouch and the area of the whole wing disc (wing pouch/total wing disc area).
Unpaired Mann-Whitney test (nonparametric) was used to determine the statistical significance
of pairwise differences in adult wing area measurements as well as differences in the ratios between
wing pouch areas and total wing disc areas of wing imaginal discs. Statistical analysis and graph
production was accomplished using GraphPad Prism 6 software.

Role of Tropomyosin2 in cell proliferation and survival of Drosophila melanogaster
Page | 17
5. Tropomyosin Peptide Sequence Alignment and Analysis
Coding-exon amino acid sequences for all splice variants of tm1, tm2, TPM1, TPM2, TPM3
and TPM4 were obtained from Flybase (tm1 and tm2) or from GenBank (NCBI NIH) and aligned using
Protein BLAST. All exons from all TPMs were aligned against each individual tm exon. Exons were
considered similar if their alignment had a max score of 20 or greater and over 50% identity. However,
exons with a max score of at least 15 and at least 35% were also taken into account, though they were
considered marginally similar.

Filipe Viegas Master Thesis 2016
Page | 18
III Results
1. Two RNAi Fly Lines Target Distinct tropomyosin2 Isoform Subsets
Preliminary results from our laboratory suggest tm2 has a role in limiting tissue growth in
Drosophila wing discs. As such, I am interested in validating the growth-limiting effect of
downregulating tm2 in wing discs and investigating if this effect could stem from the interaction of Tm2
with Hippo pathway signaling activity.
In order to do this, three fly lines carrying independent RNAi constructs under the control of
UAS binding sites that target tm2 to degradation were used: VDRC dsRNAi KK111307 and TRiP
dsRNAi JF01095 and shRNAi HMS02260. The KK111307 and JF01095 constructs target the coding
region of an exon present in all 6 isoforms (Fig.9a). The HMS02260 shRNAi targets a subset of tm2
splice variants, allowing for greater isoform discrimination (Fig.9a).
Six splice variants have been predicted for tm2 (Fig.9a) which generate two different isoforms.
Splice variants tm2-A/B/E/F/G generate isoform Tm2-A/B while tm2-C generates isoform Tm2-C
(Fig.9b). From this point onwards, the tm2-IRJF01095 and the tm2-IRHMS02260 lines will be referred to as
tm2-IRJF and tm2-IRHMS, respectively.
a b
Figure 9 | Drosophila tm2 isoforms are differentially targeted by three RNAi constructs
a –tm2 exon composition and domains targeted by RNAi constructs; tm2 isoforms (A, B, C, E, F and G); coding
(green boxes) and non-coding (grey boxes) regions; represent non-coding regions; shaded colored boxes represent
target location of VDRC KK111307 (red), TRiP JF01095 (yellow) and HMS02260 (cyan) RNAi. b – tm2
transcripts for all isoforms. a.a - amino acid.

Role of Tropomyosin2 in cell proliferation and survival of Drosophila melanogaster
Page | 19
2. tropomyosin2 Limits Wing Overgrowth
Having verified that each fly line carries the UAS-tm2-IRJF and UAS-tm2-IRHMS transgene (S1.1
and 2.1), respectively, I next tested if driving their expression also induced overgrowth of the wing
imaginal disc, as previously observed using the UAS-tm2-IRKK line (Fig.7). To do so, I have analyzed
the impact of knocking down tm2 on both the size and morphology of the adult and larval wing tissues.
2.1 tropomyosin2 prevents tissue overgrowth in the larval wing disc
To assess the effect of tm2 knockdown on the size of the wing imaginal discs, flies carrying
either of the UAS-tm2-IR transgenes were crossed with flies carrying the nubbin-Gal4 (nub-Gal4)
driver, which drives gene expression in the distal wing disc epithelium[65], in addition to UAS-GFP.
Wing imaginal discs from the progeny were stained with Phalloidin, to mark F-actin. The size of the
distal wing disc expressing UAS-tm2-IR and UAS-GFP was then evaluated. As a control, I analyzed the
progeny from flies carrying nub-Gal4 and UAS-GFP crossed with white (w-) flies.
Wing discs expressing tm2-IRHMS (Fig.10b) showed no significant difference in size of the distal
wing disc size compared to control wing discs (Fig.10a,d). However, driving tm2-IRJF in the distal wing
disc (Fig.10c) led to a significant increase in the size of the GFP-expressing domain compared to both
control and tm2-IRHMS wing discs (Fig.10a-d). These discs displayed a range of phenotypical penetrance.
In some cases, wing discs presented an enlarged wing pouch where the typical epithelial morphology
was not affected by tissue folding (Fig.10e-g). In other discs, the structural integrity of the distal wing
disc was compromised, where the morphology of the wing disc was affected and overgrown tissue
formed folds (fig10h-j). Thus, knocking down tm2 using two independent RNAi (tm2-IRJF and tm2-
IRKK) induces overgrowth of the distal wing disc epithelium, suggesting that tm2 restricts growth of this
domain.

Filipe Viegas Master Thesis 2016
Page | 20
Figure 10 | Depleting tm2 in Drosophila wing imaginal discs causes tissue overgrowth
a-c and e-j – Standard confocal projections of wing imaginal discs from 3rd instar Drosophila larvae where
nub-Gal4 is driving UAS-GFP (a), UAS-GFP and UAS-tm2-IRHMS (b), UAS-GFP and UAS-tm2-IRJF (c, e-
j); nub-expressing domain is marked by GFP expression (f, i - white; a-c, g, j - green) and F-actin is marked
by TRITC-conjugated Phalloidin (e, h – white; a-c, g, j - magenta); green dotted lines outline the GFP+
domain; magenta dotted lines outline the total disc area, seen by Phalloidin staining. Scale bar=50µm (a-c) or
40µm (e-j). d – Scatterplot of the ratio between the nub-expressing domain (GFP) and total disc area
(Phalloidin) for each genotype: w- (● n=22), tm2-IRHMS (■ n=17) and tm2-IRJF (□ n=12); horizontal bars
represent mean value and SD; ****-p<0.0001; n.s – no significance.

Role of Tropomyosin2 in cell proliferation and survival of Drosophila melanogaster
Page | 21
2.2 tropomyosin2 restricts the size of adult wings
To determine if the overgrowth of wing discs knocked down for tm2 can also be observed at
adult stage, I analyzed the size of adult wings in flies expressing either of the UAS-tm2-IR transgenes,
together with UAS-GFP, under nub-Gal4 control. As in the previous section, these adult wings were
compared to those of control adult wing expressing only UAS-GFP under nub-Gal4 control. Consistent
with the observations I have reported in the wing imaginal disc (Fig.10), expressing tm2-IRHMS02260 did
not affect the size of the adult wing (Fig.11d,g), when compared to control wings (Fig.11a), while
expressing tm2-IRJF led to visibly and significantly larger wings compared to both control and tm2-
IRHMS wings (Fig.11a-g).
From the results above, tm2-IRHMS seems to have no effect on wing growth, though it might
have an effect if expressed ubiquitously under the control of α-tubulin, which encodes for a Tubulin that
constitutes microtubules essential in processes such as mitosis[75]. In that sense, the different tm2-IR
lines were driven by a tubulin-Gal4 (tub-Gal4) driver balanced with TM6B in the 3rd chromosome. The
presence of TM6B balancer is phenotypically characterized by shorter and fatter larvae (Tb). Thus,
larvae that did not have the tub-Gal4 driver did not express the UAS-tm2-IR construct and were Tb. If
systemic expression of a given tm2-IR is deleterious in embryonic or early larval stages, only Tb larvae
should be visible upon 3rd instar stage. Otherwise, both non-Tb and Tb larvae should be visible.
Expressing UAS-tm2-IRKK and UAS-tm2-IRJF under the control of tub-Gal4 proved to be lethal, as all
3rd instar larvae were not Tb (Fig.11h). However, expressing UAS-tm2-IRHMS under the control of tub-
Gal4 had no effect on the survival of larvae as both non-Tb and Tb larvae reached 3rd instar stage
(Fig.11h).
These results seem to suggest that not all tm2 isoforms contribute in regulating adult wing size
and that constitutively depleting isoform Tm2-C appears to have no observable effect on survival.
Together, these observations support a role for tm2 in restricting tissue overgrowth. Since tm2-IRHMS02260
had no effect on tissue size, all further analyses of tm2 function will rely solely on tm2-IRJF for
knockdown.

Filipe Viegas Master Thesis 2016
Page | 22
3. tropomyosin2 limits the expression of Hippo pathway transcriptional
targets
As seen above, expressing two independent RNAi constructs that target tm2 to degradation has
a pronounced effect on tissue growth in the Drosophila wing. The actin cytoskeleton is known to
intervene in tissue growth, namely by regulating Hippo tumor suppressor pathway activity[53-55]. Given
that Tropomyosins controls actin filament stability by interacting directly with actin filaments[10] tm2
could limit wing disc growth by regulating Hippo pathway activity.
To investigate this possibility, I analyzed the effect of knocking down tm2 on the expression
levels of several Yorkie (Yki) transcriptional targets, that can be used as read out of Hippo pathway
activity, including Wingless (Wg) protein, in addition to LacZ reporter transgenes inserted in the
expanded (ex) (ex-LacZ), four-jointed (fj-LacZ) and shotgun (shg-LacZ) genes.
Figure 11 | Depleting tm2 in Drosophila wing imaginal discs increases adult wing size
a-c – Adult wings from female flies where nub-Gal4 is driving UAS-GFP (b), UAS-GFP and UAS-tm2-IRHMS (c),
UAS-GFP and UAS-tm2-IRJF (d). d-f – Overlapping wings of the different genotypes to highlight size differences:
cyan - w-; magenta - tm2-IRHMS; yellow - tm2-IRJF; scale bar=0,5mm. g – Scatterplot of the wing area for each
genotype: w- (lane 1, cyan, n=17), tm2-IRHMS (lane 2, magenta, n=20) and tm2-IRJF (lane 3, yellow, n=20);
horizontal bars represent mean value and standard deviation (SD); ***-p<0.001, ****-p<0.0001, n.s.-no
significance. h - Lethality of ubiquitous tm2 knockdown with different RNAi lines; tub-Gal4 driving UAS-tm2-
IRHMS, -IRJF or UAS-tm2-IRKK.

Role of Tropomyosin2 in cell proliferation and survival of Drosophila melanogaster
Page | 23
3.1 expanded, wingless and four-jointed expression increase upon tropomyosin2 downregulation
For this analysis I used two Gal4 drivers: hedgehog-Gal4 (hh-Gal4) and apterous-Gal4 (ap-
Gal4). The hh-Gal4 driver drives gene expression in the posterior compartment of wing imaginal discs[68]
and the anterior can be used as an internal control. The ap-Gal4 driver drives gene expression in the
dorsal wing disc, up to the dorsal-ventral (D-V) boundary[56] making the ventral compartment an internal
control.
ex-LacZ and Wingless protein levels were analyzed in wing discs in which tm2-IRJF expression
was driven using the ap-Gal4 driver. Upon tm2 depletion, ex-LacZ levels were visibly increased in the
distal portion of the ap-expressing domain, where tissue morphology is affected (Fig.12a). Also, tm2
depletion led to a considerable increase in Wg levels in the deformed D-V margin (Fig.12b), compared
to the wild-type distal Wg pattern[76] which comprises of two ring-like domains in the hinge region
(distal) and a stripe along the D-V boundary, dividing the distal wing disc. Using the hh-Gal4 driver to
drive UAS-GFP and UAS-tm2-IRJF expression in the posterior wing imaginal disc led to an increase in
ex-LacZ levels compared to the anterior compartment (Fig.12d). This increase in ex-LacZ levels was
even more noticeable in cross-sections through the wing disc epithelium, where ex-LacZ expression was
higher in the GFP-positive posterior compartment (Fig.12g,h).
In addition to Wg and ex-LacZ, fj-LacZ also presented increased transcription levels in discs
expressing UAS-tm2-IR and UAS-GFP in the posterior compartment using the hh-Gal4 driver (Fig.12i-
k) compared to the anterior compartment. Cross-sections through the disc epithelium also showed a
visible increase of fj-LacZ levels in the posterior compartment of hh>tm2-IR, GFP-expressing discs
(Fig.12l,m).
Upon tm2-IR expression, shg-LacZ did not behave like the other Yki readouts observed above.
While Wg, ex-LacZ and fj-LacZ had clearly increased fluorescence levels where tm2 was depleted, shg-
LacZ expression was not visibly affected in discs expressing tm2-IR and GFP under hh-Gal4 control,
(Fig.12n-p) compared to control hh>GFP discs (Fig.S2), despite showing an enlargement of posterior
compartment.
Furthermore, just as control discs which express GFP under hh-Gal4 control (Fig.S2), cross-
sections through the disc epithelium present a reduction of shg-LacZ in the posterior compartment and
an increase in shg-LacZ levels in the anterior compartment, adjacent to the A-P boundary (Fig.12q,r).
Similar to when tm2-IR is driven by nub-Gal4 (Fig.10), knocking down tm2 using hh-Gal4 also
induced tissue overgrowth with a variability in phenotype penetrance ranging from no observable
overgrowth (Fig.12f) to mild tissue overgrowth (Fig.12k,p). However, these overgrowing tissues were
never as strong as those induced when tm2 is knocked down using nub-Gal4.
Taken together, these results indicate that tm2 plays a role in limiting the expression of a subset
of Yki transcriptional targets.

Filipe Viegas Master Thesis 2016
Page | 24
(Figure legend on next page)

Role of Tropomyosin2 in cell proliferation and survival of Drosophila melanogaster
Page | 25
4. Apical F-actin Accumulation is Regulated by tropomyosin2
The interaction between Tropomyosin and F-actin essentially underlies and brings about its
function. Thus, having implicated tm2 in the regulation of tissue growth, as well as in the expression of
Yki target genes, the effect of tm2 depletion on F-actin networks needs to be examined carefully.
To do this, I expressed tm2-IR and GFP in the posterior compartment of the wing imaginal disc
using hh-Gal4 and stained these discs with Phalloidin, which marks F-actin. As previously observed,
the effects of tm2 depletion on the overgrowth of the posterior compartment showed differences in
phenotypical penetrance (Fig.12). In wing discs that did not display any significant overgrowth (Fig.13a-
c), there was a clear reduction of F-actin in the GFP-positive posterior compartment, compared to the
GFP-negative anterior domain (Fig.13a). This reduction was more evident in cross-sections through the
wing disc epithelium (Fig.13d,e). However, hh>tm2-IR-expressing discs that showed overgrowth of the
posterior compartment, most strikingly observed in the posterior hinge domain (Fig.13f-h) accumulated
F-actin (Fig.13f). This accumulation is even more striking by projecting the confocal image sections
that encompass the most apical domain of the wing disc epithelium (Fig.13f’-h’). Cross-sections through
the wing disc epithelium from the most ventral domain to the more dorsal domain showed that F-actin
not only accumulated at the apical surface of the posterior wing disc epithelium (Fig.13i-m, yellow
arrows) compared to the anterior domain separated by the A-P boundary (Fig.13i-m, green dotted line)
but also more basally, characterized by abnormal dot-like F-actin structures, (Fig.13j-m).
Figure 12 | tm2 depletion restricts the expression of a subset of Yki transcriptional targets
All panels display wing imaginal discs from 3rd instar Drosophila larvae. a-r – Standard confocal projections
(a-f, i-k, n-p) or cross-sections through wing disc epithelia (g, h, l, m, q, r). a-c – ap-Gal4 driving UAS-tm2-
IRJF in discs carrying ex-LacZ. d-r – hh-Gal4 driving UAS-tm2-IRJF in discs carrying ex-LacZ (d-h), fj-LacZ
(i-m) and shg-LacZ (n-r). Posterior domain is marked by GFP expression (e,j,o – white; f, h, k, m, p, r -
green); discs are stained with α-Wg (b, c - white), TRITC-conjugated Phalloidin (c - magenta) and/or α-β-
Galactosidase to highlight LacZ reporters (a, d, g, i, l, n, q – white; c – green; f, h, k, m, p, r - magenta).
Green dotted lines outline GFP-expressing domains (d, i, n) and separate posterior from anterior in transversal
sections (g, l, q); magenta dotted lines outline whole disc area (a, b, e, j, o); yellow arrows represent cross-
section position. Apical is facing up and posterior is to the right in cross-sections (g, h, l, m, q, r). Scale
bar=50µm (a-c), 40µm (d-r).

Filipe Viegas Master Thesis 2016
Page | 26
(Figure legend on next page)

Role of Tropomyosin2 in cell proliferation and survival of Drosophila melanogaster
Page | 27
5. tropomyosin2 Interacts with warts, an Upstream Regulator of Yorkie
Activity
Considering the above results, tm2 seems to play a role in limiting the expression of Yki
transcriptional targets as well as in preventing apical F-actin accumulation. These two effects could very
well be linked through Hippo pathway activity; as apical F-actin levels have been shown to be regulated
by Hpo kinase cascade activity. As such, the effect tm2 has on F-actin accumulation and growth could
be by interacting with Hippo pathway components. In an attempt to determine the level at which tm2
might contribute in regulating Hippo pathway activity, tm2 was depleted alongside the overexpression
of two upstream regulators of Yki – wts and ex. This was done to see whether tm2-IR expression could
rescue the growth-suppression phenotype of wts and ex overexpression. Both adult wings from female
flies and wing imaginal discs from 3rd instar larvae were used for this analysis.
5.1 tropomyosin2 interacts with warts, but not expanded in regulating adult wing size
In this experiment, I express UAS-tm2-IRJF together with either UAS-ex or UAS-wts transgenes
using a nub-Gal4 driver to observe if tm2 downregulation rescues ex- or wts-induced undergrowth. As
a control for tm2 depletion, either UAS-ex or UAS-wts transgenes along with a UAS-mCherry transgene
are driven by nub-Gal4 in order to have the same number of UAS-transgenes in both conditions. As a
control for the effect of ex or wts overexpression, wild-type (w- background) individuals with a UAS-
GFP transgene are driven by nub-Gal4.
As expected, when overexpressing either ex (Fig.14b) or wts (Fig.14c) with the nub-Gal4 driver,
adult wings were significantly smaller than wings where UAS-GFP was expressed in a w- background
(Fig.14a,j). wts was more potent in reducing wing size than ex, as wts-overexpressing wings were
significantly smaller (Fig.14j).
Figure 13 | Apical F-actin accumulation is affected upon tm2 depletion
All panels are wing imaginal discs from 3rd instar Drosophila larvae. a-n – Standard confocal projections (a-
c, f-h, f’-h’, n) or cross-sections through the wing disc epithelium (d, e, i-m, i’m’) in which hh-Gal4 is driving
UAS-GFP and UAS-tm2-IRJF. Posterior domains are marked by GFP expression (d, b, g, g’ - white; c, e, h,
h’-m’, n - green); discs are stained with TRITC-conjugated Phalloidin (a, d, f, f’, i-m - white; c, e, h, h’, i’-
m’, n - magenta). f’-h’ – projection of the epithelium apical domain of the same disc. Green dotted lines
outline GFP-expressing domains (a, f, f’) or the anterior-posterior boundary (i-m); magenta dotted lines
outline the whole disc area; white arrow (c) and blue dotted lines (n) indicate the position of each cross-
section; yellow arrows indicate apical F-actin accumulation. Apical is facing up and posterior is to the right
in cross-sections (d, e, i-m, i’-m’). Scale bar=50µm (a-c), 20µm (d-n, f’-m’).
(Figure in next page)

Filipe Viegas Master Thesis 2016
Page | 28
In contrast and as previously observed (Fig.11), expressing tm2-IRJF with UAS-GFP
significantly increased wing size compared to when UAS-GFP was expressed in a w- background
(Fig.11e,g). However, expressing tm2-IRJF did not affect the size of ex-overexpressing wings, as wing
size was not significantly different to those of ex- and mCherry-expressing adult wings (Fig.14h,j).
Surprisingly, tm2-IRJF expression significantly aggravated growth suppression induced by wts
overexpression (Fig.14i,j). The fact tm2-IRJF has no effect on ex-induced growth suppression could
possibly indicate tm2 might interact with Hippo pathway upstream of Ex while the effect tm2-IRJF
expression has on wts-induced growth suppression contradicts what I have shown so far of the growth-
restricting effect of tm2. However, wings where wts and tm2-IRFJ were ectopically expressed presented
a heavily affected morphology, with folded and irregular wing-edges as well as fused wing veins
(Fig.14f). As such, adult wing size might not be the ideal readout for the interaction between ex or wts
and tm2.
Figure 14 | Depleting tm2 in wts-overexpressing wings heavily affects wing morphology and size
a-f – Adult wings from female flies in which nub-Gal4 is driving UAS-GFP (a), UAS-ex and UAS-mCherry
(b), UAS-wts and UAS- mCherry (c), UAS-GFP and UAS-tm2-IRJF01095 (d), UAS-ex and UAS- UAS-tm2-
IRJF01095 (e), UAS-wts and UAS- UAS-tm2-IRJF01095 (f). g-i – Overlapping wings of the different genotypes to
highlight size differences: cyan - w-; yellow - tm2-IRJF; blue - ex, mCherry; orange - ex, tm2-IRJF; green - wts,
mCherry; magenta - wts, tm2-IRJF ; scale bar=0,5mm. j - h – Scatterplot of the wing area for each genotype:
w- (lane 1, cyan, n=17), tm2-IRJF (lane 2, yellow, n=20), ex, mCherry (lane 3, blue, n=27); ex, tm2-IRJF (lane
4, orange, n=20); wts, mCherry (lane 5, green, n=21); wts, tm2-IRJF (lane 6, magenta, n=18); horizontal bars
represent mean value and SD; all statistical differences between conditions are significant with p<0.0001
unless indicated otherwise; n.s.-no significance.

Role of Tropomyosin2 in cell proliferation and survival of Drosophila melanogaster
Page | 29
5.2 tropomyosin2 does not interact with expanded in regulating wing imaginal disc size
I next looked at the interaction of tm2 and ex in wing discs in order to confirm results from adult
wings and avoid possible problems they encounter in analyzing the effect gene interaction has on tissue
size. In agreement with my previous observations showing that overexpressing ex reduces the growth
of the adult wing (Fig14), overexpressing ex with nub-Gal4 significantly reduced the size of the distal
wing domain relative to the size of the whole wing disc (Fig.15a,c,e). However, and still in agreement
with results from adult wings, tm2 depletion combined with ex overexpression had no observable effect
on the ratio between nub domain area and total disc area (Fig.15c,d,e).
tm2 thus seems to interact with wts, though in an unexpected manner contrary to the role of tm2
as a growth suppressor. However, the interaction between the two could be unrelated with Hippo
pathway activity. While tm2 appears not to interact with ex, this might simply mean it feeds into Hippo
pathway upstream of Ex.

Filipe Viegas Master Thesis 2016
Page | 30
Figure 15 | Depleting tm2 has no effect on ex-induced growth suppression in the wing pouch
a-d – Standard confocal projections of wing imaginal discs from 3rd instar Drosophila larvae in which nub-
Gal4 is driving UAS-GFP (a), UAS-GFP and UAS-tm2-IRJF01095 (b), UAS-ex and UAS-mCherry (c), UAS-
ex and UAS-RFP and UAS-tm2-IRJF01095 (d); The nub-expressing domain is marked by GFP (a, b- green) or
mCherry (c - green) or RFP (d - green). Discs are stained with TRITC-conjugated (a, b - magenta) or FITC-
conjugated Phalloidin (c, d – magenta) to mark F-actin; Scale bar=50µm. d – Scatterplot of the ratio between
nub-expressing domain and the total wing disc areas for each genotype: w- (● n=22), tm2-IRJF (○ n=12), ex
and mCherry (■ n=15) and ex and tm2-IRJF (□ n=14); horizontal bars represent mean value and SD; all
statistical differences between conditions are significant (p<0.0001) unless indicated otherwise; n.s.-no
significance.

Role of Tropomyosin2 in cell proliferation and survival of Drosophila melanogaster
Page | 31
IV Discussion
HMW Tropomyosins have a tumor-suppressor function in vitro, discovered using human cell
lines[40]. However, this function has not yet been validated in vivo. Given the conserved nature of
Tropomyosins throughout Metazoans[17] and the similarities in exon composition between tm2 and
TPMs, I investigated whether tm2 has a tumor-suppressor role in the in vivo model Drosophila
melanogaster. My observations suggest that the Tm2-A/B isoform is required to prevent wing disc
overgrowth in the later stages of development by regulating Hippo pathway activity. These findings
suggest a possible mechanism by which other Tropomyosin isoforms exert their tumor-suppressor
activity.
Hence, I propose that a Tm2-A/B decorated F-actin network is essential in translating
compressive forces generated in growing discs into Hippo pathway activation and growth termination.
1. Tm2-A/B May be Responsible for Restricting Wing Disc Growth
My results suggest that Tm2-A/B, but not Tm2-C is required to maintain normal tissue size by
restricting tissue overgrowth in imaginal wing discs. Downregulation of all tm2 splice-variants using
two different RNAi transgenes – tm2-IRJF and tm2-IRKK – led to tissue overgrowth. The tm2-IRJF line
was used in addition to the KK line, because flies from this collection may have an unintended secondary
insertion site for the RNA hairpin vector in the 5’ UTR of tio[77,78]. Different KK RNAi lines led to
recurrent phenotypes unrelated with the targeted genes, such as wing inflation problems, Yki-induced
tissue overgrowth and pupal lethality[78], thereby affecting these line’s reliability.
The additional RNAi line would also prove useful in ruling out the possibility of an off-target
effect. Unfortunately, both tm2-IRKK and tm2-IRJF have a 19bp off-target region for DMAP1, a DNA
methyltransferase-associated protein that interacts with the NF-κB transcription factor in modulating
innate immune response[79].
By using the tm2-IRJF line from the TRiP, I was able to assure the overgrowth phenotype was
not due to a faulty insertion site in the tm2-IRKK. Then again, since both lines have the off-target region
for DMAP1, I cannot discard the possibility that the overgrowth phenotype of wing discs expressing
either RNAi is due to DMAP1 downregulation. As such, it is still necessary to demonstrate the
overgrowth of wing discs expressing tm2-IRKK and tm2-IRJF is due to tm2 depletion and rule out the off-
target as a possible cause. This can be done by driving the expression of dmap1-IR in the distal wing
compartment and see whether wing discs present a tissue overgrowth phenotype as with the tm2-IRKK
and tm2-IRJF lines.

Filipe Viegas Master Thesis 2016
Page | 32
In addition, if the overgrowth phenotype results from tm2 depletion, expressing tm2 along with
tm2-IR is expected to suppress wing disc overgrowth. Finally, the effect of tm2 on wing disc growth
should be confirmed by inducing clones mutant for a tm2 allele specific for all the splice variants. In
this case, overgrown clones would be expected but only if wing discs are close to growth termination,
according to the overarching hypothesis of Tm2-A/B translating compression into growth halt.
tm2-IRJF depletes all six tm2 splice variants and leads to tissue overgrowth (Fig.10). In contrast,
tm2-IRHMS depletes the only splice variant that codes for Tm2-C in addition to two of the five splice
variants which code for Tm2-A/B and does not lead to overgrowth (Fig.10). Because the Tm2-A/B
isoform is probably still expressed in tm2-IRHMS-expressing wing discs, this isoform is likely the only
one restricting wing growth. In agreement with this possibility, clones mutant for the tm2ZCL2456 allele,
which prevent the production of the Tm2-C isoform specifically, do not overgrow when compared to
their sibling twin spots (F. Janody, unpublished). Although to confirm that Tm2-A/B, but not Tm2-C,
restricts wing disc growth, a clonal analysis should be done using a tm2 allele that prevents the
production of Tm2-A/B entirely, to observe if mutant clones were significantly larger than their twin-
spot counterparts. This, along with a Western Blot to quantify Tm2 isoform levels, would indicate if
Tm2-A/B restricts wing disc growth. Nevertheless, a growth-related phenotype is only to be expected
in a later stage of wing disc development, when compression forces could lead to growth termination.
As such, in some cases there might not be enough time to observe overgrowth.
Surprisingly, the overgrowth phenotype generated by depleting Tm2-A/B with tm2-IRJF was
highly variable, ranging from almost wild type (Fig.10e-g) to drastically overgrown (Fig.10h-j). Even
though all larvae were dissected at 3rd instar, this variability probably stems from subtle differences in
developmental stage. This could indicate that Tm2-A/B is only required to halt wing disc growth when
tissues have reached their final size, suggesting it either has no function in growth control before then
or only starts to be expressed when wing discs are close to reaching their final size. Though to confirm
these observations, I would need to properly stage tm2-IRJF-expressing larvae and determine whether
there is a correlation between phenotype penetrance and developmental time.
2. Tm2-A/B and Tm2-C May Have Opposite Effects on F-actin levels
Cooperative binding to F-actin is a universal and central property of Tropomyosins, through
which they exert their wide array of cellular functions[11,80]. As such, the tumor-suppressor function of
Tm2-A/B is likely a consequence of regulating a particular F-actin subtype. This is consistent with how
mammalian tumor-suppressing Tropomyosin isoforms function, where their tumor-suppressor activity
depends on how they regulate a specific F-actin subtype or network, such as stress fibers[12,36,40]. For
instance, the loss of HMW Tpm isoforms is associated to stress fiber disruption and subsequent motility
increase and invasiveness of tumor cells[40].

Role of Tropomyosin2 in cell proliferation and survival of Drosophila melanogaster
Page | 33
tm2 depletion using tm2-IRJF had varying effects on growth (Fig.10). When tm2-IRJF expression
appears to affect normal disc growth, it is accompanied by an increase in F-actin levels (Fig.13f-h).
However, when tm2-IRJF expression had no visible impact on growth, F-actin levels decreased (Fig.13a-
e). My results suggest that at early stages, Tm2-A/B has no role in controlling growth, thus the decrease
in F-actin levels at early stages could be due to Tm2-C reduction. In agreement with this hypothesis,
clones mutant for the tm2ZCL2456 allele, which prevents the production of the Tm2-C isoform specifically,
show reduced F-actin levels (F. Janody, unpublished).
Based on these findings, Tm2-C could be required for maintaining normal F-actin levels by
promoting F-actin accumulation, while Tm2-A/B could maintain normal F-actin levels by preventing
filament accumulation. This is not surprising given several studies that report contrasting effects on actin
filament polymerization by different Tropomyosin isoforms, due to their stabilizing effect, as well as
their isoform-specific effect on recruiting distinct ABP to F-actin[81-83].
Tm2-C may promote F-actin accumulation by several mechanisms. Tm2-C-covered actin
filaments could compete for ADF/Cofilin binding and thus protect filaments from severing, as is the
case of Tpm3.1[12,30], Tpm1.1[84,85] and yeast Cdc8[86]. Similarly, Tm2-C could also prevent Gelsolin
severing, since HMW Tropomyosins seem to partially protect filaments from severing and can even
anneal Gelsolin-severed F-actin[11]. Tropomodulin, which has been shown to cap filaments and prevent
pointed-end elongation and depolymerization[11]. As such, Tm2-C could be required to prevent pointed-
end depolymerization together with Tropomodulin. Tm2-C could also promote F-actin accumulation by
mediating F-actin nucleation by Formins, as these have been proposed to act as orchestrators of the
Tropomyosin composition of F-actin at the time of nucleation. Formins have been shown to recruit
different Tropomyosin isoforms[30]. Finally, Tm2-C could directly stabilize F-actin, as Tpm1.1 and
LMW Tropomyosin isoforms have been shown to have a stabilizing effect, which leads to longer
filaments[14,87].
Tm2-A/B, however, could prevent F-actin accumulation at the end of larval wing disc
development. In spite of most Tropomyosin isoforms protecting F-actin from ADF/Cofilin-mediated
disassembly, some isoforms (Tpm1.7, Tpm2.1 and Tpm4.2) promote filament severing[11,88,89]. This
way, Tm2-A/B may be required to prevent F-actin accumulation by promoting Cofilin-mediated
filament disassembly. Tropomyosins have also been shown to inhibit Arp2/3-dependent actin
nucleation[11,30]. Tm2-A/B could therefore prevent the formation of branched actin networks nucleated
by Arp2/3, similarly to what has been shown for Tpm1.6, Tpm1.7 or Tpm1.1[30].

Filipe Viegas Master Thesis 2016
Page | 34
Moreover, Tropomyosins have also been shown to regulate myosin motor activity[90]. This could
influence contractile properties of F-actin structures such as the actomyosin cortex[1,91] and filament
turnover, as myosin-induced contraction has emerged as a mechanism of actin network disassembly[1].
In fact, the same Tropomyosin isoform can stimulate one myosin motor and inhibit another[11,30,88]. Thus,
Tm2-A/B could recruit a myosin motor that maintains filament turnover, preventing F-actin
accumulation or exclude a particular myosin motor which has the ability to alter the mechanical
properties of the network, leading to F-actin accumulation.
While these hypotheses propose possible mechanisms by which Tm2-C and Tm2-A/B might
affect F-actin accumulation, most of these hypotheses are based on interactions between Tropomyosin,
F-actin and ABP, which have mostly been described in vitro. Therefore, more insight on the in vivo
interaction between Tropomyosins and other ABPs is needed. While there is still a modest amount of
studies that investigate Drosophila Tropomyosins in non-muscle cells, the subject has been garnering
attention of late. This presents an opportunity to further investigate the interaction between
Tropomyosin, F-actin and other ABPs, as it has been done in yeast, C. elegans and human cells[37,38,61,92].
3. Tm2-A/B: a Link Between Mechanical Force and Growth
The role of Tm2-A/B in preventing F-actin accumulation and in regulating wing growth are
likely connected. Interestingly enough, it was in our laboratory where it was first described that the actin
cytoskeleton regulates growth via interaction and regulation of the Hippo tumor suppressor pathway[56]
and further studies contributed to better define this regulation[55,57,58,59]. These studies indicate that the
Hippo pathway kinase cascade activity restricts F-actin accumulation (Fig.16). CP and Ex prevent apical
F-actin accumulation which in turn inhibits kinase cascade activity and increases Yki transcriptional
activity. Furthermore, promoting apical F-actin accumulation by preventing the capping activity of
capulet (capt) or by overexpressing diaphanous (a formin) also led to decreased Hippo pathway
activity[56,57]. On the other hand, Zyx appears to promote Yki activity by antagonizing Ex in regulating
a different F-actin network, as this effect of Zyx on Yki activity is independent of Hippo kinase cascade
activity[58]. In a similar way, a Tm2-A/B governed F-actin network, distinct from the previous one,
could be required to halt tissue growth in later stages of wing disc development (Fig.16). This network
would be distinct from the above due to the apparent temporal requirement in the regulation of F-actin
levels and growth by Tm2-A/B. For instance, cp downregulation led to a consistently overgrown wing
disc phenotype[56] while tm2 downregulation appears to only have an effect on F-actin levels and growth
at the end of larval wing disc development (Fig.10 and 13).

Role of Tropomyosin2 in cell proliferation and survival of Drosophila melanogaster
Page | 35
To estimate the expression levels of several Yki transcriptional targets, I looked at the levels of
LacZ expression in several reporter lines for Yki transcriptional targets upon tm2-IRJF expression. I was
able to see an increase in LacZ reporters for ex and fj, but not shg. Although shg expression has been
shown to increase upon directly inactivating hpo[93,94], the output of Hippo signaling is cell-type specific
and the subset of Yki transcriptional targets is known to be quite variable since it depends on the binding
partner of Yki[48]. However, increased shg expression upon hpo inactivation was seen in wing discs and
shg regulatory region has a binding site for Sd, the main transcription factor that binds Yki to regulate
transcription[93]. Despite this, there may be other players involved and other binding partners, as many
are still thought to be undiscovered. Altogether, ex and fj upregulation in addition to increased Wg levels
(Fig.12) suggest that Tm2-A/B is necessary to keep Yki transcriptional activity in check. While this
regulation of Yki activity is most likely due to Tm2-A/B alone since Tm2-C has no effect on growth,
there would need to be no visible change in the expression levels of Yki transcriptional targets in clones
lacking Tm2-C as well as tm2-IRHMS expressing tissues to properly establish this.
Therefore, a F-actin based structure unlike those previously described, defined by Tm2-A/B,
might be receiving external cues and translating them into Hippo pathway regulation to control Yorkie
transcriptional activity in order to stop tissue growth at the end of wing disc development.
Figure 16 | Hippo pathway regulation by distinct F-actin networks
Green box - Proposed F-actin network controlled by Tm2-A/B which prevents filament accumulation and is
required to limit tissue overgrowth by preventing the upregulation of Yki transcriptional targets. Blue box -
Actin filament networks where CP and Capt prevent and Dia promotes F-actin accumulation; Orange Box -
Zyx promotes growth by antagonizing Ex-mediated F-actin regulation. Beige box – Simplified Hippo
pathway schematic.

Filipe Viegas Master Thesis 2016
Page | 36
Given that actin cytoskeletal dynamics are widely regarded as the central contributors and
mediators of mechanical force generation in the cell environment[1], one external cue this network could
translate into Hippo pathway-mediated growth suppression is mechanical force.
Additionally, mechanical forces have been proposed to regulate the termination of growth and
thus define the final dimensions of organs[95-98]. In Drosophila wing discs, cells in the wing pouch are
compressed while cells in the periphery are stretched[95,96] and computational models backed by
experimental data propose that compressive forces feed into a feedback mechanism that may regulate
tissue growth, leading to growth termination[98].
While my work did not investigate the mechanical component underlying this hypothesis, a
Tm2-A/B-dependent network could act as a sensor of mechanical information leading to the activation
of Hippo pathway, halting wing disc growth (Fig.17). Thus, before reaching a certain developmental
stage, wing discs lack sufficient compression to activate Hippo signaling in a Tm2-A/B-dependent
manner. In contrast, the compressive forces in the wing pouch reach a threshold later in development,
where a Tm2-A/B containing F-actin network translates mechanical force into Hippo pathway
activation.
Figure 17 | Model of a Tm2-A/B-dependent F-actin network which translates force into Hippo
pathway activation, halting wing disc growth in late development of wing imaginal discs
In this model, Tm2-A/B is key in translating the build-up of compressive forces in late development into
growth termination. Earlier in development (left side), This network has no impact on growth and Hippo
pathway is inactive, allowing tissues to grow. Later in development (right side), as tissues grow compressive
forces are built up to reach a threshold. These forces, in turn, are translated to a Tm2-A/B-dependent F-actin
network which activates Hippo pathway and subsequently promotes wing growth arrest.

Role of Tropomyosin2 in cell proliferation and survival of Drosophila melanogaster
Page | 37
Hippo pathway activity has been shown to respond to mechanical forces[49,53-55] in regulating
Yki activity. Two particular studies link cytoskeletal tension to YAP/TAZ activity[99,100]. In these studies,
increasing the stiffness of cells’ environment led to YAP activity while restricting cell adhesion area or
increasing cell-cell contact inhibited YAP activity. What these studies suggest is that tension leads to
Yki activity while compression prevents Yki activity. Reducing the available spreading area mimics
high cell-density conditions, which are prone to higher compression forces. A more recent in vivo study
not only links cell density and Yki activity, but also shows F-actin is key in maintaining that link in
vivo[101]. They report that an increase in cell density during zebrafish blastemal formation leads to
inactive Yki via actin cytoskeleton regulation, as disrupting F-actin dynamics overrides high density
cues and leads to Yki activity. This last study, along with others tightly link the actin cytoskeleton with
mechanical force generation/transmission as well as both of these with Hippo pathway activity, which
is in complete agreement with my proposed model.
I propose that Tm2-A/B is only involved in growth termination when discs have reached a
certain size. If so, in undergrown discs, the function of Tm2-A/B would be dispensable. In agreement
with my model, tm2 downregulation had no impact on growth suppression caused by ex overexpression,
both in adult and larval tissues (Fig.14 and 15).
Surprisingly, tm2 downregulation seems to aggravate wts-induced growth suppression in adult
wings (Fig.14). Besides controlling Yki phosphorylation, Wts regulates several cell processes such as
mitotic exit, cell growth, and morphogenesis[102]. In Drosophila, Wts has been suggested to have diverse
substrates, including Yki[103] and was shown to have a Yki-independent role in promoting growth arrest,
apoptosis and autophagy in salivary glands[104] and regulating dendrite patterning and maintenance[105].
Thereby, a distinct Tm2-dependent F-actin network could be involved in limiting the ability of Wts to
affect cell survival or patterning. This would explain the heavily affected morphology of wings where
wts and tm2-IRFJ were ectopically expressed (Fig.14f). Even though I have presented evidence
suggesting a Tm2-A/B-decorated F-actin network limits wing disc growth by regulating Hippo pathway
activity, it is still unclear at what level in Hippo pathway this F-actin network might act. To investigate
how Tm2-A/B controls Hippo pathway activity, I need to gauge Tm2-A/B loss in assays where wing
discs will be in a developmental stage where Tm2-A/B will be relevant for growth. It would also be very
relevant to induce compressive or distensile forces in wing discs and see whether these forces lead to
changes in Hippo signaling when Tm2-A/B is absent or overexpressed. This would solidify our claim
and maybe validate mechanical force as a growth-modulating signal in vivo.
While the model I propose for Tm2-A/B as a translator of mechanical force into Hippo pathway-
mediated growth arrest is quite interesting and exciting, there are reports linking Tm2 to nuclear division
and cell-cycle[21,23] that must be taken into account.

Filipe Viegas Master Thesis 2016
Page | 38
One report[21] indicates that Tm2-C, along with Tm1 and Tpn, is required in maintaining
genomic stability, as embryos mutant for each of these components present abnormal nuclear divisions
with spindle malformations and aneuploidy, while the other indicates Tm2-A/B and Tm1-J populate a
F-actin network surrounding the Golgi apparatus, maintaining its integrity and regulating cell-cycle
progression[23]. As it stands, the possibility that the role of Tm2-A/B in cell-cycle progression could
contribute towards growth regulation in wing discs cannot be ruled out. However this role of Tm2 alone
is unlikely to explain the overgrowth phenotype upon tm2 downregulation, as aneuploidy by itself seems
to be insufficient to drive tumorigenesis, despite being a key factor in cancer progression[106]. One way
to clearly determine if Tm2-C and/or Tm2-A/B play a role in genomic stability of wing imaginal disc
cells would be to observe if there is any spindle malformation or faulty chromosome segregation upon
Tm2-C or Tm2-A/B depletion and if any of these isoforms are located in the nucleus.
4. Drosophila as a Model in the Study of Tropomyosins in Cancer
This study stems from the observation that TPM2 is downregulated in pre-malignant breast
tumor samples and in an inducible human epithelial cell line which recapitulates the multistep
development of cancer (Tavares et al., in revision).
I found that all exons from all human Tropomyosins had similarities to exons of both tm1 and
tm2, with no preferential contribution of either tm to a particular TPM (S2.3). This is in agreement with
what is known from Tropomyosin function in muscle, which has established human TPMs as orthologs
of Drosophila tms[17,25]. tm1 isoforms seem to be more relatable to LMW human isoforms given that the
contribution of tm1 to LMW-exclusive and required human exon 1b is much greater than that of tm2,
whose exon 1 has only marginal similarities with human exon 1b (Fig.S3). Moreover, tm1 lacks any
similarity to HMW-exclusive human exon 2a while exon 1 of tm2 has some sequence similarities to
exon 2a (Fig.S3). This points to the possibility of tm2 gene products being more relatable to HMW
human Tropomyosin isoforms while tm1 splice variants could be functionally equivalent to LMW
human Tropomyosin isoforms. Together with the fact that downregulating tm1 in the preliminary screen
done in our lab led to tissue undergrowth (F. Janody, unpublished), these indications agree with the
protective effect HMW Tropomyosins have in tumorigenesis and with the tumor-suppressor effect Tm2-
A/B suggested previously.
This analysis alone was not able to determine a clear and distinguishable contribution of tm2
towards a particular human tropomyosin gene. It does, however, seem to argue in favor of Drosophila
as a capable in vivo model to study human Tropomyosin function and quite possibly further investigate
the mechanisms behind the role Tropomyosins have in cancer progression.

Role of Tropomyosin2 in cell proliferation and survival of Drosophila melanogaster
Page | 39
5. Final Remarks
A fundamental question of developmental biology is how growth is regulated to produce organs
of different sizes. While much knowledge has been attained concerning how tissue expansion is
achieved, the mechanism by which tissues stop growing remains unclear. In this sense, Tm2-A/B might
be a key component of a F-actin network which interprets mechanical cues in the final stages of wing
disc development, leading to Hippo pathway-mediated growth termination.
Consequently, this study also highlights the intimate and intricate connection between basic
developmental mechanisms and cancer, since Tropomyosin2 appears to be necessary for normal
development but also restricts uncontrolled growth. Accordingly, I showed Drosophila Tropomyosin2
to have a tumor suppressor function in wing discs, consistent with what was described of many HMW
Tropomyosin isoforms in human cells. Not only that, but this study also suggests a possible mechanism
by which the downregulation of HMW Tropomyosin isoforms contributes to cancer development.
Despite remaining elusive, the mechanism behind organ growth-termination is currently an
active pursuit of many scientists. I believe that by further investigating the cytoskeletal regulation of
particular Hippo pathway constituents, that mechanism can be unraveled. Not only that, but by also
identifying the particular actin networks responsible for transducing cell-environment cues into
signaling cascades we will come closer to a complete understanding of the beginning, middle and end
of normal development. By having a more complete understanding of normal development, we will then
be able to address pathologies where it is compromised in an unprecedented manner.

Filipe Viegas Master Thesis 2016
Page | 40
V Bibliography
1. Blanchoin, L. et al. (2014) Actin Dynamics, Architecture, and Mechanics in Cell Motility. Physiol.
Rev. 94, 235–263
2. Pollard, T.D. and Cooper, J.A. (2009) Actin, a central player in cell shape and movement. Science
326, 1208–12
3. Dos Remedios, C.G. et al. (2003) Actin binding proteins: regulation of cytoskeletal microfilaments.
Physiol. Rev. 83, 433–473
4. Lee, S.H. and Dominguez, R. (2010) Regulation of actin cytoskeleton dynamics in cells. Mol. Cells
29, 311–325
5. Taylor, M.P. et al. (2011) Subversion of the actin cytoskeleton during viral infection. Nat. Rev.
Microbiol. 9, 427–39
6. Mullins R.D. (1998) The interaction of Arp2/3 complex with actin: nucleation, high affinity pointed
end capping, and formation of branching networks of filaments. PNAS 95, 6181–6186
7. Mullins RD, Stafford WF, Pollard TD. Structure, subunit topology, and actin-binding activity of the
ARP2/3 complex from Acanthamoeba Acanthamoeba. J Cell Biol 136: 331–343
8. Bamburg J.R. et al. (1980) Partial purification and characterization of an actin depolymerizing factor
from brain. FEBS Lett 121, 178–182
9. Sellers, J.R. (2000) Myosins: a diverse superfamily. Biochim. Biophys. Acta 1496, 3-22
10. Khaitlina, S.Y. (2015) Tropomyosin as a Regulator of Actin Dynamics. Int. Rev. Cell Mol. Biol.
318, 255–291
11. Gunning, P.W. et al. (2008) Tropomyosin-based regulation of the actin cytoskeleton in time and
space. Physiol. Rev. 80, 1-35
12. Gunning, P.W. et al. (2015) Tropomyosin - master regulator of actin filament function in the
cytoskeleton. J. Cell Sci. 128, 2965-2974
13. Bailey, K. (1946) Tropomyosin a new asymmetric protein component of muscle. Nature 157, 368
14. Hitchcock-DeGregori, S. E. et al. (1988) Tropomyosin inhibits the rate of actin polymerization by
stabilizing actin filaments. Biochemistry 27, 9182-9185
15. Broschat, K. O. et al. (1989). Tropomyosin stabilizes the pointed end of actin filaments by slowing
depolymerization. Biochemistry 28, 8501-8506
16. Schevzov, G. et al. (2011) Tropomyosin isoforms and reagents. Bioarchitecture 1, 135–164
17. Gunning, P.W. et al. (2015) The evolution of compositionally and functionally distinct actin
filaments. J. Cell Sci. 128, 2009–2019
18. Geeves, M.A. et al. (2015) A systematic nomenclature for mammalian tropomyosin isoforms. J.
Muscle Res. Cell Motil. 36, 147–153

Role of Tropomyosin2 in cell proliferation and survival of Drosophila melanogaster
Page | 41
19. Lees-Miller, J.P. and Helfman, D.M. (1991) The molecular basis for tropomyosin isoform diversity.
BioEssays 13, 429–437
20. Gunning, P.W. et al. (2005) Tropomyosin isoforms: Divining rods for actin cytoskeleton function.
Trends Cell Biol. 15, 333–341
21. Sahota, V.K. et al. (2009) Troponin I and Tropomyosin regulate chromosomal stability and cell
polarity. J. Cell Sci. 122, 2623–2631
22. Hsiao, J.Y. et al. (2015) Arp2/3 Complex and Cofilin Modulate Binding of Tropomyosin to
Branched Actin Networks. Curr. Biol. 25, 1573–1582
23. Goins, L.M. and Mullins, R.D. (2015) A novel tropomyosin isoform functions at the mitotic spindle
and Golgi in Drosophila. Mol. Biol. Cell 26, 2491–2504
24. Cho, A. et al. (2016) An Atypical Tropomyosin in Drosophila with Intermediate Filament-like
Properties. Cell Rep. 16, 1-11
25. Vrhovski, B. et al. (2008) Structure and evolution of tropomyosin genes. Adv. Exp. Med. Biol. 644,
6–26
26. Atrrill, H. et al. The FlyBase Consortium (2016) FlyBase: establishing a Gene Group resource for
Drosophila melanogaster. Rel.FB2016_05
27. McLachlan, A.D. and Stewart, M. (1975) Tropomyosin coiled-coil interactions: evidence for an
unstaggered structure. J Mol Biol 98, 293–304
28. Wegner, A. (1979) Equilibrium of the actin-tropomyosin interaction. J. Mol. Biol. 131, 839-853
29. Von der Ecken, J. et al. (2015) Structure of the F-actin-tropomyosin complex. Nature 519, 114-117
30. Schevzov, G. et al. (2012) Functional Diversity of Actin Cytoskeleton in Neurons and its Regulation
by Tropomyosin, (1st edn), 298 Elsevier Inc.
31. Blanchoin, L. et al. (2001) Inhibition of the Arp2/3 complex-nucleated actin polymerization and
branch formation by tropomyosin. Curr. Biol. 11, 1300–1304
32. Bugyi, B. et al. (2010) How tropomyosin regulates lamellipodial actin-based motility: a combined
biochemical and reconstituted motility approach. EMBOJ. 29, 14–26
33. Creed, S.J. et al. (2011) Tropomyosin isoform 3 promotes the formation of filopodia by regulating
the recruitment of actin- binding proteins to actin filaments. Exp. Cell Res. 317, 249–261
34. Brayford, S. et al. (2016) Tropomyosin promotes lamellipodial persistence by collaborating with
Arp2/3 at the leading edge. Curr. Biol. 26, 1312–1318
35. Wawro, B. et al. (2007) Tropomyosin regulates elongation by formin at the fast-growing end of the
actin filament. Biochemistry 282 (11), 8435–8445
36. Tojkander, S. et al. (2011) A molecular pathway for myosinII recruitment to stress fibers. Curr.
Biol. 21, 539-550
37. Huckaba, T.M. et al. (2006) Roles of type II myosin and a tropomyosin isoform in retrograde actin
flow in budding yeast. J. Cell Biol. 175, 957–969

Filipe Viegas Master Thesis 2016
Page | 42
38. Ono, S. and Ono, K. (2002) Tropomyosin inhibits ADF/cofilin-dependent actin filament dynamics.
J. Cell Biol. 156, 1065–1076
39. Lindberg, U. et al. (2008) Tropomyosins regulate the impact of actin binding proteins on actin
filaments. Adv. Exp. Med. Biol. 644, 223–230
40. Helfman, D.M. et al. (2008) Tropomyosin as a regulator of cancer cell transformation. Adv. Exp.
Med. Biol. 644, 124–131
41. O’Neill, G.M. et al. (2008) Tropomyosins as interpreters of the signaling environment to regulate
the local cytoskeleton. Semin. Cancer Biol. 18, 35–44
42. Robertson, C.W. (1936) The metamorphosis of Drosophila melanogaster, including an accurately
timed account of the principal morphological changes. J. Morphol. 59, 351–399
43. Beira, J. V. and Paro, R. (2016) The legacy of Drosophila imaginal discs. Chromosoma 125, 4, 573-
592
44. Klein, T. (2001) Wing disc development in the fly: The early stages. Curr. Opin. Genet. Dev. 11,
470–475
45. Day, S.J. and Lawrence, P. (2000) Measuring dimensions: the regulation of size and shape.
Development 127, 2977–87
46. Harvey, K. and Tapon, N. (2007) The Salvador-Warts-Hippo pathway [mdash] an emerging tumour-
suppressor network. Nat Rev Cancer 7, 182–191
47. Pan, D. (2010) The hippo signaling pathway in development and cancer. Dev. Cell 19, 491–505
48. Halder, G. and Johnson, R.L. (2011) Hippo signaling: growth control and beyond. Development
138, 9–22
49. Yu, F.X. et al. (2015) Hippo Pathway in Organ Size Control, Tissue Homeostasis, and Cancer. Cell
163, 811–828
50. Zhou, D. et al. (2009) Mst1 and Mst2 maintain hepatocyte quiescence and suppress hepatocellular
carcinoma development through inactivation of the Yap1 oncogene. Cancer Cell 16, 425–438
51. Zhao, B. et al. (2010) A coordinated phosphorylation by Lats and CK1 regulates YAP stability
through SCF (beta-TRCP). Genes Dev. 24, 72–85
52. Zhao Li, L. et al. (2010) The Hippo-YAP pathway in organ size control and tumorgenesis: an
updated version. Genes Dev. 24, 862–874
53. Halder, G. et al. (2012) Transduction of mechanical and cytoskeletal cues by YAP and TAZ. Nat.
Publ. Gr. 13, 591–600
54. Sun, S. and Irvine, K.D. (2016) Cellular Organization and Cytoskeletal Regulation of the Hippo
Signaling Network. Trends Cell Biol. xx, 1–11
55. Gaspar, P. and Tapon, N. (2014) Sensing the local environment: Actin architecture and Hippo
signaling. Curr. Opin. Cell Biol. 31, 74–83
56. Fernández, B.G. et al. (2011) Actin-Capping Protein and the Hippo pathway regulate F-actin and
tissue growth in Drosophila. Development 138, 2337–2346

Role of Tropomyosin2 in cell proliferation and survival of Drosophila melanogaster
Page | 43
57. Sansores-Garcia, L. et al. (2011) Modulating F-actin organization induces organ growth by affecting
the Hippo pathway. EMBO J. 30, 2325–35
58. Gaspar, P. et al. (2015) Zyxin antagonizes the FERM protein expanded to couple f-actin and yorkie-
dependent organ growth. Curr. Biol. 25, 679–689
59. Rauskolb, C. et al. (2014) Cytoskeletal tension inhibits Hippo signaling through an Ajuba-Warts
complex. Cell 158, 143–156
60. Hanahan, D. and Weinberg, R.A. (2011) Hallmarks of cancer: The next generation. Cell 144, 646–
674
61. Stehn, J.R. et al. (2006) Specialisation of the tropomyosin composition of actin filaments provides
new potential targets for chemotherapy. Curr Cancer Drug Targets 6, 245–256
62. Pollack R. et al. (1975) Patterns of organization of actin and myosin in normal and transformed
cultured cells. PNAS 72, 994–8
63. Yamaguchi H. and Condeelis, J. (2007) Regulation of the actin cytoskeleton in cancer cell migration
and invasion. Biochim Biophys Acta 1773, 642– 52
64. Schevzov, G. et al. (2015) Regulation of cell proliferation by ERK and signal-dependent nuclear
translocation of ERK is dependent on Tm5NM1-containing actin filaments. Mol. Biol. Cell 26,
2475–90
65. Calleja, M. et al. (1996) Visualization of gene expression in living adult Drosophila. Science 274,
252-255
66. Griffin, R. et al. (2014) Genetic odyssey to generate marked clones in Drosophila mosaics. PNAS
111, 4756–63
67. Brand, A.H. and Perrimon, N. (1993) Targeted gene expression as a means of altering cell fates and
generating dominant phenotypes. Development 118, 401–15
68. Tanimoto, H. et al. (2000) Hedgehog creates a gradient of DPP activity in Drosophila wing imaginal
discs. Molecular Cell 5, 59-71
69. Hamaratoglu, F. et al. (2006). The tumour-suppressor genes NF2/Merlin and Expanded act through
Hippo signaling to regulate cell proliferation and apoptosis. Nat. Cell Biol. 8, 27-36
70. Villano, J.L. and Katz, F.N. (1995) Four-jointed is required for intermediate growth in the proximal-
distal axis in Drosophila. Development 121, 2767-2777
71. Tanaka-Matakatsu, M. et al. (1996) Cadherin-mediated cell adhesion and cell motility in Drosophila
trachea regulated by the transcription factor Escargot. Development 122, 3697–3705
72. Udan, R. S. et al. (2003) Hippo promotes proliferation arrest and apoptosis in the Salvador/Warts
pathway. Nat. Cell Biol. 5, 914-920
73. Lai, Z.C. et al. (2005) Control of cell proliferation and apoptosis by mob as tumor suppressor, mats.
Cell 120, 675-685
74. Roberts, D.B (1998) Drosophila, a pratical approach, Oxford University Press
75. Luduena RF. (2013) A hypothesis on the origin and evolution of tubulin. Int Rev Cell Mol Bio
Filipe Viegas Master Thesis 2016
Page | 44
76. Lento, W. et al. (2013) Wnt/Wingless Signaling in Drosophila. Cold Spring Harb. Perspect. Biol.
4, 6
77. Green, E.W. et al. (2014) A Drosophila RNAi collection is subject to dominant phenotypic effects.
Nat. Methods 11, 222–223
78. Manning, S. et al. (2016) A Drosophila RNAi library modulates Hippo pathway-dependent tissue
growth. Nat. Commun. 7, 1–6
79. Goto, A. et al. (2014) The chromatin regulator DMAP1 modulates activity of the nuclear factor κB
(NF-κB) transcription factor Relish in the Drosophila innate immune response. J. Biol. Chem. 289,
20470–20476
80. Hitchcock-DeGregori, S.E. et al. (2007) Tropomyosin: Regulator of actin filaments. Adv. Exp. Med.
Biol. 592, 87–97
81. Janco, M. et al. (2016) The impact of tropomyosins on actin filament assembly is isoform specific.
Bioarchitecture 992, 1–15
82. Robaszkiewicz, K. et al. (2016) Tropomyosin isoforms differentially modulate the regulation of
actin filament polymerization and depolymerization by cofilins. FEBS J. 283, 723–737
83. Wawro, B. et al. (2007) Tropomyosin regulates elongation by formin at the fast-growing end of the
actin filament. Biochemistry 46, 8146–8155
84. Bernstein, B.W. and Bamburg, J.R. (1982) Tropomyosin binding to F-actin protects the F-actin from
disassembly by brain actin-depolymerizing factor (ADF). Cell Motil. 2, 1–8
85. Nishida, E. et al. (1984) Cofilin, a protein in porcine brain that binds to actin filaments and inhibits
their interactions with myosin and tropomyosin. Biochemistry 23, 5307–5313
86. Nakano K. and Mabuchi I. (2006) Actin-depolymerizing protein Adf1 is required for formation and
maintenance of the contractile ring during cytokinesis in fission yeast. Mol Biol Cell 17, 1933–1945
87. Broschat, K. O. et al. (1989) Tropomyosin stabilizes the pointed end of actin filaments by slowing
depolymerization. Biochemistry 28, 8501-8506
88. Bryce, N. S. et al. (2003) Specification of actin filament function and molecular composition by
tropomyosin isoforms. Mol. Biol. Cell 14, 1002–1016
89. Creed, S.J. et al. (2011) Tropomyosin isoform 3 promotes the formation of filopodia by regulating
the recruitment of actin-binding proteins to actin filaments. Exp. Cell Res. 317, 249–261
90. Ostap, E.M. (2008) Tropomyosins as discriminators of myosin funcation. Adv. Exp. Med. Biol. 644,
273–285
91. Aldaz, S. et al. (2013) Dual role of myosin II during Drosophila imaginal disc metamorphosis. Nat.
Commun. 4, 1761
92. Clayton, J.E. et al. (2010) Differential regulation of unconventional fission yeast myosins via the
actin track. Curr. Biol. 20, 1423–1431
93. Genevet, A. et al. (2009) The Hippo pathway regulates apical-domain size independently of its
growth-control function. J Cell Sci 122, 2360–2370

Role of Tropomyosin2 in cell proliferation and survival of Drosophila melanogaster
Page | 45
94. Jezowska, B. et al. (2011) A dual function of Drosophila capping protein on DE-cadherin maintains
epithelial integrity and prevents JNK-mediated apoptosis. Dev. Biol. 360, 143–159
95. Aegerter-Wilmsen, T. et al. (2007) Model for the regulation of size in the wing imaginal disc of
Drosophila. Mech. Dev. 124, 318–326
96. Legoff, L. et al. (2013) A global pattern of mechanical stress polarizes cell divisions and cell shape
in the growing Drosophila wing disc. Development 140, 4051–9
97. Aegerter-Wilmsen, T. et al. (2012) Integrating force-sensing and signaling pathways in a model for
the regulation of wing imaginal disc size. Development 139, 3221–31
98. Buchmann, A. et al. (2014) Sizing it up: The mechanical feedback hypothesis of organ growth
regulation. Semin. Cell Dev. Biol. 35, 73–81
99. Aragona, M. et al. (2013) A mechanical checkpoint controls multicellular growth through
YAP/TAZ regulation by actin-processing factors. Cell 154, 1047–1059.
100. Dupont, S. et al. (2011) Role of YAP/ TAZ in mechanotransduction. Nature 474, 179–183.
101. Mateus, R. et al. (2015) Control of tissue growth by Yap relies on cell density and F-actin in
zebrafish fin regeneration. Development 142, 2752–2763
102. Hergovich, A. et al. (2006) NDR kinases regulate essential cell processes from yeast to humans.
Nat. Rev. Mol. Cell Biol. 7:253–264
103. Hergovich, A. (2013) Regulation and functions of mammalian LATS/NDR kinases: looking
beyond canonical Hippo signalling. Cell Biosci. 3, 32
104. Dutta, S. and Baehrecke, E.H. (2008) Warts Is Required for PI3K-Regulated Growth Arrest,
Autophagy, and Autophagic Cell Death in Drosophila. Curr. Biol. 18, 1466–1475
105. Emoto, K. et al. (2006) The tumour suppressor Hippo acts with the NDR kinases in dendritic
tiling and maintenance. Nature 443, 210–213
106. Milán, M. et al. (2014) Aneuploidy and tumorigenesis in Drosophila. Semin. Cell Dev. Biol. 28,
110–115

Supplementary Information

Filipe Viegas Master Thesis 2016
Page | 48
S1 - Supplementary Material and Methods
S1.1 Molecular biology and sequencing
To confirm the presence of the correct RNAi hairpin in both TRiP RNAi fly lines (tm2-IRJF and
tm2-IRHMS), genomic DNA was extracted using a genomic DNA isolation protocol: 6 male flies are
collected in Eppendorf tubes and flash-frozen (-80ºC); frozen flies are ground in 200µl of buffer A
(100mM Tris-HCl, pH 7.5; 100mM EDTA; 100mM NaCl; 0.5% SDS); an additional 200µl of buffer A
is added and flies are ground until only cuticles remain; Eppendorf tubes are incubated for 30min at
65ºC; 800µl of LiCl/KAc solution (5M KAc stock + 6M LiCl stock at 1:2,5 ratio) is added to the
Eppendorf tubes; tubes are left incubating on ice for at least 10min; 15min spin (max RPM) and discard
supernatant; wash with 70% EtOH (500µl) and dry pellet; re-suspend pellet in 150µl nuclease free H2O
(Sigma).
Extracted gDNA was used for PCR following instructions of the manufacturer (Promega GoTaq
DNA Polymerase kit) with slight changes in thermal cycling conditions (Initial denaturation – 95oC for
4min; 30 cycles – 95oC for 30s, 49oC for 30s, 72oC for 30s; Final extension – 72oC for 10min; Soak –
12oC). For each RNAi line, I used primers recommended by the TRiP (tm2-IRJF – Fwd:
5’ACCAGCAACCAAGTAAATCAAC3’, Rev: 5’GATTTCACACAGATCAGCCG3’; tm2-IRHMS –
Fwd: 5’ACCAGCAACCAAGTAAATCAAC3’, Rev: 5’GGTAGGCATCACACACGATTA3’).
Fragment size was verified by agarose gel electrophoresis (1,5% agarose, TAE1x, RedSafe 1:100000;
100v), where GeneRuler 1kb DNA Ladder (ThermoFisher Scientific) was used to estimate fragment
size. The fragments amplified from the tm2-IRJF fly line were prepared for sequencing using BigDye
Terminator v1.1 Cycle Sequencing Protocol (ThermoFisher Scientific) and sent to the IGC Genomics
unit for sequencing.
Table S1 | Fly stocks used in this study

Role of Tropomyosin2 in cell proliferation and survival of Drosophila melanogaster
Page | 49
The sequence was then analyzed using FichTV software to correct possible sequence errors and
compared to the sequence of one arm of TRiP JF01095 dsRNAi available on Flybase.org. Sequence
comparison was done using Nucleotide BLAST (NCBI NIH).
S2 - Supplementary Results
S2.1 RNAi construct identity confirmation
A PCR from genomic DNA (gDNA) extracts of each fly line was carried out to confirm the
identity of the RNAi construct inserted in each fly line (Fig.S1a). Because the tm2-IRJF01095 and the tm2-
IRHMS02260 TRiP RNAi constructs were engineered using the VALIUM1 and VALIUM20 plasmids,
respectively. I therefore designed primers that targeted regions surrounding one dsRNAi arm in each
plasmid. The primer pairs that would amplify the dsRNAi insertion in the JF01095 and HMS02260
VALIUM plasmids should amplify a band at 574bp and 339bp, respectively. As a control, I used a PCR
reaction with no gDNA (Fig.S1a, lane1). The size of amplified product was in agreement with what was
expected from the used primer pairs. Moreover, PCR product from the tm2-IRJF01095 line was sequenced
and aligned against the sequence of one arm of TRiP tm2-IRJF01095 dsRNAi (Flybase.org). The product
amplified from the tm2-IRJF01095 fly line was 98% identical to its respective hairpin arm with a BLAST
score of 734bits (Fig.S1b). All together, these results indicate that the tm2-IRJF01095 and tm2-IRHMS02260
TRiP RNAi flies have the correct RNAi insert.

Filipe Viegas Master Thesis 2016
Page | 50
a
b
Figure S1 | TRiP RNAi lines have the correct hairpin size and sequence
a – Agarose gel loaded with PCR reactions; lane 1 – PCR reagents with no gDNA (negative control); lanes 2
& 3 – tm2-IRJF01095 gDNA, amplified with the tm2-IRJF Fwd and Rev primer pairs; lanes 4 & 5 –
tm2-IRHMS gDNA, amplified with the tm2-IRHMS Fwd and Rev primer pairs; b – Nucleotide alignment
of JF01095 sequenced hairpin arm; template sequence – tm2-IRJF01095 dsRNAi arm sequence available on
Flybase.org; query sequence-sequencing result.

Role of Tropomyosin2 in cell proliferation and survival of Drosophila melanogaster
Page | 51
S2.2 shotgun expression upon tm2 downregulation
S2.3 Exon Composition of Human and Drosophila Tropomyosins is Comparable
This study stems from the observation that human TPM2 is downregulated in pre-malignant
breast tumor samples and in an inducible cancer cell line that mimics the stages of cancer progression.
In a subsequent screen, Drosophila tm2 was found to have a role in preventing wing disc overgrowth.
Therefore, I wondered whether findings from studying the role of Drosophila Tropomyosins in growth
could be extrapolated to human Tropomyosins and cancer. To do this, I compared the exon composition
and sequence of Tropomyosin genes between Drosophila and Humans (Fig.S3). In this analysis, I
compared the sequence of all coding exons of human Tropomyosin genes (TPM1, TPM2, TPM3 and
TPM4) to the sequence of each Drosophila Tropomyosin gene. Exons with a max score of at least 15
and at least 35% identity were taken into account, though they were considered marginally similar
(Fig.S3, checkered boxes) while exons were considered similar if their alignment had a max score of 20
or greater and over 50% identity (Fig.S3, full boxes).
This analysis covered the exon composition of the tropomyosin genes because most, if not all,
isoforms are generated by alternative splicing of said exons. Also, a similar analysis has already been
performed where exon sequence of mammals, birds, amphibians and fish tropomyosin genes was
compared[16]. Even though I considered the possibility of tm1 and tm2 contributing to different vertebrate
tropomyosins, very few exons had exclusive contribution from either tm1 or tm2. TPM exon 9d, for
instance, only had similarities with tm2 exon 3 and while TPM exon 1b was only marginally similar to
a portion of tm2 exon1, it had a much higher amount of similarity to exon 7 of tm1 (Fig.S3a,c,d).
Figure S2 | Control shg-LacZ expression
All panels display wing imaginal discs from 3rd instar Drosophila larvae. a-c – Standard confocal projections.
a-c – hh-Gal4 driving UAS-GFP in discs carrying shg-LacZ. Posterior domain is marked by GFP expression
(b – white; c - green); discs are stained with α-β-Galactosidase to highlight LacZ reporters (a– white; c -
magenta). Green dotted lines outline GFP-expressing domains (a) Scale bar=40µm (a-c).

Filipe Viegas Master Thesis 2016
Page | 52
Another interesting finding was that while exon structure in the tropomyosin genes was
completely different between Drosophila and humans, there was a sequential equivalence between the
amino acid sequence, regardless of exons. The strongest conservation between the exons of the different
species was from the non-variable exons which are present in all Tpm isoforms, exons 3,4,5,7 and 8.
Additionally, this analysis uncovered that tm2 exon 4 had no any similarities with any human exon
(Fig.S3).
With this analysis alone, we were not able to determine a clear and distinguishable contribution
of tm2 towards a particular human tropomyosin gene unfortunately. However, tm2 isoforms are more
comparable to human HMW tropomyosin isoforms than LMW ones because all LMW TPM isoforms
have exon1b, which has only a low degree of similarity with tm2, especially when compared to tm1.
Figure S3 | Both tm1 and tm2 contribute to every human Tropomyosin exon
a-d – Coding-exon schematic of Drosophila (tm1 and tm2) and human (TPM1, TPM2, TPM3 and TPM4)
Tropomyosin genes; tm1 and tm2 exons are colored according to their similarity to TPM1 (a), TPM2 (b),
TPM3 (c) and TPM4 (d) exons. a – Exon comparison between Drosophila Tropomyosins and TPM1. b – Exon
comparison between Drosophila Tropomyosins and TPM2. c – Exon comparison between Drosophila
Tropomyosins and TPM3. d - Exon comparison between Drosophila Tropomyosins and TPM4. White boxes
– exons with no similarity to human TPM exons. Exons were considered similar with a BLAST max score of
≥20 and identity ≥50% (full-colored boxes) and marginally similar with a BLAST max score of ≥15 and
identity ≥35% (checkered-colored boxes).
a
b
c
d