role of the molybdoffavoenzyme aldehyde oxidase homolog 2 in
TRANSCRIPT

MOLECULAR AND CELLULAR BIOLOGY, Jan. 2009, p. 357–377 Vol. 29, No. 20270-7306/09/$08.00�0 doi:10.1128/MCB.01385-08Copyright © 2009, American Society for Microbiology. All Rights Reserved.
Role of the Molybdoflavoenzyme Aldehyde Oxidase Homolog 2 in theBiosynthesis of Retinoic Acid: Generation and Characterization
of a Knockout Mouse�†Mineko Terao,1# Mami Kurosaki,1# Maria Monica Barzago,1# Maddalena Fratelli,1 Renzo Bagnati,2
Antonio Bastone,1 Chiara Giudice,3 Eugenio Scanziani,3 Alessandra Mancuso,4,5
Cecilia Tiveron,4,6 and Enrico Garattini1*Laboratory of Molecular Biology, Department of Biochemistry and Molecular Pharmacology,1 and Department of Environmental Health,2
Istituto di Ricerche Farmacologiche Mario Negri, Via La Masa 19, 20156 Milan, Italy; Dipartimento di Patologia Animale, Igiene eSanita Pubblica Veterinaria, Sezione di Anatomia Patologica Veterinaria e Patologia Aviare, Facolta di Medicina Veterinaria,
Universita degli Studi di Milan, Via Celoria 10, 20133 Milan, Italy3; Centro Ricerca Sperimentale, Istituto Regina Elena,Via delle Messi d’Oro, 156, 00158 Rome, Italy4; Universita Cattolica del Sacro Cuore, Largo Gemelli 8, 00168 Rome,
Italy5; and European Brain Research Institute (E.B.R.I.), Rita Levi-Montalcini Foundation, Via del Fosso diFiorano 64/65, 00143 Rome, Italy6
Received 3 September 2008/Returned for modification 28 September 2008/Accepted 26 October 2008
The mouse aldehyde oxidase AOH2 (aldehyde oxidase homolog 2) is a molybdoflavoenzyme. Harderianglands are the richest source of AOH2, although the protein is detectable also in sebaceous glands, epidermis,and other keratinized epithelia. The levels of AOH2 in the Harderian gland and skin are controlled by geneticbackground, being maximal in CD1 and C57BL/6 and minimal in DBA/2, CBA, and 129/Sv strains. Testos-terone is a negative regulator of AOH2 in Harderian glands. Purified AOH2 oxidizes retinaldehyde intoretinoic acid, while it is devoid of pyridoxal-oxidizing activity. Aoh2�/� mice, the first aldehyde oxidaseknockout animals ever generated, are viable and fertile. The data obtained for this knockout model indicate asignificant role of AOH2 in the local synthesis and biodisposition of endogenous retinoids in the Harderiangland and skin. The Harderian gland’s transcriptome of knockout mice demonstrates overall downregulationof direct retinoid-dependent genes as well as perturbations in pathways controlling lipid homeostasis andcellular secretion, particularly in sexually immature animals. The skin of knockout mice is characterized bythickening of the epidermis in basal conditions and after UV light exposure. This has correlates in thecorresponding transcriptome, which shows enrichment and overall upregulation of genes involved in hyper-trophic responses.
Aldehyde oxidases (AOXs) (EC 1.2.3.1) are structurallyconserved proteins belonging to the family of molybdoflavoen-zymes along with xanthine oxidoreductase (XOR), the keyenzyme in the catabolism of purines (25, 28). In their catalyt-ically active form, both AOXs and XORs are dimers of iden-tical subunits characterized by three conserved domains sepa-rated by nonconserved hinge regions (28). The amino-terminal25-kDa domain contains two nonidentical 2Fe-2S redox cen-ters. The flavin adenine dinucleotide binding region is locatedin the intermediate 45-kDa domain, while the substrate andthe molybdopterin cofactor binding pocket reside in the car-boxy-terminal 85-kDa domain (28). AOXs have broad sub-strate specificity, hydroxylating N-heterocycles or oxidizing al-iphatic as well as aromatic aldehydes into the correspondingacids (35, 41, 42).
The primary structures of mammalian AOXs and XORs are
more than 40% identical, and the two types of enzymes areevolutionary related. Most of the available data indicate thatAOXs evolved from a primordial form of XOR through aseries of gene duplication events (28). In mammals, the num-ber of AOX genes is variable and species specific (25, 28, 37,65). Rodents have four AOX genes (Aox1, Aoh1, Aoh2, andAoh3) which are the products of asynchronous duplicationevents and cluster at a short distance from one another on thesame chromosome (chromosome 1c1 in mice and chromosome9 in rats) (Fig. 1). The Aoh1, Aoh2, and Aoh3 genes are alsoknown as Aox3, Aox4, and Aox3l, respectively, and are cur-rently designated with the latter names in the NCBI database.(The designation of the four mouse AOX genes as Aox1, Aox3,Aox4, and Aox3l in the NCBI database is still provisional. Asdiscussed in the work of Garattini et al. [25], the gene namesadopted in the NCBI database are confusing. For this reason,we decided to adopt our original nomenclature throughout thetext and refer hereafter to the four mouse AOX genes as Aox1,Aoh1, Aoh2, and Aoh3). The four loci code for equivalentnumbers of structurally related products, which representAOX isoenzymatic forms. The dog has two functional genes,the orthologs of rodent Aoh2 and Aoh3, and two pseudogenesshowing high similarity with Aox1 and Aoh1 (25). Finally, thehuman genome is endowed with a single functional gene
* Corresponding author. Mailing address: Laboratory of MolecularBiology, Istituto di Ricerche Farmacologiche Mario Negri, via LaMasa 19, 20156 Milan, Italy. Phone: 39-02-39014533. Fax: 39-02-3546277. E-mail: [email protected].
† Supplemental material for this article may be found at http://mcb.asm.org/.
# M.T., M.K., and M.M.B. contributed equally to this work.� Published ahead of print on 3 November 2008.
357
on April 4, 2019 by guest
http://mcb.asm
.org/D
ownloaded from

(AOX1) and two pseuodogenes representing the vestiges of themouse and rat Aoh1 and Aoh3 loci (28) (Fig. 1), all mapping tochromosome 2q (13, 28, 66).
Great amounts of human AOX1 as well as rodent AOX1and AOX homolog 1 (AOH1) proteins are synthesized in liverand lung (2, 36, 46, 65–68), although cell-specific expression ofthese enzymes in other organs and tissues, such as the centralnervous system, is observed (12, 13). Most of the data availableon the function of these enzymes relate to hepatic AOXs andAOX1 in particular. This protein is a well-known drug-metab-olizing enzyme, oxidizing various xenobiotics of medical andtoxicological importance (6–11, 48–50, 53, 54). Expression ofthe Aoh3 gene is restricted to the Bowman’s gland, the mainsecretory organ of the nasal mucosa. The protein has beenpurified to homogeneity from this source and shown to have anoverlapping set of substrates with AOX1 and AOH1 (31). Noinformation is available on the product of the mouse Aoh2gene, whose protein has never been isolated. AOH2 ortholo-gous proteins are predicted to exist in rats, marsupials, dogs,horses, and cows. It is possible that a functionally active Aoh2ortholog is also present in Old World monkeys, such as Macaca(M. Terao and E. Garattini, unpublished observations), al-though a similar gene is not found in chimpanzee and humangenomes. The lack of Aoh2 orthologs suggests a species-spe-cific function that became dispensable in some primates andhumans (23).
The physiological substrates of vertebrate AOXs are un-known, which makes it difficult to postulate a function for theenzymes. In vitro, all-trans retinaldehyde (RAL), the precursorof all-trans retinoic acid (ATRA), the active metabolite ofvitamin A, is a good substrate for rat and mouse AOX1,AOH1, and AOH3. Other postulated endogenous substratesfor AOXs are nicotinamide, pyridoxal, and serotonin oxidationmetabolites (25). Finally, AOX activities have been implicated
in the catabolism of the amino acids, isoleucine, leucine andvaline (KEGG; http://www.kegg.jp).
The present article provides novel information on the tissueand cell distribution of the mouse AOH2 protein, demonstrat-ing selective localization in the Harderian glands (HGs) andsebaceous glands as well as in keratinized epithelia. Purifica-tion and characterization of AOH2 demonstrate that the pro-tein oxidizes RAL into ATRA with high affinity and efficiency.However, unlike AOH1 and AOX1 from different animals,mouse AOH2 is devoid of pyridoxal-oxidizing activity. Func-tional inactivation of the Aoh2 gene by homologous recombi-nation and generation of a knockout animal (Aoh2�/� mouse)demonstrates a deficiency of ATRA synthesis in both the HGand skin. This is accompanied by alterations in the phenotypesand transcriptomes of the two organs.
MATERIALS AND METHODS
Animals and treatments. Animals with different genetic backgrounds, namely,CD1, BDF1, C57BL/6, BDA/2, and 129/Sv, were purchased from Charles RiverLaboratories (Calco, Italy). Animals were maintained on standard chow andcolonies expanded in standard-pathogen-free animal house facilities. All theprocedures involving animals were performed according to the relevant nationaland international legislation and authorized by the internal Ethical Committee ofthe Animal Care Unit. Testosterone treatments were performed as described ina previous publication (36). To evaluate photodamage to the skin, female ani-mals were shaved on the back and treated with UVB, using a light bulb placedat a 25-cm distance from the dorsal areas of the animal. Treatment consisted ofa daily 30-min period of irradiation of anesthetized animals for 4 days. One hourafter the last treatment, animals were sacrificed and extracted tissues were keptfrozen until use. Tissue samples for the measurement of retinoids were preparedwith minimal exposure to light.
Morphometric analysis of the skin. Four experimental groups were used forthese studies: mock- and UV-treated wild-type (WT) and Aoh2�/� animals.Biopsy punches (8 mm in diameter) were obtained from the central part of thedorsal skin by use of a disposable apparatus (Stiefel Laboratories SRL, Milan,Italy). The biopsy samples were fixed in 4% paraformaldehyde and paraffinembedded and tissue sections were prepared according to standard protocols.
FIG. 1. The mouse and human AOX gene clusters and XOR locus. (Top) The lengths and relative positions of the four mouse AOX genes(Aox1, Aoh1, Aoh2, and Aoh3) mapping to chromosome 1 and the single XOR gene (Xor) on chromosome 17, along with their exon composition,are illustrated. (Bottom) The lengths and relative positions of the only functionally active human AOX gene (AOX1), the two pseudogenes AOH1*and AOH3* on chromosome 2q, and the XOR gene on chromosome 2p are shown. The exons present in the active mouse and human genes areindicated. The exons showing sequence similarity with the corresponding mouse orthologous genes are indicated above the two human pseudo-genes. Chr, chromosome.
358 TERAO ET AL. MOL. CELL. BIOL.
on April 4, 2019 by guest
http://mcb.asm
.org/D
ownloaded from
Five fields for each histological section (five slides per animal; four animals perexperimental group) were randomly selected and the epidermal thickness wasevaluated under the microscope (magnification, �400). The epidermal thicknesswas expressed as the linear distance between the basal membrane and the apicalportion of the last epithelial layer by use of an automatic image acquisitioninstrument (Image Pro Plus 4.5; Media Cybernetics). The minimal, maximal,mean, and median thicknesses of the epidermis were measured.
Generation of knockout mice. To prepare the targeting construct, a 1.3-kbEcoRI/NsiI genomic fragment derived from Aoh2 intron 21 was cut from thePAC3 clone (67) and subcloned into the EcoRI/PstI sites of pBluescript (Strat-agene, La Jolla, CA), and plasmid pB1.3 was obtained. A 4.3-kb HindIII/BamHIgenomic fragment consisting of Aoh2 exons 23 to 26 and corresponding intronswas subcloned into the HindIII/BamHI sites of pBluescript, and plasmid pB4.3was obtained. Plasmid pB1.3 was digested with EcoRI/BamHI and inserted in thecorresponding sites of the pPNT vector (47), and plasmid pPNT1.3 was obtained.The 4.3-kb Aoh2 fragment contained in pB4.3 was isolated by cleavage withXhoI/NotI and inserted in the corresponding sites of pPNT1.3, generating theentire targeting cassette. In this cassette, exon 22 was replaced by the neomycinresistance gene, the original NsiI and ScaI sites were eliminated, and a new XbaIsite was derived from vector sequences.
The targeting vector was linearized by NotI digestion and electroporated inAB1 (129/Sv EvBrd� Hprt�, kindly provided by Alan Bradley) embryonic stem(ES) cells according to standard procedures (33). Out of the 423 clones that wereselected in the presence of the antibiotics G418 (Geneticin; Clontech, Palo Alto,CA) and FIAU (2�-fluoro-2�-deoxy-1-�-D-arabinofuranosyl-5-iodouracil; a kindgift from Eli-Lilly, Indianapolis, IN), only one clone, named 5E7, carried thehomologous recombination event, as assessed by PCR and Southern blot anal-yses. Chimeric mice were generated by injection of 5E7 cells in the blastocoelcavity of 3.5-day BDF1 embryos (F1 hybrids; C57BL/6 � DBA/2) (44). Uponmaturity, chimeric animals bearing agouti hair were mated to C57BL/6 females,resulting in heterozygous animals with germ line transmission of the trait. Het-erozygous Aoh2 knockout mice were consecutively mated with C57BL/6 mice fornine generations to obtain an AOH2-deficient mouse line with a pure C57BL/6background. The homogeneity of the background was confirmed by microsatel-lite analysis of the genome. Unless otherwise specified in the text, all the WT andknockout animals used for experiments were stabilized on the C57BL/6 geneticbackground.
Western blot analysis and in situ hybridization. Western blot analyses wereperformed as previously described using a chemiluminescence-based protocol(37, 68). The specific anti-AOX1, anti-AOH1, anti-AOH2, and anti-AOH3 rab-bit polyclonal antibodies have also been described previously (37, 68). For the insitu hybridization experiments, a PCR-amplified fragment of AOH2 cDNA (nu-cleotides 4169 to 4787) was subcloned in pBluescript and used as the template forthe synthesis of the sense and antisense riboprobes, employing T3 and T7 RNApolymerases (Stratagene), in the presence of 35S-labeled thio-UTP (specificradioactivity, 1,200 Ci/mmol; GE Healthcare, Milan, Italy). Manipulation andhybridization of the probes to tissue sections were as described previously (68).Tissue sections were stained with hematoxylin-eosin and photographed underthe microscope.
Measurements of RAL-oxidizing activity. RAL-oxidizing activity was deter-mined in 100 �l of 10 mM of potassium phosphate buffer (pH 7.4) containing 15to 100 �g of cytosolic protein extracts and 0.05 mM RAL, in the presence orabsence of 2 mM NAD after incubation at 37°C for 10 min in the dark. Thereaction was terminated by the addition of an equal volume of 95% butanol-5%methanol containing 0.005% butylated hydroxytoluene and centrifuged, and thesupernatants were subjected to high-performance liquid chromatography(HPLC) analysis using a C18 reverse-phase column (70) or to mass spectrometric(MS) analysis (see Table S1 in the supplemental material).
Purification of mouse AOH2 protein, electrophoresis, and spectroscopy. Un-less otherwise stated, all the purification steps were carried out at 4°C. HGs from100 male mice (3.4 g) were homogenized in 8 volumes of 100 mM sodiumphosphate buffer, pH 7.5, containing 0.2 mM phenylmethylsulfonyl fluoride, 1�g/ml each of aprotinin and leupeptin, and 0.1 mg of soybean trypsin inhibitor,with an Ultraturrax homogenizer (IKA Werke GmbH, Staufen, Germany). Ho-mogenates were centrifuged at 105,000 � g for 45 min to obtain cytosolicextracts. Extracts were heated at 55°C for 10 min and centrifuged at 15,000 � gto remove precipitated proteins. An equal volume of saturated ammonium sul-fate was added to the supernatant, and the precipitate was collected by centrif-ugation at 15,000 � g and resuspended in 100 mM Tris-glycine buffer, pH 9.0.Solubilized proteins were mixed with 5 ml of benzamidine-Sepharose (Amer-sham Pharmacia Biotech, Uppsala, Sweden) preequilibrated in 100 mM Tris-glycine buffer, pH 9.0. Following 2 h of incubation, the resin was washed fourtimes, each with 10 ml of the equilibration buffer to remove unbound proteins.
Adsorbed proteins were eluted twice with 5-ml aliquots of equilibration buffercontaining 5 mM benzamidine (Sigma Chemical Co., St. Louis, MO). The eluatewas concentrated to �1 ml with Centriplus YM-100 (Millipore Corp., Bedford,MA) and diluted to 10 ml with 50 mM Tris-HCl, pH 7.4. The solution wasapplied to a 5/5 fast protein liquid chromatography MonoQ (GE Healthcare)equilibrated in 50 mM Tris-HCl, pH 7.4. The AOH2 protein was eluted at 0.5ml/min with a linear gradient (30 ml) from 0 to 1 M NaCl in 50 mM Tris-HCl,pH 7.4. The purification of AOH2 was monitored by determination of RAL-oxidizing activity and by quantitative Western blot analysis (37). One unit ofenzymatic activity corresponds to 1 nmol of RAL oxidized/min. The absorbancespectrum of AOH2 in its native state was recorded at 20°C with a Hewlett-Packard HP8453 diode array spectrophotometer interfaced with a Vectra XApersonal computer (Hewlett-Packard, Palo Alto, CA).
MS of the purified AOH2 protein. Electrospray ionization-tandem MS anal-yses of AOH2 tryptic peptides were performed according to standard protocolsfollowing in situ or in gel tryptic digestion using a Bruker Biflex matrix-assistedlaser desorption ionization–time of flight (MALDI-TOF) MS (Bruker, Bremen,Germany) (37). Data generated were processed with the Mascot program (http://www.matrixscience.com) allowing a mass tolerance of 0.4 Da. Direct sequenceanalysis was carried out via collision-induced dissociation (CID) on an electro-spray MS API 3000 (Applied Biosystems, San Diego, CA). The program MS-Tag(http://prospector.ucsf.edu) was used to correlate the experimental CID spectrato the theoretical CID spectra of tryptic peptides derived from proteins presentin databases.
Whole-genome gene expression microarrays: collection of samples, experi-mental design, and analysis. For the studies involving HGs, WT and Aoh2�/�
animals were divided into four groups: males and females before and after sexualmaturation (5 to 6 and 7 to 9 weeks, respectively). Whole HGs were dissectedwithout any contamination of surrounding tissues. At least three pairs of animals(WT and Aoh2�/�) for each experimental group were used for the extraction oftotal RNA. When possible, each pair of age- and sex-matched RNA samplesfrom WT and Aoh2�/� mice was obtained from siblings of the same heterozy-gous mating. Couples of samples were hybridized on the same slide, in dye-swapped duplicates, for a total of 30 microarrays. For the studies involving skin,equivalent biopsy samples (8 mm in diameter) of the dorsal areas of four WT andfour Aoh2�/� female mice were obtained and processed for the extraction ofRNA. Age-matched pairs of samples obtained from the same mating werehybridized on the same slide with a balanced dye design, for a total of eightmicroarrays.
All the experiments were performed with commercially available mouse geneexpression microarrays consisting of approximately 44,000 probes (whole-mouse-genome microarray kit, 44,000 for the HG and 4 � 44,000 for the skin; Agilent,Palo Alto, CA). Total RNA was extracted using Qiagen RNeasy columns (Qia-gen SpA, Milan, Italy). RNA (1 �g) was labeled with Cy3 or Cy5 by use of acommercially available kit (amino allyl message AmpII aRNA amplification kit;Ambion Inc., Austin, TX).
Microarray slides were scanned with an Agilent scanner, and image data wereanalyzed using the Feature Extraction software (Agilent, version 9.1). Due to thehigh variability between the Aoh2�/� and WT log ratios, we decided to performvariance stabilization normalization (VSN) (29). Two-way analysis of variance(ANOVA) was performed, with Aoh2�/� versus WT as the first factor and thefour animal groups as the second factor. A total of 3,977 probes showed a P valueof less than 0.005 for at least one of the factors or for their interaction. Thiscorresponds to a false-discovery rate of 5.5%. From this list we removed replicateprobes or probes for the same genes according to the following criteria: (i) apreference for probes with lower P values; (ii) when differences in P values werelow, a preference for the probes significant for factor i; and (iii) a preference forprobes corresponding to NM-labeled reference sequences followed by XM-,AK-, and BC-labeled sequences. This resulted in a list of 3,468 nonreplicategenes that were used for the principal component analysis (PCA). PCA plotsprovide a graphical representation of high-dimensional expression data in lowdimensions. Throughout the study, only two (normally the first two, sometimesthe third, when it was endowed with a better discriminating power) of the threecomponents that account for the highest variation are shown. The similaritywithin a set of samples or experimental groups is indicated by physical proximity.
Gene set enrichment analysis (GSEA) was performed using the gene scoreresampling method of the ErmineJ software (38). We performed the analysisusing the individual genes’ P values of the knockout versus WT factor in two-wayANOVA. We obtained a list of 339 categories showing a P value of less than0.001 (Benjamini Hochberg correction for multiple testing, corresponding to araw P value of 0.0001). Due to the inherent characteristics of the gene ontology(GO) annotation, the list is highly redundant. Therefore, we selected the mostinformative categories according to the following criteria: (i) the smallest cate-
VOL. 29, 2009 Aoh2 KNOCKOUT MOUSE AND RETINOIC ACID SYNTHESIS 359
on April 4, 2019 by guest
http://mcb.asm
.org/D
ownloaded from

gory with the highest P value, (ii) preference for biological process categoriesover molecular function or cellular component, and (iii) selection of only one ofthe categories pertaining to the same group of biological processes. We used thesame GSEA for two other gene categories that we considered important for ourstudy and were not adequately represented in the GO database, namely, genesregulated by ATRA (5) and genes responsible for tissue hypertrophy (in the“diseases” lists of Metacore; http://www.genego.com). For the enriched path-ways, we determined the general direction of the changes, performing GSEA andusing log ratios rather than P values as scores. The same analysis was repeatedtwice, giving the best score to the highest log ratio (prevalence of upregulation)or, conversely, the best score to the lowest log ratio (prevalence of downregu-lation). We considered that there was a general downregulation if only down-regulation analysis resulted in a significant difference (P � 0.05) or if there wasa difference between downregulation and upregulation P values of more than 4orders of magnitude.
The results of the microarray experiments performed on skin samples werenormalized in two ways: (i) lowess normalization of the individual log ratios forthe differential regulation analysis, and (ii) VSN for the comparison with the HGand for the PCA of the genes belonging to specific categories. GSEA wasperformed as described for the HG. After Benjamini Hochberg correction formultiple testing (corresponding to a raw P value of 0.0001), we obtained a list of160 categories showing P values of less than 0.002.
Measurement of RAL and ATRA by MS. Reference standards of RAL andATRA were from Sigma (St. Louis, MO). The internal standard (ST1926) is asynthetic retinoid and was synthesized by Sigma-tau Industrie FarmaceuticheRiunite S.p.A. (Pomezia, Italy). Stock solutions were made in acetonitrile at theconcentration of 1 mg/ml and stored at �20°C in the dark. Working solutionscontaining all the substances to be analyzed were prepared before each analyticalrun. Acetonitrile for LC-MS was from Riedel de Haen (Seelze, Germany) andHPLC-grade Milli-Q water was obtained with a Milli-Ro Plus 90 apparatus
(Millipore, Molsheim, France). The methodological details of the analyticalprocedure are described in Table S1 in the supplemental material.
Microarray data accession number. Further details on the design of the studyand the methodologies used can be found under accession number GSE12541 of theGEO database, where the microarray data have been deposited (http://www.ncbi.nlm.nih.gov/geo/query/acc.cgi?token rfohdqgwiqyywvo&acc GSE12541).
RESULTS
AOH2 tissue- and cell-specific expression profile: high levelsin the HGs and sebaceous glands with detectable levels in theepidermis and other keratinized epithelia. In a first set ofexperiments, we studied the tissue distribution of the AOH2protein by Western blot analysis using an antipeptide poly-clonal antibody devoid of cross-reactivity with other AOXisoenzymes (37). As shown in Fig. 2A, large amounts of AOH2are synthesized by the HG, the major intraorbital exocrinegland located behind the ocular bulb. AOH2 is the only AOXpresent in this organ. The protein comigrates with the corre-sponding recombinant product expressed in HEK293T cells.This is in line with an apparent molecular mass of approxi-mately 150 kDa and is consistent with the size of the putativemonomeric subunit of mouse AOH2 (67, 68). The protein isalso detectable in the skin, the mucosal layer lining the oralcavity (tongue) (Fig. 2B), and the esophagus (data not shown).
FIG. 2. Tissue- and cell-specific expression of the AOH2 protein and mRNA. (A, B, and C) Tissue and organ distribution of the AOH2 protein.Extracts (100 �g) of the indicated tissues and organs were loaded on an 8% polyacrylamide gel run in denaturing and reducing conditions,transferred to nitrocellulose membranes, and subjected to Western blot analysis with anti-AOH2, anti-AOX1, anti-AOH1, anti-AOH3, andanti-�-actin antibodies. Abbreviations: PG, preputial gland; SV, seminal vesicles; OM, olfactory mucosa; SG, salivary gland; SmG, submaxillarygland; C extracts of HEK293 cells transfected with the full-length AOH2 cDNA used as a positive control for the experiment. (D) Tissue sectionsderived from HGs (a and b) and skin (c to f) were hybridized to a 35S-radiolabeled AOH2 sense (a and c) or antisense (b, d, e, and f) riboprobes.Magnifications, �200 (a and b), �100 (c and d), and �400 (e and f). Abbreviations: sbl, suprabasal layer; bl, basal layer; sg, sebaceous glands; M,molecular mass.
360 TERAO ET AL. MOL. CELL. BIOL.
on April 4, 2019 by guest
http://mcb.asm
.org/D
ownloaded from

AOH2-negative tissues include kidney, adrenal gland, pan-creas, hypophysis, brain, cerebellum, and spinal cord (data notshown). As indicated by Fig. 2C, AOH2 must serve a specificfunction in the HG, as the protein is not detectable in otherexocrine structures such as the preputial, extraorbital lacrimal(data not shown), salivary, and submaxillary glands. The tissuedistributions of AOH2 and other AOX isoenzymes differ.AOX1 and AOH1 are expressed predominantly in the liver(67), whereas AOH3 is restricted to the Bowman’s gland in thenasal mucosa (Fig. 2A) (37). A strict correlation between thelevels of AOH2 protein and corresponding mRNA is observedfor the HG, tongue, esophagus, and skin, as assessed by North-ern blot or quantitative reverse transcription-PCR (RT-PCR)analysis (data not shown).
The HG lays in close proximity with the intraorbital lacrimalgland, from which it cannot be dissected. The two structurescan be recognized only at the microscopic level. The secretoryacini of the HG are characterized by porphyrin deposits andlipid secretions inside the ductal lumen. In situ hybridizationexperiments with a specific antisense AOH2 RNA probe dem-onstrate that the corresponding transcript is expressed homo-geneously and at high levels in the majority of the epithelialcell population lining the ducts of the HG (Fig. 2D, panel b).This is the predominant cell population present in the organ.No accumulation of silver grains is observed in vicinal tissuesections hybridized with the sense AOH2 RNA probe (Fig. 2D,panel a).
Further in situ hybridization experiments performed withthe same AOH2 sense (Fig. 2D, panel c) and antisense (Fig.2D, panel d) probes indicate that the low levels of AOH2protein determined in the skin are the consequence of selectivesynthesis of the corresponding RNA in two locations: the epi-dermis and the sebaceous glands. Microphotographs of theepidermis taken at higher magnification (Fig. 2D, panel e)show that the AOH2 mRNA is synthesized only in the supra-basal layer, which differentiates from the basal layer of cells.This is similar to what observed for the keratinized epitheliumcovering the tongue, the esophagus, and the first part of thestomach (67). High-magnification pictures of the sebaceousglands (Fig. 2D, panel f) show accumulation of silver grains inthe secretory epithelial cells, which are characterized by theproduction of a lipid-rich secretion similar to that of the HG.
Control of AOH2 expression in the HG by genetic back-ground and testosterone. Interindividual variations in the lev-els of AOX have been reported for humans (25). Similarly,there is evidence of variability in the amounts of hepatic AOXactivity in different mouse and rat strains via epigenetic mech-anisms (25, 70). For mice, we observed epigenetic silencing ofthe AOH1 gene in certain common strains (70). Furthermore,mouse AOX1 and AOH1 show an expression profile which isdimorphic and gender dependent (36), as males synthesizelarger amounts of hepatic AOX1 and AOH1 proteins thanfemales (36). To establish the existence of variations in theexpression of AOH2 in different animal strains, we consideredfour types of mouse. The outbred CD1 and the inbredC57BL/6 mice are proficient, while DBA/2 and CBA mice aredeficient for the expression of hepatic AOH1 in the liver (70).In this study, we also included 129/Sv, since this is the strain oforigin of the ES cell line used for the generation of the Aoh2knockout mice described below.
As expected, the HGs of C57BL/6 and CD1 mice are richsources of AOH2 (Fig. 3A). Furthermore, the two strains syn-thesize detectable and equivalent amounts of the protein in theskin (Fig. 2B and 3B). In contrast, the HGs and the skin ofDBA/2, CBA, and 129/Sv animals are devoid of AOH2 (Fig.3A and B). Thus, DBA/2 and CBA strains have a generaldeficit in the tissue-specific synthesis of AOXs involving notonly AOH1 and AOX1 but also AOH2. This is not the case for129/Sv mice (64), which are not deficient in the expression ofhepatic AOH1 and AOX1 (70).
To define whether AOH2 is regulated in a sex-specific man-ner by steroid hormones, we determined the steady-state levelsof the protein in the HGs of male and female animals duringthe postnatal development of C57BL/6 mice. As illustrated inFig. 3C, sexually immature animals (5 and 7 weeks), which arecharacterized by low circulating levels of steroid hormones,and fully mature mice (13 weeks) show similar amounts ofthe AOH2 protein. Surprisingly, the HGs of 9-week-old malessynthesize almost three times less AOH2 than females. Thus,there is a narrow temporal window during the postnatal devel-opment of the HG, in which AOH2 acts as a sexually dimor-phic protein. Interestingly, maximal secretion of androgens isobserved around the ninth week (31), a time which normallymarks full sexual maturity of the male mouse. To assesswhether androgens may be involved in the regulation of AOH2synthesis, 6-week-old females were treated with testosteronefor 2 weeks (Fig. 3D). Testosterone administration results inan approximately twofold reduction in the steady-state levelsof the HG’s AOH2 protein. This is the opposite to what ob-served in the case of hepatic AOX1 (36) and AOH1 (Fig. 3D),which are dramatically induced by the androgen.
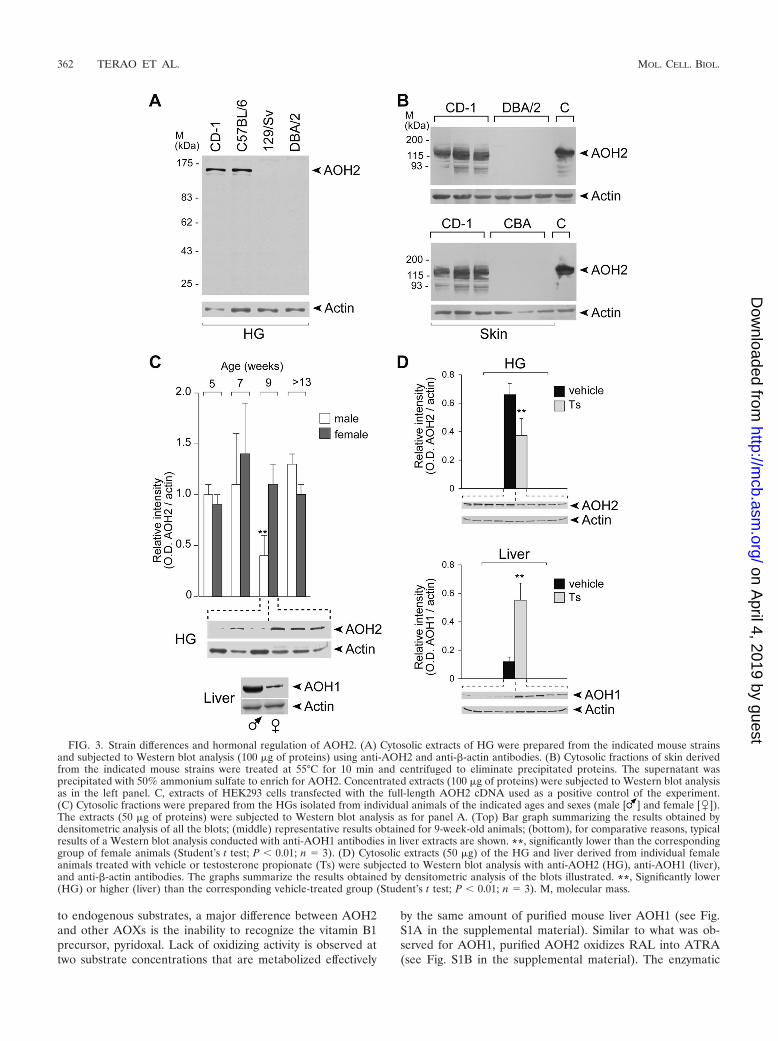
Purification and biochemical characterization of the AOH2protein from the HG. As a first step in the biochemical char-acterization of the AOH2 protein, we purified the enzyme tohomogeneity from the HG. The recovery of purified AOH2 isapproximately 5% with a purification factor of approximately350-fold (Table 1). Both parameters compare well with theyield and purity of other catalytically active mammalian mo-lybdoflavoenzymes (37, 67). Highly purified preparations ofAOH2 consist of a single and symmetrical protein peak co-eluting with anti-AOH2 immunoreactivity (Fig. 4A). The mo-nomeric subunit of purified AOH2 consists of a single proteinband with an apparent molecular mass of 150 kDa (Fig. 4B). Afurther characterization of AOH2 by MALDI-TOF analysis ofthe trypsin hydrolysate obtained from the purified protein isshown in Fig. 4C. As expected from the sequence data of thecorresponding cDNA (36, 37, 67), the tryptic fingerprints ofpurified AOH2, AOX1, AOH1, and AOH3 are completelydifferent. Comparison of the masses obtained experimentallyand predicted from the open reading frame of the AOH2cDNA allowed us to identify 73 tryptic peptides with a 59.6%sequence coverage of the AOH2 protein (see Table S2 in thesupplemental material). Spectroscopic analysis of purifiedAOH2 shows the typical profile of a molybdoflavoenzymecharacterized by a broad maximum of around 450 nm (Fig.4D). The spectrum of AOH2 and that of purified mouse liverAOH1, which is shown for comparison, are indistinguishable.
Studies performed on purified AOH2 indicate that the en-zyme is capable of oxidizing some of the exogenous substratesrecognized by other mammalian AOXs (data not shown). As
VOL. 29, 2009 Aoh2 KNOCKOUT MOUSE AND RETINOIC ACID SYNTHESIS 361
on April 4, 2019 by guest
http://mcb.asm
.org/D
ownloaded from
to endogenous substrates, a major difference between AOH2and other AOXs is the inability to recognize the vitamin B1precursor, pyridoxal. Lack of oxidizing activity is observed attwo substrate concentrations that are metabolized effectively
by the same amount of purified mouse liver AOH1 (see Fig.S1A in the supplemental material). Similar to what was ob-served for AOH1, purified AOH2 oxidizes RAL into ATRA(see Fig. S1B in the supplemental material). The enzymatic
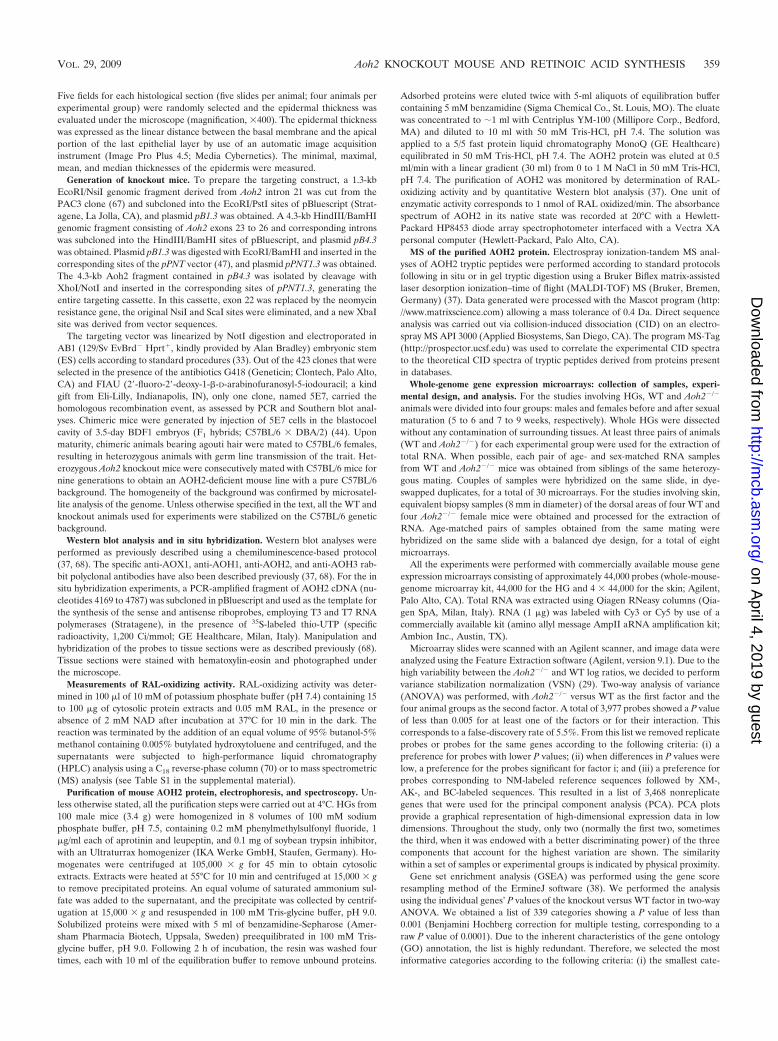
FIG. 3. Strain differences and hormonal regulation of AOH2. (A) Cytosolic extracts of HG were prepared from the indicated mouse strainsand subjected to Western blot analysis (100 �g of proteins) using anti-AOH2 and anti-�-actin antibodies. (B) Cytosolic fractions of skin derivedfrom the indicated mouse strains were treated at 55°C for 10 min and centrifuged to eliminate precipitated proteins. The supernatant wasprecipitated with 50% ammonium sulfate to enrich for AOH2. Concentrated extracts (100 �g of proteins) were subjected to Western blot analysisas in the left panel. C, extracts of HEK293 cells transfected with the full-length AOH2 cDNA used as a positive control of the experiment.(C) Cytosolic fractions were prepared from the HGs isolated from individual animals of the indicated ages and sexes (male [ ] and female [�]).The extracts (50 �g of proteins) were subjected to Western blot analysis as for panel A. (Top) Bar graph summarizing the results obtained bydensitometric analysis of all the blots; (middle) representative results obtained for 9-week-old animals; (bottom), for comparative reasons, typicalresults of a Western blot analysis conducted with anti-AOH1 antibodies in liver extracts are shown. **, significantly lower than the correspondinggroup of female animals (Student’s t test; P � 0.01; n 3). (D) Cytosolic extracts (50 �g) of the HG and liver derived from individual femaleanimals treated with vehicle or testosterone propionate (Ts) were subjected to Western blot analysis with anti-AOH2 (HG), anti-AOH1 (liver),and anti-�-actin antibodies. The graphs summarize the results obtained by densitometric analysis of the blots illustrated. **, Significantly lower(HG) or higher (liver) than the corresponding vehicle-treated group (Student’s t test; P � 0.01; n 3). M, molecular mass.
362 TERAO ET AL. MOL. CELL. BIOL.
on April 4, 2019 by guest
http://mcb.asm
.org/D
ownloaded from

reaction follows classic Michaelis-Menten kinetics (see Fig.S1C in the supplemental material), and the calculated Km andVmax values of AOH2 are 4.8 �M and 0.06 �mol/min/mg ofprotein, respectively. These values are comparable with thosecalculated for AOX1 and AOH1 (66, 70). Our results demon-strate that RAL is an excellent substrate for all the members ofthe mouse AOX family.
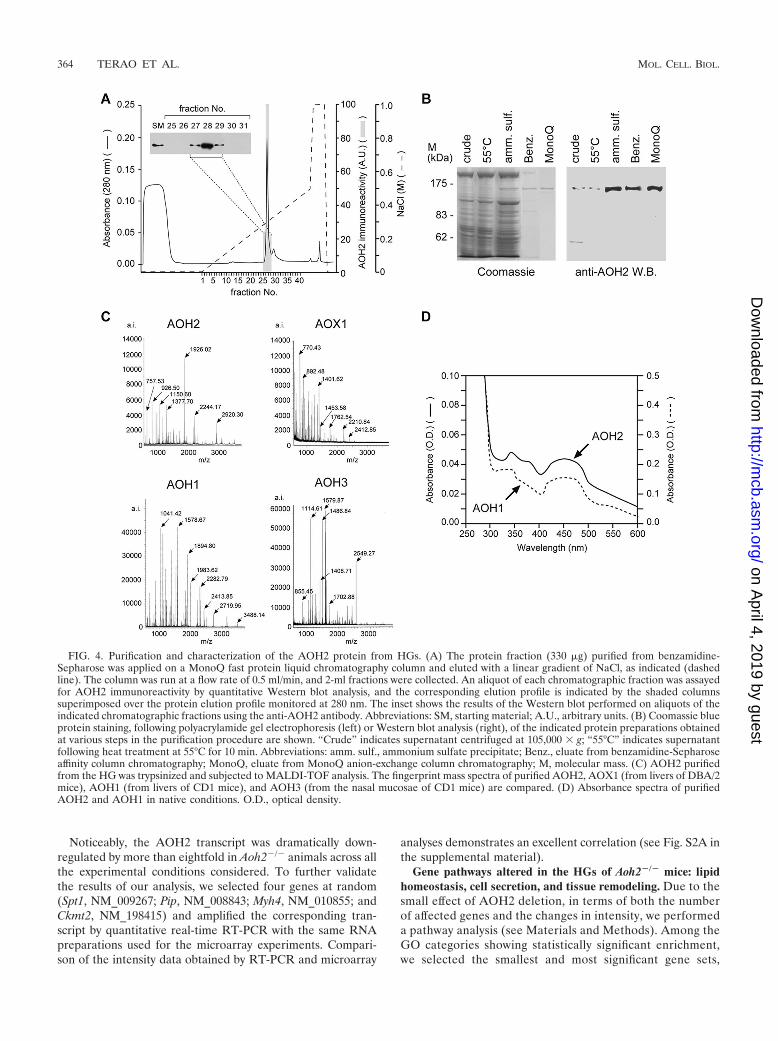
Generation and characterization of animals with knockoutof the Aoh2 gene. To gain insights into the physiological func-tion of AOH2, a specific knockout mouse (Aoh2�/�) was gen-erated. To delete the gene, a plasmid construct targeting exon22 of the mouse Aoh2 gene was introduced into ES cells (Fig.5A). Aoh2�/� founder mice were identified in the F1 progenyby genotyping and subsequently mated to obtain homozygousanimals. The Southern blot analysis performed with 5� and 3�probes confirmed the specific targeting of Aoh2 (Fig. 5B andFig. C). The first generation of Aoh2�/� animals was obtainedby microinjection of 129/Sv-derived ES cells into BDF1-de-rived blastocysts (BDF1 mice are an F1 hybrid of C57BL/6 andDBA/2 mice), and the line was initially expanded in the samestrain of mice. As described above, such a mixed genetic back-ground was inappropriate for our studies on AOH2. For thisreason, we rederived the Aoh2�/� heterozygous founders intothe C57BL/6 background by nine consecutive backcrosses. Theninth-generation animals have a highly homogeneous C57BL/6background, as assessed by microsatellite analysis (data notshown), and were used for all the subsequent studies.
Deletion of Aoh2 exon 22 results in the disappearance of thecorresponding transcript from the HGs of Aoh2�/� animals, asdemonstrated by Northern blot analysis, by use of a full-lengthcDNA and an exon 22-specific probe (Fig. 5D). In the sameexperimental conditions, heterozygotes were characterized byan approximately 50% reduction in the levels of the AOH2transcript, while the HGs and skin of homozygous knockoutmice did not produce any AOH2 transcript or protein (Fig. 5Eand F).
In spite of a complete lack of the molybdoflavoenzyme intarget organs and tissues, Aoh2�/� animals do not show anymacroscopic, structural, functional, or behavioral abnormalitycompared with the corresponding heterozygous and WT coun-terparts. The growth curves of Aoh2�/�, Aoh2�/�, and WTanimals are superimposable. The frequency of the defective
allele transmission is almost Mendelian. Heterozygous matingresulted in the birth of 839 siblings, with 21% Aoh2�/�, 52%Aoh2�/�, and 27% WT animals. The frequency of knockoutmice in the progeny was slightly below the expected 25% (P �0.05 after chi-square test), and the corresponding allele fre-quency in the population was lower than the expected 50%,suggesting a minor survival disadvantage of the animals carry-ing the mutated Aoh2 trait. The numbers of female (424[51%]) and male (415 [49%]) animals were not significantlydifferent, indicating lack of sex biases.
Subtle alterations in the global gene expression profile ofthe Aoh2�/� HG: effect of sex and age. The functional devel-opment of HGs occurs predominantly after birth and is sexu-ally dimorphic in terms of structure, biochemistry, and function(15). With this in mind, we sought for organ abnormalities inAoh2�/� mice of both genders. Although AOH2 is controlledby testosterone during a defined period of the HG postnataldevelopment (Fig. 3C), the protein does not seem to play asignificant role in shaping the architecture of the gland ineither male or female mice. As expected, adult C57BL/6 WTmales were characterized by HGs slightly heavier and largerthan those of females. However, the glands of Aoh2�/� andWT male or female animals do not show any difference inmicroscopic appearance.
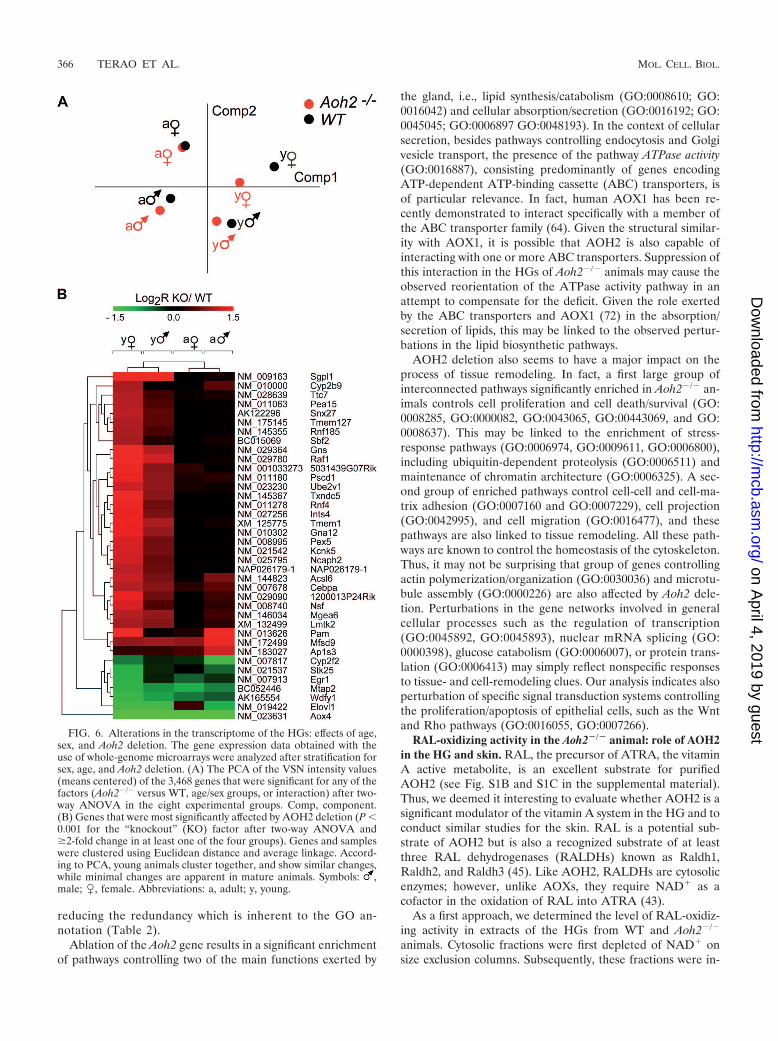
Seeking perturbations of specific biochemical pathways andcellular processes caused by the absence of AOH2, we com-pared the global gene expression profiles in the HGs of WTand Aoh2�/� male and female animals before and after sexualmaturation. Two-way ANOVA of the microarray intensity datawith AOH2 deletion used as the first factor and the fourexperimental groups as the second one resulted in the selectionof 3,468 significantly perturbed genes (see Materials and Meth-ods). PCA of these selected data indicates that there is aremarkable variation of gene expression in the HGs of WTanimals (Fig. 6A). Our results indicate that age is a primarydeterminant of the transcriptome, as indicated by the distanceof the dots. This is in line with the idea that the full functionaldevelopment of the gland occurs predominantly after birth(14). Major differences in the gender-specific complement ofgenes expressed in WT animals are observed as well. While sexand age have a dramatic impact on the variability of geneexpression, the absence of AOH2 has a limited effect.
At the single-gene level, Fig. 6B shows the small number ofgenes up- or downregulated by AOH2 deficiency. Significantly,most of the induced changes are observed in sexually immaturemice. This suggests that AOH2 function is particularly signif-icant during the maturation of HGs. The vast majority of theup- or downregulated genes are the same in both immaturefemale and male animals. Sgpl1 (NM_009163), coding forsphingosine-1-phosphate lyase, is at the top of the list of up-regulated genes. Sgpl1 is involved in the degradation of sphin-gosine-1-phosphate, which regulates the proliferation of mam-malian cells in a negative fashion (61). Ncaph2 (NM_025795)and Raf1 (NM_029780) are other genes involved in the controlof cell proliferation that are upregulated in Aoh2�/� animals.The presence of Acsl6 (NM_144823, coding for acyl coenzymeA synthetase long-chain family member 6) and Elovl1(NM_019422, coding for elongation of very-long-chain fattyacids), whose protein products are involved in lipid biosynthe-sis, is also of interest.
TABLE 1. Purification of AOH2 from HGsa
Stepb Vol(ml)
Proteinamt(mg)
Activity(units)
Sp act(units/mg)
Foldpurification
%Yield
Ultra 22 409 123.9 0.3 1 10055°C 22 245 95.3 0.4 1.3 77PD10 28 112 83.1 0.7 2.3 67Benz. Seph. 15 0.33 NA NA NA NAMonoQ 1.4 0.06 6.2 103.8 346 5
a HGs (3.4 g) were isolated, homogenized in 27 ml of buffer, and ultracentri-fuged to obtain a cytosolic extract, which was processed as indicated. Enzymaticactivity was measured as the ability of the various purification fractions to oxidizeRAL into ATRA. One unit of enzymatic activity is defined as 1 nmol of RALoxidized/min. The results are representative of two separate AOH2 preparations.NA, not applicable.
b Ultra, ultracentrifugation; 55°C, treatment at 55°C; PD10, size exclusioncolumn; Benz. Seph., benzamidine-Sepharose affinity column chromatography;MonoQ, MonoQ anion-exchange column chromatography.
VOL. 29, 2009 Aoh2 KNOCKOUT MOUSE AND RETINOIC ACID SYNTHESIS 363
on April 4, 2019 by guest
http://mcb.asm
.org/D
ownloaded from
Noticeably, the AOH2 transcript was dramatically down-regulated by more than eightfold in Aoh2�/� animals across allthe experimental conditions considered. To further validatethe results of our analysis, we selected four genes at random(Spt1, NM_009267; Pip, NM_008843; Myh4, NM_010855; andCkmt2, NM_198415) and amplified the corresponding tran-script by quantitative real-time RT-PCR with the same RNApreparations used for the microarray experiments. Compari-son of the intensity data obtained by RT-PCR and microarray
analyses demonstrates an excellent correlation (see Fig. S2A inthe supplemental material).
Gene pathways altered in the HGs of Aoh2�/� mice: lipidhomeostasis, cell secretion, and tissue remodeling. Due to thesmall effect of AOH2 deletion, in terms of both the numberof affected genes and the changes in intensity, we performeda pathway analysis (see Materials and Methods). Among theGO categories showing statistically significant enrichment,we selected the smallest and most significant gene sets,
FIG. 4. Purification and characterization of the AOH2 protein from HGs. (A) The protein fraction (330 �g) purified from benzamidine-Sepharose was applied on a MonoQ fast protein liquid chromatography column and eluted with a linear gradient of NaCl, as indicated (dashedline). The column was run at a flow rate of 0.5 ml/min, and 2-ml fractions were collected. An aliquot of each chromatographic fraction was assayedfor AOH2 immunoreactivity by quantitative Western blot analysis, and the corresponding elution profile is indicated by the shaded columnssuperimposed over the protein elution profile monitored at 280 nm. The inset shows the results of the Western blot performed on aliquots of theindicated chromatographic fractions using the anti-AOH2 antibody. Abbreviations: SM, starting material; A.U., arbitrary units. (B) Coomassie blueprotein staining, following polyacrylamide gel electrophoresis (left) or Western blot analysis (right), of the indicated protein preparations obtainedat various steps in the purification procedure are shown. “Crude” indicates supernatant centrifuged at 105,000 � g; “55°C” indicates supernatantfollowing heat treatment at 55°C for 10 min. Abbreviations: amm. sulf., ammonium sulfate precipitate; Benz., eluate from benzamidine-Sepharoseaffinity column chromatography; MonoQ, eluate from MonoQ anion-exchange column chromatography; M, molecular mass. (C) AOH2 purifiedfrom the HG was trypsinized and subjected to MALDI-TOF analysis. The fingerprint mass spectra of purified AOH2, AOX1 (from livers of DBA/2mice), AOH1 (from livers of CD1 mice), and AOH3 (from the nasal mucosae of CD1 mice) are compared. (D) Absorbance spectra of purifiedAOH2 and AOH1 in native conditions. O.D., optical density.
364 TERAO ET AL. MOL. CELL. BIOL.
on April 4, 2019 by guest
http://mcb.asm
.org/D
ownloaded from
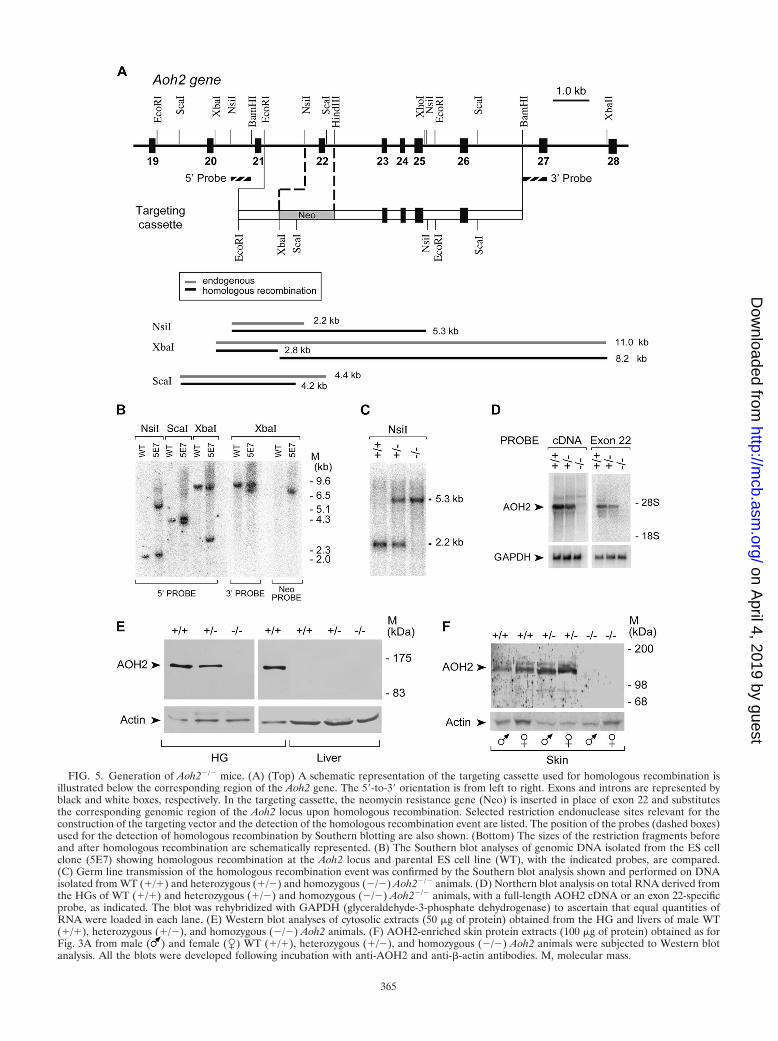
FIG. 5. Generation of Aoh2�/� mice. (A) (Top) A schematic representation of the targeting cassette used for homologous recombination isillustrated below the corresponding region of the Aoh2 gene. The 5�-to-3� orientation is from left to right. Exons and introns are represented byblack and white boxes, respectively. In the targeting cassette, the neomycin resistance gene (Neo) is inserted in place of exon 22 and substitutesthe corresponding genomic region of the Aoh2 locus upon homologous recombination. Selected restriction endonuclease sites relevant for theconstruction of the targeting vector and the detection of the homologous recombination event are listed. The position of the probes (dashed boxes)used for the detection of homologous recombination by Southern blotting are also shown. (Bottom) The sizes of the restriction fragments beforeand after homologous recombination are schematically represented. (B) The Southern blot analyses of genomic DNA isolated from the ES cellclone (5E7) showing homologous recombination at the Aoh2 locus and parental ES cell line (WT), with the indicated probes, are compared.(C) Germ line transmission of the homologous recombination event was confirmed by the Southern blot analysis shown and performed on DNAisolated from WT (�/�) and heterozygous (�/�) and homozygous (�/�) Aoh2�/� animals. (D) Northern blot analysis on total RNA derived fromthe HGs of WT (�/�) and heterozygous (�/�) and homozygous (�/�) Aoh2�/� animals, with a full-length AOH2 cDNA or an exon 22-specificprobe, as indicated. The blot was rehybridized with GAPDH (glyceraldehyde-3-phosphate dehydrogenase) to ascertain that equal quantities ofRNA were loaded in each lane. (E) Western blot analyses of cytosolic extracts (50 �g of protein) obtained from the HG and livers of male WT(�/�), heterozygous (�/�), and homozygous (�/�) Aoh2 animals. (F) AOH2-enriched skin protein extracts (100 �g of protein) obtained as forFig. 3A from male ( ) and female (�) WT (�/�), heterozygous (�/�), and homozygous (�/�) Aoh2 animals were subjected to Western blotanalysis. All the blots were developed following incubation with anti-AOH2 and anti-�-actin antibodies. M, molecular mass.
365
on April 4, 2019 by guest
http://mcb.asm
.org/D
ownloaded from
reducing the redundancy which is inherent to the GO an-notation (Table 2).
Ablation of the Aoh2 gene results in a significant enrichmentof pathways controlling two of the main functions exerted by
the gland, i.e., lipid synthesis/catabolism (GO:0008610; GO:0016042) and cellular absorption/secretion (GO:0016192; GO:0045045; GO:0006897 GO:0048193). In the context of cellularsecretion, besides pathways controlling endocytosis and Golgivesicle transport, the presence of the pathway ATPase activity(GO:0016887), consisting predominantly of genes encodingATP-dependent ATP-binding cassette (ABC) transporters, isof particular relevance. In fact, human AOX1 has been re-cently demonstrated to interact specifically with a member ofthe ABC transporter family (64). Given the structural similar-ity with AOX1, it is possible that AOH2 is also capable ofinteracting with one or more ABC transporters. Suppression ofthis interaction in the HGs of Aoh2�/� animals may cause theobserved reorientation of the ATPase activity pathway in anattempt to compensate for the deficit. Given the role exertedby the ABC transporters and AOX1 (72) in the absorption/secretion of lipids, this may be linked to the observed pertur-bations in the lipid biosynthetic pathways.
AOH2 deletion also seems to have a major impact on theprocess of tissue remodeling. In fact, a first large group ofinterconnected pathways significantly enriched in Aoh2�/� an-imals controls cell proliferation and cell death/survival (GO:0008285, GO:0000082, GO:0043065, GO:00443069, and GO:0008637). This may be linked to the enrichment of stress-response pathways (GO:0006974, GO:0009611, GO:0006800),including ubiquitin-dependent proteolysis (GO:0006511) andmaintenance of chromatin architecture (GO:0006325). A sec-ond group of enriched pathways control cell-cell and cell-ma-trix adhesion (GO:0007160 and GO:0007229), cell projection(GO:0042995), and cell migration (GO:0016477), and thesepathways are also linked to tissue remodeling. All these path-ways are known to control the homeostasis of the cytoskeleton.Thus, it may not be surprising that group of genes controllingactin polymerization/organization (GO:0030036) and microtu-bule assembly (GO:0000226) are also affected by Aoh2 dele-tion. Perturbations in the gene networks involved in generalcellular processes such as the regulation of transcription(GO:0045892, GO:0045893), nuclear mRNA splicing (GO:0000398), glucose catabolism (GO:0006007), or protein trans-lation (GO:0006413) may simply reflect nonspecific responsesto tissue- and cell-remodeling clues. Our analysis indicates alsoperturbation of specific signal transduction systems controllingthe proliferation/apoptosis of epithelial cells, such as the Wntand Rho pathways (GO:0016055, GO:0007266).
RAL-oxidizing activity in the Aoh2�/� animal: role of AOH2in the HG and skin. RAL, the precursor of ATRA, the vitaminA active metabolite, is an excellent substrate for purifiedAOH2 (see Fig. S1B and S1C in the supplemental material).Thus, we deemed it interesting to evaluate whether AOH2 is asignificant modulator of the vitamin A system in the HG and toconduct similar studies for the skin. RAL is a potential sub-strate of AOH2 but is also a recognized substrate of at leastthree RAL dehydrogenases (RALDHs) known as Raldh1,Raldh2, and Raldh3 (45). Like AOH2, RALDHs are cytosolicenzymes; however, unlike AOXs, they require NAD� as acofactor in the oxidation of RAL into ATRA (43).
As a first approach, we determined the level of RAL-oxidiz-ing activity in extracts of the HGs from WT and Aoh2�/�
animals. Cytosolic fractions were first depleted of NAD� onsize exclusion columns. Subsequently, these fractions were in-
FIG. 6. Alterations in the transcriptome of the HGs: effects of age,sex, and Aoh2 deletion. The gene expression data obtained with theuse of whole-genome microarrays were analyzed after stratification forsex, age, and Aoh2 deletion. (A) The PCA of the VSN intensity values(means centered) of the 3,468 genes that were significant for any of thefactors (Aoh2�/� versus WT, age/sex groups, or interaction) after two-way ANOVA in the eight experimental groups. Comp, component.(B) Genes that were most significantly affected by AOH2 deletion (P �0.001 for the “knockout” (KO) factor after two-way ANOVA and�2-fold change in at least one of the four groups). Genes and sampleswere clustered using Euclidean distance and average linkage. Accord-ing to PCA, young animals cluster together, and show similar changes,while minimal changes are apparent in mature animals. Symbols: ,male; �, female. Abbreviations: a, adult; y, young.
366 TERAO ET AL. MOL. CELL. BIOL.
on April 4, 2019 by guest
http://mcb.asm
.org/D
ownloaded from
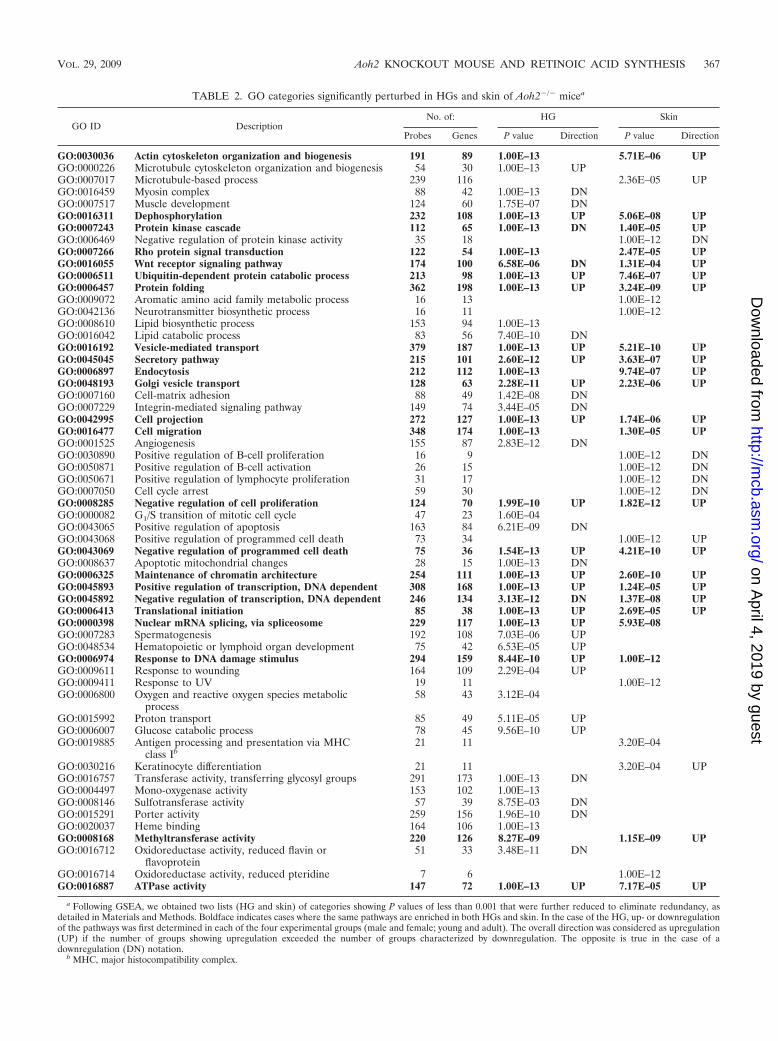
TABLE 2. GO categories significantly perturbed in HGs and skin of Aoh2�/� micea
GO ID DescriptionNo. of: HG Skin
Probes Genes P value Direction P value Direction
GO:0030036 Actin cytoskeleton organization and biogenesis 191 89 1.00E–13 5.71E–06 UPGO:0000226 Microtubule cytoskeleton organization and biogenesis 54 30 1.00E–13 UPGO:0007017 Microtubule-based process 239 116 2.36E–05 UPGO:0016459 Myosin complex 88 42 1.00E–13 DNGO:0007517 Muscle development 124 60 1.75E–07 DNGO:0016311 Dephosphorylation 232 108 1.00E–13 UP 5.06E–08 UPGO:0007243 Protein kinase cascade 112 65 1.00E–13 DN 1.40E–05 UPGO:0006469 Negative regulation of protein kinase activity 35 18 1.00E–12 DNGO:0007266 Rho protein signal transduction 122 54 1.00E–13 2.47E–05 UPGO:0016055 Wnt receptor signaling pathway 174 100 6.58E–06 DN 1.31E–04 UPGO:0006511 Ubiquitin-dependent protein catabolic process 213 98 1.00E–13 UP 7.46E–07 UPGO:0006457 Protein folding 362 198 1.00E–13 UP 3.24E–09 UPGO:0009072 Aromatic amino acid family metabolic process 16 13 1.00E–12GO:0042136 Neurotransmitter biosynthetic process 16 11 1.00E–12GO:0008610 Lipid biosynthetic process 153 94 1.00E–13GO:0016042 Lipid catabolic process 83 56 7.40E–10 DNGO:0016192 Vesicle-mediated transport 379 187 1.00E–13 UP 5.21E–10 UPGO:0045045 Secretory pathway 215 101 2.60E–12 UP 3.63E–07 UPGO:0006897 Endocytosis 212 112 1.00E–13 9.74E–07 UPGO:0048193 Golgi vesicle transport 128 63 2.28E–11 UP 2.23E–06 UPGO:0007160 Cell-matrix adhesion 88 49 1.42E–08 DNGO:0007229 Integrin-mediated signaling pathway 149 74 3.44E–05 DNGO:0042995 Cell projection 272 127 1.00E–13 UP 1.74E–06 UPGO:0016477 Cell migration 348 174 1.00E–13 1.30E–05 UPGO:0001525 Angiogenesis 155 87 2.83E–12 DNGO:0030890 Positive regulation of B-cell proliferation 16 9 1.00E–12 DNGO:0050871 Positive regulation of B-cell activation 26 15 1.00E–12 DNGO:0050671 Positive regulation of lymphocyte proliferation 31 17 1.00E–12 DNGO:0007050 Cell cycle arrest 59 30 1.00E–12 DNGO:0008285 Negative regulation of cell proliferation 124 70 1.99E–10 UP 1.82E–12 UPGO:0000082 G1/S transition of mitotic cell cycle 47 23 1.60E–04GO:0043065 Positive regulation of apoptosis 163 84 6.21E–09 DNGO:0043068 Positive regulation of programmed cell death 73 34 1.00E–12 UPGO:0043069 Negative regulation of programmed cell death 75 36 1.54E–13 UP 4.21E–10 UPGO:0008637 Apoptotic mitochondrial changes 28 15 1.00E–13 DNGO:0006325 Maintenance of chromatin architecture 254 111 1.00E–13 UP 2.60E–10 UPGO:0045893 Positive regulation of transcription, DNA dependent 308 168 1.00E–13 UP 1.24E–05 UPGO:0045892 Negative regulation of transcription, DNA dependent 246 134 3.13E–12 DN 1.37E–08 UPGO:0006413 Translational initiation 85 38 1.00E–13 UP 2.69E–05 UPGO:0000398 Nuclear mRNA splicing, via spliceosome 229 117 1.00E–13 UP 5.93E–08GO:0007283 Spermatogenesis 192 108 7.03E–06 UPGO:0048534 Hematopoietic or lymphoid organ development 75 42 6.53E–05 UPGO:0006974 Response to DNA damage stimulus 294 159 8.44E–10 UP 1.00E–12GO:0009611 Response to wounding 164 109 2.29E–04 UPGO:0009411 Response to UV 19 11 1.00E–12GO:0006800 Oxygen and reactive oxygen species metabolic
process58 43 3.12E–04
GO:0015992 Proton transport 85 49 5.11E–05 UPGO:0006007 Glucose catabolic process 78 45 9.56E–10 UPGO:0019885 Antigen processing and presentation via MHC
class Ib21 11 3.20E–04
GO:0030216 Keratinocyte differentiation 21 11 3.20E–04 UPGO:0016757 Transferase activity, transferring glycosyl groups 291 173 1.00E–13 DNGO:0004497 Mono-oxygenase activity 153 102 1.00E–13GO:0008146 Sulfotransferase activity 57 39 8.75E–03 DNGO:0015291 Porter activity 259 156 1.96E–10 DNGO:0020037 Heme binding 164 106 1.00E–13GO:0008168 Methyltransferase activity 220 126 8.27E–09 1.15E–09 UPGO:0016712 Oxidoreductase activity, reduced flavin or
flavoprotein51 33 3.48E–11 DN
GO:0016714 Oxidoreductase activity, reduced pteridine 7 6 1.00E–12GO:0016887 ATPase activity 147 72 1.00E–13 UP 7.17E–05 UP
a Following GSEA, we obtained two lists (HG and skin) of categories showing P values of less than 0.001 that were further reduced to eliminate redundancy, asdetailed in Materials and Methods. Boldface indicates cases where the same pathways are enriched in both HGs and skin. In the case of the HG, up- or downregulationof the pathways was first determined in each of the four experimental groups (male and female; young and adult). The overall direction was considered as upregulation(UP) if the number of groups showing upregulation exceeded the number of groups characterized by downregulation. The opposite is true in the case of adownregulation (DN) notation.
b MHC, major histocompatibility complex.
VOL. 29, 2009 Aoh2 KNOCKOUT MOUSE AND RETINOIC ACID SYNTHESIS 367
on April 4, 2019 by guest
http://mcb.asm
.org/D
ownloaded from

cubated with RAL before and after readdition of the nicotin-amide cofactor (Fig. 7A). We used liver extracts, which do notcontain AOH2, as a comparison for our studies. In the HGs ofWT animals, almost all the cytosolic RAL-oxidizing activity didnot require NAD� and was due to AOH2. In fact, RAL-oxidizing activity was at the limit of detection in both NAD�-depleted and NAD�-repleted cytosolic extracts from the HGsof Aoh2�/� mice. Similar results were obtained with a conven-tional HPLC methodol (Fig. 7A) and a sensitive MS method(data not shown).
The same methodological approach was used for skin cyto-solic extracts. In the absence of NAD�, this tissue containsRAL-metabolizing activity approximately sevenfold lower thanthat seen for the HG, and the enzymatic activity can be mea-sured only by MS. The readdition of NAD� causes an approx-imate and consistent 20% increase in RAL-oxidizing activity.This indicates that approximately 80% of the RAL trans-formed into ATRA is due to NAD�-independent RAL oxi-dase(s). However, only 20% of this NAD�-independent activ-ity, which amounts to approximately 1 to 1.5 pmol/min/mg ofprotein, is due to AOH2, as indicated by the results obtainedwith the skin of Aoh2�/� mice. The remaining activity is likelyto be contributed by the AOX1 isoenzyme, as determined forthe skin by Western blot analysis (Fig. 8A).
The liver is the tissue that contains the highest levels ofRAL-oxidizing activity by far. Approximately 85% of the totalactivity is NAD� dependent, indicating that RALDHs contrib-ute the majority of RAL-oxidizing activity (43). In line with theabsence of AOH2 protein in this organ (Fig. 2), hepatic ex-tracts of WT and Aoh2�/� mice are characterized by similaramounts and proportions of NAD�-dependent and NAD�-independent RAL-metabolizing activity. Our observations in-dicate that AOH2 is the major RAL-metabolizing activity inthe HG and contributes a significant amount of the sameactivity in the skin. The data presented were obtained fromfemale animals, and similar results were observed for the malecounterparts (data not shown).
We established the relevance of AOH2 for the oxidation ofRAL in the whole organism by using sexually mature WT andAoh2�/� mice. To this purpose, we set up a sensitive andspecific MS method for the determination of RAL and ATRA.Figure S3 in the supplemental material contains representativechromatograms illustrating the amounts of RAL and ATRA inthe HG. As illustrated in Fig. 7B, the glands of Aoh2�/� ani-mals contain significantly lower amounts of ATRA than theWT counterparts. The absolute amounts of RAL in the HGare approximately 10-fold lower than the correspondingATRA values and often at the detection limits of the assay.Nevertheless, in the same cohort used for the determination ofRAL, we observed that Aoh2�/� animals were characterizedby levels of RAL higher than those seen for WT mice. This isconsistent with a significant role of AOH2 in the oxidation ofRAL into ATRA.
We evaluated whether the observed effect could be gener-alized to the skin. Even in this second AOH2 target tissue, thecontent of ATRA is inferior in Aoh2�/� animals compared tothat in WT animals. RAL in this organ is always below thedetection limit. Noticeably, despite significant differences inthe overall contributions of AOH2 to the total RAL-metabo-
lizing activity in the skin and HG, the diminutions of ATRA inboth organs are of the same order of magnitude.
ATRA controls the activity of numerous genes via interac-tion with specific nuclear receptors, which act as ligand-depen-dent transcription factors (18). However, only a limited set ofretinoid-responsive genes are established and direct targets(5). The expression profile of this set of 29 genes was evaluatedin the HGs of WT and Aoh2�/� mice by use of the microarraydata set. We assessed the enrichment for the retinoid receptorsignaling pathway in the four experimental groups of youngand adult male or female Aoh2�/� animals. PCA demon-strated a clear separation of the dots corresponding toAoh2�/� and WT animals regardless of the stratification forsex and age (Fig. 7C). Relative to the WT counterparts, asignificant downregulation of the entire pathway (P � 0.02)was observed for female mice as well as for sexually matureAoh2�/� male animals (Fig. 7D). The two genes whose levelswere reduced most significantly in knockout relative to WTanimals are Egr1 (early growth response 1) and the gene forthe ATRA-catabolizing enzyme Cyp26b1 (cytochrome P450 26b1). The expression of the two genes was evaluated by PCRanalysis of the corresponding transcripts (see Fig. S2B in thesupplemental material). This independent analysis confirmedthe results obtained with the microarrays.
Substantial alterations in the global gene expression profileof the Aoh2�/� skin. Potential alterations in the skin transcrip-tome of the Aoh2�/� mice were studied only for sexually ma-ture females to avoid variability due to age. The overall effectof AOH2 deletion in this organ was quantitatively more pro-nounced than that seen for the HG. As shown in Table 3), thedeletion of AOH2 caused upregulation of a relatively largenumber of genes (68 genes were upregulated twofold or more;P � 0.005), while the number of downregulated genes (24genes were downregulated twofold or more; P � 0.005) waslimited. The physiological function of a substantial fraction ofgenes (37%) is unknown or ill defined.
The top upregulated gene is Mtap2 (AK048375), whichcodes for an uncharacterized microtubule-associated protein.Second on the list is Rps18 (AK018004), which is an 18S ribo-somal protein. A substantial increase in two genes involved inlipid biosynthesis, Elovl7 (NM_029001; elongation of long chainfatty acids) and Lpgat1 (NM_172266; lysophosphatidylglycerolacyltransferase 1), is also remarkable. In line with alterations inthe pathways controlling chromatin architecture (GO:0006325;Table 2) and Wnt signaling (GO:0016055) in both the skin andHG, the expression of two histone genes, Hist1h2a1 andHisth2af (NM_178182 and NM_175661), as well as that ofFzd10 (NM_175284; Wnt frizzled receptor), is augmented two-to threefold. Upregulation of the Sfn gene (NM_018754; strati-fin) (34) is interesting, as the protein controls the keratinocyteproliferation/differentiation switch (56) and may be involved inthe epidermal hypertrophy observed for Aoh2�/� mice (seebelow). Two genes suggesting that AOH2 deficiency is associ-ated with alterations of the secretory phenotype not only in theHG but also in the skin are Fgd1 (NM_008001) and Sft2dr(XM_484715). FGD1 is a Rho GTPase exchange factor whosedeficit is at the basis of X-linked faciogenital dysplasia (24, 30).SFT2 is thought to be involved in vesicular transport in theGolgi compartment (21). Another gene of interest for its po-tential link to AOXs (64) in the same group is Abcd2
368 TERAO ET AL. MOL. CELL. BIOL.
on April 4, 2019 by guest
http://mcb.asm
.org/D
ownloaded from

FIG. 7. AOH2-dependent oxidation of RAL in the HG and skin: effects on RAL/ATRA levels in vivo and gene expression correlates.(A) Cytosolic extracts were isolated from the indicated tissues of WT and Aoh2�/� mice depleted of NAD� by use of NAP-5 columns (GEHealthcare) and used to determine RAL-oxidizing activity in the absence or presence of readded nicotinamide cofactor. Each value is the mean �standard deviation (SD) for three replicates. **, significantly different according to Student’s t test (P � 0.01). The results are representative ofat least two independent experiments performed on tissues from different batches of animals. (B) The amounts of RAL and ATRA weredetermined by LC-MS with the indicated tissues of WT and Aoh2�/� animals. Each value is the mean � SD for four (RAL and HG) or eight(ATRA, HG, and skin) individual animals. **, significantly different according to Student’s t test (P � 0.01). (C) Gene expression pattern of theretinoid-dependent genes in the HG. PCA of the VSN intensity values (means centered) in the eight experimental groups. Comp, component.(D) Heat map of the whole set of genes. The P values (upregulation [UP], downregulation [DN], or general significance in boldface) reportedbelow the heat map refer to the GSEA, as described in Materials and Methods. This analysis was performed to demonstrate the prevalence of adecrease in the expression of retinoid-responsive genes (green boxes). Symbols: , male; �, female. Abbreviations: a, adult; y, young; KO,knockout.
VOL. 29, 2009 Aoh2 KNOCKOUT MOUSE AND RETINOIC ACID SYNTHESIS 369
on April 4, 2019 by guest
http://mcb.asm
.org/D
ownloaded from
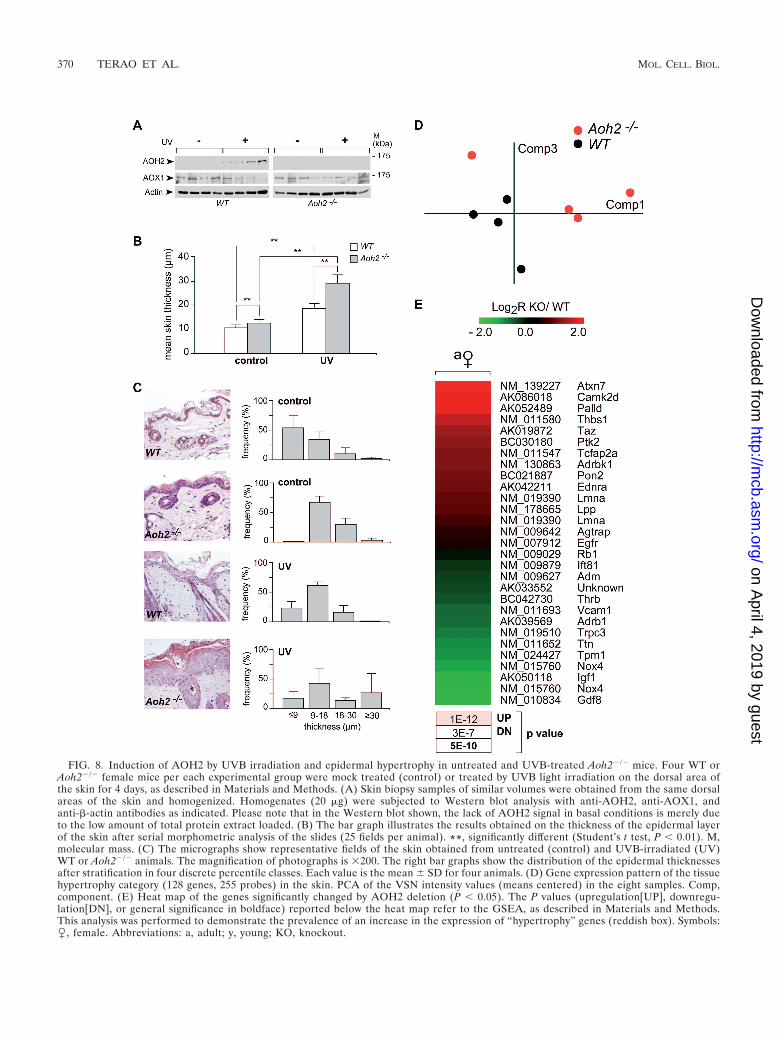
FIG. 8. Induction of AOH2 by UVB irradiation and epidermal hypertrophy in untreated and UVB-treated Aoh2�/� mice. Four WT orAoh2�/� female mice per each experimental group were mock treated (control) or treated by UVB light irradiation on the dorsal area ofthe skin for 4 days, as described in Materials and Methods. (A) Skin biopsy samples of similar volumes were obtained from the same dorsalareas of the skin and homogenized. Homogenates (20 �g) were subjected to Western blot analysis with anti-AOH2, anti-AOX1, andanti-�-actin antibodies as indicated. Please note that in the Western blot shown, the lack of AOH2 signal in basal conditions is merely dueto the low amount of total protein extract loaded. (B) The bar graph illustrates the results obtained on the thickness of the epidermal layerof the skin after serial morphometric analysis of the slides (25 fields per animal). **, significantly different (Student’s t test, P � 0.01). M,molecular mass. (C) The micrographs show representative fields of the skin obtained from untreated (control) and UVB-irradiated (UV)WT or Aoh2�/� animals. The magnification of photographs is �200. The right bar graphs show the distribution of the epidermal thicknessesafter stratification in four discrete percentile classes. Each value is the mean � SD for four animals. (D) Gene expression pattern of the tissuehypertrophy category (128 genes, 255 probes) in the skin. PCA of the VSN intensity values (means centered) in the eight samples. Comp,component. (E) Heat map of the genes significantly changed by AOH2 deletion (P � 0.05). The P values (upregulation[UP], downregu-lation[DN], or general significance in boldface) reported below the heat map refer to the GSEA, as described in Materials and Methods.This analysis was performed to demonstrate the prevalence of an increase in the expression of “hypertrophy” genes (reddish box). Symbols:�, female. Abbreviations: a, adult; y, young; KO, knockout.
370 TERAO ET AL. MOL. CELL. BIOL.
on April 4, 2019 by guest
http://mcb.asm
.org/D
ownloaded from
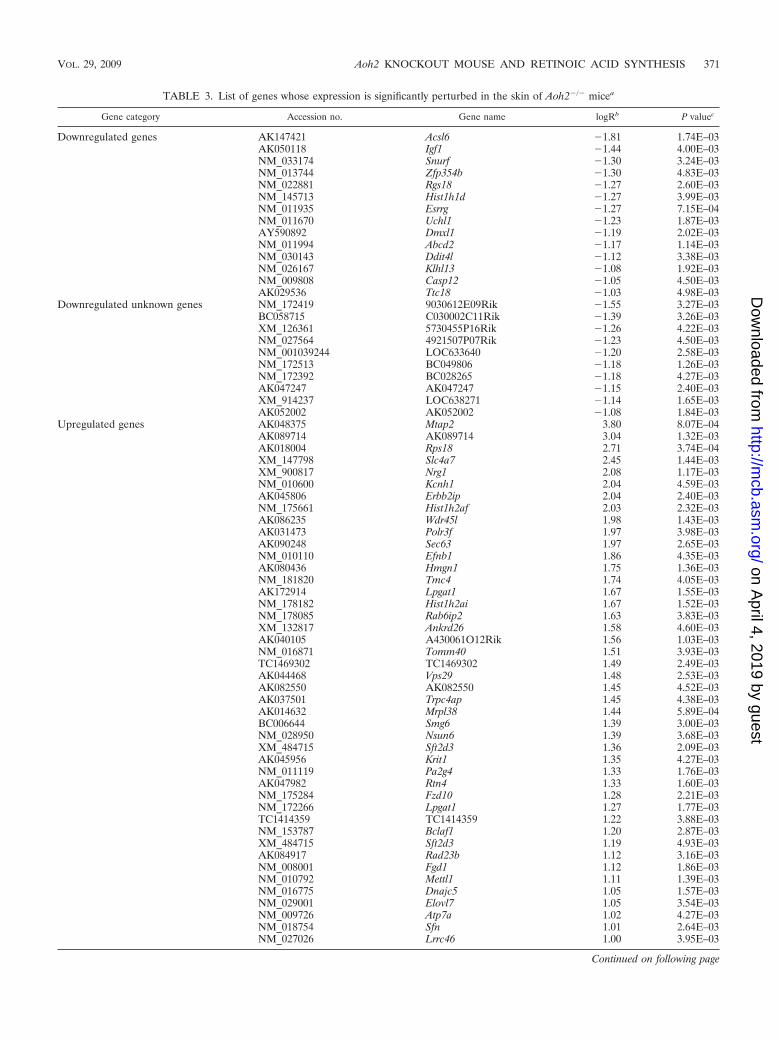
TABLE 3. List of genes whose expression is significantly perturbed in the skin of Aoh2�/� micea
Gene category Accession no. Gene name logRb P valuec
Downregulated genes AK147421 Acsl6 �1.81 1.74E–03AK050118 Igf1 �1.44 4.00E–03NM_033174 Snurf �1.30 3.24E–03NM_013744 Zfp354b �1.30 4.83E–03NM_022881 Rgs18 �1.27 2.60E–03NM_145713 Hist1h1d �1.27 3.99E–03NM_011935 Esrrg �1.27 7.15E–04NM_011670 Uchl1 �1.23 1.87E–03AY590892 Dmxl1 �1.19 2.02E–03NM_011994 Abcd2 �1.17 1.14E–03NM_030143 Ddit4l �1.12 3.38E–03NM_026167 Klhl13 �1.08 1.92E–03NM_009808 Casp12 �1.05 4.50E–03AK029536 Ttc18 �1.03 4.98E–03
Downregulated unknown genes NM_172419 9030612E09Rik �1.55 3.27E–03BC058715 C030002C11Rik �1.39 3.26E–03XM_126361 5730455P16Rik �1.26 4.22E–03NM_027564 4921507P07Rik �1.23 4.50E–03NM_001039244 LOC633640 �1.20 2.58E–03NM_172513 BC049806 �1.18 1.26E–03NM_172392 BC028265 �1.18 4.27E–03AK047247 AK047247 �1.15 2.40E–03XM_914237 LOC638271 �1.14 1.65E–03AK052002 AK052002 �1.08 1.84E–03
Upregulated genes AK048375 Mtap2 3.80 8.07E–04AK089714 AK089714 3.04 1.32E–03AK018004 Rps18 2.71 3.74E–04XM_147798 Slc4a7 2.45 1.44E–03XM_900817 Nrg1 2.08 1.17E–03NM_010600 Kcnh1 2.04 4.59E–03AK045806 Erbb2ip 2.04 2.40E–03NM_175661 Hist1h2af 2.03 2.32E–03AK086235 Wdr45l 1.98 1.43E–03AK031473 Polr3f 1.97 3.98E–03AK090248 Sec63 1.97 2.65E–03NM_010110 Efnb1 1.86 4.35E–03AK080436 Hmgn1 1.75 1.36E–03NM_181820 Tmc4 1.74 4.05E–03AK172914 Lpgat1 1.67 1.55E–03NM_178182 Hist1h2ai 1.67 1.52E–03NM_178085 Rab6ip2 1.63 3.83E–03XM_132817 Ankrd26 1.58 4.60E–03AK040105 A430061O12Rik 1.56 1.03E–03NM_016871 Tomm40 1.51 3.93E–03TC1469302 TC1469302 1.49 2.49E–03AK044468 Vps29 1.48 2.53E–03AK082550 AK082550 1.45 4.52E–03AK037501 Trpc4ap 1.45 4.38E–03AK014632 Mrpl38 1.44 5.89E–04BC006644 Smg6 1.39 3.00E–03NM_028950 Nsun6 1.39 3.68E–03XM_484715 Sft2d3 1.36 2.09E–03AK045956 Krit1 1.35 4.27E–03NM_011119 Pa2g4 1.33 1.76E–03AK047982 Rtn4 1.33 1.60E–03NM_175284 Fzd10 1.28 2.21E–03NM_172266 Lpgat1 1.27 1.77E–03TC1414359 TC1414359 1.22 3.88E–03NM_153787 Bclaf1 1.20 2.87E–03XM_484715 Sft2d3 1.19 4.93E–03AK084917 Rad23b 1.12 3.16E–03NM_008001 Fgd1 1.12 1.86E–03NM_010792 Mettl1 1.11 1.39E–03NM_016775 Dnajc5 1.05 1.57E–03NM_029001 Elovl7 1.05 3.54E–03NM_009726 Atp7a 1.02 4.27E–03NM_018754 Sfn 1.01 2.64E–03NM_027026 Lrrc46 1.00 3.95E–03
Continued on following page
VOL. 29, 2009 Aoh2 KNOCKOUT MOUSE AND RETINOIC ACID SYNTHESIS 371
on April 4, 2019 by guest
http://mcb.asm
.org/D
ownloaded from

(NM_011994), which is significantly downregulated and codesfor a transporter protein belonging to the ABC transporterfamily.
Gene pathways altered in the skin of Aoh2�/� mice: simi-larities and differences with the HG. The same pathway anal-ysis performed on the transcriptome of HGs was carried outwith the skin data set (Table 2). In Aoh2�/� mice, we lookedfor the enrichment of pathways unique to the skin or in com-mon with the HG. Out of the 59 pathways, 13 are specific forthe skin (22%) and 23 (39%) are common to both. Among thecommon pathways, 13 are concordantly upregulated. As to thefirst group, we observed significant enrichment and an overallupregulation of the pathway controlling keratinocyte differen-tiation (GO:0030216). Overall downregulation of pathways in-volved in lymphocyte proliferation (GO:0050671), B-cell re-sponses (GO:0030890; GO:0050871), and antigen presentationvia major histocompatibility complex (GO:0019885) is also ev-ident. Upregulation of the response to UV (GO:0009411) is ofparticular interest for the UV-irradiation-dependent pheno-type observed in the skin of Aoh2�/� mice (see the next sec-tion).
As to the pathways in common between the skin and HG,Rho and Wnt signal transduction (GO:0007266, GO:0016055),vesicular trafficking (GO:0016192, GO:0045045, GO:0006897,GO:0048193), and ATPase activity (GO:0016887), consistingpredominantly of ABC transporters, are of relevance. Al-though the observed enrichment of pathways like positive reg-ulation of programmed cell death (GO:00043068) and micro-tubule-based process (GO:0007017) are listed as specific to theskin, they are linked to similar pathways also altered in the HG(GO:0043065 and GO:0000226). Along with the commonpathways controlling cell projection and migration (GO:
0042995 and GO:0016477), they may reflect tissue-remodelingprocesses accompanying epidermal hypertrophy.
Epidermal hypertrophy in the Aoh2�/� animal and geneexpression correlates. Subchronic UVB irradiation of the skinis accompanied by induction of the AOH2 protein in WTanimals (Fig. 8A). Induction is specific to AOH2, as expressionof AOX1, the other AOX present in the skin, is not modifiedin the same experimental conditions. In addition, the elevationof AOH2 is due to direct exposure to UV light, as the levels ofthe protein are left unaffected in the HGs of irradiated animals(data not shown). All this indicates that induction of AOH2 ispart of the response to UV activated in the skin. With this inmind, we studied the histological appearance of the tissue inAoh2�/� animals not only under basal conditions but also aftersubchronic exposure to UV light. The UV experiments werealso prompted by the microarray results shown in Table 2indicating enrichment of the UV response pathway in the skinof Aoh2�/� mice.
Serial morphometric analysis of tissue sections obtained forbasal conditions indicates that the overall thickness of theepidermal layer is significantly augmented in Aoh2�/� animalsrelative to what was seen for WT animals (Fig. 8B). The mi-crographs shown illustrate the point in two representativefields obtained from the dorsal skin (Fig. 8C, left). As theepidermal layer is heterogeneous and its thickness is positiondependent, we looked at the distribution of the parameter in alarge number of sections. In Aoh2�/� animals, we observed ashift toward the second and third quartiles of the epidermalthickness distribution (Fig. 8C, right). As expected, UV irra-diation of WT animals results in a remarkable thickening notonly of the epidermal but also of the dermal component of theskin (data not shown). A quantitative assessment of the in-
TABLE 3—Continued
Gene category Accession no. Gene name logRb P valuec
Upregulated unknown genes XM_912173 LOC636687 2.83 1.26E–03BC090402 BC090402 2.30 1.71E–03AK081758 B930068K11Rik 2.13 3.02E–03TC1477839 TC1477839 2.13 4.32E–03TC1522673 TC1522673 1.96 3.32E–03AK220358 9130404D08Rik 1.79 1.71E–03BC028769 6030458C11Rik 1.71 3.16E–03AK084691 AK084691 1.68 4.50E–03TC1533348 TC1533348 1.65 1.14E–03AK164650 5530601H04Rik 1.59 1.54E–03AK014787 4833428M15Rik 1.59 3.48E–03ENSMUST00000024982 ENSMUST00000024982 1.58 1.27E–03AK049426 AK049426 1.48 4.37E–03NM_177271 E130306M17Rik 1.46 4.24E–03AK081612 9130404D08Rik 1.46 3.08E–03AK011948 AK011948 1.43 9.84E–04AK036075 AK036075 1.42 2.90E–03AK013536 3010026O09Rik 1.38 2.09E–03NM_027561 4632415L05Rik 1.31 1.31E–03XM_923365 D430007A19Rik 1.23 3.08E–03NM_001012326 LOC433762 1.18 1.17E–03AK049476 C430014M02Rik 1.09 2.81E–03XM_130548 2610101J03Rik 1.04 3.13E–03AK079466 A030007N12Rik 1.00 2.67E–03
a List of the genes significantly up- or downregulated in the skin of Aoh2�/� mice after analysis of the gene expression microarray results (P � 0.05; 2-fold change).b logR is the log2 ratio (Aoh2�/� versus WT mice) of the mean values for four individual pairs of animals.c P values indicate the statistical significance of each determination.
372 TERAO ET AL. MOL. CELL. BIOL.
on April 4, 2019 by guest
http://mcb.asm
.org/D
ownloaded from

creased thickness of the epidermal layer is shown by the cor-responding distribution graph. UV radiation-dependent thick-ening of the epidermis is enhanced in Aoh2�/� animals. In fact,the distribution graph shows a dramatic increase in the numberof sections falling in the upper quartile.
Taken together, these results indicate that AOH2 acts as anegative modulator of the epidermal trophism. With respect tothis, pathway analysis of the skin microarray data, with the useof the Metacore “diseases” lists rather than GO categories,resulted in the discovery of an interesting gene expressioncorrelate. The top hit after comparison of the Aoh2�/� andWT datasets was the “ tissue hypertrophy” category (128genes, 255 probes). PCA of the genes contained in this cate-gory showed a clear separation between the Aoh2�/� and WTexperimental samples (Fig. 8D). The heat map of the 29 indi-vidual genes whose expression is significantly altered as a con-sequence of AOH2 deletion shows a prevalence of upregulatedgenes (Fig. 8E). Most of the genes in the group have beenstudied in detail for their significance in myocardial hypertro-phy. However, they may also exert a similar role in the epider-mis, as their expression profile based on expressed sequencetag counts indicate that many of them are represented in theskin (UniGene resource at NCBI; http://www.ncbi.nlm.nih.gov/UniGene). Only a limited number of the corresponding pro-tein products whose expression is significantly altered inAoh2�/� mice will be considered. Ataxin 7 (Atxn7) coding fora relatively ubiquitous protein, is at the top of the list ofupregulated genes. Members of the ataxin family have recentlybeen linked to tissue regeneration and epithelial cell repair inseveral organs, including the skin (52). The gene for the 2dform of calcium-calmodulin-dependent kinase II (CaMKII2d),a strong inducer of cardiac hypertrophy (19), may controlkeratinocyte proliferation and differentiation, which are calcium-dependent processes. As to thrombospondin 1 (Thbs1), upregu-lation in Aoh2�/� mice may have an indirect role on epidermalhypertrophy, as the corresponding protein activates transform-ing growth factors, which are involved in controlling the pro-liferation of keratinocytes (69). The increase in the focal ad-hesion kinase gene, Ptk2, may just reflect the augmentednumber of keratinocytes in Aoh2�/� animals and the corre-sponding focal adhesions that keep these epithelial cells to-gether. The transcription factor AP2 alpha (Tcfap2a) ispresent in the skin at relatively high levels and has a stronginductive effect on basal keratin expression (17). The gene foradrenergic receptor kinase, beta 1 (Adrbk1) regulates not onlythe proliferative state of various cell types but also the motilityof epithelial cells (51). The downregulated myostatin gene(Gdf8) belongs to the transforming growth factor � family andis a negative regulator of muscle growth (32). Though ex-pressed at high levels in the muscle and heart, myostatin is alsopresent in the skin, where it could serve an antiproliferativeeffect on keratinocytes as well.
DISCUSSION
The data contained in this report provide novel insights intothe tissue/cell distribution, biochemical characteristics, regula-tion, and function of AOH2, one of the four AOXs present inmarsupials and rodents but absent from primates and humans(55). In particular, the generation and characterization of a
constitutive Aoh2 knockout mouse represents an importantfirst step in the definition of the homeostatic function of thecorresponding protein product, for which no information wasavailable. The importance of this model is heightened by thefact that it is the first animal knockout targeting a member ofthe AOX family.
The tissue and cell distribution data indicate that by far therichest source of AOH2 is the HG. In this organ, AOH2 is theonly member of the AOX family present, and it is very abun-dant, representing around 0.25% of all the cytosolic proteins.AOH2 is expressed by the main population of the secretorycells (14–16). Significant amounts of AOH2 are also evident intwo prominent structures of the skin, i.e., the sebaceous glandsand the suprabasal layer of the epidermis. The epidermis is notthe sole keratinized epithelium where AOH2 is synthesized, asthe protein is also present in the epithelial lining of the oralcavity, the esophagus, and the distal portion of the stomach(68).
AOH2 and the HG. The observation that mouse HGs arerich in AOH2 suggests that the enzyme exerts an importantfunction in these structures. This organ-specific function musthave become as dispensable as the entire gland in primates andhumans (55), providing a simple explanation as to why theAoh2 orthologous gene was deleted from these two species.The HG develops predominantly after birth, becomes func-tionally mature in the adult, and is characterized by sexuallydimorphic structural and biochemical traits (14–16). Differentfunctions have been ascribed to the gland, such as lubricationand protection of the eye surface, control of the circadianrhythm, innate immunity, and the synthesis or secretion ofpheromones regulating the sexual and social behavior of ani-mals.
At present, the phenotypic studies conducted in Aoh2�/�
mice do not provide any evidence for a role of AOH2 in theHG related to a protective effect on the eye. Indeed, theknockout mice do not show any sign of acute or chronic patho-logical alterations of the cornea or sclera. Similarly, behavioralstudies aimed at evaluating an involvement of AOH2 in thecontrol of circadian rhythm were substantially negative (Terao,unpublished). Incidentally, this observation suggests thatAOH2 deficiency does not impinge on the synthesis of mela-tonin and porphyrins, which are the two main types of sub-stances synthesized by the HGs and are purported to be in-volved in the control of circadian rhythm (14). At thetranscriptomic level, this is supported by lack of perturbationsin the expression of genes participating in the biosynthetic/catabolic pathways of melatonin or porphyrins. Though ad hocstudies on mating and social behaviors have not been con-ducted, observations of Aoh2�/� animals have been against arole for AOH2 in these two types of activity largely controlledby pheromones. Obviously, our animal colonies are bred andmaintained in standard-pathogen-free animal house facilitiesunder standard conditions. Thus, our observations do not ruleout the possible relevance of the enzyme in the synthesis/catabolism or secretion/absorption of pheromones by the HGwhen the animals are exposed to stronger environmental stim-uli. The transcriptome profiling experiments and subsequentpathway analyses indicate that the major perturbations af-forded by Aoh2 deletion are observed in young animals, sug-gesting that AOH2 is implicated predominantly in the struc-
VOL. 29, 2009 Aoh2 KNOCKOUT MOUSE AND RETINOIC ACID SYNTHESIS 373
on April 4, 2019 by guest
http://mcb.asm
.org/D
ownloaded from
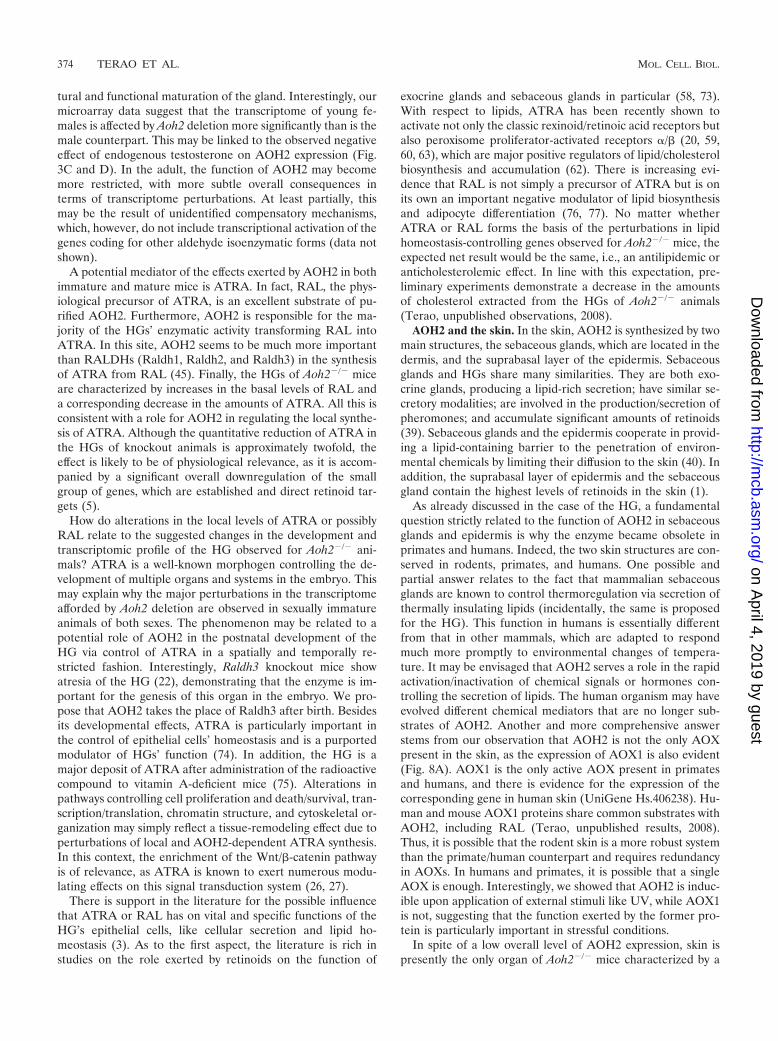
tural and functional maturation of the gland. Interestingly, ourmicroarray data suggest that the transcriptome of young fe-males is affected by Aoh2 deletion more significantly than is themale counterpart. This may be linked to the observed negativeeffect of endogenous testosterone on AOH2 expression (Fig.3C and D). In the adult, the function of AOH2 may becomemore restricted, with more subtle overall consequences interms of transcriptome perturbations. At least partially, thismay be the result of unidentified compensatory mechanisms,which, however, do not include transcriptional activation of thegenes coding for other aldehyde isoenzymatic forms (data notshown).
A potential mediator of the effects exerted by AOH2 in bothimmature and mature mice is ATRA. In fact, RAL, the phys-iological precursor of ATRA, is an excellent substrate of pu-rified AOH2. Furthermore, AOH2 is responsible for the ma-jority of the HGs’ enzymatic activity transforming RAL intoATRA. In this site, AOH2 seems to be much more importantthan RALDHs (Raldh1, Raldh2, and Raldh3) in the synthesisof ATRA from RAL (45). Finally, the HGs of Aoh2�/� miceare characterized by increases in the basal levels of RAL anda corresponding decrease in the amounts of ATRA. All this isconsistent with a role for AOH2 in regulating the local synthe-sis of ATRA. Although the quantitative reduction of ATRA inthe HGs of knockout animals is approximately twofold, theeffect is likely to be of physiological relevance, as it is accom-panied by a significant overall downregulation of the smallgroup of genes, which are established and direct retinoid tar-gets (5).
How do alterations in the local levels of ATRA or possiblyRAL relate to the suggested changes in the development andtranscriptomic profile of the HG observed for Aoh2�/� ani-mals? ATRA is a well-known morphogen controlling the de-velopment of multiple organs and systems in the embryo. Thismay explain why the major perturbations in the transcriptomeafforded by Aoh2 deletion are observed in sexually immatureanimals of both sexes. The phenomenon may be related to apotential role of AOH2 in the postnatal development of theHG via control of ATRA in a spatially and temporally re-stricted fashion. Interestingly, Raldh3 knockout mice showatresia of the HG (22), demonstrating that the enzyme is im-portant for the genesis of this organ in the embryo. We pro-pose that AOH2 takes the place of Raldh3 after birth. Besidesits developmental effects, ATRA is particularly important inthe control of epithelial cells’ homeostasis and is a purportedmodulator of HGs’ function (74). In addition, the HG is amajor deposit of ATRA after administration of the radioactivecompound to vitamin A-deficient mice (75). Alterations inpathways controlling cell proliferation and death/survival, tran-scription/translation, chromatin structure, and cytoskeletal or-ganization may simply reflect a tissue-remodeling effect due toperturbations of local and AOH2-dependent ATRA synthesis.In this context, the enrichment of the Wnt/�-catenin pathwayis of relevance, as ATRA is known to exert numerous modu-lating effects on this signal transduction system (26, 27).
There is support in the literature for the possible influencethat ATRA or RAL has on vital and specific functions of theHG’s epithelial cells, like cellular secretion and lipid ho-meostasis (3). As to the first aspect, the literature is rich instudies on the role exerted by retinoids on the function of
exocrine glands and sebaceous glands in particular (58, 73).With respect to lipids, ATRA has been recently shown toactivate not only the classic rexinoid/retinoic acid receptors butalso peroxisome proliferator-activated receptors �/� (20, 59,60, 63), which are major positive regulators of lipid/cholesterolbiosynthesis and accumulation (62). There is increasing evi-dence that RAL is not simply a precursor of ATRA but is onits own an important negative modulator of lipid biosynthesisand adipocyte differentiation (76, 77). No matter whetherATRA or RAL forms the basis of the perturbations in lipidhomeostasis-controlling genes observed for Aoh2�/� mice, theexpected net result would be the same, i.e., an antilipidemic oranticholesterolemic effect. In line with this expectation, pre-liminary experiments demonstrate a decrease in the amountsof cholesterol extracted from the HGs of Aoh2�/� animals(Terao, unpublished observations, 2008).
AOH2 and the skin. In the skin, AOH2 is synthesized by twomain structures, the sebaceous glands, which are located in thedermis, and the suprabasal layer of the epidermis. Sebaceousglands and HGs share many similarities. They are both exo-crine glands, producing a lipid-rich secretion; have similar se-cretory modalities; are involved in the production/secretion ofpheromones; and accumulate significant amounts of retinoids(39). Sebaceous glands and the epidermis cooperate in provid-ing a lipid-containing barrier to the penetration of environ-mental chemicals by limiting their diffusion to the skin (40). Inaddition, the suprabasal layer of epidermis and the sebaceousgland contain the highest levels of retinoids in the skin (1).
As already discussed in the case of the HG, a fundamentalquestion strictly related to the function of AOH2 in sebaceousglands and epidermis is why the enzyme became obsolete inprimates and humans. Indeed, the two skin structures are con-served in rodents, primates, and humans. One possible andpartial answer relates to the fact that mammalian sebaceousglands are known to control thermoregulation via secretion ofthermally insulating lipids (incidentally, the same is proposedfor the HG). This function in humans is essentially differentfrom that in other mammals, which are adapted to respondmuch more promptly to environmental changes of tempera-ture. It may be envisaged that AOH2 serves a role in the rapidactivation/inactivation of chemical signals or hormones con-trolling the secretion of lipids. The human organism may haveevolved different chemical mediators that are no longer sub-strates of AOH2. Another and more comprehensive answerstems from our observation that AOH2 is not the only AOXpresent in the skin, as the expression of AOX1 is also evident(Fig. 8A). AOX1 is the only active AOX present in primatesand humans, and there is evidence for the expression of thecorresponding gene in human skin (UniGene Hs.406238). Hu-man and mouse AOX1 proteins share common substrates withAOH2, including RAL (Terao, unpublished results, 2008).Thus, it is possible that the rodent skin is a more robust systemthan the primate/human counterpart and requires redundancyin AOXs. In humans and primates, it is possible that a singleAOX is enough. Interestingly, we showed that AOH2 is induc-ible upon application of external stimuli like UV, while AOX1is not, suggesting that the function exerted by the former pro-tein is particularly important in stressful conditions.
In spite of a low overall level of AOH2 expression, skin ispresently the only organ of Aoh2�/� mice characterized by a
374 TERAO ET AL. MOL. CELL. BIOL.
on April 4, 2019 by guest
http://mcb.asm
.org/D
ownloaded from
morphologically recognizable alteration in the phenotype. In-creased thickness of the Aoh2�/� epidermis is maintained afterexposure to UV light, an external stimulus inducing an epider-mal hypertrophic response on its own. Analysis of the skintranscriptome of Aoh2�/� animals is consistent with the ob-served phenotype and shows a number of significant alter-ations in general pathways controlling cell proliferation, death/survival, motility, cytoskeletal structure, tissue remodeling,and, finally, hypertrophy. This is accompanied by perturbationsof additional specific and relevant pathways like keratinocytedifferentiation, Wnt signaling, and response to UV. Interest-ingly, keratinocyte differentiation and response to UV arepathways specifically enriched in the skin relative to the HG.
As in the case of the HG, is it possible to link the morpho-logical and transcriptomic alterations observed for theAoh2�/� mice with the reported influence of AOH2 on thelevels of ATRA in the skin? Measurement of ATRA levels inAoh2�/� mice indicates a role for AOH2 in the homeostasis ofvitamin A in the skin, although the enzyme’s contribution tototal RAL-oxidizing activity is lower in this organ than in theHG. It is well known that vitamin A deficiency is associatedwith extensive proliferation of epithelial cells in various organs,including the skin. The epidermal hypertrophy of Aoh2�/�
animals is also reminiscent of that observed for a line of trans-genic animals characterized by the expression of a dominantnegative form of the retinoid receptor, RAR� (4). This lastanimal model is characterized by hyperkeratosis and scaling inaddition to skin lipid dystrophy. Hence, our findings are con-sistent with the concept that Aoh2 deletion causes local ATRAdeficiency and the ensuing epidermal hypertrophy.
At present, it is not possible to know whether the observedeffect on the epidermis is the result of a direct action onkeratinocytes caused by retinoid deficiency or if more-complexunderlying mechanisms are operative. In fact, the action ofATRA on the growth and trophism of epidermal keratinocytesis controversial. ATRA inhibits the growth of keratinocytes invitro, while the external application of high doses of retinoidsseems to have the opposite effect in vivo (23, 57). For instance,it is entirely possible that epidermal hypertrophy is a secondaryresponse to alteration in the homeostasis of the immune sys-tem triggered by local ATRA deficiency, as suggested by path-way analysis of the microarray data. ATRA is a well-knownmodulator of the immune system, and alteration of the ho-meostasis of the skin immune responses could influence thegrowth of the epidermal layer, altering the balance of cytokinesand growth factors secreted by lymphocytes and/or macro-phages (1).
Retinoid-related versus -unrelated functions of AOH2. Inconclusion, many of the data obtained in the knockout modeldescribed in this report are consistent with a significant role ofAOH2 in the local synthesis and biodisposition of endogenousretinoids in the HG and skin. If this is indeed the case, it mustbe emphasized that the role of AOH2 is not systemic and islimited to a few target organs and to the adult organism. Thisis in line with a multimodal and complex control of the ho-meostasis of endogenous retinoids. In this scenario, Raldh1,Raldh2, and Raldh3 are certainly more important than AOH2in regulating the systemic levels of endogenous retinoids andthe function of vitamin A in organogenesis and embryo devel-opment. The significance of AOH2 for retinoid homeostasis
does not rule out functions and substrates other than RAL forAOH2. AOH2 may protect the skin and the body via metab-olism of harmful exogenous compounds. The hypothesis willbe easy to test in vivo by determining the sensitivity of ourknockout animals to selected environmental poisons or pollut-ants. However, a prerequisite for this type of studies is a betterdefinition of the exogenous substrates of AOH2 to determinewhether the enzyme has the same broad specificity that char-acterizes other AOXs. In addition, it is possible that some ofthese alternative functions may be unrelated to the enzymaticactivity of AOH2, as observed in the case of the othermolybdoflavoenzyme, XOR (71). With respect to this, therecent reports demonstrating that human AOX1 is capableof interacting with ABC transporters and is important forthe accumulation of triglycerides through as-yet-undefinedmechanisms (72) are of great relevance for the presence ofAOH2 in both HGs and sebaceous glands.
ACKNOWLEDGMENTS
This work was partially supported by unrestricted grants from FIRB(Fondo Italiano per la Ricerca di Base to M.T.), Fondazione ItaloMonzino (to E.G.), and Fondazione Telethon (B055FIRB to C.T.).
We thank Mario Salmona for critical reading of the manuscript. Thehelp of Felice Deceglie and Alessandro Soave for the artwork is alsoacknowledged.
REFERENCES
1. Alique, M., F. J. Lucio-Cazana, V. Moreno, Q. Xu, T. Konta, K. Nakayama,A. Furusu, J. C. Sepulveda, and M. Kitamura. 2007. Upregulation of cy-clooxygenases by retinoic acid in rat mesangial cells. Pharmacology 79:57–64.
2. Al-Salmy, H. S. 2001. Individual variation in hepatic aldehyde oxidase activ-ity. IUBMB Life 51:249–253.
3. Anzano, M. A., A. J. Lamb, and J. A. Olson. 1981. Impaired salivary glandsecretory function following the induction of rapid, synchronous vitamin Adeficiency in rats. J. Nutr. 111:496–504.
4. Attar, P. S., P. W. Wertz, M. McArthur, S. Imakado, J. R. Bickenbach, andD. R. Roop. 1997. Inhibition of retinoid signaling in transgenic mice alterslipid processing and disrupts epidermal barrier function. Mol. Endocrinol.11:792–800.
5. Balmer, J. E., and R. Blomhoff. 2002. Gene expression regulation by retinoicacid. J. Lipid Res. 43:1773–1808.
6. Beedham, C. 1987. Molybdenum hydroxylases: biological distribution andsubstrate-inhibitor specificity. Prog. Med. Chem. 24:85–127.
7. Beedham, C. 1997. The role of non-P450 enzymes in drug oxidation. Pharm.World Sci. 19:255–263.
8. Beedham, C., Y. al-Tayib, and J. A. Smith. 1992. Role of guinea pig andrabbit hepatic aldehyde oxidase in oxidative in vitro metabolism of cinchonaantimalarials. Drug Metab. Dispos. 20:889–895.
9. Beedham, C., S. E. Bruce, and D. J. Rance. 1987. Tissue distribution of themolybdenum hydroxylases, aldehyde oxidase and xanthine oxidase, in maleand female guinea pigs. Eur. J. Drug Metab. Pharmacokinet. 12:303–306.
10. Beedham, C., J. J. Miceli, and R. S. Obach. 2003. Ziprasidone metabolism,aldehyde oxidase, and clinical implications. J. Clin. Psychopharmacol. 23:229–232.
11. Beedham, C., C. F. Peet, G. I. Panoutsopoulos, H. Carter, and J. A. Smith.1995. Role of aldehyde oxidase in biogenic amine metabolism. Prog. BrainRes. 106:345–353.
12. Bendotti, C., E. Prosperini, M. Kurosaki, E. Garattini, and M. Terao. 1997.Selective localization of mouse aldehyde oxidase mRNA in the choroidplexus and motor neurons. Neuroreport 8:2343–2349.
13. Berger, R., E. Mezey, K. P. Clancy, G. Harta, R. M. Wright, J. E. Repine,R. H. Brown, M. Brownstein, and D. Patterson. 1995. Analysis of aldehydeoxidase and xanthine dehydrogenase/oxidase as possible candidate genes forautosomal recessive familial amyotrophic lateral sclerosis. Somat. Cell Mol.Genet. 21:121–131.
14. Buzzell, G. R. 1996. The Harderian gland: perspectives. Microsc. Res. Tech.34:2–5.
15. Buzzell, G. R. 1996. Sexual dimorphism in the Harderian gland of the Syrianhamster is controlled and maintained by hormones, despite seasonal fluctu-ations in hormone levels: functional implications. Microsc. Res. Tech. 34:133–138.
16. Buzzell, G. R., J. L. Blank, M. K. Vaughan, and R. J. Reiter. 1995. Controlof secretory lipid droplets in the Harderian gland by testosterone and the
VOL. 29, 2009 Aoh2 KNOCKOUT MOUSE AND RETINOIC ACID SYNTHESIS 375
on April 4, 2019 by guest
http://mcb.asm
.org/D
ownloaded from

photoperiod: comparison of two species of hamsters. Gen. Comp. Endocri-nol. 99:230–238.
17. Byrne, C., M. Tainsky, and E. Fuchs. 1994. Programming gene expression indeveloping epidermis. Development 120:2369–2383.
18. Chambon, P. 1996. A decade of molecular biology of retinoic acid receptors.FASEB J. 10:940–954.
19. Chang, L., J. Zhang, Y. H. Tseng, C. Q. Xie, J. Ilany, J. C. Bruning, Z. Sun,X. Zhu, T. Cui, K. A. Youker, Q. Yang, S. M. Day, C. R. Kahn, and Y. E.Chen. 2007. Rad GTPase deficiency leads to cardiac hypertrophy. Circula-tion 116:2976–2983.
20. Chou, C. F., C. L. Lai, Y. C. Chang, G. Duester, and S. J. Yin. 2002. Kineticmechanism of human class IV alcohol dehydrogenase functioning as retinoldehydrogenase. J. Biol. Chem. 277:25209–25216.
21. Conchon, S., X. Cao, C. Barlowe, and H. R. Pelham. 1999. Got1p and Sft2p:membrane proteins involved in traffic to the Golgi complex. EMBO J. 18:3934–3946.
22. Dupe, V., N. Matt, J. M. Garnier, P. Chambon, M. Mark, and N. B. Ghy-selinck. 2003. A newborn lethal defect due to inactivation of retinaldehydedehydrogenase type 3 is prevented by maternal retinoic acid treatment. Proc.Natl. Acad. Sci. USA 100:14036–14041.
23. Fisher, G. J., and J. J. Voorhees. 1996. Molecular mechanisms of retinoidactions in skin. FASEB J. 10:1002–1013.
24. Gao, J., L. Estrada, S. Cho, R. E. Ellis, and J. L. Gorski. 2001. The Caeno-rhabditis elegans homolog of FGD1, the human Cdc42 GEF gene respon-sible for faciogenital dysplasia, is critical for excretory cell morphogenesis.Hum. Mol. Genet. 10:3049–3062.
25. Garattini, E., M. Fratelli, and M. Terao. 2008. Mammalian aldehyde oxi-dases: genetics, evolution and biochemistry. Cell. Mol. Life Sci. 65:1019–1048.
26. Garattini, E., M. Gianni, and M. Terao. 2007. Cytodifferentiation byretinoids, a novel therapeutic option in oncology: rational combinationswith other therapeutic agents. Vitam. Horm. 75:301–354.
27. Garattini, E., M. Gianni, and M. Terao. 2007. Retinoids as differentiatingagents in oncology: a network of interactions with intracellular pathways asthe basis for rational therapeutic combinations. Curr. Pharm. Des. 13:1375–1400.
28. Garattini, E., R. Mendel, M. J. Romao, R. Wright, and M. Terao. 2003.Mammalian molybdo-flavoenzymes, an expanding family of proteins: struc-ture, genetics, regulation, function and pathophysiology. Biochem. J. 372:15–32.
29. Huber, W., A. von Heydebreck, H. Sultmann, A. Poustka, and M. Vingron.2002. Variance stabilization applied to microarray data calibration and to thequantification of differential expression. Bioinformatics 18(Suppl. 1):S96–S104.
30. Ito, K., T. Suzuki, T. Moriya, H. Utsunomiya, A. Sugawara, R. Konno, S.Sato, and H. Sasano. 2001. Retinoid receptors in the human endometriumand its disorders: a possible modulator of 17 beta-hydroxysteroid dehydro-genase. J. Clin. Endocrinol. Metab. 86:2721–2727.
31. Jeyaraj, D. A., G. Grossman, and P. Petrusz. 2005. Altered bioavailability oftestosterone in androgen-binding protein-transgenic mice. Steroids 70:704–714.
32. Joulia-Ekaza, D., and G. Cabello. 2007. The myostatin gene: physiology andpharmacological relevance. Curr. Opin. Pharmacol. 7:310–315.
33. Joyner, A. L. 2000. Gene targeting: a practical approach, 2nd ed. OxfordUniversity Press, Oxford, United Kingdom.
34. Kilani, R. T., A. Medina, A. Aitken, R. B. Jalili, M. Carr, and A. Ghahary.2008. Identification of different isoforms of 14-3-3 protein family in humandermal and epidermal layers. Mol. Cell. Biochem. 314:161–169.
35. Kundu, T. K., R. Hille, M. Velayutham, and J. L. Zweier. 2007. Character-ization of superoxide production from aldehyde oxidase: an importantsource of oxidants in biological tissues. Arch. Biochem. Biophys. 460:113–121.
36. Kurosaki, M., S. Demontis, M. M. Barzago, E. Garattini, and M. Terao.1999. Molecular cloning of the cDNA coding for mouse aldehyde oxidase:tissue distribution and regulation in vivo by testosterone. Biochem. J. 341:71–80.
37. Kurosaki, M., M. Terao, M. M. Barzago, A. Bastone, D. Bernardinello, M.Salmona, and E. Garattini. 2004. The aldehyde oxidase gene cluster in miceand rats. Aldehyde oxidase homologue 3, a novel member of the molybdo-flavoenzyme family with selective expression in the olfactory mucosa. J. Biol.Chem. 279:50482–50498.
38. Lee, H. K., W. Braynen, K. Keshav, and P. Pavlidis. 2005. ErmineJ: tool forfunctional analysis of gene expression data sets. BMC Bioinformatics 6:269.
39. Madani, K. A., G. S. Bazzano, and A. C. Chou. 1985. The in vitro metabolismof 13-cis-retinoic acid in a model sebaceous structure, the rat preputial gland.J. Investig. Dermatol. 85:465–469.
40. Madison, K. C. 2003. Barrier function of the skin: “la raison d’etre” of theepidermis. J. Investig. Dermatol. 121:231–241.
41. Majkic-Singh, N., B. Conteh, M. Stojanov, and I. Berkes. 1983. Kinetic assayof aldehyde oxidase with 2,2�-azino-di-(3-ethylbenzthiazoline-6-sulfonate) aschromogen. Enzyme 29:120–125.
42. Mira, L., L. Maia, L. Barreira, and C. F. Manso. 1995. Evidence for free
radical generation due to NADH oxidation by aldehyde oxidase duringethanol metabolism. Arch. Biochem. Biophys. 318:53–58.
43. Molotkov, A., and G. Duester. 2003. Genetic evidence that retinaldehydedehydrogenase Raldh1 (Aldh1a1) functions downstream of alcohol dehydro-genase Adh1 in metabolism of retinol to retinoic acid. J. Biol. Chem. 278:36085–36090.
44. Nagy, A., M. Gertsenstein, K. Vintersten, and R. Behringer. 2003. Manipu-lating the mouse embryo, 3rd ed. Cold Spring Harbor Laboratory Press, ColdSpring Harbor, NY.
45. Niederreither, K., and P. Dolle. 2008. Retinoic acid in development: towardsan integrated view. Nat. Rev. Genet. 9:541–553.
46. Nishimura, M., and S. Naito. 2006. Tissue-specific mRNA expression pro-files of human phase I metabolizing enzymes except for cytochrome P450and phase II metabolizing enzymes. Drug Metab. Pharmacokinet. 21:357–374.
47. Okada, K., H. R. Lijnen, M. Dewerchin, A. Belayew, O. Matsuo, D. Collen,and R. Bernaerts. 1997. Characterization and targeting of the murinealpha2-antiplasmin gene. Thromb. Haemost. 78:1104–1110.
48. Panoutsopoulos, G. I., and C. Beedham. 2004. Kinetics and specificity ofguinea pig liver aldehyde oxidase and bovine milk xanthine oxidase towardssubstituted benzaldehydes. Acta Biochim. Pol. 51:649–663.
49. Panoutsopoulos, G. I., D. Kouretas, and C. Beedham. 2004. Contribution ofaldehyde oxidase, xanthine oxidase, and aldehyde dehydrogenase on theoxidation of aromatic aldehydes. Chem. Res. Toxicol. 17:1368–1376.
50. Panoutsopoulos, G. I., D. Kouretas, E. G. Gounaris, and C. Beedham. 2004.Metabolism of 2-phenylethylamine and phenylacetaldehyde by precision-cutguinea pig fresh liver slices. Eur. J. Drug Metab. Pharmacokinet. 29:111–118.
51. Penela, P., C. Ribas, I. Aymerich, N. Eijkelkamp, O. Barreiro, C. J. Heijnen,A. Kavelaars, F. Sanchez-Madrid, and F. Mayor, Jr. 2008. G protein-cou-pled receptor kinase 2 positively regulates epithelial cell migration. EMBOJ. 27:1206–1218.
52. Pogach, M. S., Y. Cao, G. Millien, M. I. Ramirez, and M. C. Williams. 2007.Key developmental regulators change during hyperoxia-induced injury andrecovery in adult mouse lung. J. Cell. Biochem. 100:1415–1429.
53. Rashidi, M. R., C. Beedham, J. S. Smith, and S. Davaran. 2007. In vitrostudy of 6-mercaptopurine oxidation catalysed by aldehyde oxidase andxanthine oxidase. Drug Metab. Pharmacokinet. 22:299–306.
54. Rashidi, M. R., J. A. Smith, S. E. Clarke, and C. Beedham. 1997. In vitrooxidation of famciclovir and 6-deoxypenciclovir by aldehyde oxidase fromhuman, guinea pig, rabbit, and rat liver. Drug Metab. Dispos. 25:805–813.
55. Rehorek, S. J., and T. D. Smith. 2006. The primate Harderian gland: does itreally exist? Ann. Anat. 188:319–327.
56. Richardson, R. J., J. Dixon, S. Malhotra, M. J. Hardman, L. Knowles, R. P.Boot-Handford, P. Shore, A. Whitmarsh, and M. J. Dixon. 2006. Irf6 is a keydeterminant of the keratinocyte proliferation-differentiation switch. Nat.Genet. 38:1329–1334.
57. Rittie, L., J. Varani, S. Kang, J. J. Voorhees, and G. J. Fisher. 2006. Reti-noid-induced epidermal hyperplasia is mediated by epidermal growth factorreceptor activation via specific induction of its ligands heparin-binding EGFand amphiregulin in human skin in vivo. J. Investig. Dermatol. 126:732–739.
58. Schirren, C. G., T. Jansen, A. Lindner, P. Kind, and G. Plewig. 1996. Diffusesebaceous gland hyperplasia. A case report and an immunohistochemicalstudy with cytokeratins. Am. J. Dermatopathol. 18:296–301.
59. Schug, T. T., D. C. Berry, N. S. Shaw, S. N. Travis, and N. Noy. 2007.Opposing effects of retinoic acid on cell growth result from alternate acti-vation of two different nuclear receptors. Cell 129:723–733.
60. Schug, T. T., D. C. Berry, I. A. Toshkov, L. Cheng, A. Y. Nikitin, and N. Noy.2008. Overcoming retinoic acid-resistance of mammary carcinomas by di-verting retinoic acid from PPARbeta/delta to RAR. Proc. Natl. Acad. Sci.USA 105:7546–7551.
61. Schwab, S. R., J. P. Pereira, M. Matloubian, Y. Xu, Y. Huang, and J. G.Cyster. 2005. Lymphocyte sequestration through S1P lyase inhibition anddisruption of S1P gradients. Science 309:1735–1739.
62. Semple, R. K., V. K. Chatterjee, and S. O’Rahilly. 2006. PPAR gamma andhuman metabolic disease. J. Clin. Investig. 116:581–589.
63. Shaw, N., M. Elholm, and N. Noy. 2003. Retinoic acid is a high affinityselective ligand for the peroxisome proliferator-activated receptor beta/delta. J. Biol. Chem. 278:41589–41592.
64. Sigruener, A., C. Buechler, E. Orso, A. Hartmann, P. J. Wild, L. Terracciano,M. Roncalli, S. R. Bornstein, and G. Schmitz. 2007. Human aldehyde oxi-dase 1 interacts with ATP-binding cassette transporter-1 and modulates itsactivity in hepatocytes. Horm. Metab. Res. 39:781–789.
65. Terao, M., M. Kurosaki, M. M. Barzago, E. Varasano, A. Boldetti, A. Bas-tone, M. Fratelli, and E. Garattini. 2006. Avian and canine aldehyde oxi-dases. Novel insights into the biology and evolution of molybdo-flavoen-zymes. J. Biol. Chem. 281:19748–19761.
66. Terao, M., M. Kurosaki, S. Demontis, S. Zanotta, and E. Garattini. 1998.Isolation and characterization of the human aldehyde oxidase gene: conser-vation of intron/exon boundaries with the xanthine oxidoreductase geneindicates a common origin. Biochem. J. 332:383–393.
67. Terao, M., M. Kurosaki, M. Marini, M. A. Vanoni, G. Saltini, V. Bonetto, A.Bastone, C. Federico, S. Saccone, R. Fanelli, M. Salmona, and E. Garattini.
376 TERAO ET AL. MOL. CELL. BIOL.
on April 4, 2019 by guest
http://mcb.asm
.org/D
ownloaded from
2001. Purification of the aldehyde oxidase homolog 1 (AOH1) protein andcloning of the AOH1 and aldehyde oxidase homolog 2 (AOH2) genes.Identification of a novel molybdo-flavoprotein gene cluster on mouse chro-mosome 1. J. Biol. Chem. 276:46347–46363.
68. Terao, M., M. Kurosaki, G. Saltini, S. Demontis, M. Marini, M. Salmona,and E. Garattini. 2000. Cloning of the cDNAs coding for two novel molybdo-flavoproteins showing high similarity with aldehyde oxidase and xanthineoxidoreductase. J. Biol. Chem. 275:30690–30700.
69. Vassar, R., and E. Fuchs. 1991. Transgenic mice provide new insights intothe role of TGF-alpha during epidermal development and differentiation.Genes Dev. 5:714–727.
70. Vila, R., M. Kurosaki, M. M. Barzago, M. Kolek, A. Bastone, L. Colombo, M.Salmona, M. Terao, and E. Garattini. 2004. Regulation and biochemistry ofmouse molybdo-flavoenzymes. The DBA/2 mouse is selectively deficient inthe expression of aldehyde oxidase homologues 1 and 2 and represents aunique source for the purification and characterization of aldehyde oxidase.J. Biol. Chem. 279:8668–8683.
71. Vorbach, C., A. Scriven, and M. R. Capecchi. 2002. The housekeeping genexanthine oxidoreductase is necessary for milk fat droplet enveloping andsecretion: gene sharing in the lactating mammary gland. Genes Dev. 16:3223–3235.
72. Weigert, J., M. Neumeier, S. Bauer, W. Mages, A. A. Schnitzbauer, A. Obed,B. Groschl, A. Hartmann, A. Schaffler, C. Aslanidis, J. Scholmerich, and C.
Buechler. 2008. Small-interference RNA-mediated knock-down of aldehydeoxidase 1 in 3T3-L1 cells impairs adipogenesis and adiponectin release.FEBS Lett. 582:2965–2972.
73. Wrobel, A., H. Seltmann, S. Fimmel, K. Muller-Decker, M. Tsukada, B.Bogdanoff, N. Mandt, U. Blume-Peytavi, C. E. Orfanos, and C. C. Zouboulis.2003. Differentiation and apoptosis in human immortalized sebocytes. J. In-vestig. Dermatol. 120:175–181.
74. Zhuang, Y. H., M. Blauer, M. Pelto-Huikko, H. Syvala, and P. Tuohimaa.1996. Immunochemical and in situ hybridization analyses of retinoic acidreceptor alpha, beta, and gamma in murine Harderian and submandibularglands. Histochem. Cell Biol. 106:311–318.
75. Zhuang, Y. H., E. L. Sainio, P. Sainio, W. V. Vedeckis, T. Ylikomi, and P.Tuohimaa. 1995. Distribution of all-trans-retinoic acid in normal and vitaminA deficient mice: correlation to retinoic acid receptors in different tissues ofnormal mice. Gen. Comp. Endocrinol. 100:170–178.
76. Ziouzenkova, O., G. Orasanu, M. Sharlach, T. E. Akiyama, J. P. Berger, J.Viereck, J. A. Hamilton, G. Tang, G. G. Dolnikowski, S. Vogel, G. Duester,and J. Plutzky. 2007. Retinaldehyde represses adipogenesis and diet-inducedobesity. Nat. Med. 13:695–702.
77. Ziouzenkova, O., and J. Plutzky. 2008. Retinoid metabolism and nuclearreceptor responses: new insights into coordinated regulation of the PPAR-RXR complex. FEBS Lett. 582:32–38.
VOL. 29, 2009 Aoh2 KNOCKOUT MOUSE AND RETINOIC ACID SYNTHESIS 377
on April 4, 2019 by guest
http://mcb.asm
.org/D
ownloaded from