role of teagasc and...
TRANSCRIPT

Role of Teagasc and Activities in Rural
DevelopmentPresentation to SWGRRD study tour
Mr. Dan Clavin, Rural Development Specialist, Teagasc
Dublin, 16th November 2015

Teagasc – The Irish Agriculture and Food Development Authority
Mission
To support science-based innovation in the agri-food sector and wider bio-
economy so as to underpin profitability, competitiveness and sustainability

Teagasc goals
GOAL 1Improve the competitiveness of agriculture, food and the wider bio-
economy
GOAL 2Support sustainable farming and the environment
GOAL 3Encourage diversification of the rural economy and enhance the quality of life in rural areas
GOAL 4Enhance organisational capability and deliver value for money
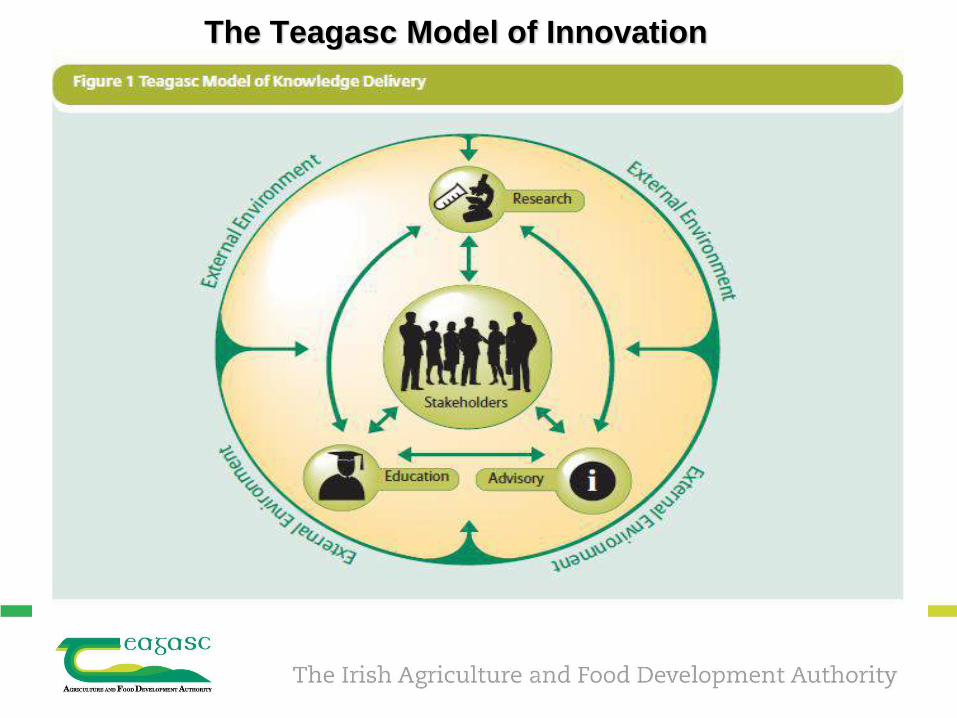
The Teagasc Model of Innovation

Teagasc organisational chart, Nov 2015

Teagasc sites map November 2015
November 2015
Advisory offices 52
Teagasc colleges 4
Private colleges 3
Research centres 7

800
900
1000
1100
1200
1300
1400
1500
1600
Teagasc staff numbers 2001 to 2014

Total Staff
01/01/2014
Total Staff
31/12/2014
% of total staff
Permanent
Researchers
(Res.)
Contract/
Post Doc
Specialists
Advisors /
Teachers
Technologists
Technicians
Heads of Directorat
e and Administrat
ion
Other Support
Staff
Walsh Fellows 31/12/20
14
Research HQ 20.9 11.8 1% 5.0 0.0 1.8 0.0 0.0 0.0 5.0 0.0Animal & Grassland
200.3 212.6 18% 33.0 26.8 23.0 0.0 5.0 47.8 10.2 65.8 73
Crops, Environment & Land Use
160.6 161.6 14% 21.5 24.6 24.3 0.0 9.8 40.5 7.9 33.1 49
Food 106.9 139.3 12% 40.2 47.0 0.5 0.0 6.0 25.3 14.1 7.5 71
Rural Ec. & Development
53.2 58.4 5% 12.6 12.0 11.0 0.0 1.0 16.8 4.0 0.0 26
Total Research 541.8 583.0 50% 112.3 110.4 60.6 0.0 21.8 130.4 41.2 106.4 219
Knowledge Transfer HQ
20.4 18.2 2% 0.0 8.9 0.0 0.0 0.0 9.4 0.0
KT Advisory Regions *
356.1 348.9 30% 0.0 0.0 *268.5 0.0 0.0 76.7 3.7 20
KT Education 124.9 134.4 12% 0.0 0.0 64.8 0.0 27.3 9.0 33.3
Total KT Directorate
501.4 501.5 43% 0.0 8.9 333.3 0.0 27.3 95.1 36.9
Operations Directorate
58.4 69.5 6% 2.0 2.0 0.0 0.0 5.0 59.1 1.4
Director's Office 9.0 10.0 1% 0.0 3.0 0.0 0.0 0.0 7.0 0.0
Overall Total 1110.5 1,164.0 100% 114.3 110.4 74.5 333.3 21.8 162.7 202.4 144.7
Teagasc Staff and Walsh Fellows on the 01/01/2015
* Includes 230 frontline advisor FTEs
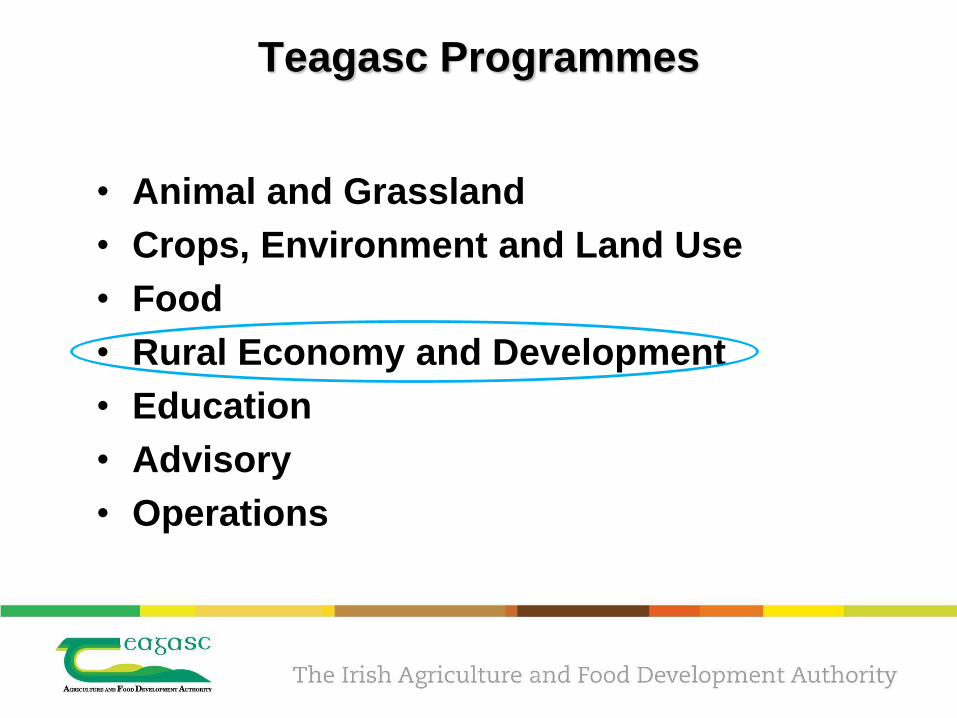
Teagasc Programmes
• Animal and Grassland • Crops, Environment and Land Use• Food• Rural Economy and Development• Education• Advisory• Operations
TeagascActivities in Rural
Development

Structure of EU Rural Development Programme (RDP) 2007-2013
•Largest Components•Axis 1. – Improving Competitiveness
• Early Retirement Scheme –5.2%
• Targeted Agricultural Modernisation – 2.2%
•Axis 2 – Improving Environment• Less Favoured Areas – 32.3%• Agri-Environmental Schemes –
49%•Axis 3 & 4 – Improving Quality of Life
• LEADER and Diversification –8.8%
0
20
40
60
80
100
120
Axis 3 & 4 - Improving the quality of life Axis 2 - Improving the environmentAxis 1 - Improving the competitiveness

New Rural Development Programme (RDP) Context
• Fostering knowledge transfer and innovation
• Enhancing competitiveness of all types of agriculture and enhancing farm viability
• Promoting food and non-food chain organisation and risk management
• Restoring, preserving and enhancing ecosystems
• Promoting resource efficiency and supporting the shift towards a low carbon and climate resilient economy
• Promoting social inclusion, poverty reduction and economic development in rural areas
•Deliver FoodWise 2025 targets•Provide Increased Income for Farmers•Contribute to Economic Recovery•Increase Farm Household and Rural Community Viability
……….in a Sustainable Way
Programme Aims National Strategic Objectives
RDP provides an important:-Income Source-Policy Lever to achieve national outcomes

Axis 1: Improving the competitiveness of agriculture by supporting restructuring, development and
innovation
New EU Rural Development Programme

Context for Ireland:- Ireland - Family Farm Income
-10000
0
10000
20000
30000
40000
50000
Dairy
Dairy&
Cattle
Cattle
Rea
ring
Cattle
Oth
er
Sheep
Tillage
Market SubsidiesTeagasc: National Farm Survey
€
euro

Ireland – Farm viability
0
0.1
0.2
0.3
0.4
0.5
1994 1999 2004 2009
Viable
-Viable – % of Farms with Farm Income plus return on
investment >= Min Agri Wage
- Declining Share
- In record price year, 2011, only 30% Viable
Teagasc: National Farm Survey

Average Age – need for farm restructuring
50
51
52
53
54
55
56
57
1994 1999 2004 2009
Age
-Steady Rise in Average Age of Farms
- Average Age 55
- More farmers over 80 than under 30
- Inhibits innovation and change
Teagasc: National Farm Survey
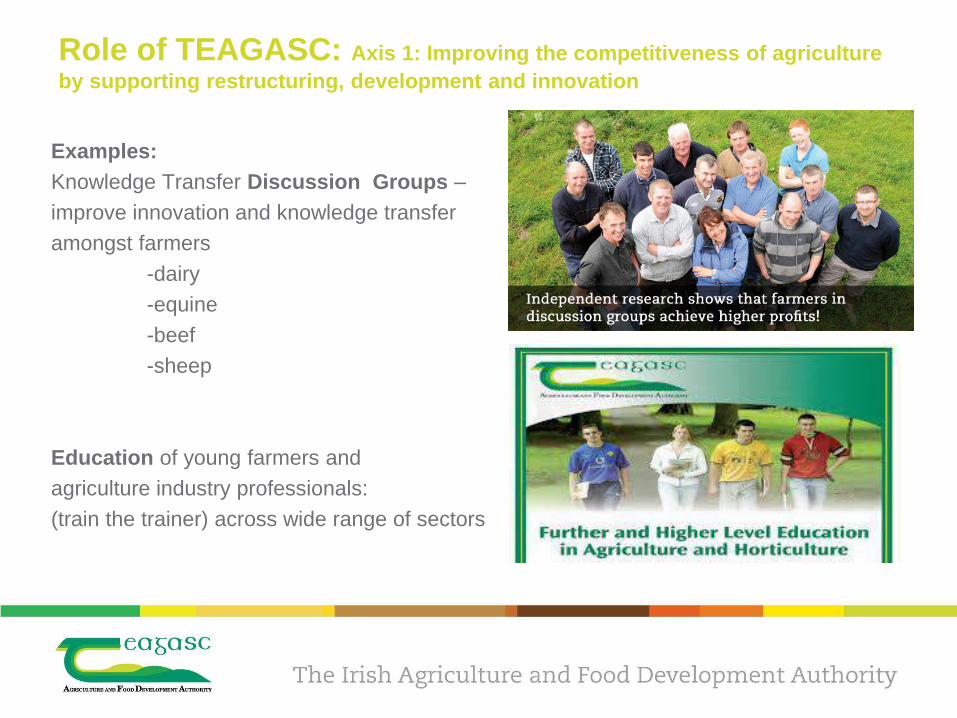
Role of TEAGASC: Axis 1: Improving the competitiveness of agriculture by supporting restructuring, development and innovation
Examples:Knowledge Transfer Discussion Groups –improve innovation and knowledge transferamongst farmers
-dairy -equine-beef-sheep
Education of young farmers and agriculture industry professionals:
(train the trainer) across wide range of sectors

Role of TEAGASC: Axis 1: Improving the competitiveness of agriculture by supporting restructuring, development and innovation
Promotion and development of collaborative arrangements • Farm partnerships• Contract rearing of dairy calves• Share farming arrangements
Promotion of best practice and support in farm inheritance and succession options• Nationwide clinics and advisory service
available

Role of TEAGASC: Axis 1: Improving the competitiveness of agriculture by supporting restructuring, development and innovation
Farm modernisation:
• Buildings and machinery grant support assistance
- Promotion of best practice in farm safety

Axis 2: Improving the environment and the countryside by supporting land management
New EU Rural Development Programme

Ireland Context -Less Favoured Area (LFA) -% Viability
0
10
20
30
40
50
60
70
1980 1985 1990 1995 2000 2005 2010 2015
% V
iab
le
Non LFA LFA-About 70% of country designated LFA (disadvantaged)
-100,000+ farmers participate
- Lower economic viability amongst LFA
- Strong spatial pattern Teagasc: Spatial Model
of the Irish Local Economy
Teagasc: National Farm Survey
% Viable across country

Item Importance Teagasc capacity Other major players
International National
Water quality High Very high Very High UCD, UU, EPA, TCD, EU
Water quantity Very High Low Medium - Low IDF, Maynooth, local authorities
Soil quality Very High Medium but increasing
Medium but increasing
UCD, NUIG, EU
Nutrient efficiency
High Very high High DAFM
Biodiversity High Medium but increasing
Medium UCD, NUIG, EPA, NPWS, Biodiversity Data Centre, Heritage Council, NGOs, EU
GHG Very High High and increasing
Very high EPA, Bord Bia, Industry (e.g. Glanbia), UCD, TCD, NIUM, UL, many international actors, EU
Energy High and increasing
Low but increasing
Medium SEAI, UCC, ESB, Bord na Mona, EU
Waste Low Low Low EPA, DAFM, Farm Relief Service, EU
Animal welfare Medium - High Medium – sector specific
Medium NGOs, DAFM,
Social – equity High Low High International NGOs, Farm organisations
Community –maintain rural fabric
Medium Medium to high Medium UCD, Leader programmes, EU
Ireland Context:Environmental Protection

Role of TEAGASC: Axis 2: Improving the environment and the countryside by supporting land management
Teagasc research put into practice:
New designation of LFAs (Less Favoured Areas)- from 2018 will be will be based on Teagasc National soils information system Information.
GHGs (Greenhouse Gas reduction): The Carbon Navigator-new tool to promote and measure sustainability at farm level.
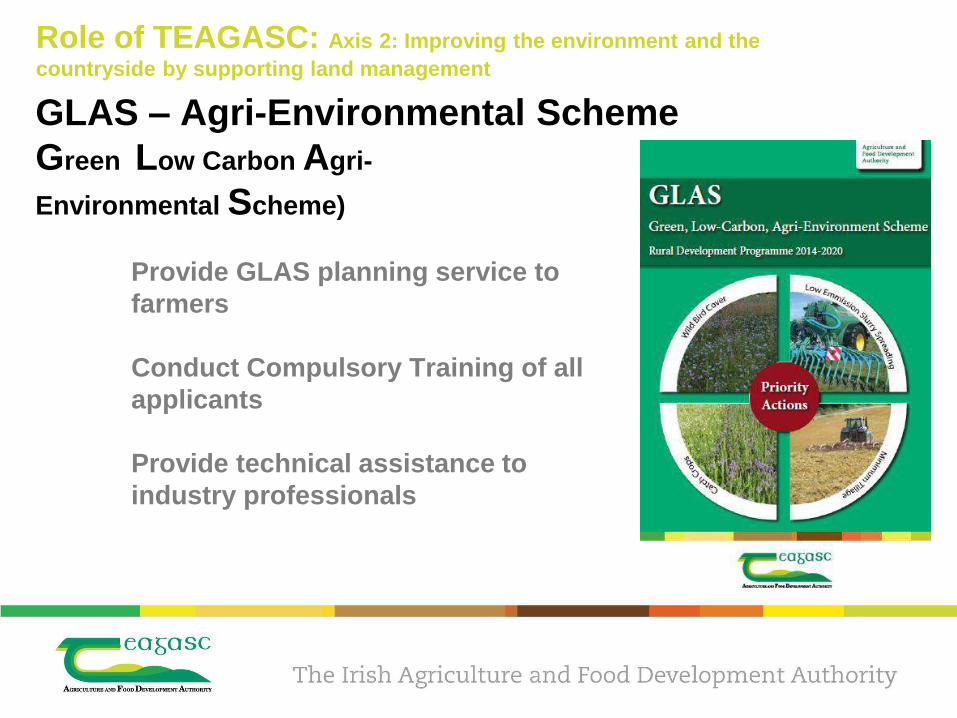
GLAS – Agri-Environmental SchemeGreen Low Carbon Agri-
Environmental Scheme)
Provide GLAS planning service to farmers
Conduct Compulsory Training of all applicants
Provide technical assistance to industry professionals
Role of TEAGASC: Axis 2: Improving the environment and the countryside by supporting land management

Role of TEAGASC: Axis 2: Improving the environment and the countryside by supporting land management
Organic Farming:
• Transfer knowledge -groups, phone calls and technical articles
• Design and teach compulsory organic production educational course to all new entrants and toagricultural professionals.
• Run national Organic Demonstration Farm Network
-12 national farm walks

Role of TEAGASC: Axis 2: Improving the environment and the countryside by supporting land management
Forestry/Bio-energy
• Advice
• Courses
• Information Meetings/Field Events

Axis 3: Improving the quality of life in rural areas and encouraging diversification of economic
activity
New EU Rural Development Programme

Ireland Context : Off-farm Employment
0
0.1
0.2
0.3
0.4
0.5
0.6
1996 1998 2000 2002 2004 2006 2008 2010
Employment-Holder Employment-Spouse
- Farmer off-farm employment back to 1996 levels
- Spouse employment more robust to downturn
Source: Teagasc - NFS
Teagasc: National Farm Survey

Aims
Provide new thinking
Help generate new ideas
Provide more income both on and off farm
Free of charge
www.teagasc.ie/ruraldevelopment
12 nationwide workshops3 hours x 5 sessions incl farm walks

Workshop Locations 2015 –www.teagasc.ie/events
Options Workshop TopicsAssessing your enterprise Developing your idea
Organic opportunities Direct selling
A business plan - the basics Business supports
Artisan Food Forestry/Energy Crops
Rural tourism Applying for grant aid
Family farm finances Succession Planning
And more……………
Includes visits to farms and successful rural businesses


Future challenges/for discussion
• Implementation of European Innovation Partnerships (EIPs) • solving common problems amongst member states by
sharing knowledge/innovation regarding specific issues.
• Improving efficiency across the whole agri-product value chain and supplying products which the market desires.
• Monitoring and evaluation of scheme performance over time.

To conclude:Teagasc goals
GOAL 1Improve the competitiveness of agriculture, food and the wider bio-
economy
GOAL 2Support sustainable farming and the environment
GOAL 3Encourage diversification of the rural economy and enhance the quality of life in rural areas
GOAL 4Enhance organisational capability and deliver value for money

Go raibh maith agaibh
Thank you
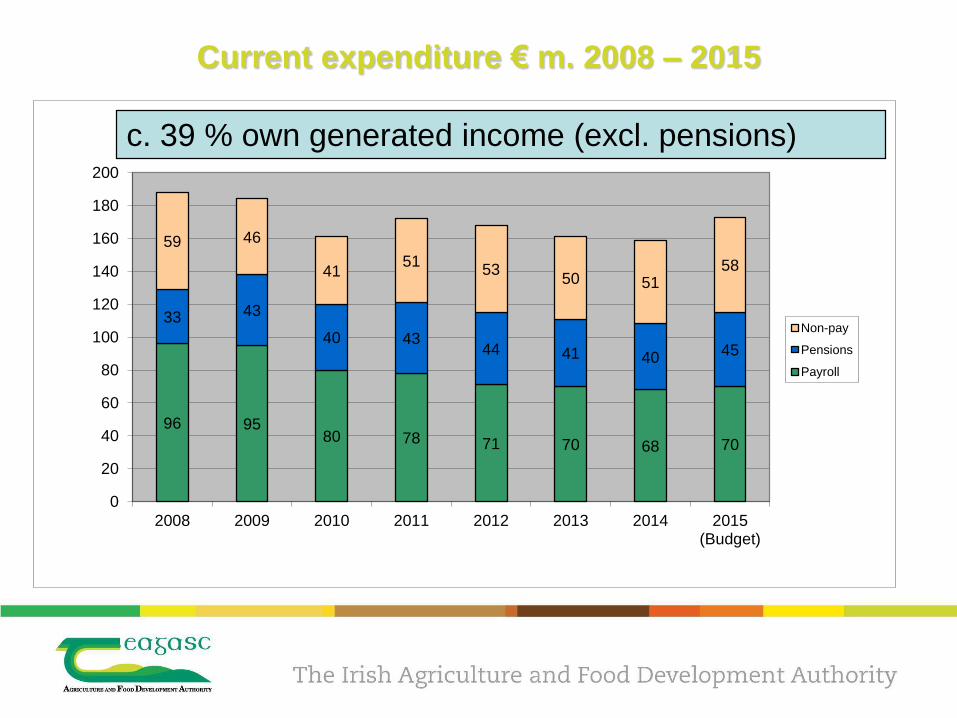
Current expenditure € m. 2008 – 2015
96 9580 78 71 70 68 70
33 43
40 4344 41 40 45
59 46
4151 53 50 51
58
0
20
40
60
80
100
120
140
160
180
200
2008 2009 2010 2011 2012 2013 2014 2015(Budget)
Non-pay
Pensions
Payroll
c. 39 % own generated income (excl. pensions)

Trends in client and adviser numbers 2000 to 2014
0
50
100
150
200
250
300
350
400
450
500
0
5000
10000
15000
20000
25000
30000
35000
40000
45000
50000
No of Clients No of advisers
Clients Advisers
- 42%
90
95
100
105
110
115
0
200
400
600
800
1000
1200
1400
1600
1800
2006 2007 2008 2009 2010 2011 2012 2013 2014
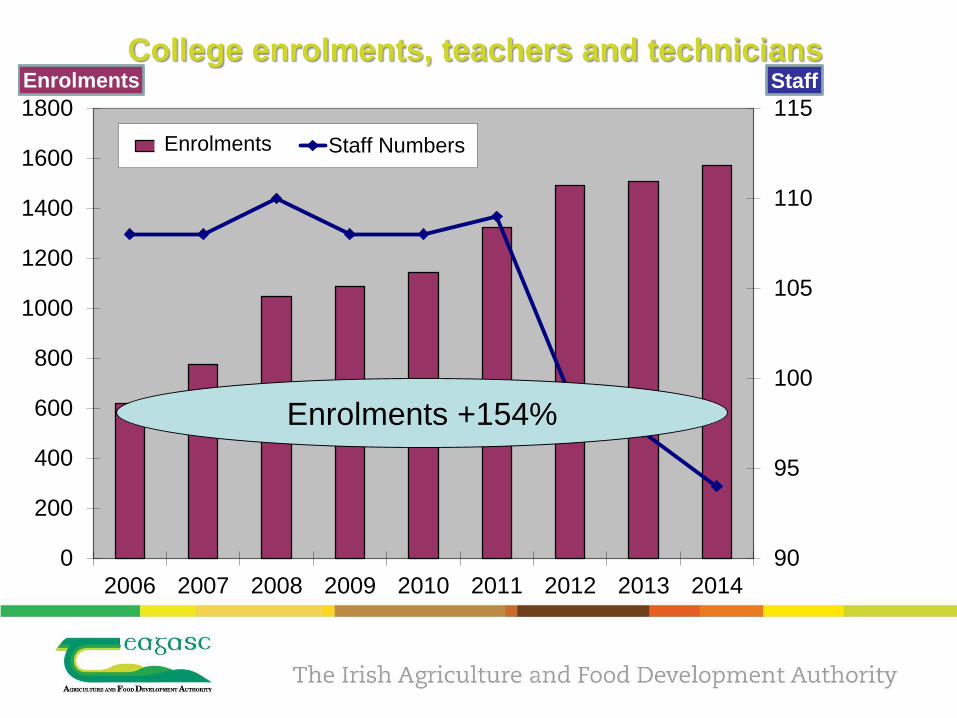
StaffEnrolmentsCollege enrolments, teachers and technicians
Enrolements Staff NumbersEnrolments
Enrolments +154%

Refereed publications by permanent researcher 2009 to 2013
8486889092949698100
100150200250300350400450500
2009 2010 2011 2012 2013
Publications Researchers
Publications Researchers