role of oligosaccharides as biological additives in...
TRANSCRIPT
Open Access
Volume 5 • Isue 1 • 1000207J Aquac Res DevelopmentISSN: 2155-9546 JARD, an open access journal
Research Article Open Access
Mohamed et al., J Aquac Res Development 2013, 5:1http://dx.doi.org/10.4172/2155-9546.1000207
Research Article Open Access
AquacultureResearch & Development
Keywords: Oreochromis niloticus, Serum lysozymes, Haematological parameters, Growth performance, Mannan-oligosaccharides
IntroductionIn Egypt, external parasites of freshwater fish may be described
as the most important parasitic problems facing cultured freshwater fish. External protozoa and monogenetic trematodes of freshwater fish could be considered as the most prevalent causes of diseases affecting skin and gills. External parasites cause gill inflammation and distortion of normal anatomy which impairing their respiratory foundation [1]. Also, they cause skin irritation, inflammation and loss of the surface epithelium which in turn open the way for secondary invaders [2]. The control of diseases can be achieved by many methods, including the judicious use of drugs and antibiotics either prophylactically or therapeutically, good management practices, genetic selection or stress and disease tolerant strains, as well as prevention by the use of vaccines. Prevention of diseases is much more desirable than intervention to stop and reverse disease processes once they have begun [3]. There has been heightened research in developing new dietary supplementation strategies in which various health and growth-promoting compounds as probiotics, prebiotics, synbiotics, phytobiotics and other functional dietary supplements have been evaluated [4]. According to FAO experts “A prebiotic is a non-viable food component that confers a health benefit on the host associated with modulation of the microbiota” [5]. There are several recognized functional prebiotic oligosaccharides in use around the world: Fructo-oligosaccharides (FOS), manna-oligosaccharides (MOS), Xylo-oligosaccharides (XOS), Inulin and ß-glucan [6]. Mannan-oligosaccharides obtained from the cell wall of Saccharomyces cerevisiae. In theory, pathogenic, growth-inhibiting bacteria that normally adhere to mannans on the mucosal surface of the intestine may instead bind to the mannan component of Bio-Mos®. Because these pathogens do not attach to the mucosal surface of the intestine, they are flushed from the intestinal tract, so elimination of pathogens would presumably enhance the health and growth. Another possible mode of action of Bio-Mos® is an effect on the immune system by increasing the level of antibody titres, immunoglobulins, and macrophage activity [7]. So this work was planned to study some common external parasitic diseases in cultured O. niloticus and to evaluate the effect of mannan-oligosaccharides on growth and health conditions of O. niloticus.
Materials and MethodsFish
A total number of 350 O. nloticus were randomly collected from freshwater aquaculture at private fish farms at Eltal Elkbir-Sharkia governorate. The collected fish specimens were with average body weight range 28.0+1 g. The fish were transported alive to the laboratory of fish diseases at Animal Health Research Institute, Dokki, Giza, Egypt, in large tanks filled with water of the same sources supplied with battery air pumps and examined as soon as possible. Six full glass aquaria 100×50×50 cm were used for fish holding. Chlorine free tap water was used according to [8], Aquaria were supplied with air pumps. Fish were fed on commercial diet locally prepared according the table referred by the Association of Official Analytical Chemists [9].
Bio-Mos®
A mannan-oligosaccharides derived from the cell wall of the yeast Saccharomyces cerevisiae. It is a product manufactured by Alltech, Inc.UK. Biomoss was added within the ratio of 2 and 4 g/kg.
Experimental design
Three hundred alive randomly collected Oreochromis niloticus were divided according to the parasitological examination into 6 groups. The parasitic positive fish with external parasites were redivided into 3 groups (50 for each). The first group was kept as control (infected, not fed on Bio-Mos®). The second group fed on Bio-Mos® 2 g/kg feed.
*Corresponding author: Mohamed SM, Department of Fish Diseases & Management, Faculty of Veterinary Medicine, Cairo University, Egypt, Tel: +20 2 35715882; E-mail: [email protected]
Received October 21, 2013; Accepted November 28, 2013; Published November 04, 2013
Citation: Mohamed SM, Magdy IH, Olfat AM, Ebtsam AT, Nesreen SY (2013) Role of Oligosaccharides as Biological Additives in Cultured Oreochromis niloticus. J Aquac Res Development 5: 207 doi:10.4172/2155-9546.1000207
Copyright: © 2013 Mohamed SM, et al. This is an open-access article distributed under the terms of the Creative Commons Attribution License, which permits unrestricted use, distribution, and reproduction in any medium, provided the original author and source are credited.
AbstractThe present study was carried out on 350 Oreochromis niloticus randomly collected alive from private freshwater
fish farms at Eltal Elkbir-Sharkia governorate. The fish were subjected to clinical, postmortem and parasitological examination. The isolated external parasites were found belonging to the protozoa of genera Trichodina, Epistylis and Chilodonella, as well as monogenea of genera Cichlidogyrus and Ancyrocephalus. The efficacy of mannan-oligosaccharides (Bio-Mos®) was evaluated on growth performance, haematological parameters, total proteins content and the Serum Lysozyme activity. Bio-Mos® appears to be of importance as growth promoter at level of 4 g/Kg of fish diet, with consequent improving the general fish health and increasing the total fish gain. The efficacy of Bio-Mos® as a biocontrol agent for present external parasites in examined fish are needed more study to determine the role of mannan-oligosaccharides concerning the specific treatment and control of external parasitic infections in fishes.
Role of Oligosaccharides as Biological Additives in Cultured Oreochromis niloticus AMohamed SM1*, Magdy IH1, Olfat AM2, Ebtsam AT3 and Nesreen SY3 1Department of Fish Diseases & Management, Faculty of Veterinary Medicine, Cairo University, Egypt2Department of Parasitology, Faculty of Veterinary Medicine, Cairo University, Egypt3Animal Health Research Institute, Dokki, Giza, Egypt

Citation: Mohamed SM, Magdy IH, Olfat AM, Ebtsam AT, Nesreen SY (2013) Role of Oligosaccharides as Biological Additives in Cultured Oreochromis Niloticus. J Aquac Res Development 5: 207 doi:10.4172/2155-9546.1000207
Page 2 of 8
Volume 5 • Isue 1 • 1000207J Aquac Res DevelopmentISSN: 2155-9546 JARD, an open access journal
The third group fed on Bio-Mos® 4 g/kg feed. Both the second and the third groups were treated for 6 weeks. The parasitic negative fish were divided into 3 groups (50 for each). The first group was kept as control (non-infected, not fed on Bio-Mos®).The second group fed on Bio-Mos® 2 g/kg feed. The third group fed on Bio-Mos® 4 g/kg feed. Both the second and the third groups were treated for 6 weeks. The parasitic negative fish after 3 weeks of feeding Bio-Mos® were experimentally infected with external parasites and divided into 2 groups (25 for each). The first group fed on Bio-Mos® 2 g/kg feed. The second group fed on Bio-Mos® 4 g/kg feed for another 3 weeks.
Clinical examination
The clinical examination of the collected alive fishes was performed as described by Amlacher [10]. Any clinical abnormalities of naturally infected fishes were recorded.
Parasitological examination
The specimens under investigation were grossly examined for detection of any external lesions or visible cysts and microscopically for isolation and identification of external parasites according to Noga [11].
Fish skin, fins and gills were firstly examined by the naked eye for detection of any macroscopically visible lesions. Samples of mucus were scraped gently from the skin, fins and gills, then spread on a clean slide and freshly examined under phase contrast microscope for the presence of external parasites. Some of the positive slides were air-dried and stained according to Klein’s dry silver impregnation method. Other positive slides were also air-dried, fixed with absolute methanol and stained with 10% Giemsa stain [12]. All detected parasites; were examined freshly, fixed and stained according to Pritchard & Kruse [13] then identified according to; [14]. Also, blood samples were collected from living fish from the caudal vessel according to Noga [11]. The fish were anesthetized using MS-222 and blood was withdrawal using small caliper needles for Haematological examination.
Growth parameters determination
• Body weights: weighed after 2, 4 and 6weeks.
• Body weight gain: Final fish weight (g)–Initial fish weight (g) according to Annet [15].
• Specific Growth Rate %: It was calculated as the percentage increase in weight per fish per day as suggested by Pouomonge and Mbonglang [16], using the following equation SGR%=(Ln WT–Ln Wt)/(T-t)×100 Where:
SGR%= percentage increase in body weight per fish per day
Ln WT=natural log of weight at time T
Ln Wt=natural log of initial weight
T=time, t=initial time, Ln=natural logarithm
Measuring of some hematological parameters; blood samples were collected from the living fish, caudal vessel according to Lucky [12] and Noga [11]. The following blood parameters were evaluated in fishes include
• Total and differential Leucocytic count according to Kanaev [17].
Serum Total Protein (g %): Assay of total protein was carried by a test kit [Spectrum Diagnostics] according to biuret method described
by Gornall et al. [18].
• Lysozymes activity examination: Lysozyme activity was measured by agarose gel lysis assay according to the method described by Schultz [19].
• Statistical analysis: Mean value (x), standard deviation (S.D.), standard error and test of significance (t-test or student’s test) were carried out according to the method of Snedecor and Cochran [20].
Results and DiscussionThere are several food ingredients mainly carbohydrates used as
prebiotic nowadays, but for a food that can be classified as a probiotic, must have some characteristics. Gibson [21] noted a food ingredient that most fulfill the following criteria: resistance to gastric acidity, hydrolysis by digestive enzymes and gastrointestinal absorption, fermentation by intestinal microflora and selective stimulation of the growth and/or the activity of intestinal bacteria associated with health to be classified as prebiotic. Therefore, the use of prebiotic such as mannan-oligosaccharide (Bio-Mos), concentrated from the cell wall of Saccharomyces cerevisiae, to improve growth and health performance in the aquaculture industry is increasingly important as consumers demand eco-friendly production practices [22].
The results of the examination of 150 fish randomly collected alive from private freshwater fish farms at Eltal Elkbir- Sharkia, governorate indicated that 75 O. niloticus were naturally infected with external parasites (Protozoa; Trichodina, Epistylis, Chilodonella and monogenea; Cichlidogyrus and Ancyrocephalus). Fish infected with ciliated protozoa namely Trichodina, Chilodonella and Epistylis showed slimy pale skin with sever blood spots scattered on the body surface especially at the base of fins with detached scales in O. niloticus. Signs of skin irritation manifested as rubbing the bodies against the side of the aquarium were also recorded. Signs of asphyxia manifested as increased opercular movements were also noticed in some fishes (Figure 1). Monogenea infected fishes showed loss of appetite and sluggish movements. Infected fishes swimmed near the surface of the water with increased opercular movement, stretched gills covers and expanded pale and sticky gills. Infected O. niloticus were anaemic and exhibited sluggish feeding reflex and detached scales (Figure 2).
The results of the examination for different parasites isolated from skin, fins, gills and eyes revealed Trichodina mutabilis [10], Epistylis [23], Chilodonella hexaststicha [24] and Monogenetic trematodes : Cichlidogyrus halli [23] and Ancerocephalus pellonullae [23] with high infection rate. Isolated parasites are demonstrated in Figures 3-8 successively.
Figure 1: Naturally infected Oreochromis niloticus with Trichodina and Chilo-donella Showing detached scales, haemorrhage and tail erosion.

Citation: Mohamed SM, Magdy IH, Olfat AM, Ebtsam AT, Nesreen SY (2013) Role of Oligosaccharides as Biological Additives in Cultured Oreochromis Niloticus. J Aquac Res Development 5: 207 doi:10.4172/2155-9546.1000207
Page 3 of 8
Volume 5 • Isue 1 • 1000207J Aquac Res DevelopmentISSN: 2155-9546 JARD, an open access journal
Concerning the results of morphological identification of isolated parasites revealed that Trichodina mutabilis was medium to large disc shaped cell. Denticle blade oblong, largely parrel to radial of disc. With squared distal end, central part narrow with oblong to rounded overlapping end. Projection of central part not visible. Central disc without inclusions, nuclear apparatus not observed, this result agree with Noga [11].
Epistylis species were observed as a sessile contractile ciliate, stalk was long and non contractile, often form a branched colony, the distal end of the organism was surrounded by rapidly moving cilia which appear as a blur, this result agree with Lome [23].
Chilodonella hexasticha was typically heart shaped, with broader posterior end. The ventral side was flat with parallel ciliary rows. The
Figure 2: Naturally infected Oreochromis niloticus with Cichlidogyrus halli showing gill congestion.
Figure 3: Trichodina mutabilis stained with Giemsa stain (X100).
Figure 4: Trichodina mutabilis with silver imprgnation (X100).
Figure 5: Epistylis articulata stained with Giemsa stain (X40).
Figure 6: Chilodonilla hexasticha stained with Giemsa stain (X100).
Figure 7: Cichlidogyrus halli stained with Carmine stain (X100).
Figure 8: Ancyrocephalus pellonulae stained with Carmine stain (X100).
Citation: Mohamed SM, Magdy IH, Olfat AM, Ebtsam AT, Nesreen SY (2013) Role of Oligosaccharides as Biological Additives in Cultured Oreochromis Niloticus. J Aquac Res Development 5: 207 doi:10.4172/2155-9546.1000207
Page 4 of 8
Volume 5 • Isue 1 • 1000207J Aquac Res DevelopmentISSN: 2155-9546 JARD, an open access journal
dorsal surface was slightly convex and lacked cilia except in the oral groove at the extreme anterior end. 37 µm (35–39 µm) in length and 24 µm (23–25 µm) in width. There were contractile vacuoles spreading all over the cell. The macronucleus was rounded. The morphological characters of these parasites were nearly similar to descriptions given by Meyer [25], Kabata [26] and Post [24].
Concerning the monogenetic trematode Cichlidogyrus halli was a small elongated worm of 0.211-0.230 mm. in length. The anterior end had 4 pairs of the head organ, and 1 pair of dark eye spots. At the posterior end opishaptor had 2 pairs of medium hooks and 6-7 pairs of marginal hooks. Copulatory organ and vetilline gland were well developed. The morphological characters of these parasites were nearly similar to description given by Lome [23].
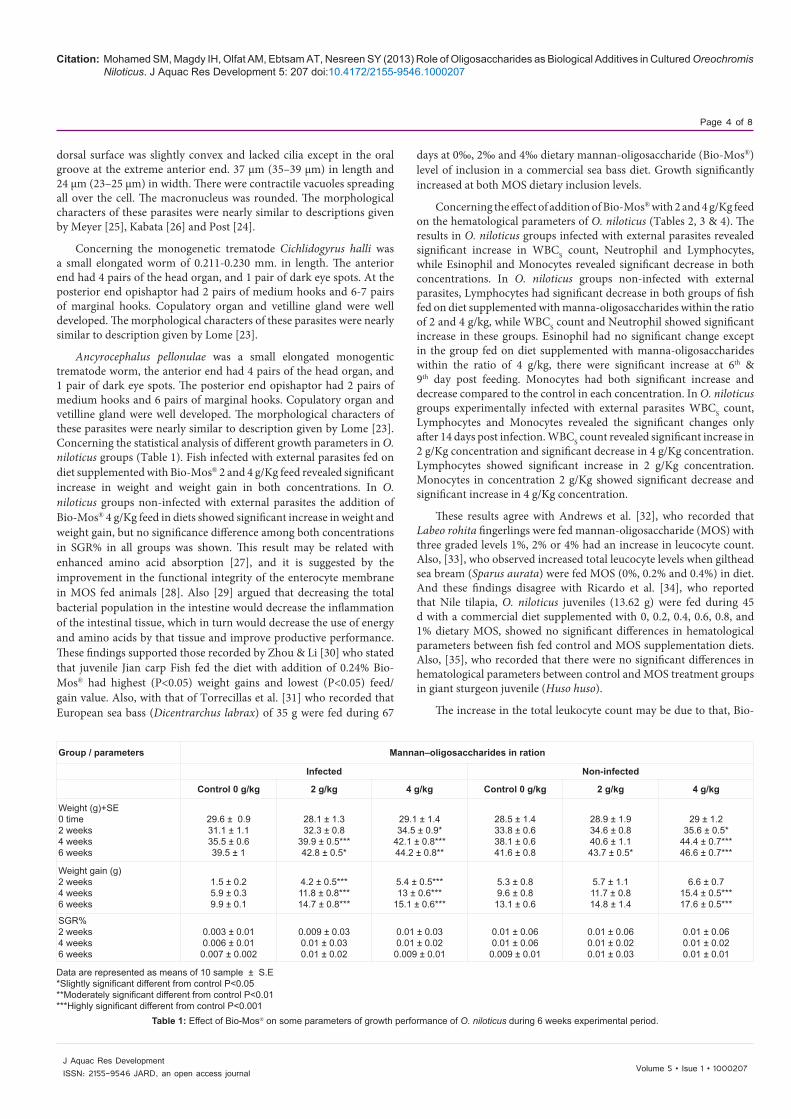
Ancyrocephalus pellonulae was a small elongated monogentic trematode worm, the anterior end had 4 pairs of the head organ, and 1 pair of dark eye spots. The posterior end opishaptor had 2 pairs of medium hooks and 6 pairs of marginal hooks. Copulatory organ and vetilline gland were well developed. The morphological characters of these parasites were nearly similar to description given by Lome [23]. Concerning the statistical analysis of different growth parameters in O. niloticus groups (Table 1). Fish infected with external parasites fed on diet supplemented with Bio-Mos® 2 and 4 g/Kg feed revealed significant increase in weight and weight gain in both concentrations. In O. niloticus groups non-infected with external parasites the addition of Bio-Mos® 4 g/Kg feed in diets showed significant increase in weight and weight gain, but no significance difference among both concentrations in SGR% in all groups was shown. This result may be related with enhanced amino acid absorption [27], and it is suggested by the improvement in the functional integrity of the enterocyte membrane in MOS fed animals [28]. Also [29] argued that decreasing the total bacterial population in the intestine would decrease the inflammation of the intestinal tissue, which in turn would decrease the use of energy and amino acids by that tissue and improve productive performance. These findings supported those recorded by Zhou & Li [30] who stated that juvenile Jian carp Fish fed the diet with addition of 0.24% Bio-Mos® had highest (P<0.05) weight gains and lowest (P<0.05) feed/gain value. Also, with that of Torrecillas et al. [31] who recorded that European sea bass (Dicentrarchus labrax) of 35 g were fed during 67
days at 0‰, 2‰ and 4‰ dietary mannan-oligosaccharide (Bio-Mos®) level of inclusion in a commercial sea bass diet. Growth significantly increased at both MOS dietary inclusion levels.
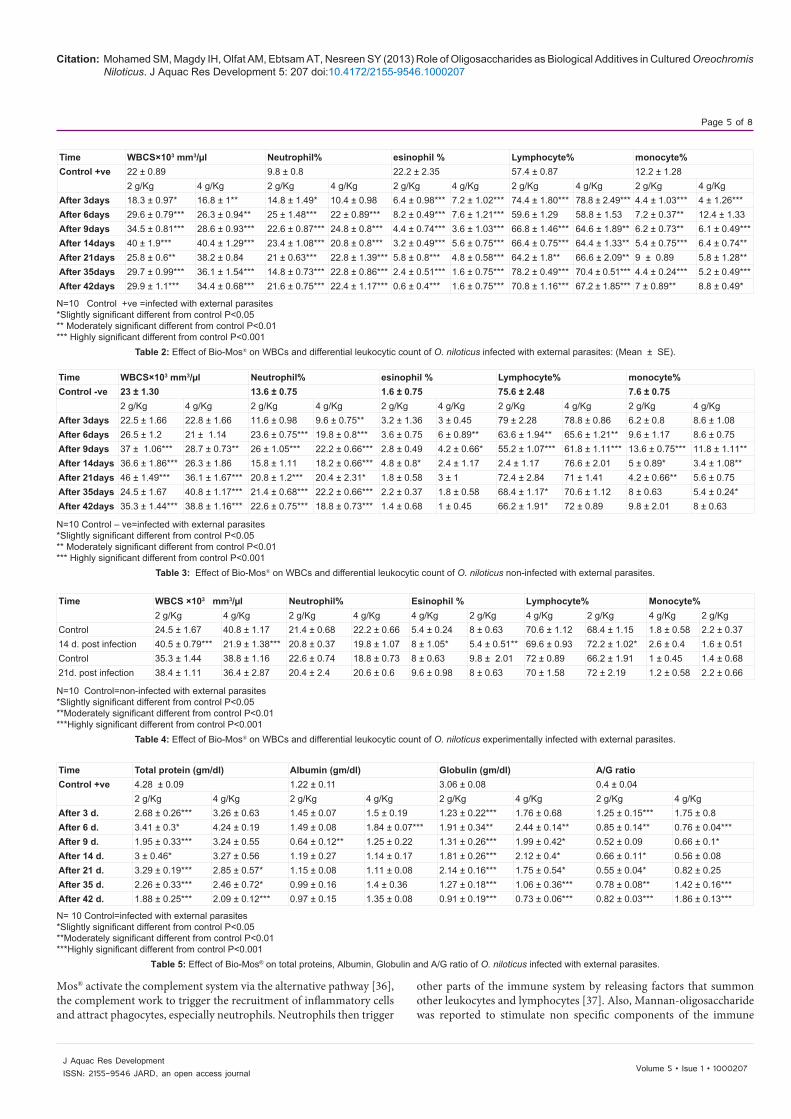
Concerning the effect of addition of Bio-Mos® with 2 and 4 g/Kg feed on the hematological parameters of O. niloticus (Tables 2, 3 & 4). The results in O. niloticus groups infected with external parasites revealed significant increase in WBCS count, Neutrophil and Lymphocytes, while Esinophil and Monocytes revealed significant decrease in both concentrations. In O. niloticus groups non-infected with external parasites, Lymphocytes had significant decrease in both groups of fish fed on diet supplemented with manna-oligosaccharides within the ratio of 2 and 4 g/kg, while WBCS count and Neutrophil showed significant increase in these groups. Esinophil had no significant change except in the group fed on diet supplemented with manna-oligosaccharides within the ratio of 4 g/kg, there were significant increase at 6th & 9th day post feeding. Monocytes had both significant increase and decrease compared to the control in each concentration. In O. niloticus groups experimentally infected with external parasites WBCS count, Lymphocytes and Monocytes revealed the significant changes only after 14 days post infection. WBCS count revealed significant increase in 2 g/Kg concentration and significant decrease in 4 g/Kg concentration. Lymphocytes showed significant increase in 2 g/Kg concentration. Monocytes in concentration 2 g/Kg showed significant decrease and significant increase in 4 g/Kg concentration.
These results agree with Andrews et al. [32], who recorded that Labeo rohita fingerlings were fed mannan-oligosaccharide (MOS) with three graded levels 1%, 2% or 4% had an increase in leucocyte count. Also, [33], who observed increased total leucocyte levels when gilthead sea bream (Sparus aurata) were fed MOS (0%, 0.2% and 0.4%) in diet. And these findings disagree with Ricardo et al. [34], who reported that Nile tilapia, O. niloticus juveniles (13.62 g) were fed during 45 d with a commercial diet supplemented with 0, 0.2, 0.4, 0.6, 0.8, and 1% dietary MOS, showed no significant differences in hematological parameters between fish fed control and MOS supplementation diets. Also, [35], who recorded that there were no significant differences in hematological parameters between control and MOS treatment groups in giant sturgeon juvenile (Huso huso).
The increase in the total leukocyte count may be due to that, Bio-
Group / parameters Mannan–oligosaccharides in ration
Infected Non-infected
Control 0 g/kg 2 g/kg 4 g/kg Control 0 g/kg 2 g/kg 4 g/kg
Weight (g)+SE0 time2 weeks4 weeks6 weeks
29.6 ± 0.931.1 ± 1.135.5 ± 0.639.5 ± 1
28.1 ± 1.332.3 ± 0.8
39.9 ± 0.5***42.8 ± 0.5*
29.1 ± 1.434.5 ± 0.9*
42.1 ± 0.8***44.2 ± 0.8**
28.5 ± 1.433.8 ± 0.638.1 ± 0.641.6 ± 0.8
28.9 ± 1.934.6 ± 0.840.6 ± 1.143.7 ± 0.5*
29 ± 1.235.6 ± 0.5*
44.4 ± 0.7***46.6 ± 0.7***
Weight gain (g)2 weeks4 weeks6 weeks
1.5 ± 0.25.9 ± 0.39.9 ± 0.1
4.2 ± 0.5***11.8 ± 0.8***14.7 ± 0.8***
5.4 ± 0.5***13 ± 0.6***
15.1 ± 0.6***
5.3 ± 0.89.6 ± 0.8
13.1 ± 0.6
5.7 ± 1.111.7 ± 0.814.8 ± 1.4
6.6 ± 0.715.4 ± 0.5***17.6 ± 0.5***
SGR%2 weeks4 weeks6 weeks
0.003 ± 0.010.006 ± 0.010.007 ± 0.002
0.009 ± 0.030.01 ± 0.030.01 ± 0.02
0.01 ± 0.030.01 ± 0.02
0.009 ± 0.01
0.01 ± 0.060.01 ± 0.06
0.009 ± 0.01
0.01 ± 0.060.01 ± 0.020.01 ± 0.03
0.01 ± 0.060.01 ± 0.020.01 ± 0.01
Data are represented as means of 10 sample ± S.E*Slightly significant different from control P<0.05 **Moderately significant different from control P<0.01 ***Highly significant different from control P<0.001
Table 1: Effect of Bio-Mos® on some parameters of growth performance of O. niloticus during 6 weeks experimental period.
Citation: Mohamed SM, Magdy IH, Olfat AM, Ebtsam AT, Nesreen SY (2013) Role of Oligosaccharides as Biological Additives in Cultured Oreochromis Niloticus. J Aquac Res Development 5: 207 doi:10.4172/2155-9546.1000207
Page 5 of 8
Volume 5 • Isue 1 • 1000207J Aquac Res DevelopmentISSN: 2155-9546 JARD, an open access journal
N=10 Control +ve =infected with external parasites*Slightly significant different from control P<0.05 ** Moderately significant different from control P<0.01 *** Highly significant different from control P<0.001
Table 2: Effect of Bio-Mos® on WBCs and differential leukocytic count of O. niloticus infected with external parasites: (Mean ± SE).
Time WBCS×103 mm3/µl Neutrophil% esinophil % Lymphocyte% monocyte%Control +ve 22 ± 0.89 9.8 ± 0.8 22.2 ± 2.35 57.4 ± 0.87 12.2 ± 1.28
2 g/Kg 4 g/Kg 2 g/Kg 4 g/Kg 2 g/Kg 4 g/Kg 2 g/Kg 4 g/Kg 2 g/Kg 4 g/KgAfter 3days 18.3 ± 0.97* 16.8 ± 1** 14.8 ± 1.49* 10.4 ± 0.98 6.4 ± 0.98*** 7.2 ± 1.02*** 74.4 ± 1.80*** 78.8 ± 2.49*** 4.4 ± 1.03*** 4 ± 1.26***After 6days 29.6 ± 0.79*** 26.3 ± 0.94** 25 ± 1.48*** 22 ± 0.89*** 8.2 ± 0.49*** 7.6 ± 1.21*** 59.6 ± 1.29 58.8 ± 1.53 7.2 ± 0.37** 12.4 ± 1.33After 9days 34.5 ± 0.81*** 28.6 ± 0.93*** 22.6 ± 0.87*** 24.8 ± 0.8*** 4.4 ± 0.74*** 3.6 ± 1.03*** 66.8 ± 1.46*** 64.6 ± 1.89** 6.2 ± 0.73** 6.1 ± 0.49***After 14days 40 ± 1.9*** 40.4 ± 1.29*** 23.4 ± 1.08*** 20.8 ± 0.8*** 3.2 ± 0.49*** 5.6 ± 0.75*** 66.4 ± 0.75*** 64.4 ± 1.33** 5.4 ± 0.75*** 6.4 ± 0.74**After 21days 25.8 ± 0.6** 38.2 ± 0.84 21 ± 0.63*** 22.8 ± 1.39*** 5.8 ± 0.8*** 4.8 ± 0.58*** 64.2 ± 1.8** 66.6 ± 2.09** 9 ± 0.89 5.8 ± 1.28**After 35days 29.7 ± 0.99*** 36.1 ± 1.54*** 14.8 ± 0.73*** 22.8 ± 0.86*** 2.4 ± 0.51*** 1.6 ± 0.75*** 78.2 ± 0.49*** 70.4 ± 0.51*** 4.4 ± 0.24*** 5.2 ± 0.49***After 42days 29.9 ± 1.1*** 34.4 ± 0.68*** 21.6 ± 0.75*** 22.4 ± 1.17*** 0.6 ± 0.4*** 1.6 ± 0.75*** 70.8 ± 1.16*** 67.2 ± 1.85*** 7 ± 0.89** 8.8 ± 0.49*
N=10 Control – ve=infected with external parasites*Slightly significant different from control P<0.05 ** Moderately significant different from control P<0.01 *** Highly significant different from control P<0.001
Table 3: Effect of Bio-Mos® on WBCs and differential leukocytic count of O. niloticus non-infected with external parasites.
Time WBCS×103 mm3/µl Neutrophil% esinophil % Lymphocyte% monocyte%Control -ve 23 ± 1.30 13.6 ± 0.75 1.6 ± 0.75 75.6 ± 2.48 7.6 ± 0.75
2 g/Kg 4 g/Kg 2 g/Kg 4 g/Kg 2 g/Kg 4 g/Kg 2 g/Kg 4 g/Kg 2 g/Kg 4 g/KgAfter 3days 22.5 ± 1.66 22.8 ± 1.66 11.6 ± 0.98 9.6 ± 0.75** 3.2 ± 1.36 3 ± 0.45 79 ± 2.28 78.8 ± 0.86 6.2 ± 0.8 8.6 ± 1.08After 6days 26.5 ± 1.2 21 ± 1.14 23.6 ± 0.75*** 19.8 ± 0.8*** 3.6 ± 0.75 6 ± 0.89** 63.6 ± 1.94** 65.6 ± 1.21** 9.6 ± 1.17 8.6 ± 0.75After 9days 37 ± 1.06*** 28.7 ± 0.73** 26 ± 1.05*** 22.2 ± 0.66*** 2.8 ± 0.49 4.2 ± 0.66* 55.2 ± 1.07*** 61.8 ± 1.11*** 13.6 ± 0.75*** 11.8 ± 1.11**After 14days 36.6 ± 1.86*** 26.3 ± 1.86 15.8 ± 1.11 18.2 ± 0.66*** 4.8 ± 0.8* 2.4 ± 1.17 2.4 ± 1.17 76.6 ± 2.01 5 ± 0.89* 3.4 ± 1.08**After 21days 46 ± 1.49*** 36.1 ± 1.67*** 20.8 ± 1.2*** 20.4 ± 2.31* 1.8 ± 0.58 3 ± 1 72.4 ± 2.84 71 ± 1.41 4.2 ± 0.66** 5.6 ± 0.75After 35days 24.5 ± 1.67 40.8 ± 1.17*** 21.4 ± 0.68*** 22.2 ± 0.66*** 2.2 ± 0.37 1.8 ± 0.58 68.4 ± 1.17* 70.6 ± 1.12 8 ± 0.63 5.4 ± 0.24*After 42days 35.3 ± 1.44*** 38.8 ± 1.16*** 22.6 ± 0.75*** 18.8 ± 0.73*** 1.4 ± 0.68 1 ± 0.45 66.2 ± 1.91* 72 ± 0.89 9.8 ± 2.01 8 ± 0.63
N=10 Control=non-infected with external parasites *Slightly significant different from control P<0.05 **Moderately significant different from control P<0.01 ***Highly significant different from control P<0.001
Table 4: Effect of Bio-Mos® on WBCs and differential leukocytic count of O. niloticus experimentally infected with external parasites.
Time WBCS ×103 mm3/µl Neutrophil% Esinophil % Lymphocyte% Monocyte%2 g/Kg 4 g/Kg 2 g/Kg 4 g/Kg 4 g/Kg 2 g/Kg 4 g/Kg 2 g/Kg 4 g/Kg 2 g/Kg
Control 24.5 ± 1.67 40.8 ± 1.17 21.4 ± 0.68 22.2 ± 0.66 5.4 ± 0.24 8 ± 0.63 70.6 ± 1.12 68.4 ± 1.15 1.8 ± 0.58 2.2 ± 0.3714 d. post infection 40.5 ± 0.79*** 21.9 ± 1.38*** 20.8 ± 0.37 19.8 ± 1.07 8 ± 1.05* 5.4 ± 0.51** 69.6 ± 0.93 72.2 ± 1.02* 2.6 ± 0.4 1.6 ± 0.51Control 35.3 ± 1.44 38.8 ± 1.16 22.6 ± 0.74 18.8 ± 0.73 8 ± 0.63 9.8 ± 2.01 72 ± 0.89 66.2 ± 1.91 1 ± 0.45 1.4 ± 0.6821d. post infection 38.4 ± 1.11 36.4 ± 2.87 20.4 ± 2.4 20.6 ± 0.6 9.6 ± 0.98 8 ± 0.63 70 ± 1.58 72 ± 2.19 1.2 ± 0.58 2.2 ± 0.66
Time Total protein (gm/dl) Albumin (gm/dl) Globulin (gm/dl) A/G ratioControl +ve 4.28 ± 0.09 1.22 ± 0.11 3.06 ± 0.08 0.4 ± 0.04
2 g/Kg 4 g/Kg 2 g/Kg 4 g/Kg 2 g/Kg 4 g/Kg 2 g/Kg 4 g/KgAfter 3 d. 2.68 ± 0.26*** 3.26 ± 0.63 1.45 ± 0.07 1.5 ± 0.19 1.23 ± 0.22*** 1.76 ± 0.68 1.25 ± 0.15*** 1.75 ± 0.8After 6 d. 3.41 ± 0.3* 4.24 ± 0.19 1.49 ± 0.08 1.84 ± 0.07*** 1.91 ± 0.34** 2.44 ± 0.14** 0.85 ± 0.14** 0.76 ± 0.04***After 9 d. 1.95 ± 0.33*** 3.24 ± 0.55 0.64 ± 0.12** 1.25 ± 0.22 1.31 ± 0.26*** 1.99 ± 0.42* 0.52 ± 0.09 0.66 ± 0.1*After 14 d. 3 ± 0.46* 3.27 ± 0.56 1.19 ± 0.27 1.14 ± 0.17 1.81 ± 0.26*** 2.12 ± 0.4* 0.66 ± 0.11* 0.56 ± 0.08After 21 d. 3.29 ± 0.19*** 2.85 ± 0.57* 1.15 ± 0.08 1.11 ± 0.08 2.14 ± 0.16*** 1.75 ± 0.54* 0.55 ± 0.04* 0.82 ± 0.25After 35 d. 2.26 ± 0.33*** 2.46 ± 0.72* 0.99 ± 0.16 1.4 ± 0.36 1.27 ± 0.18*** 1.06 ± 0.36*** 0.78 ± 0.08** 1.42 ± 0.16***After 42 d. 1.88 ± 0.25*** 2.09 ± 0.12*** 0.97 ± 0.15 1.35 ± 0.08 0.91 ± 0.19*** 0.73 ± 0.06*** 0.82 ± 0.03*** 1.86 ± 0.13***
N= 10 Control=infected with external parasites*Slightly significant different from control P<0.05 **Moderately significant different from control P<0.01***Highly significant different from control P<0.001
Table 5: Effect of Bio-Mos® on total proteins, Albumin, Globulin and A/G ratio of O. niloticus infected with external parasites.
Mos® activate the complement system via the alternative pathway [36], the complement work to trigger the recruitment of inflammatory cells and attract phagocytes, especially neutrophils. Neutrophils then trigger
other parts of the immune system by releasing factors that summon other leukocytes and lymphocytes [37]. Also, Mannan-oligosaccharide was reported to stimulate non specific components of the immune
Citation: Mohamed SM, Magdy IH, Olfat AM, Ebtsam AT, Nesreen SY (2013) Role of Oligosaccharides as Biological Additives in Cultured Oreochromis Niloticus. J Aquac Res Development 5: 207 doi:10.4172/2155-9546.1000207
Page 6 of 8
Volume 5 • Isue 1 • 1000207J Aquac Res DevelopmentISSN: 2155-9546 JARD, an open access journal
system [38], for example, the protective effects of MOS have been shown to be associated with the granular cells having the ability to be bound to mannose and to be involved in triggering cellular and humoral defense mechanism in response to a pathogen.
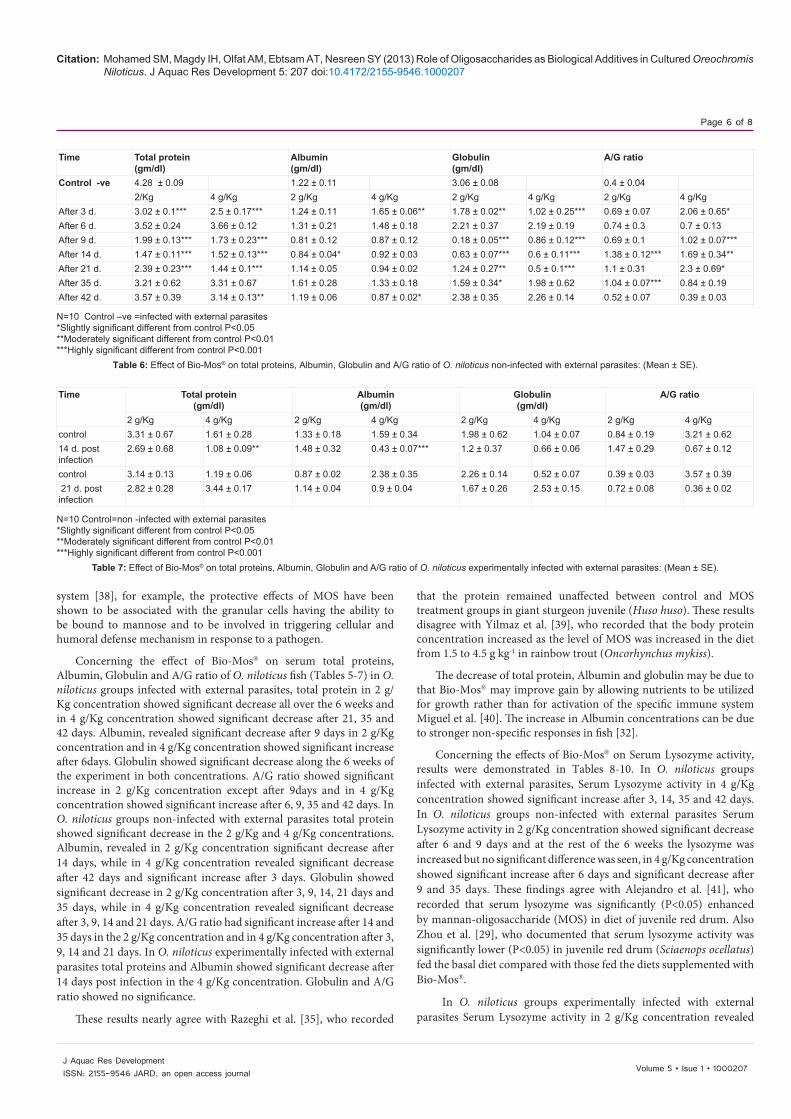
Concerning the effect of Bio-Mos® on serum total proteins, Albumin, Globulin and A/G ratio of O. niloticus fish (Tables 5-7) in O. niloticus groups infected with external parasites, total protein in 2 g/Kg concentration showed significant decrease all over the 6 weeks and in 4 g/Kg concentration showed significant decrease after 21, 35 and 42 days. Albumin, revealed significant decrease after 9 days in 2 g/Kg concentration and in 4 g/Kg concentration showed significant increase after 6days. Globulin showed significant decrease along the 6 weeks of the experiment in both concentrations. A/G ratio showed significant increase in 2 g/Kg concentration except after 9days and in 4 g/Kg concentration showed significant increase after 6, 9, 35 and 42 days. In O. niloticus groups non-infected with external parasites total protein showed significant decrease in the 2 g/Kg and 4 g/Kg concentrations. Albumin, revealed in 2 g/Kg concentration significant decrease after 14 days, while in 4 g/Kg concentration revealed significant decrease after 42 days and significant increase after 3 days. Globulin showed significant decrease in 2 g/Kg concentration after 3, 9, 14, 21 days and 35 days, while in 4 g/Kg concentration revealed significant decrease after 3, 9, 14 and 21 days. A/G ratio had significant increase after 14 and 35 days in the 2 g/Kg concentration and in 4 g/Kg concentration after 3, 9, 14 and 21 days. In O. niloticus experimentally infected with external parasites total proteins and Albumin showed significant decrease after 14 days post infection in the 4 g/Kg concentration. Globulin and A/G ratio showed no significance.
These results nearly agree with Razeghi et al. [35], who recorded
that the protein remained unaffected between control and MOS treatment groups in giant sturgeon juvenile (Huso huso). These results disagree with Yilmaz et al. [39], who recorded that the body protein concentration increased as the level of MOS was increased in the diet from 1.5 to 4.5 g kg-1 in rainbow trout (Oncorhynchus mykiss).
The decrease of total protein, Albumin and globulin may be due to that Bio-Mos® may improve gain by allowing nutrients to be utilized for growth rather than for activation of the specific immune system Miguel et al. [40]. The increase in Albumin concentrations can be due to stronger non-specific responses in fish [32].
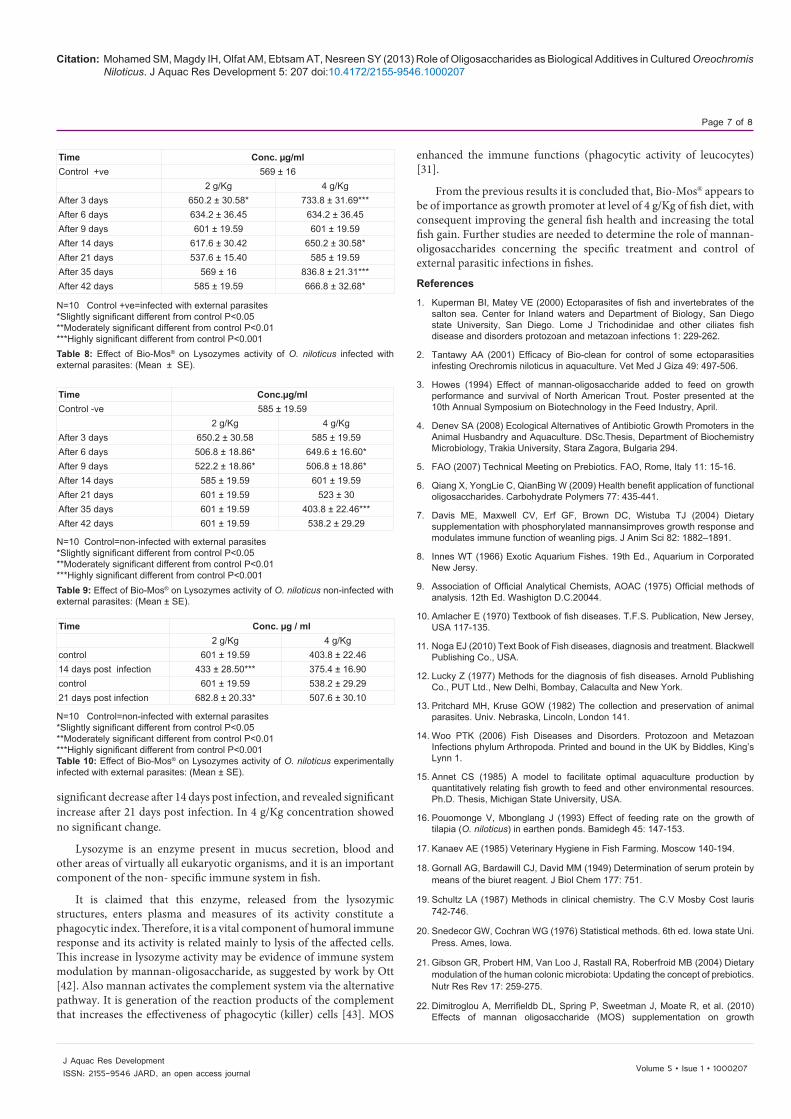
Concerning the effects of Bio-Mos® on Serum Lysozyme activity, results were demonstrated in Tables 8-10. In O. niloticus groups infected with external parasites, Serum Lysozyme activity in 4 g/Kg concentration showed significant increase after 3, 14, 35 and 42 days. In O. niloticus groups non-infected with external parasites Serum Lysozyme activity in 2 g/Kg concentration showed significant decrease after 6 and 9 days and at the rest of the 6 weeks the lysozyme was increased but no significant difference was seen, in 4 g/Kg concentration showed significant increase after 6 days and significant decrease after 9 and 35 days. These findings agree with Alejandro et al. [41], who recorded that serum lysozyme was significantly (P<0.05) enhanced by mannan-oligosaccharide (MOS) in diet of juvenile red drum. Also Zhou et al. [29], who documented that serum lysozyme activity was significantly lower (P<0.05) in juvenile red drum (Sciaenops ocellatus) fed the basal diet compared with those fed the diets supplemented with Bio-Mos®.
In O. niloticus groups experimentally infected with external parasites Serum Lysozyme activity in 2 g/Kg concentration revealed
Time Total protein(gm/dl)
Albumin(gm/dl)
Globulin(gm/dl)
A/G ratio
Control -ve 4.28 ± 0.09 1.22 ± 0.11 3.06 ± 0.08 0.4 ± 0.042/Kg 4 g/Kg 2 g/Kg 4 g/Kg 2 g/Kg 4 g/Kg 2 g/Kg 4 g/Kg
After 3 d. 3.02 ± 0.1*** 2.5 ± 0.17*** 1.24 ± 0.11 1.65 ± 0.06** 1.78 ± 0.02** 1.02 ± 0.25*** 0.69 ± 0.07 2.06 ± 0.65*After 6 d. 3.52 ± 0.24 3.66 ± 0.12 1.31 ± 0.21 1.48 ± 0.18 2.21 ± 0.37 2.19 ± 0.19 0.74 ± 0.3 0.7 ± 0.13After 9 d. 1.99 ± 0.13*** 1.73 ± 0.23*** 0.81 ± 0.12 0.87 ± 0.12 0.18 ± 0.05*** 0.86 ± 0.12*** 0.69 ± 0.1 1.02 ± 0.07***After 14 d. 1.47 ± 0.11*** 1.52 ± 0.13*** 0.84 ± 0.04* 0.92 ± 0.03 0.63 ± 0.07*** 0.6 ± 0.11*** 1.38 ± 0.12*** 1.69 ± 0.34**After 21 d. 2.39 ± 0.23*** 1.44 ± 0.1*** 1.14 ± 0.05 0.94 ± 0.02 1.24 ± 0.27** 0.5 ± 0.1*** 1.1 ± 0.31 2.3 ± 0.69*After 35 d. 3.21 ± 0.62 3.31 ± 0.67 1.61 ± 0.28 1.33 ± 0.18 1.59 ± 0.34* 1.98 ± 0.62 1.04 ± 0.07*** 0.84 ± 0.19After 42 d. 3.57 ± 0.39 3.14 ± 0.13** 1.19 ± 0.06 0.87 ± 0.02* 2.38 ± 0.35 2.26 ± 0.14 0.52 ± 0.07 0.39 ± 0.03
N=10 Control –ve =infected with external parasites*Slightly significant different from control P<0.05 **Moderately significant different from control P<0.01 ***Highly significant different from control P<0.001
Table 6: Effect of Bio-Mos® on total proteins, Albumin, Globulin and A/G ratio of O. niloticus non-infected with external parasites: (Mean ± SE).
Time Total protein(gm/dl)
Albumin(gm/dl)
Globulin(gm/dl)
A/G ratio
2 g/Kg 4 g/Kg 2 g/Kg 4 g/Kg 2 g/Kg 4 g/Kg 2 g/Kg 4 g/Kgcontrol 3.31 ± 0.67 1.61 ± 0.28 1.33 ± 0.18 1.59 ± 0.34 1.98 ± 0.62 1.04 ± 0.07 0.84 ± 0.19 3.21 ± 0.6214 d. post infection
2.69 ± 0.68 1.08 ± 0.09** 1.48 ± 0.32 0.43 ± 0.07*** 1.2 ± 0.37 0.66 ± 0.06 1.47 ± 0.29 0.67 ± 0.12
control 3.14 ± 0.13 1.19 ± 0.06 0.87 ± 0.02 2.38 ± 0.35 2.26 ± 0.14 0.52 ± 0.07 0.39 ± 0.03 3.57 ± 0.39 21 d. post infection
2.82 ± 0.28 3.44 ± 0.17 1.14 ± 0.04 0.9 ± 0.04 1.67 ± 0.26 2.53 ± 0.15 0.72 ± 0.08 0.36 ± 0.02
N=10 Control=non -infected with external parasites*Slightly significant different from control P<0.05 **Moderately significant different from control P<0.01***Highly significant different from control P<0.001
Table 7: Effect of Bio-Mos® on total proteins, Albumin, Globulin and A/G ratio of O. niloticus experimentally infected with external parasites: (Mean ± SE).
Citation: Mohamed SM, Magdy IH, Olfat AM, Ebtsam AT, Nesreen SY (2013) Role of Oligosaccharides as Biological Additives in Cultured Oreochromis Niloticus. J Aquac Res Development 5: 207 doi:10.4172/2155-9546.1000207
Page 7 of 8
Volume 5 • Isue 1 • 1000207J Aquac Res DevelopmentISSN: 2155-9546 JARD, an open access journal
significant decrease after 14 days post infection, and revealed significant increase after 21 days post infection. In 4 g/Kg concentration showed no significant change.
Lysozyme is an enzyme present in mucus secretion, blood and other areas of virtually all eukaryotic organisms, and it is an important component of the non- specific immune system in fish.
It is claimed that this enzyme, released from the lysozymic structures, enters plasma and measures of its activity constitute a phagocytic index. Therefore, it is a vital component of humoral immune response and its activity is related mainly to lysis of the affected cells. This increase in lysozyme activity may be evidence of immune system modulation by mannan-oligosaccharide, as suggested by work by Ott [42]. Also mannan activates the complement system via the alternative pathway. It is generation of the reaction products of the complement that increases the effectiveness of phagocytic (killer) cells [43]. MOS
enhanced the immune functions (phagocytic activity of leucocytes) [31].
From the previous results it is concluded that, Bio-Mos® appears to be of importance as growth promoter at level of 4 g/Kg of fish diet, with consequent improving the general fish health and increasing the total fish gain. Further studies are needed to determine the role of mannan-oligosaccharides concerning the specific treatment and control of external parasitic infections in fishes.
References
1. Kuperman BI, Matey VE (2000) Ectoparasites of fish and invertebrates of the salton sea. Center for Inland waters and Department of Biology, San Diego state University, San Diego. Lome J Trichodinidae and other ciliates fish disease and disorders protozoan and metazoan infections 1: 229-262.
2. Tantawy AA (2001) Efficacy of Bio-clean for control of some ectoparasities infesting Orechromis niloticus in aquaculture. Vet Med J Giza 49: 497-506.
3. Howes (1994) Effect of mannan-oligosaccharide added to feed on growth performance and survival of North American Trout. Poster presented at the 10th Annual Symposium on Biotechnology in the Feed Industry, April.
4. Denev SA (2008) Ecological Alternatives of Antibiotic Growth Promoters in the Animal Husbandry and Aquaculture. DSc.Thesis, Department of Biochemistry Microbiology, Trakia University, Stara Zagora, Bulgaria 294.
5. FAO (2007) Technical Meeting on Prebiotics. FAO, Rome, Italy 11: 15-16.
6. Qiang X, YongLie C, QianBing W (2009) Health benefit application of functional oligosaccharides. Carbohydrate Polymers 77: 435-441.
7. Davis ME, Maxwell CV, Erf GF, Brown DC, Wistuba TJ (2004) Dietary supplementation with phosphorylated mannansimproves growth response and modulates immune function of weanling pigs. J Anim Sci 82: 1882–1891.
8. Innes WT (1966) Exotic Aquarium Fishes. 19th Ed., Aquarium in Corporated New Jersy.
9. Association of Official Analytical Chemists, AOAC (1975) Official methods of analysis. 12th Ed. Washigton D.C.20044.
10. Amlacher E (1970) Textbook of fish diseases. T.F.S. Publication, New Jersey, USA 117-135.
11. Noga EJ (2010) Text Book of Fish diseases, diagnosis and treatment. Blackwell Publishing Co., USA.
12. Lucky Z (1977) Methods for the diagnosis of fish diseases. Arnold Publishing Co., PUT Ltd., New Delhi, Bombay, Calaculta and New York.
13. Pritchard MH, Kruse GOW (1982) The collection and preservation of animal parasites. Univ. Nebraska, Lincoln, London 141.
14. Woo PTK (2006) Fish Diseases and Disorders. Protozoon and Metazoan Infections phylum Arthropoda. Printed and bound in the UK by Biddles, King’s Lynn 1.
15. Annet CS (1985) A model to facilitate optimal aquaculture production by quantitatively relating fish growth to feed and other environmental resources. Ph.D. Thesis, Michigan State University, USA.
16. Pouomonge V, Mbonglang J (1993) Effect of feeding rate on the growth of tilapia (O. niloticus) in earthen ponds. Bamidegh 45: 147-153.
17. Kanaev AE (1985) Veterinary Hygiene in Fish Farming. Moscow 140-194.
18. Gornall AG, Bardawill CJ, David MM (1949) Determination of serum protein by means of the biuret reagent. J Biol Chem 177: 751.
19. Schultz LA (1987) Methods in clinical chemistry. The C.V Mosby Cost lauris 742-746.
20. Snedecor GW, Cochran WG (1976) Statistical methods. 6th ed. Iowa state Uni. Press. Ames, Iowa.
21. Gibson GR, Probert HM, Van Loo J, Rastall RA, Roberfroid MB (2004) Dietary modulation of the human colonic microbiota: Updating the concept of prebiotics. Nutr Res Rev 17: 259-275.
22. Dimitroglou A, Merrifieldb DL, Spring P, Sweetman J, Moate R, et al. (2010) Effects of mannan oligosaccharide (MOS) supplementation on growth
Time Conc. µg/mlControl +ve 569 ± 16
2 g/Kg 4 g/KgAfter 3 days 650.2 ± 30.58* 733.8 ± 31.69***After 6 days 634.2 ± 36.45 634.2 ± 36.45After 9 days 601 ± 19.59 601 ± 19.59After 14 days 617.6 ± 30.42 650.2 ± 30.58*After 21 days 537.6 ± 15.40 585 ± 19.59After 35 days 569 ± 16 836.8 ± 21.31***After 42 days 585 ± 19.59 666.8 ± 32.68*
N=10 Control +ve=infected with external parasites*Slightly significant different from control P<0.05**Moderately significant different from control P<0.01 ***Highly significant different from control P<0.001 Table 8: Effect of Bio-Mos® on Lysozymes activity of O. niloticus infected with external parasites: (Mean ± SE).
Time Conc.µg/ml Control -ve 585 ± 19.59
2 g/Kg 4 g/KgAfter 3 days 650.2 ± 30.58 585 ± 19.59After 6 days 506.8 ± 18.86* 649.6 ± 16.60*After 9 days 522.2 ± 18.86* 506.8 ± 18.86*After 14 days 585 ± 19.59 601 ± 19.59After 21 days 601 ± 19.59 523 ± 30After 35 days 601 ± 19.59 403.8 ± 22.46***After 42 days 601 ± 19.59 538.2 ± 29.29
N=10 Control=non-infected with external parasites *Slightly significant different from control P<0.05 **Moderately significant different from control P<0.01 ***Highly significant different from control P<0.001 Table 9: Effect of Bio-Mos® on Lysozymes activity of O. niloticus non-infected with external parasites: (Mean ± SE).
Time Conc. µg / ml 2 g/Kg 4 g/Kg
control 601 ± 19.59 403.8 ± 22.4614 days post infection 433 ± 28.50*** 375.4 ± 16.90control 601 ± 19.59 538.2 ± 29.2921 days post infection 682.8 ± 20.33* 507.6 ± 30.10
N=10 Control=non-infected with external parasites *Slightly significant different from control P<0.05**Moderately significant different from control P<0.01 ***Highly significant different from control P<0.001 Table 10: Effect of Bio-Mos® on Lysozymes activity of O. niloticus experimentally infected with external parasites: (Mean ± SE).

Citation: Mohamed SM, Magdy IH, Olfat AM, Ebtsam AT, Nesreen SY (2013) Role of Oligosaccharides as Biological Additives in Cultured Oreochromis Niloticus. J Aquac Res Development 5: 207 doi:10.4172/2155-9546.1000207
Page 8 of 8
Volume 5 • Isue 1 • 1000207J Aquac Res DevelopmentISSN: 2155-9546 JARD, an open access journal
performance, feed utilization, intestinal histology and gut microbiota of gilthead sea bream (Sparus aurata). Aquaculture 300: 182-188.
23. Lome J (1995) Trichodinidae and other ciliates fish disease and disorders protozoan and metazoan infections 1: 229-262.
24. Post G (1987) Text book of fish Health. TFH. Publications, Inc Neptune city, New Jersey 159-214.
25. Meyer FP (1966) Parasites of fresh water fishes. IV. Miscellaneous 6 parasites of catfish. Fish Dis Leafi Bur Spoi Fish Wildi 5.
26. Kabata Z (1985) Parasites and diseases of fish cultured in the tropics. Taylor & Francis London and Philadelphia 127-161.
27. Iji PA, Saki AA, Tivey DR (2001) Intestinal structure and function of broiler chickens on diets supplemented with a mannanoligosaccharide. J Sci Food Agri 1: 1186-1192.
28. Spring P, Wenk C, Dawson KA, Newman KE (2000) The effects of dietary mannanoligosaccharides on cecal parameters and the concentrations of enteric bacteria in the caeca of Salmonella-challenged broiler chicks. Poult Sci 79: 205-211.
29. Gaskins HR (2001) Intestinal bacteria and their influence on swine growth. Pages in Swine Nutrition. 2nd ed. A. J. Lewis and L. L. Southern, eds. CRC Press, Boca Raton, FL 585-608.
30. Zhou XQ, Alejandro J, Gatlin DM (2010) Effects of dietary prebiotics on growth performance, immune response and intestinal morphology of red drum (Sciaenops ocellatus). Aquaculture 309: 253-257.
31. Torrecillas S, Makol A, Caballero MJ, Montero D, Robaina L, et al. (2007) Immune stimulation and improved infection resistance in European sea bass (Dicentrarchus labrax) fed mannan oligosaccharides. Fish & Shellfish Immunology 23: 969-981.
32. Andrews SR, Sahu NP, Pal AK, Kumar S (2009) Haematological modulation and growth of Labeo rohita fingerlings: effect of dietary mannan oligosaccharide, yeast extract, protein hydrolysate and chlorella. Aquaculture Research 41: 61-69.
33. Dimitroglou A, Merrifield DL, Moate R, Davies SJ, Spring P, et al. (2009) Dietary mannan-oligosaccharide supplementation modulates intestinal microbial ecology and improves gut morphology of rainbow trout, Oncorhynchus mykiss (Walbaum). J Anim Sci 87: 3226–3234.
34. Ricardo YS, Álvaro J, José E (2008) Feeding Dietary Mannan- Oligosaccharides to Juvenile Nile Tilapia, Oreochromis niloticus, has no effect on hematological parameters and showed decreased feed consumption. Journal of the World Aquaculture Society 39: 821-826.
35. Razeghi M, Akrami R, Ghobadi S, Amani K, Ezatrahimi N, Gharaei A (2011) Effect of dietary mannan oligosaccharide (MOS) on growth performance, survival, body composition, and some hematological parameters in giant sturgeon juvenile (Huso huso). Fish Physiology and Biochemistry 1-7.
36. Spring P (2002) Manipulating gut microflora through phosphorylated mannan-oligosaccharides. Proceedings of Alltech’s 16th Annual European Lecture Tour 13-25.
37. Viera S, Jakubovský J, Hulín I (1995) Inflammation and Fever from Pathophysiology: Principles of Disease. Computing Centre, Slovak Academy of Sciences: Academic Electronic Press.
38. Dobrescu G (2002) Mannose and Lipopolysaccharide Receptors on the Surface of Granular Hemocytes from the Crayfish Procambarus clarkia. Master of Science Thesis in Biology. Health Sciences. East Tennessee State University 58.
39. Yilmaz E, Genc MA, Genc E (2007) Effects of dietary mannan oligosaccharides on growth, body composition, intestine and liver histology of rainbow trout, Oncorhynchus mykiss. Israeli J Aquac 59: 182-188.
40. Miguel JC, Rodriguez-Zas DL, Pettigrew JE (2004) Efficacy of a mannan oligosaccharide (Bio-Mos) for improving nursery pig performance. J Swine Health Prod 12: 296-307.
41. Alejandro J, Neill W, Gatlin D (2010) Effects of dietary prebiotics on the growth, feed efficiency and non-specific immunity of juvenile red drum Sciaenops ocellatus fed soybean-based diets. Aquaculture Research 41: 411-418.
42. Ott EA (2005) Influence of Bio-Mos®, a mannan oligosaccharide supplement, on the immune system of the mare and neonatal foal. In: Nutritional Biotechnology in the Feed and Food Industries, Proceedings of Alltech’s 21st Annual Symposium (T.P. Lyons and K.A. Jacques, eds). Notthingham University Press, UK, pp. 447-454.
43. Sisak F (1995) Stimulation of phagocytosis as assessed by luminol-enhanced chemiluminescence and response to salmonella challenge of poultry fed diets containing mannan-oligosaccharides. In: Lyons TP, Jacqus KA, editors. Biotechnology in the feed industry, proceedings of Alltech’s 10th annual symposium. Nottingham, UK.
Submit your next manuscript and get advantages of OMICS Group submissionsUnique features:
• User friendly/feasible website-translation of your paper to 50 world’s leading languages• Audio Version of published paper• Digital articles to share and explore
Special features:
• 300 Open Access Journals• 25,000 editorial team• 21 days rapid review process• Quality and quick editorial, review and publication processing• Indexing at PubMed (partial), Scopus, EBSCO, Index Copernicus and Google Scholar etc• Sharing Option: Social Networking Enabled• Authors, Reviewers and Editors rewarded with online Scientific Credits• Better discount for your subsequent articles
Submit your manuscript at: http://www.omicsonline.org/submission
Citation: Mohamed SM, Magdy IH, Olfat AM, Ebtsam AT, Nesreen SY (2013) Role of Oligosaccharides as Biological Additives in Cultured Oreochromis niloticus . J Aquac Res Development 5: 207 doi:10.4172/2155-9546.1000207