role of hypovolemia in dialysis-induced hypotension
TRANSCRIPT
Artificial Organs 12(2):116-121, Raven Press, Ltd., New York 0 1988 International Society for Artificial Organs
Role of Hypovolemia in Dialysis-Induced Hypotension
*Kenji Maeda, "Hiroyuki Morita, *Takahiro Shinzato, *Benjamin Vazquez Vega, "Hiroyuki Kobayakawa, **Toshikazu Ishihara, **Hazime Inagaki, **Isemi Igarashi, and
**Tomoyuki Kitano
*Nagoya University Branch Hospital, Nagoya, and **Toyota Central R & D Labs, Japan
Abstract: Blood volume was measured continuously during hemodialysis using the authors' hematocrit contin- uous measurement system in an attempt to determine any relationship between dialysis-induced hypotension with acute onset and blood volume. Hypotension resulted ap- proximately 3 h into dialysis in the present study. This point in time was that at which blood volume was more than 5% above the minimum level during the dialysis treatment, and in some patients it was more than 10%
over the minimum level of blood volume. At the time di- alysis-induced hypotension occurred or before, there was no sharp decrease in blood volume nor any change in the plasma refilling rate. This suggested that this hy potension is caused by a sudden breakdown of the blood pressure support mechanism compensating for decreased blood volume. Key Words: Hypotension-Hemodialysis- Blood volume-Hypovolemia-Plasma refilling rate.
Several factors have been proposed as the etio- logic mechanism triggering dialysis-induced hypo- tension. They include hypovolemia (l), autonomic insufficiency (2,3), decreasing serum osmolality (4-6), inhibition of compensatory vasoconstriction (7,8), efficiency of diffusive solute transport (9), and depletion of vasoactive substances (10,ll). Still, all of the above factors taken together from various investigators fail to offer a consistent, co- hesive, and meaningful body of knowledge in rela- tion to dialysis-induced hypotension. Perhaps the present consensus could only be that this type of hypotension is multifactorial. To elucidate the mechanism triggering dialysis-induced hypoten- sion, close consideration must be given to the rela- tion between each of the above-mentioned factor's variation over time and the dialysis-induced hypo- tension.
Hypovolemia is one of the first factors suggested to be a cause of dialysis-induced hypotension ( l ) , and it seems to have taken on the role of the main cause of hypotension in the minds of some. But
Received March 1987; revised September 1987. Address correspondence and reprint requests to Kenji Maeda,
M.D., Nagoya University Branch Hospital, 1-20, Daiko-minarni 1-chome, Higashi-ku, Nagoya, 461 Japan.
there is still no study to date that clarifies the rela- tionship between changes in blood pressure and varying blood volume up to the time when dialysis- induced hypotension occurs, possibly because no method for continuous measurement of blood volume was available. The aim of the present study was therefore to determine whether or not there was any sudden decrease of blood volume at the time of dialysis-induced hypotension with acute onset, employing the authors' newly developed he- matocrit continuous measurement system (12).
METHODS
Twenty-nine long-term dialysis patients who often had dialysis-induced hypotension with acute onset and who were not on any cardiotonic or anti- hypertensive drugs were selected as the subjects of this study. Changes in circulating blood volume were measured continuously, and blood pressure was obtained from these patients during 37 of their dialysis treatments. In the present study, dialysis- induced hypotension was defined as a drop in sys- tolic blood pressure of more than 20 mm Hg within 10 min during hemodialysis, accompanied by symptom(s) such as vomiting, sweating, or lowered consciousness.
116
DIAL YSIS-INDUCED HYPOTENSION I17
Of the above-mentioned 37 dialyses, there were 19 in which dialysis-induced hypotension occurred a total of 23 times among 15 patients (6 men, 9 women), anywhere from 1 to 2 times per dialysis. For the present study, only the data from these 15 patients during their 19 dialyses were used. The average age of the 15 subjects was 52.3 t 2.6 years (? SD), their weight range 50.5 ? 2.2 kg (t SD), and their mean number of years on dialysis was 6.4 k 0.8 ( 5 SD). They were free of clinical symptoms of cardiac insufficiency and neuropathy. The heart rate and the mean blood pressure before hemodial- ysis were 82.5 t 20.3 beats/min (t SD) and 104.3 -+ 14.6 mm Hg ( t S D ) , respectively. These pa- tients did not suffer from any type of arrhythmia. The renal disease was chronic glomerulonephritis. The residual renal function was less than 3 ml/min of calculated creatinine clearance. None of the pa- tients were anephric or parathyroidectomized.
Six patients used a Gambro Plate Dialyzer (Cu- prophan, 1.0 m2) and another 9 an Asahi AM Neo Dialyzer (Cuprammonium rayon, 1.0 or 1.5 m2). A volumetric ultrafiltration controller (DBB-22@, Nikkiso Co., Ltd., Tokyo, Japan) was used for the dialysate supply and control of the ultrafiltration rate. During the hemodialyses, the ultrafiltration rate was kept constant at 9.23 * 0.99 ml/min ( _C SD). The dialysate consisted of Na 135 mEq/L, K 2.0 mEq/L, Ca 3.5 mEq/L, Mg 1.5 mEq/L, C1 105 mEq/L, acetate 37 mEq/L, and glucose 200 mg/dl.
To measure the circulating blood volume, the au- thors employed their own hematocrit continuous measurement system (12), which works off the principle of increasing blood electrical resistance in terms of increasing hematocrit and, conversely, allows the hematocrit value to be obtained from the electrical resistance of the circulating blood. In the system under study here, a minifilter (Asahi PAN 60P, polyacrylonitrile, 0.6 m2) was placed in series just upstream of the dialyzer to obtain ultrafiltra- tion at a rate of 10 ml/min. Downstream of the mini- filter, as well as at a point upstream of the dialyzer, the fluid was replaced at the same rate. The re- placement fluid composition was Na 140 mEq/L, K 2.0 mEq/L, Ca 3.5 mEq/L, Mg 1.5 mEq/L, C1 107 mEqlL, and acetate 40 mEq/L. The plasma electro- lyte composition downstream of the dialyzer showed no difference when fluid replacement was performed either at 10 mlfmin or not at all in the minifilter. Using the ultrafiltrate resistivity, the ef- fect of the electrolyte concentration upon blood electrical resistivity could be cancelled. During di- alysis, this system indicated the hematocrit level every 5 s, recording the mean value every 30 s.
From the stature and the weight at the end of the dialysis, the standard blood volume was estimated using the formula of Hidalgo et al. (13). Then, from this standard value and the variations in the hemat- ocrit (mean value every 30 s) during the hemodial- ysis, the circulating blood volume was estimated at each point.
Using such 21 blood volumes determined every 30 s beginning with the 10 rnin before hypotension was induced until it in fact occurred, a linear re- gression equation was calculated, and the slope was taken for the rate of decrease in the blood volume at the time of the dialysis-induced hypotension. Using the same method, the same diminution rate was estimated for 10, 20, and 30 rnin before hypo- tension developed (i.e., the slope of the linear re- gression equation between 20 to 10 min before hy- potension, 30 to 20; and 40 to 30 rnin before the same, respectively). Also, basing upon the rate of blood volume decrease and the water removal rate, the plasma refilling rate was obtained at the time of the hypotension and at 10, 20, and 30 rnin before the same.
Two milliliters of the ultrafiltrate developing in the minifilter was sampled every 5 min, and both its sodium and potassium concentrations were mea- sured by autoanalyzer. From pretesting it was found that the sodium and potassium concentra- tions of the ultrafiltrate were approximately equiva- lent to those of the plasma at 45 s beforehand. Then the electrolyte level of the ultrafiltrate obtained in this way in place of the 45-s earlier electrolyte level of the plasma was used.
Blood pressure was measured at the time of dial- ysis-induced hypotension as well as at every 5 rnin during dialysis with an auto-sphygmomanometer. It is often difficult to measure diastolic blood pressure noninvasively when hypotension develops. Thus, only the systolic blood pressure was observed in this investigation.
Hereafter, all data were expressed as the mean * SE, and paired Student’s t test was used for the statistical processing.
RESULTS
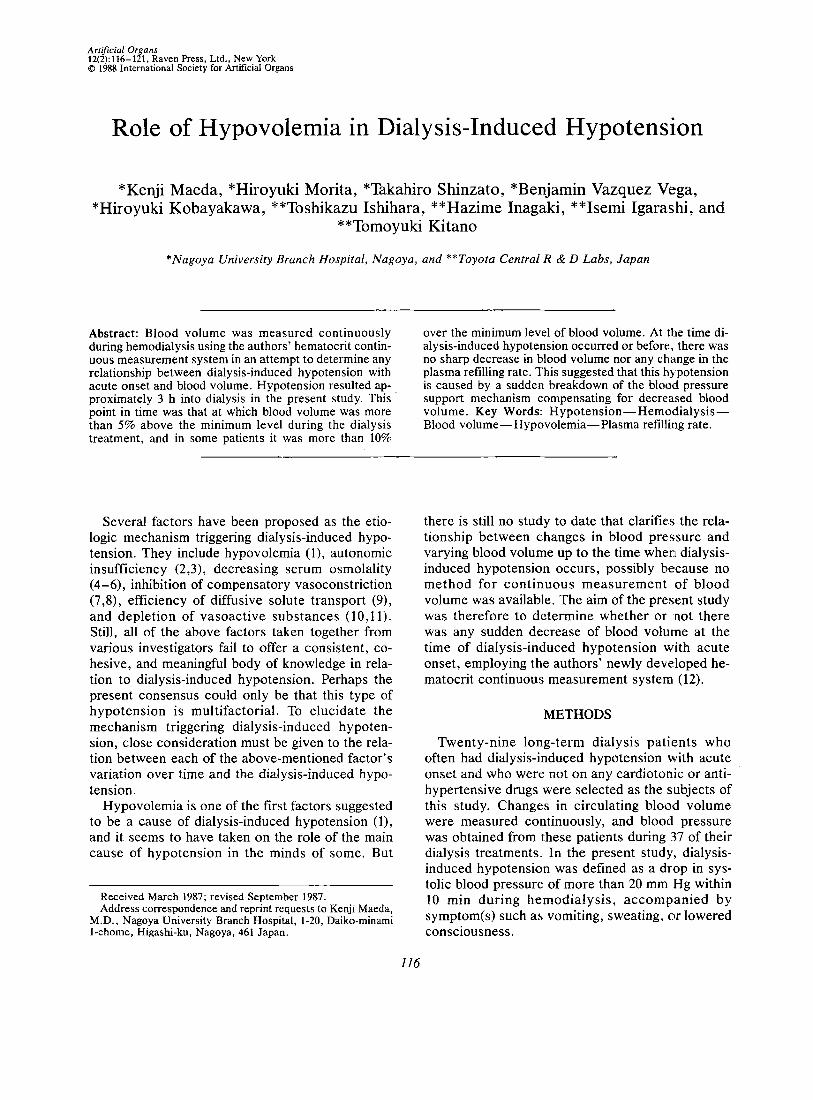
Figure 1 shows the changes with time in blood volume during 19 hemodialyses in 15 patients. Blood volume rapidly diminished immediately after dialysis was begun, and this rate of decrease ta- pered off as treatment progressed. This phenom- enon corresponds with the blood volume variation pattern projected by Kimura et al. (14) with a math-
Artif Organs. Vol. 12, No. 2, 1988
118
n =? E
W
E P 3 -
rn 0 0 - m
K . MAEDA ET AL.
I T
I I I Dialysis Start of 1st hour 2nd hour 3rd hour dialysis
FIG. 1. Changes over time in blood volume during hemodialysis.
ematical model and also corroborates the results of Kim et al. (1).
The hypotension induced by dialysis occurred 2.95 t 0.17 h into dialysis. As can be seen from Figure 1, at this point the rate of blood volume de- crease was very much diminished. With each of the patients, the results also indicated that there was no sharp decrease in the blood volume either before or at the actual onset of hypotension induced by dial- ysis treatment. Thus, there was no statistically sig- nificant difference in the rate of blood volume de- crease at 30, 20, and 10 rnin before hypotension or at the time of same (Table 1). The plasma refilling rate, which is obtained from the water removal rate and the rate of blood volume decrease, also showed no significant variation at 30, 20, and 10 rnin before or when hypotension developed.
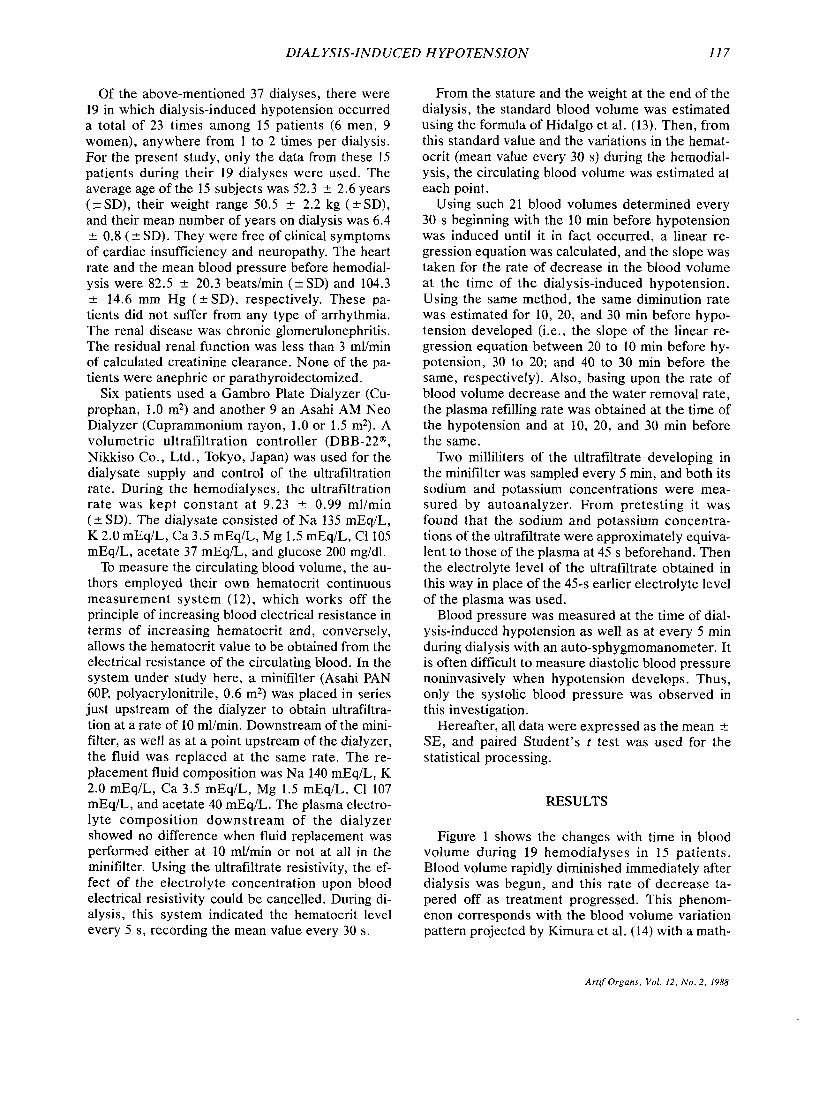
As indicated in Figure 2, the circulating blood volume in the patients under study at the start of
TABLE 1. Rate of blood volume decrease, piasma refilling rate, and heart rate before and at the time of
dialysis-induced hypotension
Blood volume Plasma
Systolic Diminution Refilling
(mm Hg) (beaumin) (mVmin) (rnlhin) blood pressure Heart rate rate rate
V, 128 2 5 83.6 2 5.2 3.56 ? 0.70 6.57 5 0.95 V, 134 k 6 88.1 5 6.1 3.17 2 0.66 6.90 2 0.86 V, 118 2 6" 87.3 t 5.8 2.98 % 0.68 7.02 % 0.81 V, 76 i 4b 80.1 I 5.6 3.25 0.84 6.88 % 0.84
V,, V,, and V, represent values at 30, 20, and 10 min before hypotension developed, respectively, and V, indicates values at the time of hypotension.
(p < 0.05) and b(p < 0.001) denote values that were signifi- cantly different from the preceding value (V,-V,, V,-V,, V,-V,).
hemodialysis was 4,245 5 201 ml, against 3,440 t 160 ml at the end of dialysis, and 3,338 ? 138 ml as the minimum blood volume. However, when hypo- tension resulted from dialysis, the blood volume was 3,506 2 138 ml. A comparison of the blood volume when hypotension occurred with the min- imum value during the course of dialysis shows that of 23 hypotensive episodes, the dialysis-induced hypotension occurred when the blood volume was 10% over the minimum blood volume in four in- stances; on the overall, hypotension developed when the level was 5.26 k 0.92% above the rnin- imum blood volume.
Also, whereas the hypotension occurred at an average of 2.95 ? 0.17 h after dialysis was begun, the minimum blood volume was attained 3.80 t 0.12 h after the treatment was initiated.
As seen in Table 2, the plasma sodium cuincentra- tion began to fall very slowly following the start of dialysis; it fell from 137.8 _t 0.4 mEq/L, immedi- ately following the start of dialysis to 136.3 & 0.3 mEq/L (p < 0.05) at 30 rnin before the dialysis-in- duced hypotension occurred. However, for 30 rnin immediately before hypotension developed, the plasma sodium level obtained every 5 rnin failed to display any significant decrease in relation to either the value at 30 rnin before the hypotension resulted or its respective preceding values.
On the other hand, the plasma potassium level fell rapidly immediately following the start of dial- ysis, but gradually tapered off so as to attain, at 30 rnin before dialysis-induced hypotension devel- oped, a level no different from that obtained at 5 min before the hypotension. However, as shown in Table 2 when the hypotension developed, there was a rapid rise in the plasma potassium level; with fast
Artif Organs, Vol. 12, No. 2, 1988
DIAL YSIS-IND UCED HYPOTENSION 119
4 5 0 0 1 T n 9) E
W
E 8 3 -
TI 0 0 z
T T
Initial Blood Volume Minimum Blood Volume Blood Volume during Blood Volume at
Dialysis induced End Hypotension
FIG. 2. Blood volume at beginning and end of hemodialysis as well as when dialysis-induced hypotension occurs, together with minimum blood volume during hemodialysis.
administration of saline solution, the blood pres- sure recovered, and at the same time the plasma potassium level reverted to the pre-hypotension level. The plasma potassium concentration then gradually resumed its moderate decline,
DISCUSSION
Clinically, dialysis-induced hypotension presents as gradually decreasing blood pressure with even- tual symptom(s), or as a sudden drop with
TABLE 2. Plasma sodium and potassium concentvations before and at the time of
dialysis-induced hypotension
Systolic Sodium Potassium blood pressure concentration concentration
(mm Hg) (mEqiL) (mEqiL)
At start of hernodial ysis
30 min before hypotension
25 min before hypotension
20 min before hypotension
IS min before hypotension
10 rnin before hypotension
5 min before hypotension
At time of hypotension
5 rnin after hypotension
10 min after hypotension
At the end of hemodialys is
144 t 7
128 t 5b
Not measured
134 i 6
Not measured
118 -t 6"
Not measured
76 i 4b
120 ? l b
122 i 6
117 i 6'
137.8 5 0.4 5.4 i 0.1
136.3 t 0.3" 3.9 i 0.2b
136.2 2 0.3 3.9 ? 0.2
136.4 t 0.3 3.8 f 0.1
136.3 t 0.3 3.9 i 0.1
136.2 lr 0.2 3.9 * 0.1
136.3 5 0.2 3.9 5 0.1
136.2 t 0.2 4.3 i 0.1"
136.3 5 0.2 3.8 F 0.1"
136.2 5 0.2
136.0 5 0.2
3.9 ? 0.1
3.6 -c 0.1"
a p < 0.05 and bp < 0.001 denote values that were significantly different from the preceding measured value.
symptom(s) in an otherwise rather stable blood pressure. No consensus is found as to the mecha- nism triggering either, other than to indicate that it must be multifactorial. To pinpoint what triggers these types of dialysis-induced hypotension, we must first observe any variation over time in each factor thus far proposed and consider the relation- ship between changes in the factor during hemodi- alysis with the drop in blood pressure.
Among the factors, hypovolemia has been taken for a key factor causing hypotension. However, no research has elucidated the role of hypovolemia in dialysis-induced hypotension. The authors attribute this to the unavailability of any continuous method for measuring blood volume, a problem resolved by the recently developed hematocrit continuous mea- surement system (12). It was used to investigate changes over time in blood volume during hemodi- alysis and its possible correlation with variations in blood pressure at the time of dialysis-induced hy- potension. The dialysis-induced hypotension in which there is a sudden drop in blood pressure was studied because it seemed a good type for empha- sizing the relation between blood volume and hypo- tension.
Dialysis-induced hypotension and its connection with hypovolemia can be conceived in terms of the following two pictures. In one, a sharp or excessive decrease in blood volume exceeds the compensa- tory capacity of the chronically impaired blood pressure support mechanisms (15- 18), and dial- ysis-induced hypotension results. In the other pic- ture, there is some abrupt breakdown of the blood pressure support mechanism compensating for the loss of blood volume.
Artif Organs, Vol. 12, No. 2, 1988
120 K . MAEDA ET AL.
In the present investigation, the dialysis-induced hypotension occurred when the blood volume was 5% over its lowest level during hemodialysis; and in some patients, it developed when blood volume was 10% over the minimum level. Also, there was no sudden loss of blood volume at the time the hy- potension occurred. This finding, of course, does not corroborate our first picture. Hence, the sud- denly induced hypotension during dialysis is con- sidered to be due to a sudden breakdown of the blood pressure support mechanism compensating for loss of blood volume which is ascribable either to the ultrafiltrate or water transfer into cells
There is still no explanation for what triggers the breakdown of the blood pressure support system.
In the present study, it was discovered that there was no change in the plasma sodium level for a con- siderable time before any hypotension was induced by the dialysis. In this way, the fact that there was no abrupt drop in the plasma sodium level, either before or at the time of acute hypotension, un- dercuts any argument that the sudden drop in plasma osmolality of itself could have caused the abrupt breakdown in the blood pressure support mechanism.
Nevertheless, in hemodialysis using low sodium dialysate, dialysis-induced hypotension frequently occurs. In hemodialysis with a high sodium dialy- sate, or in sequential ultrafiltration (4-6), the low incidence of dialysis-induced hypotension is an ac- knowledged fact. When a low sodium dialysate is used, there is a shift of fluid to within the cells as the plasma osmolality decreases (14,2 1,22); this phenomenon may also result in the cells that make up the blood pressure support system. The edema of these cells, along with numerous other factors such as ischemia in this system due to hypovo- lemia, elevation in the plasma acetate level and the like, may create a predisposition to acute vasculo- pathy or autonomic neuropathy.
In the present study, it was found that there was a rapid rise in the plasma potassium level when hy- potension developed. During a hemodialysis in which potassium is continuously removed, the po- tassium is consecutively eliminated from within cells to the outside thereof. If the extracorporeal circulation is suddenly stopped, according to sepa- rately conducted experiments by the present au- thors, the plasma potassium level suddenly climbs. However, in the present study, no attempt was made to stop the extracorporeally circulating blood flow either before or at the actual time when dial- ysis-induced hypotension occurred. This phenom-
( 14,19 -22).
enon may result from the ischemia of the tissue caused by impaired microcirculation occurring at the time when the hypotension was induced by the dialysis; ischemia of the tissue would have led to a decrease in the Na-K ATPase activity in the cell membranes, and then a decrease in the actrve trans- port of potassium within the cells.
REFERENCES
I .
2.
3 .
4.
5 .
6.
7.
8.
9.
10.
I I .
12.
13.
14.
15.
16.
Kim KE, Neff M, Cohen B, Somerstein M, Chini:tz J, Onesti G, Swartz C. Blood volume changes and hypotension during hemodialysis. Trans A m SOC A r f i f I n f t ? r n Organs
Kersch ES, Kronfield SJ, Unger A, Popper RA', Cantor S, Cohn K. Autonomic insufficiency in uremia its a cause of hemodialysis-induced hypotension. N Engl J Med
Nies AS, Robertson D, Stone WJ. Hernodialysis hypoten- sion is not the result of uremic peripheral autonoPic neurop- athy. J Lnb Clin Med 1979;94:395-402. Kobayashi K, Shibata M, Kato K, Nakamura S, Kato S, Kurachi K, Maeda K, Imai T, Yasuda B, Ota K, Kawaguchi S, Tsutsui S , Shimizu K, Yamazaki C, Manji T, Nomura T. Studies on the development of a new method of controlling the amount and contents of body fluids (extracorporeal ul- trafiltration method: ECUM) and the application of this method for patients receiving long-term hemodialysis. Jap J Nephrol 1972;14:539-53. Ing T, Ashbach DL, Kanter A, Oyama J H . Armbruster KFW, Merkel FK. Fluid removal and negative-pressure hy- drostatic ultrafiltration using a partial vacuum. Nephron
Bergstrom J, Asaba H, Furst P, Oults R. Dialysis ultrafiltra- tion and blood pressure. Proc Eur Dial Transpl Assoc
Olinger GN, Werner PH, Boncheck LI, Boertlo,om LE. Va- sodilator effects of the sodium acetate in pooled protein fraction. Ann Surg 1979;190:305-11. Aizawa Y , Ohmori T, Imai K, Nara Y, Matsuoka M, Hira- sawa Y. Depressant action of acetate upon the human car- diovascular system. Clin Nephrol 1977;8:477-80. Shaldon S , Deschodt G, Beau MC, Ramperez P, Mion C. The importance of serum osmotic changes in symptomatic hypotension during short hemodialysis. Pro(. Clin Did & Transpl Forum 1978;8:184-8. Cannella G, Picotti GB, Mioni G, Cristinelli I,, Maiorca R. Blood pressure behaviors during dialysis and uktrafiltration. A pathogenic hypothesis on hemodialysis-induced hypoten- sion. In? J Artif Organs 1978;1:69-75. Brecht HM, Ernst W, Koch KM. Plasma noradrenaline levels in regular hemodialysis patients. Prcx Eur Dial Transpl Assoc 1976;12:281-90. Maeda K, Shinzato T, Yoshida F, Tsuruta Y. Usuda M, Ya- mada K, lshihara T, Inagaki F, Igarashi I, Kitano T. Newly developed circulating blood volumemonitoring system and its clinical application for measuring changes in blood volume during hemofiltration. Artif Organs 3986;10:452-9. Hidalgo JU, Nadler SB, Block T. The use of electronic dig- ital computer to determine best fit of blood volume for- mulas. J Nucl Med 1962;3:94-9. Kimura G , Satani M, Kojima S, Osada T, Itoh K . Simulation study on plasma volume change during hemodialysis. Kidney Dialysis 1982;13:833-6 (in Japanese). Pickering TG, Gribbon B, Oliver DO. Narrow reflex sensi- tivity in patients on long-term hemodialysis. Clin Sci
Lazarus. JM, Hampers CL, Lowrie EG, Memll JP. Barore-
1970; 16:SOS - 14.
1974;209:650-3.
197% 14:45 1-5.
1976; 13:293-30S.
I972 ;43 :64S - 57.
Artif Organs, Vol. 12, No. 2, 1988
DIALYSIS-INDUCED HYPOTENSION 121
ceptor activity in normotensive and hypertensive uremic pa- tients. Circulation 1973;47: 1015-21.
17. Lilley JJ. Golden J , Stone RA. Adrenergic regulation of blood pressure in chronic renal failure. J Clin Invest
18. McGrath BP, Tiller DJ, Bune A, Chalmers JP, Korner PI, Uther JB. Autonomic blockade and the Valsalva maneuver in patients on maintenance hemodialysis: a hemodynamic study. Kidney Int 1977;12:294-302.
19. Falls WF Jr, Stacy WK, Bear ES, Haden HT. Dialysis-in- duced change of extracellular fluid volume in man. Proc Dial Transpl Forum 1972;2:155-60.
1976;57: 1190-200.
20. Oh MS, Levison SP, Carroll HJ. Content and distribution of water and electrolytes in maintenance hemodialysis. Nephron 1975;14:421-32.
21. Sakai K, Itagaki I, Mineshima M, Matsuda K, Suzuki M, Azuma N , Sakai T, Nanbu M. Water shift and solute transfer in osmotic hernopurification using high sodium fluid. Artif Organs 198 1 ;5(suppl): 359-63.
22. Kimura G , Satani M, Kojima S , Kuroda K , Itoh K, Ikeda M. A computerized model to analyze transcellular fluid shift during hemofiltration. Artif Organs 1982;6:31-6.
Art$ Organs, Vol. 12, No. 2, 1988