role of game theory and economics - electrical engineering
TRANSCRIPT

Design of Network Architectures: Role of Game
Theory and Economics
Nikhil Gopinath Shetty
Electrical Engineering and Computer SciencesUniversity of California at Berkeley
Technical Report No. UCB/EECS-2010-91
http://www.eecs.berkeley.edu/Pubs/TechRpts/2010/EECS-2010-91.html
June 4, 2010

Copyright © 2010, by the author(s).All rights reserved.
Permission to make digital or hard copies of all or part of this work forpersonal or classroom use is granted without fee provided that copies arenot made or distributed for profit or commercial advantage and that copiesbear this notice and the full citation on the first page. To copy otherwise, torepublish, to post on servers or to redistribute to lists, requires prior specificpermission.

Design of Network Architectures:Role of Game Theory and Economics
by
Nikhil Gopinath Shetty
A dissertation submitted in partial satisfactionof the requirements for the degree of
Doctor of Philosophyin
Engineering - Electrical Engineering and Computer Sciences
in the
Graduate Division
of the
University of California, Berkeley
Committee in charge:
Professor Jean Walrand, ChairProfessor Pravin VaraiyaProfessor John Chuang
Fall 2010

Design of Network Architectures:Role of Game Theory and Economics
Copyright c© 2010
by
Nikhil Gopinath Shetty

Abstract
Design of Network Architectures:Role of Game Theory and Economics
by
Nikhil Gopinath ShettyDoctor of Philosophy in Engineering - Electrical Engineering and Computer Sciences
University of California, BerkeleyProfessor Jean Walrand, Chair
The economics of the market that a network architecture enables has a important bearingon its success and eventual adoption. Some of these economic issues are tightly coupledwith the design of the network architecture. A poor design could end up making certainmarkets very di�cult to enable, even if they are in the better interest of society. Theanalysis of these cross-disciplinary problems requires understanding both the technologyand the economic aspects. This thesis introduces three major recurring themes in theseproblems - revenue maximization, welfare maximization and missing markets - and providesenlightening examples for them. It then delves deeper into three problems representative ofthese three themes and provides a complete analysis and discussion for each of them.
First, the thesis studies user incentives for the adoption of femtocells or home base sta-tions and their resulting impact on network operator revenues. The thesis develops a model ofa monopolist network operator who o�ers the option of macrocell access or macro+femtocellaccess to a population of users who possess linear valuations for the data throughput. Thestudy compares the revenues from two possible spectrum schemes for femtocell deployment;the split spectrum scheme, where femtocells and macrocells operate on di�erent frequenciesand do not interfere, and the common spectrum scheme, where they operate on the samefrequencies (partially or fully) and interfere. The results suggest that the common spec-trum scheme that creates heavy interference for the macrocell still performs comparably tothe split spectrum scheme for revenue maximization. This suggests that the common spec-trum scheme with good interference management may be the pathway to better femtocelladoption.
Second, the thesis investigates the impact of the provision of two classes of service inthe Internet on the surplus distribution between users and providers. The study considersmultiple competing Internet Service Providers (ISPs) who o�er network access to a �xeduser base, consisting of end-users who di�er in their quality requirements and willingness topay for the access. User-ISP interactions are modeled as a game in which each ISP makescapacity and pricing decisions to maximize his pro�ts and the end-users only decide whichservice to buy (if any) and from which ISP. The model provides pricing for networks with
1

single- and two-service classes for any number of competing ISPs. The results indicate thatmultiple service classes are socially desirable, but could be blocked due to the unfavorabledistributional consequences that it in�icts on the existing Internet users. The research pro-poses a simple regulatory tool to alleviate the political economic constraints and thus makemultiple service classes in the Internet feasible.
The third topic is a problem involving missing markets for cyber-security insurance. Thestudy explains why insurance markets for Internet security fail to take o� due to a numberof factors including information asymmetry, e�ciency losses due to network externalitiesand competition. The interdependent nature of security on the Internet causes a negativeexternality that results in under-investment in technology-based defences. The researchinvestigates how competitive cyber-insurers a�ect network security and user welfare. Themodel explores a general setting, where the network is populated by identical users witharbitrary risk-aversion and network security is costly for the users. The user's probability toincur damage (from being attacked) depends on both his security and the network security.First, the model considers cyber-insurers who cannot observe (and thus, a�ect) individualuser security. This asymmetric information causes moral hazard. If an equilibrium exists,network security is always worse relative to the no-insurance equilibrium. Though userutility may rise due to a coverage of risks, total costs to society go up due to higher networkinsecurity. Second, the study considers insurers with full information about their users'security. Here, user security is perfectly enforceable (zero cost). Each insurance contractstipulates the required user security and covers the entire user damage. Still, for a signi�cantrange of parameters, network security worsens relative to the no-insurance equilibrium. Thus,although cyber-insurance improves user welfare, in general, competitive cyber-insurers mayfail to improve network security.
2

To dearest Amma, Mummy, Papa and Shonu.
i
Contents
Contents ii
List of Figures iv
List of Tables v
Acknowledgements vi
1 Introduction 11.1 Framework . . . . . . . . . . . . . . . . . . . . . . . . . . . . . . . . . . . . . 21.2 Research Problems . . . . . . . . . . . . . . . . . . . . . . . . . . . . . . . . 3
1.2.1 Revenue Maximization . . . . . . . . . . . . . . . . . . . . . . . . . . 31.2.2 Welfare Maximization . . . . . . . . . . . . . . . . . . . . . . . . . . 41.2.3 Missing Markets . . . . . . . . . . . . . . . . . . . . . . . . . . . . . . 5
1.3 Organization . . . . . . . . . . . . . . . . . . . . . . . . . . . . . . . . . . . 9
2 Revenue Maximization - Femtocells 112.1 Model . . . . . . . . . . . . . . . . . . . . . . . . . . . . . . . . . . . . . . . 13
2.1.1 Model for g(·) . . . . . . . . . . . . . . . . . . . . . . . . . . . . . . . 152.1.2 Model for R(αx) . . . . . . . . . . . . . . . . . . . . . . . . . . . . . 18
2.2 Operator Revenues . . . . . . . . . . . . . . . . . . . . . . . . . . . . . . . . 192.2.1 Femtocell: Split Spectrum . . . . . . . . . . . . . . . . . . . . . . . . 192.2.2 Femtocell: Common Spectrum . . . . . . . . . . . . . . . . . . . . . . 192.2.3 Base case: No Femtocell . . . . . . . . . . . . . . . . . . . . . . . . . 20
2.3 Results . . . . . . . . . . . . . . . . . . . . . . . . . . . . . . . . . . . . . . . 202.4 Conclusion . . . . . . . . . . . . . . . . . . . . . . . . . . . . . . . . . . . . . 22
ii

3 Welfare Maximization - Quality of Service 253.1 Model . . . . . . . . . . . . . . . . . . . . . . . . . . . . . . . . . . . . . . . 27
3.1.1 The environment . . . . . . . . . . . . . . . . . . . . . . . . . . . . . 273.1.2 Network Regulations . . . . . . . . . . . . . . . . . . . . . . . . . . . 303.1.3 The Order of Moves . . . . . . . . . . . . . . . . . . . . . . . . . . . 313.1.4 Subgame G(c,x) . . . . . . . . . . . . . . . . . . . . . . . . . . . . . 31
3.2 Analysis . . . . . . . . . . . . . . . . . . . . . . . . . . . . . . . . . . . . . . 323.2.1 Single Service Class . . . . . . . . . . . . . . . . . . . . . . . . . . . . 323.2.2 Two Service Classes . . . . . . . . . . . . . . . . . . . . . . . . . . . . 343.2.3 Uniqueness of Equilibria . . . . . . . . . . . . . . . . . . . . . . . . . 36
3.3 Results . . . . . . . . . . . . . . . . . . . . . . . . . . . . . . . . . . . . . . . 373.4 Discussion . . . . . . . . . . . . . . . . . . . . . . . . . . . . . . . . . . . . . 433.5 Conclusion . . . . . . . . . . . . . . . . . . . . . . . . . . . . . . . . . . . . . 443.6 Appendix . . . . . . . . . . . . . . . . . . . . . . . . . . . . . . . . . . . . . 45
4 Missing Market - Security Insurance 564.1 Related Work . . . . . . . . . . . . . . . . . . . . . . . . . . . . . . . . . . . 574.2 Model . . . . . . . . . . . . . . . . . . . . . . . . . . . . . . . . . . . . . . . 59
4.2.1 Social Optimum . . . . . . . . . . . . . . . . . . . . . . . . . . . . . . 604.2.2 Nash Equilibrium . . . . . . . . . . . . . . . . . . . . . . . . . . . . . 60
4.3 Insurance . . . . . . . . . . . . . . . . . . . . . . . . . . . . . . . . . . . . . 614.3.1 Non-contractible User Security . . . . . . . . . . . . . . . . . . . . . . 624.3.2 Contractible User Security . . . . . . . . . . . . . . . . . . . . . . . . 63
4.4 Discussion . . . . . . . . . . . . . . . . . . . . . . . . . . . . . . . . . . . . . 644.5 Conclusion . . . . . . . . . . . . . . . . . . . . . . . . . . . . . . . . . . . . . 66
Bibliography 74
iii

List of Figures
1.1 Framework . . . . . . . . . . . . . . . . . . . . . . . . . . . . . . . . . . . . . 21.2 Market Structure . . . . . . . . . . . . . . . . . . . . . . . . . . . . . . . . . 8
2.1 High Level Model . . . . . . . . . . . . . . . . . . . . . . . . . . . . . . . . . 122.2 Relationship between γm, γf , α and x . . . . . . . . . . . . . . . . . . . . . . 142.3 Interference . . . . . . . . . . . . . . . . . . . . . . . . . . . . . . . . . . . . 162.4 Markov Chain . . . . . . . . . . . . . . . . . . . . . . . . . . . . . . . . . . . 172.5 Macrocell Download Arrival Rate . . . . . . . . . . . . . . . . . . . . . . . . 172.6 Revenues, x and α vs c0 . . . . . . . . . . . . . . . . . . . . . . . . . . . . . 21
3.1 Legend . . . . . . . . . . . . . . . . . . . . . . . . . . . . . . . . . . . . . . . 383.2 X as a function of Capacity Cost τ . Legend: Fig. 3.1 . . . . . . . . . . . . . 393.3 Aggregate Capacity (c) vs Cost of Capacity (τ). Legend: Fig. 3.1 . . . . . . 403.4 Results for various M , with capacity cost �xed at τ = 0.05. Legend: Fig. 3.1 413.5 Percent Users with Surplus Loss in the Long Run. Legend: Fig. 3.1 . . . . . 423.6 x and Percent Users with Surplus Loss in Short Run. Legend: Fig. 3.1 . . . 43
4.1 Nash Equilibrium Vs Social Optimum . . . . . . . . . . . . . . . . . . . . . . 614.2 Competitive Non-contractible Insurance . . . . . . . . . . . . . . . . . . . . 694.3 Competitive Equilibrium with Contractible Security . . . . . . . . . . . . . . 71
iv

List of Tables
2.1 Table of default parameter values . . . . . . . . . . . . . . . . . . . . . . . . 20
3.1 Table of Notation . . . . . . . . . . . . . . . . . . . . . . . . . . . . . . . . . 45
v

Acknowledgements
I would like to take this opportunity to thank all the people who have been a contributingfactor both to this dissertation and to my life as a PhD student. First, I would like to extendmy deep gratitude to my advisor, Jean Walrand, whose guiding thoughts are responsible forshaping my interest in the topic of this dissertation. Over the course of the PhD, he hasalways been available for advice and his advice has always enabled me to determine the rightpath. I appreciate very much his approach of letting his students explore but at the sametime always being there to correct our missteps. This has a�orded me the right amountof freedom necessary to explore the interdisciplinary nature of the dissertation while at thesame time being grounded and producing results at a regular pace.
I would like to thank Professors Pravin Varaiya, John Chuang and Shachar Kariv foradvising my research proposal and �nal dissertation. I would also like to thank all theother professors, who have taught me during my stay as a PhD student at Berkeley. Inparticular, I would like to mention Prof. David Tse's wireless communications class and ProfReza Moazzami's classes in the Haas school of Business, which I found to be great learningexperiences. I hope all my professors found teaching me as interesting as I found learningfrom them.
I would like to thank everyone who have collaborated with me for all my research projects.Here, I would like to thank Dr. Shyam Parekh, who has been an excellent support for meduring my research career. He helped set up internships at Alcatel-Lucent Bell Labs, whichwere great learning experiences. I also thank Galina Schwartz, who collaborated on multipleprojects including QoS and security economics. She has been a wonderful research partnerand has helped me navigate the large and complex �eld of economics and game theory.Mark Felegyhazi was also very in�uential during the research on security economics andI would like to thank him for that. I express gratitude to Assane Gueye, with whom Ihad a great collaboration e�ort during the bottleneck analysis research. We shared greatchemistry and believe we both missed our collaboration e�ort. Without So�e Pollin andPrzemek Pawelczak, I would not have been able to complete our work on machine learningin cognitive radio. I thank them for this partnership. Lastly, research on IPv6 adoption wasanother interesting collaboration e�ort, which I thank Dilip Joseph for involving me.
I would also like to thank all other members of the NetEcon group including JiwoongLee, Libin Jiang, Christophe Choumert, John Musacchio for their helpful comments andsuggestions. Thanks are due for alumni like Wilson, Antonis and Teresa, who led Jean'sresearch before our current batch. Thanks are due also for Ruth Gjerde for helping me navi-gate the bureaucratic requirements at Berkeley. Last, I express my gratitude to Koushik Pal,Vinayak Nagpal, Sharmodeep Bhattacharya, Vikram Vijay, Nipun Misra, Vikram Rentala,Pulkit Grover, Marghoob Mohiyuddin, and others for contributing to the excellent 5 yearsof my life at Berkeley.
vi

vii
Chapter 1
Introduction
Networking researchers have long known and argued [9, 66, 24, 39] that the economicsof the markets enabled by their network architecture have a huge bearing on its success andeventual adoption. Some of these economic issues are tightly coupled with their design ofthe network architecture. A poor design could end up making certain markets very di�cultto enable even though enabling such markets could be in the better interest of society. Inmany cases, even when the technologies are mature and well-researched, adoption is eithervery slow or just plain fails in the face of the economics. Examples of such failures includeAsynchronous Transfer Mode (ATM)1, the slow adoption of IPv62 and end-to-end quality ofservice on the Internet.
Studying how a change in architecture a�ects user and provider welfare is importantbecause this analysis ultimately determines the success or failure of a new invention. Thisanalysis requires an understanding of both the technology and the resulting economics ofthe market enabled by it. On one hand, the performance o�ered by a new architecture canbe analyzed using tools like queueing theory, systems theory, etc. This analysis provides asense of the utility that users derive from the usage of that architecture. On the other hand,problems involving incentives are usually handled well using tools from game theory. Thesetools provide us the ability to analyze the welfare obtained from the adoption of a certainarchitecture, taking into consideration that users and providers may be independent decisionmakers. It is this con�uence of technology and game theory that this dissertation aims tostudy.
1

Figure 1.1. Framework
1.1 FrameworkLet us �rst start by introducing a general framework into which most of the problems
can be placed. Fig. 1.1 represents the block diagram into which most problems can be cast[99]. Network providers invest in their chosen network architecture and then charge pricesto users. Users observe the prices and choose to adopt the services, if any. This usage ofthe network may a�ect the performance that is observed by the users. This combination ofprices and performance determines the utility observed by a user which, in turn, determinesuser adoption and associated provider revenues. In addition, providers may compete orneed to coordinate with each other to provide certain services - this may also determine theinvestment, equilibrium prices and user utility. The external agent in this framework is thegovernment or the regulator whose concern it is to maximize the welfare of the system as awhole and to ensure that innovation continues unimpeded. The government may also havespecial powers to mandate certain behaviors from the providers which may help eliminatecertain coordination problems, improve social welfare and create a favorable distribution ofthe surplus.
To see an example of how this framework applies, let us look at the case of provision ofmultiple service classes in the Internet. Internet service providers invest in an architecturethat enables QoS - this could be Di�Serv, IntServ or some other new architecture [100]. Theproviders then charge prices for the di�erent service classes and users choose which serviceclass to use, if any. The observed user performance depends upon their network usage and the
1An internetworking standard that was a competitor to IP.2IPv6 adoption is still very slow though IPv4 addresses are close to exhaustion.
2

policies implemented by the ISPs. Users may now observe this performance and determinewhether they are satis�ed with the quality of the service obtained. If not, they may switchto a di�erent service from any of the ISPs or choose not to take up any service at all. Inequilibrium, no user will want to shift to a di�erent service option and no ISP will wantto charge di�erent prices. A regulator observing this situation might want to set policiesregarding such multiple classes of service to suitably protect user welfare. His policy mustalso consider whether future ISP investment will be impacted which in turn could a�ect thelong term utility of the users. Alternatively, if ISPs cite coordination issues due to a lack ofcommon standards as a reason for no such market, the regulator may step in to encouragesuch coordination using a mandate.
The framework thus provides us with a clear mental picture of the problem. It enables usto separate out the technological and economic parts of the problem and attack each portionseparately. The framework also gives us an insight into how the various parameters interactwith each other to determine the �nal equilibrium.
1.2 Research ProblemsThere are many interesting research problems at this interdisciplinary intersection. In
this section, I will describe a few aspects that show up often in these problems. Mostproblems will incorporate multiple aspects from those described below.
1.2.1 Revenue Maximization
Maximizing revenues is the concern of network providers. Providers want a good returnon their investment and they choose an architecture that allows them to maximize theirpro�ts. Though this may seem like a simple cost-bene�t analysis, in many cases, calculationof costs and bene�ts is complicated by the fact that users may create negative externalitiesfor other users by congestion. A lot of research has been performed on how this congestionpricing must be performed. For example, [70, 39] suggest that multiple service classes mustbe simply isolated and the price charged to users must determine the congestion and theperformance in the class. [6] also performed experiments on real Internet users to determinehow demand changes with the price. [54, 17] suggest changes in the congestion controlmechanism to charge for packets marked during periods of congestion. On the other hand,some recent work [88] suggests that the monetary gains from multiple service classes may notbe large enough for certain user demands to justify investing in a QoS architecture. Theseexamples suggest that revenue maximization is a complex process requiring knowledge ofboth user demand and the choice of an appropriate architecture to implement congestioncontrol and QoS.
Managing congestion and pricing it appropriately is becoming extremely important intoday's wireless networks, where bandwidth is scarce and supporting heavy data usage re-
3

quires massive investments in the infrastructure. Wireless congestion management is alsocomplicated by the fact that channel quality depends upon the user's position in the cell andcan vary rapidly. How should resources be allocated to di�erent users and how should theusers be charged for those resources become interesting questions in such a dynamic scenario.
1.2.2 Welfare Maximization
Welfare maximization usually takes the perspective of maximization of total system util-ity, including both the providers and end users of a technology. Welfare increases whenall user types and requirements are satis�ed by the adoption of a certain architecture. Ifthe architecture prevents serving a certain essential user requirement due to the way it isstructured, this results in lowered welfare. For example, researchers [82] argue that the lackof an in-built per-�ow charging mechanism in the Internet may have led to a missing marketfor enhanced quality of service guarantees at a �ow level. Though the increase in networkcapacity has allowed Voice over IP (VoIP) services to take o� without this per-�ow require-ment (though not with assured guarantees), video conferencing is now facing the same issuesthat voice did a few years back. Though enterprises have taken care of this issue by buyingreserved bandwidth, such services are hardly available to end users. I believe that there willalways be applications on the horizon that cannot be handled purely using the statisticalguarantees provided by the Internet and will require some guaranteed services.
E�ciency Losses
The operating point that maximizes total system welfare is called the social optimum.Such a social optimum can only be reached by a central planner who can enforce the behaviorof all the entities in the system. However, very rarely do large systems have such centralizeddecision-making. Behavioral decisions are usually made by entities with their own sel�shinterest in mind. If such behavior is associated with externalities, i.e., if one user's behaviora�ects the utility observed by others in the system, these sel�sh choices result in an equi-librium that is much worse than the social optimum. This may be interpreted as a loss ofe�ciency or, when rephrased in terms of costs, is also known as the �price of anarchy� [55].[51] have derived the worst case loss of e�ciency for certain resource allocation games innetworks where agents make decentralized decisions . Similarly, [78] have derived the priceof anarchy in routing games, where routing decisions are made independently by users. In-terestingly, under linear utility/cost assumptions, both these papers suggest that e�ciencylosses are bounded by a factor of 3/4.3
Another interesting example of e�ciency losses is the case of Internet security. Computersecurity is interdependent and when users under-invest in security, this creates a relativelymore insecure environment for the other users. Such users may not necessarily see the direct
3In [51], this bound assumes that the users can bid on individual links. If they bid on a path, the POAcan be arbitrarily large.
4

costs of such risky behavior though they enjoy the lower costs associated with their lowerinvestment. When all users apply the same logic, the result in under-investment in securitythroughout the network relative to the socially optimal level [97]. This is also referred tosometimes as the free-riding problem. Similar results have been derived by [62, 49] underconstrained network topologies and corresponding externalities. In Chapter 4, I will presenta model for network security with full connectivity and a general user utility and replicatethe results mentioned here.
Surplus Distribution
At times, just maximizing total social welfare may not be enough. Regulators may alsobe interested in how the surplus is actually distributed between the participants. For exam-ple, in a �ercely competitive scenario, a large part of the surplus remains with the users andproviders may end up with zero pro�ts (no surplus). This explains why regulators encouragepolicies that foster competition in provider markets. Other times, when new technologiesenable providers to extract more surplus from users, regulators may be concerned aboutthe backlash this may generate from such losing users. Though the new technologies mayalso expand the market and increase availability, regulators may still be concerned aboutthe e�ects of the transition on these existing users. An example of this case is the discus-sion regarding network neutrality where an important part of the debate is a considerationwhether two classes of service create distortions in the distribution of surplus between usersand providers. In this case, the regulator needs to balance the protection of current usersurplus with the future incentives to invest in greater capacity. This example is analyzed indetail in Chapter 3.
1.2.3 Missing Markets
Missing markets are markets that increase both user and provider welfare (Pareto) andyet, fail to take o� in reality. Such missing markets are a result of many factors, a few ofwhich we will discuss here.
Information Asymmetry
Information asymmetry exists when information regarding quality of the service or prod-uct is not available equally well to two entities involved in a transaction. Information asym-metry makes contracts di�cult to enforce, resulting in a collapse of markets. The seminalwork in the Economics literature includes the lemon market problem, where it was shownthat the market for used cars could collapse if lemons could not be suitably distinguishedfrom the good cars [5]. Similar problems exist in the network and in fact, may be accentu-ated by the choice of the network architecture. For example, if a certain data path traversesmultiple ISPs. With the current IP architecture, if there is a problem with the quality of
5

service experienced by the �ow, there is no way of knowing which ISP is the source. Suchinformation is local and private to the ISPs and without some monitoring systems [60],end-to-end quality of service contracts across multiple ISPs will be impossible.
More examples exist in the computer security market. If security products cannot besu�ciently distinguished in their quality of protection, this could result in a lemon marketfor such products [7]. Similarly, if insurance companies cannot su�ciently gauge how wellan enterprise has protected its network from external attacks, problems like moral hazardand adverse selection show up and can result in a collapse of the insurance market [76, 77].This example of insurance for network security is analyzed in detail in Chapter 4.
Network E�ects and Switching Costs
When the utility from adoption of a technology depends upon the number of other usersof that technology, we say that network e�ects are in play [29, 28]. Network e�ects createlock-in into network architectures. This lock-in can be extremely strong, as can be seen inthe poor adoption of IPv6 in the Internet. IPv4 is the principal protocol on the Internet.Suppose a new content provider o�ers his services on the Internet. Lets say she has a choiceof IPv6 or IPv4. Her standalone bene�ts from adopting IPv6 are not hugely higher than herbene�ts from adopting IPv4.4 However, due to being the incumbent standard, her networkbene�ts from adopting IPv4 are huge compared to that from IPv6. If she chooses IPv6, shestill has to provide converters for users who access her services using IPv4, which can furtherraise her costs. Here, the role of converters/gateways from one architecture to another andthe standalone bene�ts of adoption become very important [53, 50]. Also important is acritical mass of early adopters who can push the rest of the market to the new architecture.A regulator could encourage such adoption by mandating government installations and o�cesto adopt the new architecture, thus providing this critical mass.
A similar example exists for the transmission control protocol TCP. Though newer �avorsof TCP have been suggested that provide improvements in throughput for fat pipes [101] orrely not on network losses but on latency to adjust rates [16], these attempts have failed atadoption because either they do not work well in the presence of TCP Reno or they impactTCP Reno �ows negatively, thus inviting the network provider's wrath. These networke�ects are so huge that researchers have proposed �TCP-friendly� rate control algorithmswith the goal to improve TCP performance while still maintaining fairness when combinedwith the usual TCP �ows [32].
Transaction Costs
In his seminal work on transaction costs, economist Ronald Coase [23] suggests thatall economic transactions involve costs and these costs must be accounted for in analyzing
4IPv6 does o�er some improvements in security and user management.
6

whether a particular economic arrangement is e�cient.5 Transaction costs can be bothexternal and internal to a �rm. Here, we are only concerned with external transactioncosts that come into play when a �rm interacts with other �rms to deliver a product orservice. These transaction costs involve the cost of acquiring the service information fromthe partners, cost of writing up complicated service contracts involving a large number ofvariables and the costs of monitoring and enforcing those contracts. If the costs of performingthese activities are higher than the pro�ts made by providing the service, �rms may decidenot to o�er such a service at all, resulting in a missing market. Certain network architecturesmay raise these enforcement costs and make certain markets very di�cult to enable. In thefollowing paragraphs, I will provide examples of manifestations of this problem of transactioncosts.
Coordination:Coordination in network upgrades is a major problem that providers face. Usually, thisproblem arises because there are positive externalities associated with the upgrade processof a single provider. When a single operator upgrades his network, he may indirectly providebetter performance for other operators' tra�c �owing through his network. This results inthe free-rider problem, wherein the incentive to upgrade for his rival decreases, especially ifthe cost of upgrade is high. This may result in a contest, where operators wait for othersto adopt the new technology, thus delaying adoption for inordinately long amounts of time.[48] investigated the conditions under which ISPs upgrade their networks by setting up arepeated game model for the value derived from a network upgrade. Such coordinationproblems may require external stimulus by providing some mechanism by which ISPs cancoordinate their network investments. This could involve government mandates or schedulesset by standard bodies for network upgrades.
Competition:Sometimes, competitive pressures may preclude investments in new technologies. A goodexample of this may be network virtualization [8, 20, 68]. Network virtualization enablesoperators to experiment and program new architectures in software over an existing in-frastructure, thus reducing the need for frequent network upgrades. However, virtualizednetwork equipment may come at a higher cost or lower performance compared to equipmentthat cannot support future architectures but handles all existing architectures very well.6Though a virtualized architecture is obviously better for society because of the acceleratedinnovation ability it provides, it is not clear that a provider running virtualized architectureis in a better competitive position to one who does not. Though such an operator can bringinnovations to market quicker, the higher costs of operating such an architecture may negatethe potential bene�ts from being the �rst to market. Additionally, there is also the riskassociated with betting on the success of future innovations.7 In this case, the coordinationmechanism to ensure that all competitive operators invest in such a virtualized architecturemay be too costly to implement.
5Other interesting readings include [103, 69, 104]6Hardware implementations are usually much faster than software ones.7This is work in progress. The author and his collaborators have pinned down the rate of new successful
innovations and the rate of network upgrades as important factors underlining the decision to choose avirtualized infrastructure.
7

(a) IP Market Structure (b) Telephone Market Structure
Figure 1.2. Market Structure
Market Structure:Market structure, that is a result of the network architecture, may also play a big role inthe adoption of new services. An example is the current market structure of the Internet[11,92, 95]. The structure of contracts is bilateral, i.e., ISPs set up tra�c contracts with theirneighbors only [60]. In addition, �access� ISPs always pay �transit� ISPs for tra�c �owing ineither direction - they are paying for connectivity to the �rest of the Internet.� This is di�erentfrom telephone networks where contracts are source-based, i.e., the source sets up contractswith each of the networks that the tra�c lands up on and termination fees are paid to eachof these networks. Some argue that this modi�cation keeps contracts simple and local [89].But, this market structure only works well for best-e�ort tra�c where quality requirementsare lax. However, for guaranteed services, this market structure creates incentive problems.Fig. 1.2 shows this di�erence in payment structure. ISP 3, on whom high-priority tra�cis terminated, still has to pay for this tra�c (maybe higher price) even though no session-speci�c revenues are shared with him. Also, if the end users do not pay for any di�erentiatedservices, there may be no incentive for him to give better service to this �ow. He may justinstruct ISP 2 to remark all packets as normal priority.
Another interesting problem related to market structure is the role it plays in innovation.[61] investigate the resultant market structure from a virtualized network, where infrastruc-ture providers and service providers are di�erent entities. As an example, consider the cableTV providers. This can be envisioned as an infrastructure provider who manages the cablesystem and a service provider who provides TV service over this system. In this two-levelsystem, users may end up paying the infrastructure provider or the service provider or both.[61] concludes that, since infrastructure providers are few, a market structure where the userpays directly to the service provider will be most competitive and encourage newer innova-tions both in the network and in the service layer. In fact, they believe that a system wherepayments happen through the infrastructure provider alone will not generate the necessaryinnovation incentive. [61] only look at independently generated innovations - it would be in-teresting to investigate how their results change when network providers need to coordinateand move to new architectural standards enmasse and not independently.
8

1.3 OrganizationIn this dissertation, I will attack three problems, each focusing mainly on one of the
aspects discussed above. First, I will investigate a problem involving revenue maximizationthat arises with the adoption of femtocells8 for 4G networks. This will be the topic of Chap-ter 2. It is expected that with heavy network usage, 4G networks will require some o�oadingof data tra�c onto femtocells. Here, the operators have a choice of two possible spectrumschemes for femtocell deployment; the split spectrum scheme, where femtocells and macro-cells operate on di�erent frequencies and do not interfere, and, the common spectrum scheme,where they operate on the same frequencies (partially or fully) and interfere. We model amonopolist network operator who o�ers the option of macrocell access or macro+femtocellaccess to a population of users who possess linear valuations for the data throughput andcompare the revenues from the two schemes. The results will suggest that common spectrumschemes that create heavy interference for the macrocell still perform comparably to the splitspectrum scheme for revenue maximization. This suggests that common spectrum schemeswith good interference management may be the pathway to better femtocell adoption.
Second, I will investigate a problem involving welfare maximization where I estimate thee�ect on surplus distribution between users and providers from provision of two classes ofservice in the Internet. This problem has relevance to the much-larger debate on networkneutrality. This will be the topic of Chapter 3. In this case, I take the view of a regulatorto determine under what conditions multiple service classes should be permitted. Here,I consider multiple competing Internet Service Providers (ISPs) who o�er network accessto a �xed user base, consisting of end-users who di�er in their quality requirements andwillingness to pay for the access. ISPs make capacity and pricing decisions to maximizetheir pro�ts and the end-users only decide which service to buy (if any) and from whichISP. I will show that competition per se does not preclude the provision of service classes,i.e., there is no missing market due to competitive pricing instability. Though the resultsindicate that multiple service classes are also socially desirable in the long run, they could beblocked due to the unfavorable distributional consequences that it in�icts on some existingInternet users and the short run considerations of a regulator.
Third, I will investigate a problem involving missing markets. Here, I will look at whyinsurance markets for Internet security fail to take o� due to a number of factors includinginformation asymmetry, e�ciency losses due to network externalities and competition. Thiswill be the topic of Chapter 4. I will utilize a general setting, where the network is populatedby identical users with arbitrary risk-aversion and network security is costly for the users.A user's probability to incur damage (from being attacked) depends on both his securityand the network security, thus creating an externality. Thus, there are e�ciency losses andnetwork security is worse than the socially optimal level. Total costs to society go up dueto this higher network insecurity. However, even with competitive security insurance, thesituation is no better. There are two cases - case with information asymmetry, i.e., lack ofan enforceable security contract, between the insurer and the insured and the case without.
8Femtocells or home base stations are a proposed solution to the problem of degraded indoor service fromthe macrocell base station in future 4G data networks.
9

With information asymmetry, an equilibrium rarely exists, i.e., there is a missing market.Even when it exists, network security is always worse relative to the no-insurance equilibrium.This suggests that the architecture must provide strong enforcement mechanisms that reducethis asymmetry. With no asymmetric information, an equilibrium exists but network secu-rity still worsens relative to the no-insurance equilibrium for a range of parameters. Thus,the results suggest competitive cyber-insurers may fail to improve network security, whichimplies that an enforceable mechanism is required to ensure that cyber-insurers maintainhigh network security even in the face of competitive pressures.
10

Chapter 2
Revenue Maximization - Femtocells
4G networks, especially those operating at high frequencies, are expected to face theproblem of poor connectivity inside the users' home. This is mainly due to the high attenu-ation su�ered at these frequencies. To circumvent poor reception inside such built-up areas,the industry has proposed tiny base stations for homes called femtocells [73, 46, 18, 74].1These femtocells not only enable high-quality use of mobile devices in the user's home butalso allow the user to seamlessly move his calls and data sessions between the macrocell andhis femtocell.2
From the point of view of the network operator, femtocells appear advantageous sincefemtocell usage reduces the load on the macrocell network and allows more users to beserved, which helps raise revenues. In addition, network operators may be able to pricediscriminate and extract a higher value from femtocell users. However, an operator's use offemtocells is not devoid of costs. In this chapter, we do not consider an increase in operationalcosts (like the additional costs of managing an integrated macro-femto network, customersupport, etc.) due to the provision of femtocells. We only consider the opportunity costsof the network operator due to the (in)e�cient use of spectrum in the hybrid macro-femtonetwork. Note that these opportunity costs would not exist if femtocells were to operatein free spectrum, like those in the 2.4 and 5.8 GHz bands. However, due to the proli�cnumber of devices (that the operator himself does not control) present in these frequencies,no quality of service (QoS) guarantees can be given. To provide QoS, the operator mustutilize his own spectrum, adding opportunity costs to his femtocell operations.
Various spectrum deployment options have been proposed for the deployment of femto-cells [44]. The authors in [44] suggest 3 possible spectrum schemes - the �separate carrier�deployment where the spectrum is divided into two parts and a dedicated fraction is used for
1The previous incarnation, picocells, operated at higher powers and were costlier, making them unsuitablefor wide deployment in homes.
2We do not consider WiFi hotspots as examples of femtocells since seamless mobility when moving fromthe macrocell to the WiFi access point has not yet been achieved.
11
femtocells, the �shared carrier� deployment where the macrocell and the femtocells operateon the same frequencies and the �partially-shared carrier� deployment where the femtocellsoperate only on a fraction of the spectrum used by the macrocell. In this chapter, we willconsider two spectrum schemes only. The �rst scheme - which we term �split spectrum� -will be similar to the separate carrier scheme. The second scheme - which we term �commonspectrum� - will model both the shared carrier and the partially-shared carrier cases.
Both femtocell schemes provide gains via increased macrocell capacity due to lower con-gestion. However, the two schemes impose di�erent costs on the macrocell. With splitspectrum, macrocell capacity is not a�ected due to interference, but, dedicating spectrumfor femtocell usage directly reduces the capacity of the macrocell. With common spec-trum, there is no loss due to dedicated capacity, but increased adoption of femtocells leadsto increased interference for macrocell users and decreases its capacity. Previous research[21, 43, 74, 19, 65] has focused on how this interference a�ects macrocell capacity and ser-vice quality and have suggested that common spectrum deployments are as feasible as splitspectrum ones.
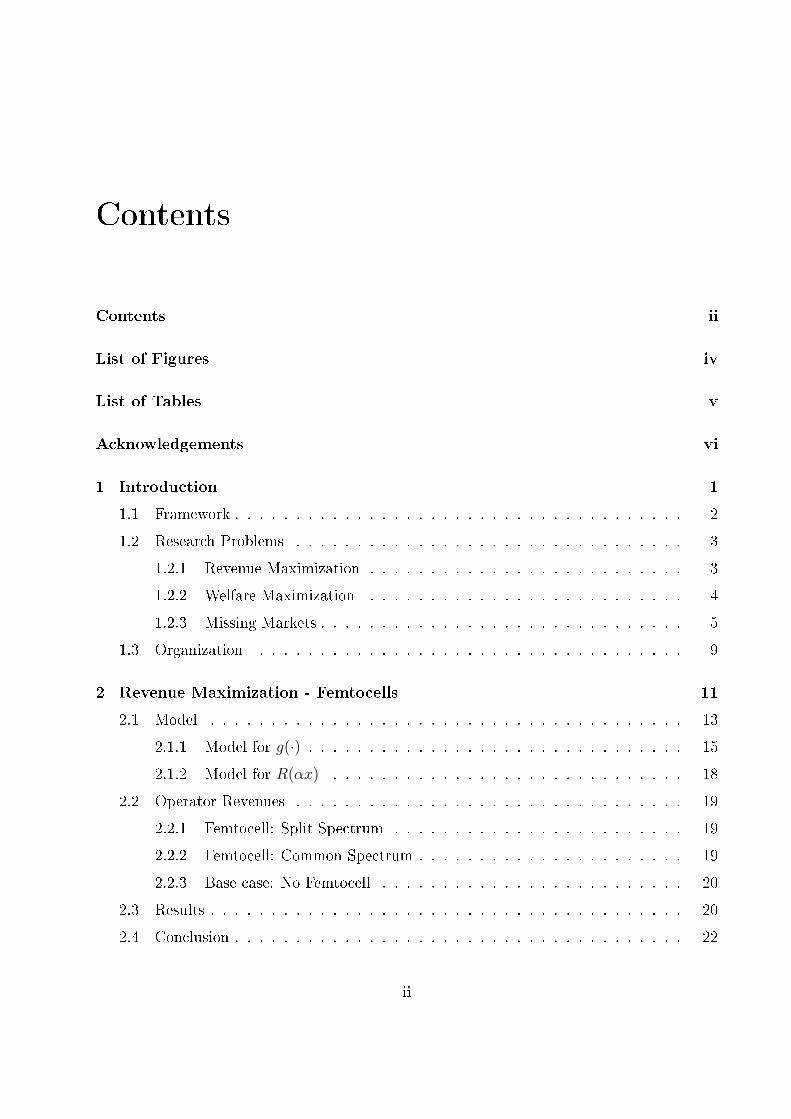
Figure 2.1. High Level Model
The focus of this chapter is to study the impact of the complex interplay of interferenceand service pricing on user adoption of femtocells. Fig. 2.1 depicts the high-level modelthat we analyze in this chapter. Analysis of femtocell adoption is not straightforward. Withsplit spectrum, as femtocell adoption increases, the pure macrocell service becomes moreattractive to the users. Hence, user incentive to adopt femtocells decreases as femtocelladoption rises. Due to the presence of this positive externality, adoption of femtocells maybe hindered. With common spectrum, this e�ect reappears, but is further complicated by theaddition of interference for the macrocell users. In this chapter, we analyze these e�ects fromthe point of view of a monopolist network operator's revenues. Under his optimum choice ofprices, we will compare the revenues from the competing spectrum schemes. Though somepapers [22] have focused on the �nancial aspects of femtocells, they focus on the networkdeployment costs only. To our best knowledge, no previous work focuses on determining thenetwork operator's optimal pricing choices and the resulting users' incentives for femtocelladoption.
The rest of the chapter is organized as follows. Section 4.2 describes the model withsubsections 2.1.1 and 2.1.2 describing the network model and the interference model respec-
12
tively. Section 2.2 describes how the network operator revenues are determined. We presentthe numerical results in Section 2.3 and conclude in Section 4.5.
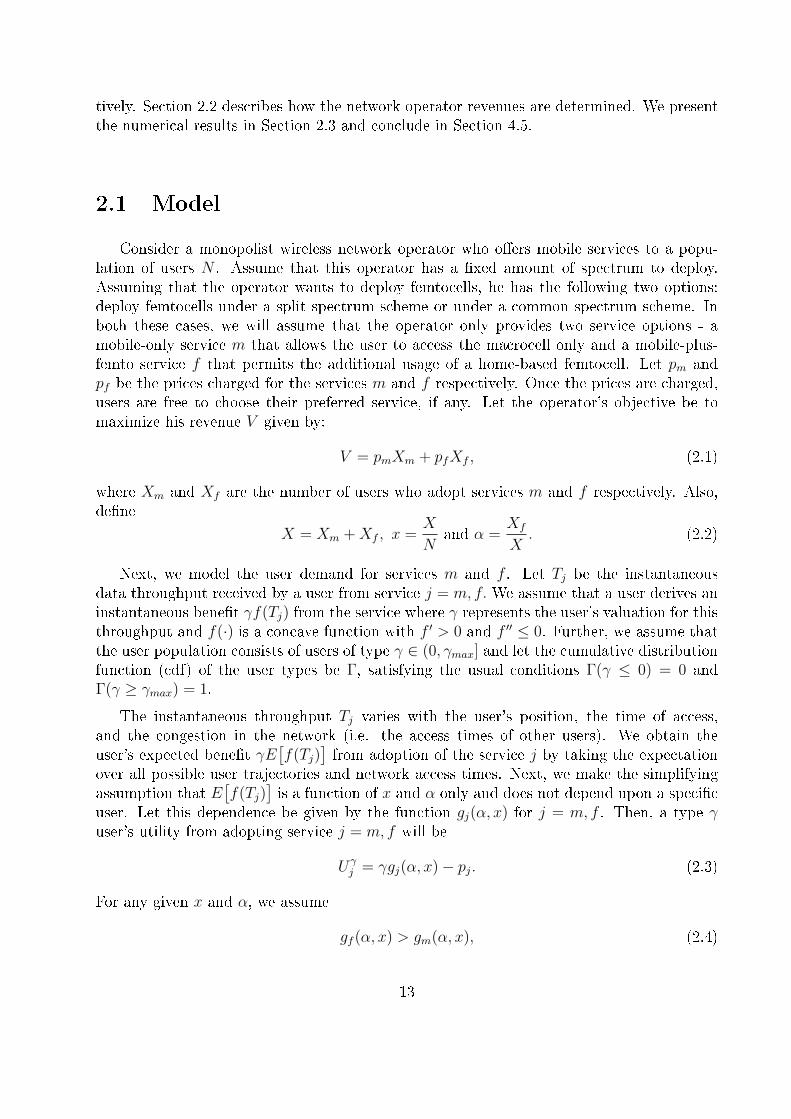
2.1 ModelConsider a monopolist wireless network operator who o�ers mobile services to a popu-
lation of users N . Assume that this operator has a �xed amount of spectrum to deploy.Assuming that the operator wants to deploy femtocells, he has the following two options:deploy femtocells under a split spectrum scheme or under a common spectrum scheme. Inboth these cases, we will assume that the operator only provides two service options - amobile-only service m that allows the user to access the macrocell only and a mobile-plus-femto service f that permits the additional usage of a home-based femtocell. Let pm andpf be the prices charged for the services m and f respectively. Once the prices are charged,users are free to choose their preferred service, if any. Let the operator's objective be tomaximize his revenue V given by:
V = pmXm + pfXf , (2.1)
where Xm and Xf are the number of users who adopt services m and f respectively. Also,de�ne
X = Xm + Xf , x =X
Nand α =
Xf
X. (2.2)
Next, we model the user demand for services m and f . Let Tj be the instantaneousdata throughput received by a user from service j = m, f. We assume that a user derives aninstantaneous bene�t γf(Tj) from the service where γ represents the user's valuation for thisthroughput and f(·) is a concave function with f ′ > 0 and f ′′ ≤ 0. Further, we assume thatthe user population consists of users of type γ ∈ (0, γmax] and let the cumulative distributionfunction (cdf) of the user types be Γ, satisfying the usual conditions Γ(γ ≤ 0) = 0 andΓ(γ ≥ γmax) = 1.
The instantaneous throughput Tj varies with the user's position, the time of access,and the congestion in the network (i.e. the access times of other users). We obtain theuser's expected bene�t γE
[f(Tj)
]from adoption of the service j by taking the expectation
over all possible user trajectories and network access times. Next, we make the simplifyingassumption that E
[f(Tj)
]is a function of x and α only and does not depend upon a speci�c
user. Let this dependence be given by the function gj(α, x) for j = m, f . Then, a type γuser's utility from adopting service j = m, f will be
Uγj = γgj(α, x)− pj. (2.3)
For any given x and α, we assume
gf (α, x) > gm(α, x), (2.4)
13

i.e., a user derives a higher bene�t from service f than service m. Hence, if pf ≤ pm, α = 1,i.e., users choose to buy the service f only, if any. Note that α may be 1 even when pf ishigher than pm.
From (2.3) and (2.4), for j = m, f , if for some γ, U γj > 0, then, Uγ
j > 0 for all γ > γ. Thisimplies that there is a threshold user type beyond which all users (with a higher valuationfor the throughput) adopt some service. De�ne γm to be the critical user type beyond whichall users buy some service. Then, the fraction of users who adopt some service will be:
x =[1− Γ(γm)
]. (2.5)
Next, suppose α < 1. From (2.3) and (2.4), if for some γ, U γf > U γ
m, then, Uγf > Uγ
m for allγ > γ. This implies that all users with type greater than a certain critical user type adoptservice f over service m. De�ne γf to be the critical user type beyond which all customersbuy service f . Then, given x, the fraction of customers who adopt service f will be:
α =
[1− Γ(γf )
]
x. (2.6)
Fig. 2.2 depicts γm, γf , α and x.
Figure 2.2. Relationship between γm, γf , α and x
Theorem 2.1.1 For any given pm and pf , the values of x and α in equilibrium are deter-
mined from (2.5) and (2.6) with γm and γf given as below:
γm =
pf
gf (1,x), α = 1
pm
gm(α,x), α < 1, and,
(2.7)
γf =pf − pm
gf (α, x)− gm(α, x), if α < 1. (2.8)
Proof See Appendix.
Corollary 2.1.2 If gf (α,x)
gm(α,x)≥ gf (1,x)
gm(1,x)∀α < 1, then, for any x, α = 1 ⇔ pf
pm≤ gf (1,x)
gm(1,x).
14

Proof See Appendix.
From Corollary 2.1.2, in equilibrium, if α = 1, the operator must charge pf =gf (1,x)
gm(1,x)pm to
maximize his revenue. Hence, even when α = 1 in equilibrium, pf > pm, i.e., service f willbe costlier than service m. Substituting the values of x and α from Theorem 2.1.1 in (2.1)and optimizing w.r.t. pm and pf , we obtain the monopolist's optimal choice.
2.1.1 Model for g(·)In this section, we present an approximation to the function g. First, we assume that the
user's bene�t f(T ) is proportional to the instantaneous throughput T that he receives [80]:
f(T ) = kT,
where k is the constant of proportionality. We discuss the implication of this assumption inSection 4.5. Thus, the utility for the user type γ if he adopts service j = m, f becomes
Uγj = γkE[Tj]− pj,
which, from (2.3), gives usgj(α, x) = kE[Tj], j = m, f. (2.9)
In the rest of the discussion, we will restrict our attention to the throughput obtained in thedownlink only. A similar analysis for the uplink may be performed.
Next, let users spend a fraction fi(fo = 1 − fi and fo < fi) of their time inside theirhome. Then, we assume
E[Tf ] = fiE[Tb] + foE[Tm], (2.10)where Tb is the throughput obtained by the user from his broadband connection via thefemtocell. We assume that E[Tb] is �xed and independent of the user's position in his home,the interference from femtocells and macrocell users in the neighborhood (see Fig. 2.3 forthe only interference that is modeled) and the spectrum scheme being employed. E[Tb]depends on the congestion in the wired network and is not the maximum supportable datarate of the femtocell. It is conceivable that E[Tb] > E[Tm] for the near future and this givesus our desired condition: gm(α, x) < gf (α, x). Note that (2.10) underestimates E[Tf ]. Sincefemtocell adopters use macrocell services only when they are outside, they may receive betterexpected throughput E[Tm] than pure macrocell users. Yet, this impact will be low sincefi > fo and E[Tb] > E[Tm].
Tm depends upon the position-varying and time-varying channel conditions, interferencefrom the femtocells and the congestion in the network. Analyzing data rate variations dueto channel conditions is beyond the scope of this chapter. Hence, to simplify, we de�ne amacrocell data rate R(αx), that captures all channel variations and depends only upon thefraction of population that has adopted femtocells. R(αx) can be conceived as an averagethroughput received from the macrocell if exactly one user were to move around the macro-cell, both outside and inside his home, in the presence of αx fraction of femtocells. Note that
15

Figure 2.3. Interference
R(αx) depends on the spectrum scheme being employed (see Section 2.1.2). With R(αx)thus de�ned, the throughput Tm depends upon the congestion in the network only.
To determine E[Tm], we model the congestion in the macrocell network as follows. First,we assume that user population is distributed identically across all cells. Then, if Xcell arethe adopters and Ncell are the number of users in any macrocell, we let x = Xcell
Ncell= X
N. Next,
let users generate i.i.d. requests for downloads following a Poisson process of rate λo whenthey are outside their homes and rate λi when they are inside. De�ne the activity ratio β as
β =λo
λi
. (2.11)
Next, assume that the �le lengths are exponentially distributed. Then, if this download isserved at rate R(αx), it would take random exponential amount of time of mean 1/µ, where
µ =R(αx)
Mean File Length . (2.12)
When l (≥ 0) downloads are simultaneously active, and each download shares the macrocelldata rate equally, each download will be served in random time given by an exponentialdistribution with mean l
µ. With this, we can now generate a Markov chain of the number of
active downloads in the system. In this Markov chain, at any state l, let λt be the rate atwhich new downloads are added and µt be the rate at which downloads are removed fromthe system. The Markov chain thus generated is identical to a processor-sharing queue andis depicted in Fig. 2.4. Next, we determine λt and µt.
Fig. 2.5 depicts how λt is modeled. Suppose foXcell users are outside their homes, andthey generate download requests for the macrocell at rate λo irrespective of whether theyhave adopted service m or f . Of the remaining fiXcell users who are inside their homes, afraction α have adopted the femtocell and do not generate any requests for the macrocellwhile the rest generate requests at a rate λi. Note that this does not capture correlatedbehavior (like peak hour) but only an average sense of the tra�c load. Then, we have,
λt = [fi(1− α) + βfo]xλiNcell. (2.13)
When there are l downloads in parallel for the Markov chain, each taking i.i.d. exponential
16

Figure 2.4. Markov Chain
amount of time with mean lµ, the rate at which the system exits from state l is given by
µt =µ
l× l = µ =
R(αx)
Mean File Length . (2.14)
Figure 2.5. Macrocell Download Arrival Rate
Assume λt < µt. Then, in the stationary state, the probability that the system is in statel is given by
P (l) =1
1− λt/µt
(λt
µt
)l
=1
1− ρt
(ρt)l,
where ρt = λt/µt. When the system is in state l, individual requests obtain a data rate ofR(αx)
lfrom the system. Thus, letting E[Tm] be the expected rate at which the system serves
17

individual requests, when requests are present, we have
E[Tm] =
∑∞l=1
R(αx)l
P (l)∑∞l=1 P (l)
.
Note that∑∞
l=1 P (l) 6= 1; it represents the fraction of time that the macrocell is busy servinga download. On simpli�cation, we have
E[Tm]
R(αx)= τ(α, x) =
(1− ρt
)− log(1− ρt
)
ρt
. (2.15)
From (2.14), since µt depends on R(αx), we note that τ also depends upon the spectrumscheme being used. Henceforth, we use the subscripts s and c to denote the quantities speci�cto the split and common spectrum schemes respectively.
2.1.2 Model for R(αx)
Assume that the operator has a total spectrum availability of 1.2W . We will assumethat the macrocell data rate is proportional to the employed spectrum. Accordingly, if theoperator employs this complete spectrum for the macrocell, let him obtain the macrocelldata rate 1.2R0. Let the corresponding service rate as de�ned in (2.14) be 1.2µ0.
Split Spectrum
In this scheme, assume that the operator chooses to split his spectrum as follows - Wfor the macrocell and 0.2W for the femtocells.3 In this case, we assume there will be nointerference due to the femtocells and the macrocell data rate will be R0 (correspondinglyµ0):
Rs(αx) = R0. (2.16)
Common Spectrum
In this scheme, the operator chooses to operate both the macrocell and the femtocell in thesame 1.2W MHz spectrum. In this case, when no femtocells are adopted, the macrocell datarate will be 1.2R0 (correspondingly 1.2µ0). As femtocell adoption rises, interference fromthe femtocell downlink reduces throughput for macrocell users by a�ecting the downlinkmacrocell rate (see Fig. 2.3). Next, assuming that all femtocell users contribute equally todegradation of the macrocell data rate, we let the macrocell data rate decrease linearly inthe number of users who adopt the femtocell.
Rc(αx) = max{1.2R0(1− dαx), 0}, (2.17)3This closely models the solution proposed by Clearwire/Sprint where 5 MHz will be reserved for femto-
cells and 30 MHz for the macrocell.
18

where d > 0 is the coe�cient of degradation and x = Xcell
Ncell= X
N. For any network, d may
be estimated as follows. If R(α) 6= 0 for α < 1, i.e., if the macrocell rate does not go to 0before every user adopts the femtocell, then d = 1 − R(1)
R(0)≤ 1. Else, d = 1
αmin> 1 where
αmin = arg minR(α)=0
α.
Model for Γ
Γ gives us the distribution for the user valuations. For γ ≤ 0, Γ(γ) = 0 and for γ > γmax,Γ(γ) = 1. In this chapter, we will assume only a uniform distribution of users.
Γ(γ) =γ
γmax
, γ ∈ (0, γmax]. (2.18)
2.2 Operator RevenuesTo simplify expression, we de�ne the broadband rate factor b and the macrocell capacity
c0 asb =
E[Tb]
R0
, c0 =µ0
λiNcell
, (2.19)
and normalize the values of pm, pf , gm, gf w.r.t. kR0. From (2.1) and (2.7), revenue has thesame units as γg(·)X ∼ γkR0xN . Henceforth, we normalize the revenues w.r.t. kR0N .
2.2.1 Femtocell: Split Spectrum
From (2.9), (2.15) and (2.16), we have (normalizing gsm and gs
f )gs
m = τ s, gsf = (fib + foτ
s), (2.20)τ s = (1− ρs
t)− log (1−ρs
t )
ρst
where ρst = [fi(1−α)+βfo]x
c0.
Solving (2.5), (2.6), (2.7) and (2.8) using (2.18) and (2.20), we can obtain the values of xand α for any given pm and pf . Substituting these values in (2.1) and optimizing w.r.t. pm
and pf , we get the monopolist's optimal choice.
2.2.2 Femtocell: Common Spectrum
From (2.9), (2.15) and (2.17), we have (normalizing gcm and gc
f )
gcm = 1.2τ c[1− dαx]+, gc
f = (fib + fogcm), (2.21)
τ c = (1− ρct)− log (1−ρc
t )
ρct
where ρct = [fi(1−α)+βfo]x
1.2(1−dαx)c0.
19

Solving (2.5), (2.6), (2.7) and (2.8) using (2.18) and (2.21), we can obtain the values of xand α for any given pm and pf . Substituting these values in (2.1) and optimizing w.r.t. pm
and pf , we get the monopolist's optimal choice.
2.2.3 Base case: No Femtocell
In this case, the entire spectrum is used for the macrocell and no femtocells are deployed.Hence, this is similar to the common spectrum femtocell deployment with α = 0. From(2.5), (2.7) and (2.21), γm is a solution of
γ =pm
gcm(0, 1− Γ(γ))
=pm
1.2kR0τ c. (2.22)
Normalized operator revenue is pmXkR0N
= 1.2γmτ c[1− Γ(γm)
].
2.3 ResultsWe carried out the numerical analysis4 in MATLABr. For each scenario, we varied
pm, the price of service m, and pf , the price of service f . For each such pair (pm, pf ), wedetermined the values of x and α in equilibrium using the �xed point approach. Table 2.1lists the parameter values5 used for the numerical analysis. Unless otherwise speci�ed (orvaried), the parameter values used in the numerical analysis are the ones listed in Table 2.1.
Table 2.1. Table of default parameter valuesParameter Description Valuefo = 1− fi Fraction outside 0.3
β Activity Ratio(
λo
λi
)1
b Broadband factor( Tf
R0
)2
c0 Macrocell capacity(
µ0
λiNcell
)0.5
d Degradation coe�cient 0.5γmax Maximum User Type 1
Figures 2.6(a), 2.6(b) and 2.6(c) depict the optimal values of the normalized revenues, xand α varying with the network capacity c0 (de�ned in (2.19)). For each value of c0, pm andpf have been chosen optimally. From Fig. 2.6(a), all femtocell schemes yield much higherrevenues than with no femtocells. Further, this revenue gain is relatively more pronouncedwhen the macrocell capacity is low. However, at these low levels of capacity, even the common
4Code is available upon request from nikhils[AT]eecs.berkeley.edu.5Refer [73] for the choices of fo and β.
20

0.2 0.4 0.6 0.8 1 1.20
0.05
0.1
0.15
0.2
0.25
0.3
0.35
0.4
c0
Optimal Revenues
No FemtoSplitCommon (d=0.1)Common (d=0.5)Common (d=1)
(a) Optimal Revenues
0.2 0.4 0.6 0.8 1 1.20
0.1
0.2
0.3
0.4
0.5
c0
Optimal x
No FemtoSplitCommon (d=0.1)Common (d=0.5)Common (d=1)
(b) Optimal x
0.2 0.4 0.6 0.8 1 1.20.5
0.6
0.7
0.8
0.9
1
1.1
co
Optimal α
SplitCommon (d=0.1)Common (d=0.5)Common (d=1)
(c) Optimal α
Figure 2.6. Revenues, x and α vs c0
spectrum scheme with d = 1 earns revenues comparable to the split spectrum deployment.As the degradation coe�cient (d) increases, revenues from common spectrum deploymentsstrictly decrease as expected. However, the common spectrum scheme with d = 0.1 earnshigher revenues than the split spectrum scheme for all c0, which con�rms that a commonspectrum scheme with low enough d may be superior to the split spectrum scheme. Infact, even with d = 0.5, the revenues from a common spectrum scheme are only marginallylower for all c0. From Fig. 2.6(b), all femtocell schemes serve a larger number of users inequilibrium with the split spectrum scheme performing the best. Finally, from Fig. 2.6(c),at low macrocell capacity, almost full adoption is optimal for all femtocell deployments. Athigh macrocell capacity, optimal α < 1 for common spectrum schemes with high degradation.Here, macrocell degradation impacts the number of users served. To keep the number ofusers (and the resulting revenues) high enough, α is reduced via a higher pf .
21
2.4 ConclusionIn this chapter, we provide an economic framework for the analysis of adoption of fem-
tocells. We compared the economic viability of two spectrum schemes - split spectrumand common spectrum - for deployment of femtocells in a 4G network. We assumed thata single monopolist network operator sets prices for both the mobile-only service and thefemto+mobile service. Users were assumed to possess linear utility for data throughput andhave di�erent valuations for data throughput. Our results suggest that the optimal pricingscheme always charges a higher price for the femtocell service. Further, at the optimal prices,almost full adoption of femtocells is achieved in most cases. As expected, if the degradationcoe�cient is su�ciently low, the revenues from the common spectrum scheme are alwayshigher than with the split spectrum scheme. However, interestingly, when the macrocell ca-pacity is low, though all femtocell deployments bring in higher revenues, the revenues fromcommon spectrum schemes are comparable to the split spectrum even when they heavilydegrade the macrocell capacity.
Though we assumed that the user bene�t is linear in throughput, in reality, we expectit to be concave. The linearity impacts our results in two ways, yet we will argue that itdoes not markedly change our results. One, high femtocell throughput does not result inproportionally higher revenues from femtocells. Including this e�ect will reduce the viabilityof all spectrum schemes equally, without a�ecting the relative performance. Two, userslose utility if the throughput varies considerably during usage. Though it appears thatthe common spectrum scheme su�ers more from this e�ect than the split spectrum schemedue to the random interference from femtocells, this may not necessarily be true. Sincethe macrocell in the split spectrum scheme has lower capacity (due to the lower spectrumavailability), the higher congestion may cause large throughput variations and wipe out anygains in the user utility.
We do not consider the additional operational cost of deploying femtocells and the prob-able femtocell revenue share with wireline providers. These factors will further reduce theviability of both schemes, but, the relative performance of the two schemes may not be af-fected. Though the linear interference model may be simplistic, it provides a framework forestimating the real-life parameters for such an environment.
We carry out the analysis from the point of view of service provider revenues only anddo not consider the total utility accrued to users as a result of the scheme adopted. It isconceivable that the scheme that provides maximal revenues does not maximize the totalutility for the users. The restriction to a monopolist is also a drawback of the analysis. Aspart of future work, the authors wish to investigate the performance of the two schemes inthe presence of operator competition.
22

Appendix
Proof of Theorem 2.1.1
The user with type γm will be indi�erent between buying some service and not buying,i.e., Uγm
m = 0 or Uγm
f = 0 depending upon the value of α.If α = 1, the critical user type γm prefers to buy service f over service m, and he is
indi�erent between buying service f and not buying anything:
γmgf (1, x)− pf = 0, and γmgm(1, x)− pm ≤ 0,
which gives us the desired result: γm =pf
gf (1,x)≤ pm
gm(1,x).
If α < 1, the critical user type γm is indi�erent between buying service m and not buyinganything and his utility from buying service f is strictly lower:
γmgm(α, x)− pm = 0, and γmgf (α, x)− pf < 0,
which gives us the desired result: γm = pm
gm(α,x)<
pf
gf (α,x). Note that if γm > γmax, then x = 0.
For any given x, if α < 1, the critical user type γf is indi�erent between service m andservice f , i.e., U
γfm = U
γf
f :
γfgm(α, x)− pm = γfgf (α, x)− pf
which gives us the desired result: γf =pf−pm
gf (α,x)−gm(α,x). Note that if γf > γmax, then α = 0.
Proof of Corollary 2.1.2
If α = 1, for any x, γm =pf
gf (1,x)≤ pm
gm(1,x). Then, it must hold in equilibrium that
pf
pm≤ gf (1,x)
gm(1,x). If α < 1, for any x, γm = pm
gm(α,x)<
pf
gf (α,x). Then, it must hold in equilibrium
that pf
pm>
gf (α,x)
gm(α,x). If pf
pm≯ gf (α,x)
gm(α,x), α ≮ 1, which gives us α = 1 and the desired result.
23

Monotonicity of g(·)Let ρ = λt
µt. From λt < µt, we have 0 ≤ ρ ≤ 1. Then,
∂τ(α, x)
∂ρ=
∂
∂ρ((1− ρ)
− log(1− ρ)
ρ)
∴ ∂τ(α, x)
∂ρ=
1− ρ
ρ
1
1− ρ+−1
ρ2(− log(1− ρ))
=1
ρ+
log(1− ρ)
ρ2
=ρ + log(1− ρ)
ρ2
The numerator ρ + log(1 − ρ) is 0 at ρ = 0. For ρ > 0, the slope of the numerator is1− 1
1−ρ= −ρ
1−ρ< 0 which means it is a decreasing function. Hence, the numerator is always
negative. Since the denominator is always positive,
∂τ(α, x)
∂ρ< 0. (2.23)
From (2.13) and (2.14), we know that ρ = [fi(1−α)+βfo]λiNcell
µx, which gives us ∂ρ
∂x> 0 and
∂ρ∂α
< 0. Hence, from (2.23),
∂τ(α, x)
∂X=
1
N
∂τ(α, x)
∂x< 0 and ∂τ(α, x)
∂α> 0. (2.24)
24

Chapter 3
Welfare Maximization - Quality of
Service
In today's Internet, despite the technological possibility of providing network-wide dif-ferentiated services (QoS),1 no such services are actually o�ered by the ISPs [26]. AlthoughISPs o�er multiple contracts (rate tiers), these rate tiers are hardly service classes - they onlyspecify the peak data rate on the access link and the maximum volume of data (aggregateper user). Indeed, no contract is backed by congestion guarantees throughout the network.Thus, although some contracts may improve performance if the access link was the networkbottleneck, the user's data may still be congested at other points in the network. In thischapter, we do not explicitly consider these service tiers, though our analysis will re�ecttheir presence. Recently, some ISPs have begun to o�er services that prioritize the user'spackets throughout their individual networks [1]. But such prioritization is limited by theamount of time (via restricting the volume of data) during which a �le's download is spedup. We believe that these modest attempts to improve QoS are inadequate and re�ect theISPs' concerns about the imposition of network neutrality regulations.
In the broadest sense, network neutrality is about �the rules of the game� (standards, lawsand regulations) between all networked parties. The network neutrality debate includes awide array of issues about ISPs' rights and responsibilities with respect to network pricing andmanagement, and interactions with content providers. We make no attempt at summarizingthe issues. For extensive coverage, see [87].2 The question whether current ISP practicesshould continue and be mandated by law, or ISPs ought to be allowed to charge users forQoS is part of this larger debate on network neutrality. This chapter addresses only thisaspect of the network neutrality debate.
1For brevity, the term quality of service (QoS) refers to such services.2Also see [96] for a discussion of relevant pros and cons.
25

In general, lack of QoS could be driven by numerous demand and supply considerations.Indeed, from the demand side, the ISPs could choose no QoS provision due to high uncer-tainty about demand for bandwidth,3 and meager end-user demand for premium QoS, whichdoes not justify the necessary up-front expenses.4 In this chapter, we do not address thesedemand-side reasons.
From the supply side, four reasons are worth mentioning. First, the lack of QoS could bedriven by di�culties of QoS pricing due to ISP competition [38, 93, 41]. Second, QoS provi-sion could be an inferior investment relative to plain capacity expansion.5 Third, contractualdi�culties between the ISPs also undermine ISP incentives for QoS, that is if QoS were de-pendent on a single ISP, it would be pro�table to o�er,6 but the end-to-end QoS guaranteescould become impractical due to contractual and informational imperfections. Lastly, fourth,the threat of network neutrality regulations hampers ISPs' incentives for QoS. Indeed, atpresent, the ISPs are �at their best behavior,� i.e., they su�er from self-imposed constraints,and these constraints may preclude the ISPs from investing into developing QoS [30, 105, 90].
In practice, ISPs are increasingly `managing' network congestion via di�erentiated treat-ment of tra�c from heavy network users. ISP investment into network equipment thatenables them to implement such policy decisions indicate that they view plain capacity ex-pansion as an inferior option. Contractual di�culties could be an important cause for thelack of end-to-end quality of service. But, increasingly, a large fraction of network tra�c isbeing served via Content Distribution Network (CDN) servers and data centers located atthe edge of the network [59]. Hence, only a small fraction of tra�c traverses ISP boundaries.This implies that ISPs can substantially improve service quality by o�ering di�erentiated ser-vices within their own domains. End-to-end di�erentiation is an open problem and will notbe tackled in this chapter. To sum up, this chapter addresses supply-side reasons, focusingon the �rst and fourth reasons only.
We build on the classical industrial organization literature pioneered by [64, 56], whereboth capacities and prices are chosen strategically. [56] demonstrated that when the �rms�rst compete in capacities, and thereafter engage in price competition (Bertrand), theCournot-like outcome is an equilibrium. Several recent papers [52, 3, 2, 79] apply theseideas to large-scale communications networks, and most address QoS issues (congestion)only from a routing perspective. None of these papers considers two service classes.
Our pricing model is based on the network architecture similar to the Paris Metro pro-posal (PMP) [70]. Other closely related papers modeling PMP are [33, 27]. Both [33, 27]focus on ISP competition, with network access provided by duopolists, but include no anal-ysis of the e�ects of ISP choices on user welfare. We assume that capacity is costly, andprovide complete analysis of ISP capacity choices and its division between service classes.We calculate end-user welfare for any number of competing ISPs, and compare equilibria for
3This uncertainty is so profound that demand estimation posits di�culties [37, 98, 6].4From analysis in [25], with high upfront costs, only primitive QoS mechanisms are viable, which may be
insu�cient to achieve a meaningful quality increase.5For example, [71] asserts that improving QoS by investing in capacity is more pro�table than investing
in provision of multiple service classes.6We demonstrate in [84], that QoS provision is indeed pro�table for a monopolist.
26

a single- and two-service classes networks. Our results indicate that ISP competition perse does not preclude QoS provision. We �nd that even with perfect competition betweenISPs, two service classes remain optimal. Thus, in contrast with [33], we do not view ISPcompetition alone as a valid explanation for the lack of QoS in the Internet.
Instead of appealing to ISP competition to explain the current lack of QoS, we suggestthat the lack of QoS could be driven by political economic considerations. Indeed, in oursetting, when the number of competing ISPs is small, a high fraction of ISP capacity isallocated to premium service. In this case, the fraction of existing (who used to buy accessin a single service class regime) users forced to buy premium access is also high, becausethe quality of basic service does not satisfy their needs. For these users, the welfare is lowerthan it was with a single service class, and this adverse distributional e�ect could bring thediscontent of such users. The ISPs may fear that this will justify the imposition of neutrality.Thus, at low levels of ISP competition, the threat of network neutrality regulations could beused to explain the current lack of QoS on the Internet. This e�ect becomes less signi�cantwith increased ISP competition, and disappears when the number of competing ISPs is high.Even with highly competitive ISPs, our analysis indicates a superiority of two service classesfor both ISPs and end-users. Still, even in this case, driven by the ISP fear of neutralityregulation, ISPs may constrain themselves from o�ering two service classes.
In our related work [85], we explore an inexpensive regulatory tool that alleviates in-vestment disincentives of ISPs by securing their property rights over a pre-speci�ed fractionof their capacity. This tool achieves two goals. It reduces negative distributional e�ectsof adopting multiple service classes; also, it eliminates the threat of imposition of networkneutrality for a pre-speci�ed fraction of the ISPs' capacity and restores the ISPs' incentivesfor QoS deployment.
The chapter is organized as follows. In Section 3.1, we outline our model. In Sec-tions 3.2.1 and 3.2.2, we analyze the networks where each ISP provides a single-service classand two-service classes respectively. In Section 3.3, we present our results and in Sections 3.4and 3.5, we discuss our �ndings and conclude. The technical details are relegated to the Ap-pendix.
3.1 Model
3.1.1 The environment
To start, let us consider a single service class network. We assume that M identicalcompeting ISPs (where M is �xed) o�er connectivity to a user base of �xed size. Let N(which we assume to be large) be the total number of end-users. Here, and below, we usethe superscript m = 1, ..., M to denote the variables of the m-th ISP. First, each ISP chooseshis capacity Cm ≥ 0 that he builds at a constant unit cost τ > 0. Investment in capacity isirreversible. Second, once the capacity is sunk, each ISP makes his pricing decision pm, after
27

which the end-user price for network connection p (access price p for short) is determinedby
p = minm=1,..M
pm. (3.1)
From (3.1), when one of the ISPs announces a price lower than the other ISPs, due to ISPcompetition, all others must lower their prices as well. Indeed, the frequently occurringprovision �If you �nd an o�er with a lower price, we will be happy to match it� amountsexactly to (3.1).
Each user decides whether to purchase the service, and from which ISP. The m-th ISP'sobjective is to maximize pro�t Πm
total which equals his revenue net of his capacity expense:
Πmtotal = max
Cm,pm{pZm − τCm} ,
where Zm is the number of users who adopt the service from the m-th ISP. Also, let Z =∑m Zm be the aggregate number of end users who purchase the service.Next, let us consider two service classes l and h. Let the m-th ISP allocate capacities
Cmi , and quote prices pm
i with pmh > pm
l for service i = l, h. Also, let Ci =∑
m Cmi be the
aggregate capacity for service i. Similar to (3.1), the access prices pi are determined by
pi = minm=1,..M
pmi , i = l, h. (3.2)
We call h premium service (the service with a higher access price), and we call l basic service(the service with a lower access price). Then, the m-th ISP's objective becomes:
Πmtotal = max
Cmi ,pm
i
{∑i
piZmi − τCm
},
where Cm =∑
i=l,h Cmi and Zm
i is the number of users who adopt service i from the m-th ISP.Let Zi =
∑m=1,..M Zm
i be the aggregate number of end-users adopting service i = l, h andCi =
∑m Cm
i be the aggregate capacity. The access price pi of each service i is determinedby (3.2).
We de�ne the quality of service q observed by users as q = 1 − Z/C, if Z users aremultiplexed in capacity C. This de�nition of quality re�ects the common perception aboutservice quality [33]. As Z decreases and capacity remains the same, the quality of serviceimproves, i.e., as the capacity per user increases, so does the quality. Finally, we assume thateach user contributes equally to the loss of quality, i.e. each user generates an identical unitamount of tra�c. Let z = Z/N denote the fraction of the users who purchase the serviceand c = C/N denote the capacity per user in the base. Then, using these normalized values,q = 1− z/c. Similarly, for i = l, h, let zm
i = Zmi /N , cm
i = Cmi /N and qi = 1− zi/ci.
Let each user in the user base be characterized by his type θ, which we assume to be arandom variable with support [0, 1]. For a user with type θ, the lowest acceptable servicequality is q = θ; and his highest a�ordable access price is p = θ. Thus, a user buys a serviceonly if this service is acceptable and a�ordable, i.e., p < θ ≤ q [99]. Here, we assume thatthe user willingness-to-pay and the quality requirement coincide, i.e., a user with a high
28

quality requirement also has a high willingness-to-pay. One can imagine cases violating thisassumption. For example, a user with low willingness-to-pay could have high requirementfor quality. Still, we expect that, in most cases, price and quality requirements are highlycorrelated, and our model is well-suited for such a scenario. For the user with type θ, thesurplus Uθ is given by
Uθ = (θ − p)I(q − θ), where I(y) =
{1 if y ≥ 0
0 if y < 0. (3.3)
The parameter θ can also be interpreted as the network quality required for the most quality-intensive application that this user utilizes. Indeed, when a user adopts a service for e-mailonly, he gains no extra bene�t if his network quality permits someone else to use streamingvideo, which makes (3.3) a good �t. Our user preferences are primitive, but similar toroutinely used preferences in such contexts [2, 102]. In these papers, user utility dependsexplicitly on q, which they term �congestion cost,� but all users are homogeneous. Our usersdi�er in type, but the preferences depend on q as a step function only.
In general, for a distribution p(θ) of user types θ ∈ [0, 1], the aggregate user surplus can beexpressed as Utotal =
∫ 1
0Uθp(θ)Ndθ. With an assumption of user types uniformly distributed
in [0, 1], we have Utotal =∫ 1
0UθNdθ. Although the uniformity assumption is restrictive, it
is common [42]. We impose this assumption for analytical tractability. In contrast to thisassumption, [4, 88] impose fewer restrictions on the distribution of user types but providetheir analyses for a monopolistic ISP only. Let U = Utotal
Nbe the surplus per user in the base.
Then,U =
∫ 1
0
Uθdθ. (3.4)
Similarly, let Πm =Πm
total
N. With a single service class, the m-th ISP objective is:
Πm = maxcm,pm
{pzm − τcm} ,
and with two service classes, his objective becomes:
Πm = maxcm,xm,pm
i=l,h
{∑
i=l,h
pizmi − τcm
}. (3.5)
Per user in the base, the social surplus S is the sum of user surplus and provider pro�t:S = U + Π, where Π =
∑Mm= Πm.
We assume that, for each service, the number of end-users who purchase a service fromthe m-th ISP is proportional to his share of capacity dedicated to provision of that service.7Then, for a single service class we have:
zm = smz, where sm =cm
c(3.6)
7This assumption may be relaxed and was imposed for expositional reasons.
29

and for two- service classes we have:
zml = sm
l zl and zmh = sm
h zh, where sml =
cml
cl
, smh =
cmh
ch
. (3.7)
We justify (3.6) and (3.7) by the following provision routinely present in the end-user con-tracts: �you can cancel your contract any time during the �rst 30 days�. Indeed, if one ofthe ISPs serves a higher share of end-users than his respective share of total capacity, hisusers would experience a lower quality. Then, the marginal user (for whom this quality dif-ference matters) will use this provision to switch to another provider with disproportionately(relative to his installed capacity) lower number of end-users. In other words, the provisionpermits to recreate the situation in which the ISPs' investments are observable by end-users.
3.1.2 Network Regulations
Let xm denote the fraction of the m-th ISP capacity allocated to the premium service.Then we have:
cml = (1− xm)cm and cm
h = xmcm. (3.8)From (3.8), one can easily switch between the use of (cm
l , cmh ) and (cm, xm) as choice variables.
In fact, we will freely switch between these two notations.We will say that the network is regulated when the regulator restricts capacity division
between the service classes. The regulator's choice variable is x = (x1, . . . xm . . . , xM), i.e.,the regulator only a�ects the m-th ISP by constraining him from dedicating more than afraction xm of his capacity to service h. We assume that the regulatory constraint is identicalfor all ISPs xm = x. Then, with regulations, the m-th ISP's objective becomes
Πm = maxcm,pm
l ,pmh
{plzl
cml
cl
+ phzhcmh
ch
− τcm
}and cm
h ≤ xcm.
The case of a single service class is identical to the imposition of x = 0. We do not considerexplicit regulations in the case of single service class, but we believe that the lack of QoSprovision by ISPs in the current Internet re�ects the tacit presence of such a regulatorythreat. The ongoing network neutrality debate con�rms that this threat is indeed real.We argue that this regulatory threat makes the ISPs to act as if x = 0 is imposed. Thisregulatory threat could explain why QoS is not provided currently (see Introduction). Thus,we use the surplus of the single service class users as a proxy for the surplus of the currentInternet users.
We consider three regulatory scenarios. Regulator 1 (a social planner) maximizes socialsurplus (sum of aggregate user surplus and ISP pro�t), regulator 2 maximizes user surplusand regulator 3 maximizes the surplus of the users who are served under a single serviceclass. For the regulators 1 - 3, the respective objectives S1, S2 and S3 are:
S1 = maxx{U + Π} ; S2 = max
xU ; S3 = max
xU |θ∈Θ, (3.9)
where U is de�ned in (3.4), and Θ denotes the set of end-users served in the network with asingle-service class only. Let x1, x2, x3 be the values chosen by the regulators 1-3 respectively.
30

3.1.3 The Order of Moves
In the unregulated two-service class case, we assume the following order of moves. First,the ISPs simultaneously and independently invest in irreversible capacity c = (c1, ..., cM),and observe c. Second, the ISPs simultaneously and independently choose x = (x1, . . . , xM),i.e., the capacity division between the services. Let ci = (c1
i , ..., cMi ) denote the vector of ISP
capacities dedicated to the provision of service i = l, h with cmh = xmcm. Next, the ISPs play
a subgame G(c,x), in which they make pricing decisions pmi and the access price pi of each
service i is determined by (3.2).With the regulator present, we assume that he makes the �rst move and announces
x. After the ISPs observe x, they simultaneously and independently invest in irreversiblecapacity c. Next, upon observing the capacities the ISPs play the game G(c,x). In contrastwith the unregulated case, where c is chosen before x, with a regulator, x is chosen beforecapacities are sunk. Notice, that single-class service equilibrium can be obtained as the casein which all ISPs must choose xm = 0, and this restriction is imposed before the ISPs investin capacities.
Another possibility is that the regulator announces x after the ISPs' capacity is installed.Then, in the short-run, since ISP capacity investments are irreversible, the regulator couldimpose an x that is extremely favorable to users. However, in the long-run, as tra�c require-ments increase for all users, ISPs will aver from capacity upgrades and the new equilibriumwill correspond to the order of moves we have described here. In the rest of the text, weanalyze only a regulator concerned about the long-term impact of his choices. We refer aninterested reader to our working paper [86] for a complete analysis and comparison of boththe long-run and the short-run cases.
With two service classes, in both cases, with and without regulator, we assume thatthe ISPs choose their prices after they observe capacities c. We justify this assumption bythe scale of the required initial investments. Capacities of the ISPs tend to be longer-terminvestments in infrastructure, and thus are harder to adjust.
In the unregulated case, the ISPs' capacity divisions between service classes x is assumed�xed and observable prior to prices being chosen by the ISPs. We justify this assumptionby letting prices adjust quickly to changes in x. Indeed, consider the situation where them-th ISP alters his xm after the prices are chosen. In reality, such an alteration would beimmediately followed by price adjustments and ISPs would choose the new prices optimally,given the new x. Hence, we can also view this subgame as a game being replayed by the ISPsuntil a stable capacity division vector x and the corresponding optimal prices are reached.Modeling this as the result of a game where x is chosen before prices is hence justi�ed.
3.1.4 Subgame G(c,x)
Consider the subgame G(c,x), which occurs after ISPs' capacities have been sunk andtheir divisions are chosen. In G(c,x), each ISP maximizes his gross revenue.
31
We analyze G(c,x) when the ISPs provide a single- (x = 0) or two service classes:
(a) Single service class: The ISPs simultaneously choose pm, and the access price is deter-mined by (3.1).
(b) Two service classes: The ISPs simultaneously choose (pml , pm
h ), and the access pricesare determined by (3.2).
In G(c,x), the m-th ISP objective Rm = Rmtotal/N is:
Rm = maxph,pl
(∑
i=l,h
smi piz
mi ) =
cml
cl
plzl +cmh
ch
phzh. (3.10)
Short-run Game
In addition, we will consider a modi�ed game to address the short-run e�ects of transition.We will de�ne this short-run game as a game where ISP capacities are �xed at the equilibriumlevel of the single service class (c†). With this capacity �xed, the ISPs engage in provisionof two service classes with or without regulation imposed. Accordingly, the regulator alsoassumes a �xed c† in his optimization.
3.2 AnalysisAlthough a single service class can also be viewed as a regulatory restriction x = 0, to
ease the exposition we consider the case of single service class separately.
3.2.1 Single Service Class
Assume that all ISPs provide a single service class only. This means that the entirecapacity c is o�ered at the access price p, determined by (3.1).
Theorem 3.2.1 With a single service class, there exists a unique Pareto e�cient equilibrium
in the game between M ISPs. This equilibrium is symmetric; aggregate capacity, number of
adopting users, and service quality are increasing in M.
Proof See Appendix for details.
32

Let us summarize the intuition behind the proof of Theorem 3.2.1. Let M = 1. From(3.3), a user with type θ will adopt the access (service) if and only if p < θ ≤ q, whereq = 1− z/c, with z being the fraction of users who adopt the service. Clearly, the service isa�ordable to all users with type θ > p. As more users adopt the service, z increases and qdecreases until it becomes equal to the user type at some critical value of θ. Let users withtypes θ ∈ (θ
, θ] adopt the service. Then, we obtain (see Appendix)
θ
= p and θ =p + c
1 + c, and z =
c
1 + c(1− p), (3.11)
and the monopolist maximizes his revenue given by
R = pz =c
1 + cp(1− p). (3.12)
The revenue maximizing price is p = 1/2.Next, let M > 1, and the m-th ISP's capacity be �xed at cm. Once this capacity is sunk,
the ISP's objective is to maximize his revenue Rm(c, p):
Rm(c, p) = pzm, where zm = smz. (3.13)
Since sm are �xed once capacities c are sunk, revenue maximization becomes identical forall ISPs: maxpm pz. Therefore, it is optimal for each ISP to choose the price coinciding withthe monopolist's access price p = 1/2, as this maximizes the total revenue. Indeed, if an ISPdeviates and quotes a lower price, his revenue decreases because his share of revenue remainsthe same, but the aggregate revenue becomes lower.
Note that any price p < 1/2 is an equilibrium in this subgame. However, in all theseequilibria, the revenue earned by the ISPs is lower than the monopolist's access price 1/2.Hence, these equilibria are not Pareto-optimal. Thus, for any M , and �xed c, the Paretoe�cient equilibrium price is identical to the one in the game with M = 1.
Hence, for any c, the aggregate revenue is maximized at p† = 1/2, and equals R(c, 1/2) =c
4(1+c), which permits us to simplify the m-th ISP objective to
Πm = maxcm
cm
4(1 + c)− τcm.
This objective resembles the players' objectives under Cournot competition, similar to [56].Henceforth, we will use the superscript † to designate the ISPs' optimal choices in the singleservice class case. In Appendix, we derive the aggregate equilibrium capacities for any M :
c†(τ, M) =(M − 1) +
√(M − 1)2 + 16τM
8τM− 1, (3.14)
for τ ∈ (0, 0.25), and c†(τ,M) = 0, for τ ≥ 0.25. Also,
p† = 1/2; θ† =
1
2and θ† =
12
+ c†
1 + c†. (3.15)
33

From (3.14), for a monopolist and for perfect competition:
c†(τ, 1) =1
2√
τ− 1 and c†(τ,∞) =
1
4τ− 1. (3.16)
From (3.14) and (3.15), we have U † and S† increasing, and Π† decreasing with M . Due topeculiarities of our model, price does not depend on M for single service class. Still, notethat equilibria di�er with M because capacities increase in M . In general, prices shoulddepend on M , and with two service classes, they do.
3.2.2 Two Service Classes
To start, we consider a monopolistic ISP (M = 1) who provides two service classes. From(3.5), his objective is:
Π = maxc,x,ph,pl
(∑
i=l,h
pizi − τc),
where c = cl + ch and from (3.8), cl = (1− x)c and ch = xc. Henceforth, we will denote theISPs' optimal choices in the case of two service classes by ‡.
Theorem 3.2.2 For M = 1, there exists a unique equilibrium in G(c, x) :
p‡l (c, x) = 12− chcl
2[(1+cl)(1+ch)cl+ch], p‡h = pl+cl
1+cl, (3.17)
and, θ l = p‡l , θl = θ
h = p‡h, θh =p‡h+ch
1+ch. (3.18)
The users with types θ ∈ (θ l, θl] and θ ∈ (θ
h, θh] adopt services l and h respectively.
Proof See Appendix for details.
Let us summarize the intuition behind the proof of Theorem 3.2.2. First (Lemma 3.6.1),we note that, analogous to the case of a single service class, users with type θ ∈ (θ
l, θl] adoptservice l, irrespective of price ph. Second (Lemma 3.6.2), we prove that, for any given pl, theISP's revenue is maximized at some ph ≥ θl. The result follows from (3.3), since introducinga service h priced at ph < θl has no e�ect on the users of service l; no such users will shift toservice h. Also, there is no e�ect on the number of users adopting service h. Thus, a lowerprice results in a lower revenue, from which ph ≥ θl follows.
Third (Lemma 3.6.3), we show that in the ISP optimum, θl = θh = ph. This implies that
there is �no gap� between service classes, i.e., (θl, θh) is an empty interval. Assume to the
contrary that there is a gap between the service classes. Then, one can view each of the twoservice classes as separate networks, each providing a single service class. The monopolisticISP will price each class independently to maximize his pro�t. From (3.12) and (3.13), in
34

a single service class network, the ISP revenue is concave in price and the optimal price isunique and equal to 1/2. Hence, if there is a gap, ph = pl = 1/2, which contradicts ph > pl.Thus, indeed, there is no gap and θl = θ
h = ph. From Lemmas 3.6.1 - 3.6.3, we obtain (3.18)which can be expressed in terms of c and x using (3.8). This permits us to express the ISPrevenue as a function of c, x, and pl only:
R(c, x, pl) =cl
1 + cl
pl(1− pl) +ch
1 + ch
pl + cl
1 + cl
1− pl
1 + cl
. (3.19)
Thus, with �xed cl and ch, the ISP revenue maximization can be expressed as an optimiza-tion in just one variable � pl. Maximizing (3.19) with respect to pl, we obtain (3.17) (seeAppendix), which completes the proof of Theorem 3.2.2.
From Theorem 3.2.2, we have θh > θl, i.e., the service h with a higher price (pl < ph),has a higher quality (ql < qh) too.
Theorem 3.2.3 For M > 1, there exists a unique symmetric Pareto e�cient equilibrium
in G(c,x); the prices and end-user types served in each service class are identical to those
of G(c, x) with M = 1.
Proof Consider G(c,x) in which the ISPs invest symmetrically (cm = cM), and divide their
capacities identically (xm = x). From (3.2), (3.7) and (3.10), at any given pl and ph, ineach service class, each ISP's share of the total revenue equals to his capacity share 1/M .Thus, irrespective of the ISPs' price choices, the revenue is shared equally. Therefore, theISPs' optimal prices coincide with the monopolist's access prices (3.17), as this maximizesthe aggregate revenue. Indeed, if an ISP deviates from these prices, his revenue decreases,because his share of revenue remains the same, but the aggregate revenue becomes lower.
Note that any combination of access prices, where both services l and h or either ofthem have a lower access price than the monopolist's optimal (3.17), forms an equilibriumin this subgame. However, in all these equilibria, the revenue earned by the ISPs is lowerthan the one with the monopolist's optimal access prices. Hence, these equilibria are notPareto-optimal. Thus, for any M , and �xed (and symmetric) c and x, the symmetric Paretoe�cient equilibrium price is identical to the one in the game G(c, x) with M = 1.
Corollary 3.2.4 For any �xed c and x and any M , we have
p‡l (c, x) <1
2and p‡h(c, x) >
1
2. (3.20)
Proof See Appendix.
From (3.3) and (3.20), in the case of a transition from a single service class to two serviceclasses, all existing single-service class users who adopt service l gain surplus, and those whoadopt service h lose surplus.
35
Next, we combine (3.10) with the result of Theorem 3.2.3 to obtain the m-th ISP'sequilibrium revenue in G(c,x):
Rm =cml
1 + cl
p‡l (1− p‡l ) +cmh
1 + ch
p‡l + cl
1 + cl
1− p‡l1 + cl
, (3.21)
where p‡l is given by (3.17). Expression (3.21) is too cumbersome to carry out further inves-tigation analytically, necessitating a numerical analysis (see Section 3.3). The uniquenessresults in the following section justify this numerical analysis.
3.2.3 Uniqueness of Equilibria
In Appendix, we prove the following uniqueness results.
Theorem 3.2.5 For M = 1, at any capacity c, there exists a unique x at which the ISP's
pro�t is maximized. The ISP's revenue increases with x for x ∈ (0, x‡).
Theorem 3.2.6 In the limit of M →∞, at any aggregate capacity c, there exists a unique
x in the equilibrium of G(c).
Theorem 3.2.7 For any �xed c, there exists a unique symmetric Pareto e�cient equilibrium
in the game of M competing ISPs.
The proof of Theorem 3.2.7 starts by establishing the existence of a unique equilib-rium capacity division (x‡(c, M)) in each of the games with M = 1 (x‡(c, 1)) and M = ∞(x‡(c,∞)). For any �xed capacity c, we obtain x‡(c, 1) > x‡(c,∞), i.e., a monopolistic ISPreserves a higher fraction of his capacity to the premium service than a perfectly competitiveISP does. Further, we show that, for any M > 1,
x‡(c,M) ∈ (x‡(c,∞), x‡(c, 1)). (3.22)
From Theorem 3.2.5, for any x ≤ x‡(c, 1), aggregate (and therefore each ISP's) pro�t in-creases with x. Combining with (3.22), we obtain that a unique Pareto optimal x‡(c,M)exists for any �xed c, which leads to Theorem 3.2.7.
Theorem 3.2.8 There exists a unique Pareto e�cient equilibrium in the game of M ISPs
competing in the presence of a regulator. This equilibrium is symmetric.
36

Proof Under regulation, x is �xed before capacity is sunk. The prices in G(c,x are thesame as in the monopolist's case. Note that the single-service class network is identical toa regulated two-service class network with x = 0. Hence, once x is non-zero, the resultingcapacity game is similar to the capacity game with a single-service class (with x 6= 0 andprices p‡l and p‡h). The proof for the unique Pareto-e�cient equilibrium is identical to theproof of Theorem 3.2.1.
3.3 ResultsIn this section, we present the core results of our model. We compare the equilibrium
of the game in which the ISP(s) provide(s) a single service class (denoted by †) with theequilibria of the games in which the ISP(s) provide(s) two service classes for the unregulatedISP(s) (denoted by ‡) and the ISP(s) constrained by regulators. We consider 3 regulators -a social welfare maximizer, a user welfare maximizer and an existing user welfare maximizer(denoted by the superscripts 1, 2 and 3 respectively). Note that we model the unregulatedand regulated scenarios using di�erent games. Indeed, while in the unregulated scenario,the x is chosen ex post (after the capacities are sunk), with the regulator, the restriction oncapacity division is announced ex ante (prior to investments in capacity).
We have obtained a closed form solution for the equilibrium with perfect competition,i.e. in the limit of M →∞, only (see Appendix). As mentioned before, for any �nite M , theexpression (3.21) is too cumbersome to carry out further investigation analytically. Hence,we solve the ISPs' optimization problem numerically8 using MATLABr.
For the unregulated scenario, the determination of equilibrium capacity and its division xis nested in the following four-step procedure. First, we let all ISPs, except one, have identicalcapacity c and consider the remaining ISP's (w.l.o.g. the 1'st ISP) choice of capacity, c1.Second, holding these capacities constant, we let all ISPs, except the 1'st ISP, have identicalx. We determine the the 1'st ISP's best response x1 by maximizing the revenue (3.21).Similarly, we determine the other ISPs' best responses x to x1. The Nash equilibrium isfound as the point where these best responses coincide. This gives us an equilibrium capacitydivision for the capacities described in step 1. Third, we iterate step 2 varying c with a stepof 0.01. We determine the 1'st ISP's best response capacity to any capacity c by maximizingthe pro�t (3.5). Last, we obtain the equilibrium capacity by �nding the value of c whichcoincides with the best response capacity of the 1'st ISP.
For each regulated scenario, x is �xed by the regulator. First, we �x x, and as before,let all ISPs, except one (w.l.o.g. the 1'st ISP), have identical capacity c. Let the 1'st ISP'schoice of capacity be c1. Second, we use the x �xed at step 1 to determine the 1'st ISP'sbest response capacity to any �xed capacity c by maximizing the pro�t (3.5). Third, weobtain the equilibrium capacity c(x) by �nding c which coincides with the 1'st ISP's bestresponse. Fourth, we vary x from 0 to 1 with a step of 0.01 and for each x, determine the
8The code is available upon request from [email protected].
37

Figure 3.1. Legend
ISPs' capacity c(x) using the steps described above. Using c(x), we calculate welfare andpro�ts. Finally, for each regulator, we determine his optimal x from these quantities.
From (3.16), for a single service class scenario, non-zero capacity is optimal only if τ ∈(0, 0.25). Our results are presented for τ ∈ [0.01, 0.15] only, as when τ approaches 0 or 0.25,the computations involve division by terms approaching zero. We obtain optimal values ofthe functions of interest by cycling over the steps described above for τ ∈ [0.01, 0.15] with astep size of 0.01. The legend for all �gures is depicted in Fig. 3.1.
Fig. 3.2 depicts how x (the fraction of capacity that each ISP allocates for serviceh) varies with the cost of capacity. Figures 3.2(a) - 3.2(c) depict x for unregulated andregulated two-service classes scenarios, for di�erent structure of industry competition, i.e.,M = 1, 2, 4,∞.
As we expect, the x chosen by an unregulated monopolistic ISP exceeds x chosen by allregulators, thus decisively showing the necessity of regulation, that is, limiting the monopo-list's fraction of capacity for premium service h. Let x0 denotes capacity division chosen bythe monopolistic ISP. From (3.9), it is intuitive that:
x3 ≤ x2 ≤ x1 ≤ x0.
Indeed, the more the regulator cares about the existing users' welfare, the lower is the fractionof capacity that he allocates for the premium service.
For all other structures of market competition, i.e., M > 1, due to competitive e�ects,the x chosen by the ISPs approaches 0 as capacity cost approaches 0. Except at low capacitycosts, for both M = 2 and M = 4, the ISPs choose an x higher than the one chosen by boththe social welfare and user welfare maximizers (regulators 2 and 3). At low capacity costs,we expect that the regulation will not be binding, even when the number of ISPs is low. Insuch cases, regulation may be unnecessary, but there is no welfare loss if the regulation isimposed.
The range of τ for which competitive ISPs choose a higher x than regulators 2 and3 decreases with M . In fact, in the limit of M → ∞, except at high capacity costs, noregulation is binding. Note that, in this case, the ISP pro�ts are 0 and hence, x1 and x2
(chosen by regulators 1 and 2 respectively) coincide.Fig. 3.3 depicts how aggregate capacity varies with τ for M = 1, 2, 4,∞ and τ ∈
[0.05, 0.15]. Predictably, under all scenarios, the aggregate capacity decreases with τ . Fur-ther, when ISPs compete (i.e. Figures 3.3(b) and 3.3(c)), at low τ , the capacity in theunregulated two service class scenario coincides with capacity under regulation since theregulation is not binding. Whenever the regulation is not binding, any restriction on x also
38

0.02 0.04 0.06 0.08 0.1 0.12 0.140.1
0.2
0.3
0.4
0.5
0.6
0.7
0.8
(a) M = 1
0 0.02 0.04 0.06 0.08 0.1 0.12 0.14 0.160.1
0.15
0.2
0.25
0.3
0.35
0.4
0.45
0.5
0.55
0.6
(b) M = 2
0.02 0.04 0.06 0.08 0.1 0.12 0.140
0.05
0.1
0.15
0.2
0.25
0.3
0.35
0.4
0.45
0.5
(c) M = ∞
Figure 3.2. X as a function of Capacity Cost τ . Legend: Fig. 3.1
strictly reduces capacity investment. However, irrespective of whether the regulation is bind-ing or not, the capacity in all two-class scenarios always exceeds the capacity in the singleservice class scenario. Notice that if the ISPs would have chosen x with their capacities�xed at the single service class equilibrium level, our welfare analysis would have been quitedi�erent.
Figures 3.4(b) - 3.4(d) depict respectively the values of user welfare, the existing userwelfare and the percentage of users who lose surplus due to transition from single- to twoservice classes. The values are presented at τ = 0.05 for M = 1, 2, 3, 4,∞. In all these�gures, the last data point depicts the values for the perfectly competitive ISPs.
From Figures 3.4(b) and 3.4(c), both, the user welfare and the welfare of existing single-class users, are increasing with competition. For all two-class scenarios, the user welfare ishigher than for the single service class scenario. Except for the monopolistic ISP, the existinguser welfare is also higher for all two-service class scenarios.
39
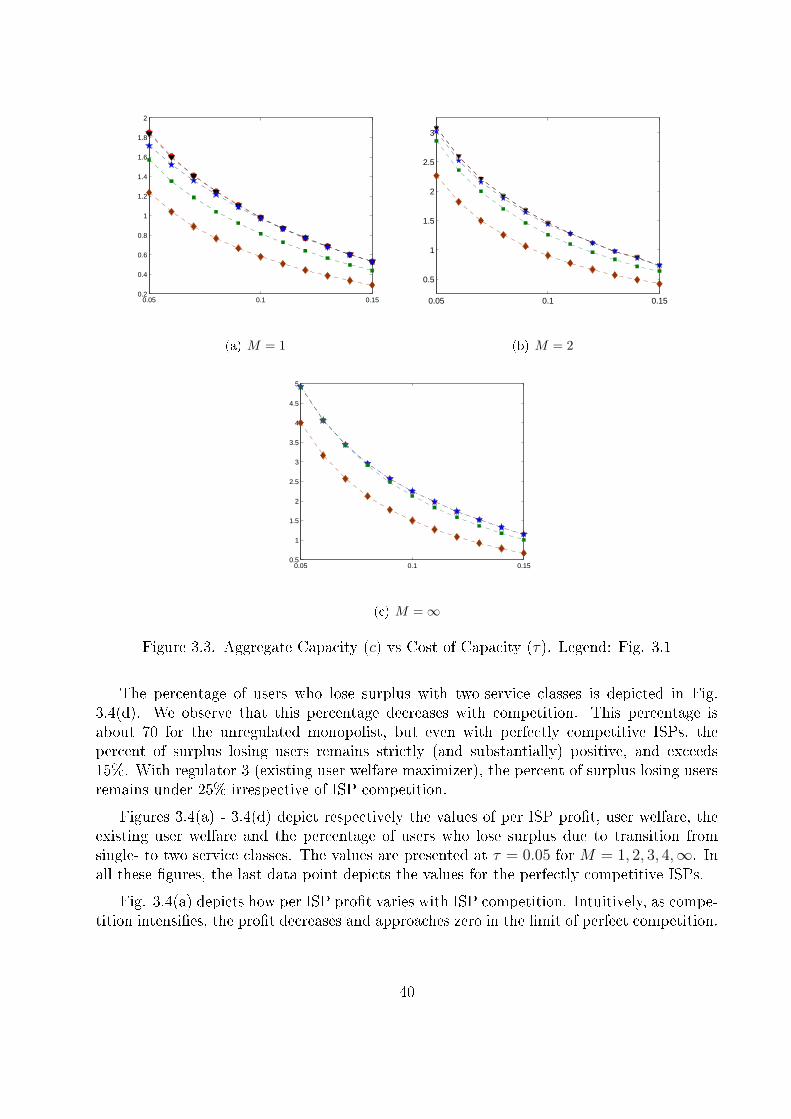
0.05 0.1 0.150.2
0.4
0.6
0.8
1
1.2
1.4
1.6
1.8
2
(a) M = 1
0.05 0.1 0.15
0.5
1
1.5
2
2.5
3
(b) M = 2
0.05 0.1 0.150.5
1
1.5
2
2.5
3
3.5
4
4.5
5
(c) M = ∞
Figure 3.3. Aggregate Capacity (c) vs Cost of Capacity (τ). Legend: Fig. 3.1
The percentage of users who lose surplus with two-service classes is depicted in Fig.3.4(d). We observe that this percentage decreases with competition. This percentage isabout 70 for the unregulated monopolist, but even with perfectly competitive ISPs, thepercent of surplus losing users remains strictly (and substantially) positive, and exceeds15%. With regulator 3 (existing user welfare maximizer), the percent of surplus losing usersremains under 25% irrespective of ISP competition.
Figures 3.4(a) - 3.4(d) depict respectively the values of per ISP pro�t, user welfare, theexisting user welfare and the percentage of users who lose surplus due to transition fromsingle- to two service classes. The values are presented at τ = 0.05 for M = 1, 2, 3, 4,∞. Inall these �gures, the last data point depicts the values for the perfectly competitive ISPs.
Fig. 3.4(a) depicts how per ISP pro�t varies with ISP competition. Intuitively, as compe-tition intensi�es, the pro�t decreases and approaches zero in the limit of perfect competition.
40

1 2 3 4 Infinity0
0.02
0.04
0.06
0.08
0.1
0.12
(a) Pro�t per each ISP
1 2 3 4 Infinity
0.04
0.05
0.06
0.07
0.08
0.09
0.1
(b) User Welfare
1 2 3 4 Infinity0.03
0.04
0.05
0.06
0.07
0.08
0.09
0.1
(c) Existing User Welfare
1 2 3 4 Infinity10
20
30
40
50
60
70
(d) Percent Su�erers
Figure 3.4. Results for various M , with capacity cost �xed at τ = 0.05. Legend: Fig. 3.1
However, under any regulator, for any �nite M , per ISP pro�t with two-service classes ishigher than for a single service class.
From Figures 3.4(b) and 3.4(c), both, the user welfare and the welfare of existing single-class users, are increasing with competition. For all two-class scenarios, the user welfare ishigher than for the single service class scenario. Except for the monopolistic ISP, the existinguser welfare is also higher for all two-service class scenarios.
The percentage of users who lose surplus due to the transition to two-service classes isdepicted in Fig. 3.4(d). We observe that this percentage decreases with competition. Thispercentage is about 70 for the unregulated monopolist, but even with perfectly competitiveISPs, the percent of surplus losing users remains strictly (and substantially) positive, andexceeds 15%. With regulator 3 (existing user welfare maximizer), the percent of surpluslosing users remains under 25% irrespective of ISP competition.
Let us stress that this welfare analysis is carried out at the equilibrium capacity levels
41

in the single and two class scenarios. These capacity levels are markedly di�erent (see Fig.3.3). If we perform the analysis at a �xed capacity, the welfare implications will not be thesame.
0.02 0.04 0.06 0.08 0.1 0.12 0.145
10
15
20
25
30
35
40
45
50
55
Cost of Capacity (τ)
(a) Percent Su�erers Vs τ for M = 1
0.02 0.04 0.06 0.08 0.1 0.12 0.140
5
10
15
20
25
30Percent Suffer
(b) Percent Su�erers Vs τ for M = ∞
Figure 3.5. Percent Users with Surplus Loss in the Long Run. Legend: Fig. 3.1
The Short-Run
Fig. 3.6 depicts the short run choice of x and the resulting percentage of existing userswho lose surplus as a function of the capacity cost τ for M = 1, 2,∞.
From Figures 3.6(a) and 3.6(c), x for the unregulated ISPs becomes lower with capacitycost which is similar to the long run (see Fig. 3.2). In the short run, when the capacitycost τ becomes high, only regulator 1 (social welfare maximizer), divides capacity, that isregulators 2 and 3 choose x = 0. Even when τ in low, and non-zero x becomes optimal forall regulators, for regulators 2 and 3, the short run x is lower than the long run one.
From Figures 3.6(b)and 3.6(d), the percentage of existing single class users who su�er aloss of surplus in the short run (due to the transition to two service classes) is higher thanthat in the long run (see Fig. 3.5) and closely resembles the graph for the choice of x.
Thus, in both cases, short-run and long-run, a substantial fraction of existing Internetusers lose as a result of transition, and the percentage of such surplus losing end-users ishigher in the short-run. Therefore, short-run considerations only exacerbate the politicaleconomic constraints for transition. Indeed, from our results, in the short-run, in aggregate,the existing end-user welfare gains from transition are lower, and their losses are higherthat in the long run. To ease this socially desirable transition to multiple service classes,regulatory intervention could be recommended.
42
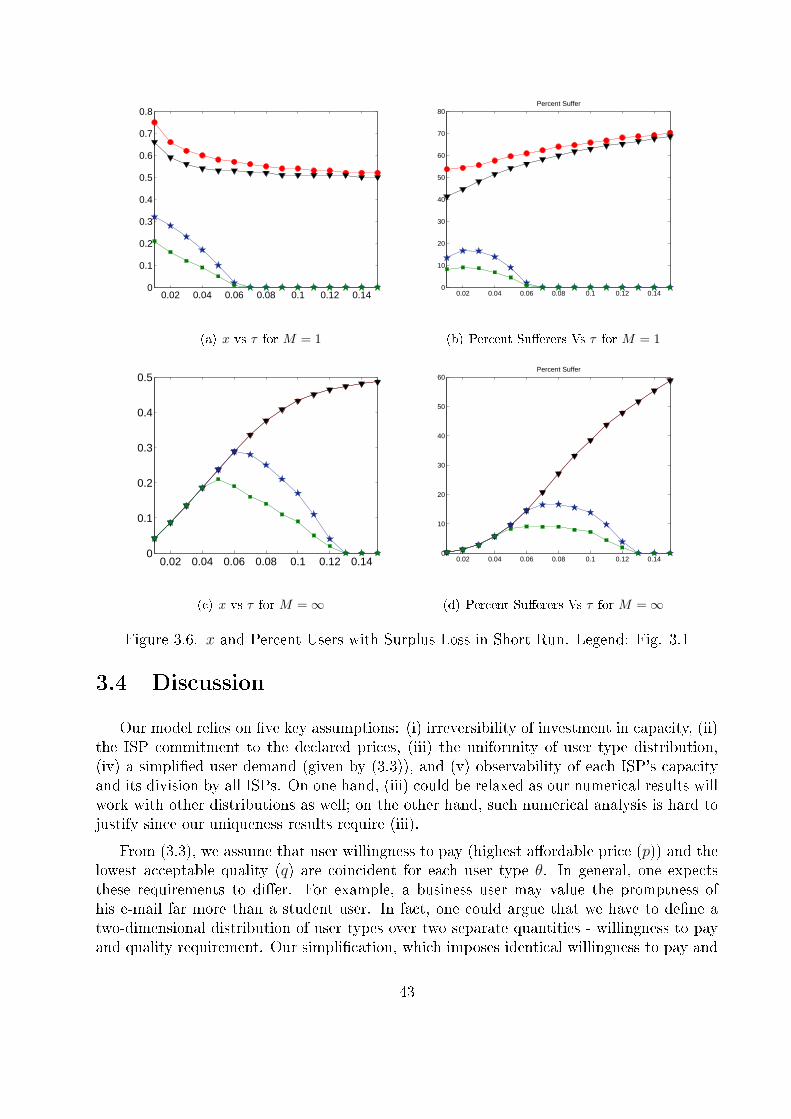
0.02 0.04 0.06 0.08 0.1 0.12 0.140
0.1
0.2
0.3
0.4
0.5
0.6
0.7
0.8
(a) x vs τ for M = 1
0.02 0.04 0.06 0.08 0.1 0.12 0.140
10
20
30
40
50
60
70
80Percent Suffer
(b) Percent Su�erers Vs τ for M = 1
0.02 0.04 0.06 0.08 0.1 0.12 0.140
0.1
0.2
0.3
0.4
0.5
(c) x vs τ for M = ∞
0.02 0.04 0.06 0.08 0.1 0.12 0.140
10
20
30
40
50
60Percent Suffer
(d) Percent Su�erers Vs τ for M = ∞
Figure 3.6. x and Percent Users with Surplus Loss in Short Run. Legend: Fig. 3.1
3.4 DiscussionOur model relies on �ve key assumptions: (i) irreversibility of investment in capacity, (ii)
the ISP commitment to the declared prices, (iii) the uniformity of user type distribution,(iv) a simpli�ed user demand (given by (3.3)), and (v) observability of each ISP's capacityand its division by all ISPs. On one hand, (iii) could be relaxed as our numerical results willwork with other distributions as well; on the other hand, such numerical analysis is hard tojustify since our uniqueness results require (iii).
From (3.3), we assume that user willingness to pay (highest a�ordable price (p)) and thelowest acceptable quality (q) are coincident for each user type θ. In general, one expectsthese requirements to di�er. For example, a business user may value the promptness ofhis e-mail far more than a student user. In fact, one could argue that we have to de�ne atwo-dimensional distribution of user types over two separate quantities - willingness to payand quality requirement. Our simpli�cation, which imposes identical willingness to pay and
43

quality requirements, will be a good description of the case where these distributions arehighly correlated.
We assume that ISP capacity costs are identical but our setting permits to consider ISPswith di�erent costs of capacity. Intuitively, when one of the ISP's capacity cost is higherthan for others, his capacity investment will be lower. Accordingly, he will allocate a lowercapacity fraction to the premium service since the basic service yields higher revenues perunit capacity. Thus, when capacity costs di�er, the resulting capacity investment and itsdivision between service classes will also di�er.
Further, we made another simplifying assumption that the quality observed by the userdepends only on the number of users multiplexed within a given capacity. Though the actualquality observed by the users depends upon the end-to-end variables like delay, jitter, etc.,even if a single ISP divides capacity, users might see an improvement in quality. If, inaddition, all ISPs coordinate the adoption of two service classes, the user will perceive amarked improvement in quality.
Networking researchers agree that end-to-end issues are a major obstacle to QoS. (Theseproblems relate to both strategic issues associated with surplus-sharing (agency type ofcon�ict) and the coordination problem.) Prior research explains the lack of QoS by theimpossibility to price di�erentiated services when ISPs compete. If this were true, coordina-tion would not matter. To the best of our knowledge, the study in this chapter is the �rstsuccessful demonstration of QoS pricing for any provider competition. Thus, this study is anecessary step in investigating the coordination problems. But, coordination between ISPsis outside the scope of this thesis and will be the focus of our future work.
3.5 ConclusionWe make the following three contributions to the literature. First, we develop a model
for social welfare in a network with two service classes. Second, we investigate the politicaleconomic considerations that may constrain the feasibility of adopting the network with QoS.Third, we propose a simple regulatory tool that permits to alleviate the political economicconstraints for the network with two service classes.
Our pricing model is based on the network architecture similar to the Paris Metro pro-posal (PMP) [70]. We extend the model developed in [84] to the case of multiple ISPs.Other closely related papers modeling pricing with PMP network features are [33, 27]. Incontrast to these papers, we demonstrate pricing for the network with two service classesfor any number of competing ISPs. Thus, from our results, ISP competition per se does notpreclude the QoS provision.
Speci�cally, from our analysis, a network with two service classes is socially desirable,but it could be blocked due to unfavorable distributional consequences. In Section 3.3, wedemonstrated that in the absence of regulation and considerable ISP market power (smallM), a sizable fraction of the current network users will experience a surplus loss with two
44

Table 3.1. Table of Notation
Notation Explanation
p Price of single service classpl Price of service lph Price of service h
θ Highest user type adopting the single serviceθ
Lowest user type adopting the single serviceθl Highest user type adopting service lθl Lowest user type adopting service lθh Highest user type adopting service hθh Lowest user type adopting service h
N Total number of users in user baseU User surplus per user in user basec Aggregate capacity per user in user base
cm m-th ISP's capacity per user in user basexm m-th ISP's capacity fraction for service hsm m-th ISP's share of aggregate capacity (cm/c)cmh m-th ISP's capacity for service h (cmxm)
cml m-th ISP's capacity for service l (cm(1− xm))
Rm m-th ISP's revenue per user in user baseΠm m-th ISP's pro�t per user in user base
service classes. Thus, the imposition of regulation, which lowers the fraction of users wholose surplus, improves the feasibility of the two-service class regime.
3.6 Appendix
Proof of Theorem 3.2.1Let users with types θ ∈ (θ
, θ] adopt a service with quality q at the price p. Then, from
(3.4), the user surplus can be written as
U =1
2((θ − p)2 − (θ
− p)2). (3.23)
45
From (3.3), a user with type θ will adopt the access (service) if and only if p < θ ≤ q, whereq = 1 − z/c, with z being the fraction of users who adopt the service. Clearly, the serviceis a�ordable to all users with type θ > p. As more users adopt the service, z increases andq decreases until it becomes equal to the user type at some critical value of θ. Hence, θ
= p
and θ = 1− z/c where z = θ−θ. Then, we have:
θ = 1− θ − θ
c⇐⇒ θ =
c + θ
c + 1=
c + p
c + 1, (3.24)
and θ≤ θ ≤ 1 is clearly true from (3.24). Thus, we have determined a non-empty interval
of user types who will adopt the service priced at p ∈ [0, 1].Since p =θ
, from (3.23), the user surplus can be written as
U =1
2(θ − θ
)2.
Next, we derive the m'th ISP's optimal capacity and price. From (3.24), for a given cand p ∈ [0, 1], the provider revenue Rm is
Rm = smp(θ − θ) =
cm
c
c
1 + cp(1− p) =
cm
1 + cp(1− p).
To �nd the optimal price p, we di�erentiate w.r.t. p, and get p = 1/2. This is the Paretoe�cient equilibrium of the subgame G(c,x) with multiple ISPs. Here, p is independent of c,and thus, for any �xed c, the optimal Rm is
Rm =1
4
cm
(1 + c).
From the ISP objective, the optimal choice of cm† of the m-th ISP given by
cm† = arg maxcm
Πm = arg maxcm
{1
4
cm
1 + c− τcm
}.
Let us express the m-th ISP objective as:
maxcm
cm
4(1 + c−m + cm)− τcm,
wherec−m=
∑
j 6=m
cj and c=∑
j
cj and thus c = c−m + cm.
To �nd cm†, we di�erentiate the expression above w.r.t. cm and equate it to 0 (to obtain them-th ISP FOC):
∂
∂cm
{1
4
cm
1 + c− τcm
}= 0,
1
4
[1
1 + c− cm
(1 + c)2
]= τ,
46

from which for any two ISPs, m1 and m2 we have:
1
4
[1
1 + c− cm1
(1 + c)2
]=
1
4
[1
1 + c− cm2
(1 + c)2
].
Thus, we have cm1 = cm2, that is, in any equilibrium, the ISPs' investments are identical.Thus, we have proven that any equilibrium is symmetric.
Next, we use this to rewrite the FOCs as
1 + (M − 1)cm
(1 + Mcm)2 = 4τ,
which we solve to express equilibrium capacities cm† in the game of M ISPs and capacitycost τ :
cm†(M, τ) =(M − 1) +
√(M − 1)2 + 16τM
8τM2− 1
M. (3.25)
Thus, there exists a unique equilibrium of this game, and aggregate equilibrium capacity c†
is:c†(M, τ) =
(M − 1) +√
(M − 1)2 + 16τM
8τM− 1. (3.26)
In equilibrium, p† = 12and all ISPs invest equality, with ISP equilibrium investments given
by (3.25), and aggregate investment given by (3.26).From (3.26), aggregate capacity increases with M . Since equilibrium price is identical
for all M , and capacity increases with M , number of served users and service quality alsoincrease with M , and Theorem 3.2.1 is proven.
Proof of Theorem 3.2.2We start with the following Lemmas:
Lemma 3.6.1 All users with type θ ∈ (θ l, θl] adopt service l, where θ
l = pl and θl = pl+cl
1+cl.
Proof From (3.3), given a choice between two di�erent a�ordable (θ > p) and acceptable(θ ≤ q) services, a user always chooses a cheaper service. Same as in the single service classcase, for a given price pl and capacity cl, users with type θ ∈ (θ
l, θl] adopt the service l.Introducing a service h priced at ph > pl has no e�ect on the users of service l; no such userswill shift to service h. Hence, from (3.24), we have θ
l = pl and θl = pl+cl
1+cland Lemma 3.6.1
is proven.
Users with type θ ∈ (θh, θh] adopt the service h. From Lemma 3.6.1, any ph > pl does
not a�ect θl and θl. This means that θ
h ≥ θl.
47
Lemma 3.6.2 For any given pl, the ISP's revenue is maximized at ph ≥ θl.
Proof Assume to the contrary that ph < θl. Accordingly,
θh = θl and θh = 1− zh/ch = 1− θh − θ
h
ch
giving θh = θl+c1+c
. Hence zh = ch
1+ch(1 − θl) is independent of ph. Thus, the ISP's revenue
from capacity ch is equal to phzh. Consider p = ph+θl
2. Then, we have: ph < p < θl and thus,
pl < p < θl, implying that zh remains the same. Since p > ph, we have pzh > phzh, whichleads to a higher revenue and contradicts our assumption and concludes the proof of Lemma3.6.2.
Lemma 3.6.3 In the ISP's optimum: θl = θ h = ph.
Proof Formally, assume the contrary, i.e., assume that θh = ph > θl. Let δ > 0 and
ph = θl + δ. Then, the ISP revenue (by summing up the revenues from the two classes) is
R =cl
1 + cl
pl(1− pl) +ch
1 + ch
ph(1− ph)
=clpl(1− pl)
1 + cl
+ch
1 + ch
[cl + pl
1 + cl
+ δ
][1− pl
1 + cl
− δ
]. (3.27)
Maximizing R w.r.t. δ gives an optimal δ∗ = 1−cl−2pl
2(1+cl). Since we assumed δ > 0, we have
δ∗ > 0, thus givingpl <
1− cl
2. (3.28)
We insert δ∗ into (3.27) to obtain
R =cl
1 + cl
pl(1− pl) +ch
1 + ch
[1 + cl
2(1 + cl)
]2
=cl
1 + cl
pl(1− pl) +1
4
ch
1 + ch
,
which is maximized at pl = 1/2. But, this requires −cl > 0, which contradicts (3.28). Thus,the assumption δ > 0 is false and we have ph = θl = θ
h = cl+pl
1+cl, and Lemma 3.6.3 is proven.
From Lemmas 3.6.1 - 3.6.3, we obtain:
θh = θl = ph =
cl + pl
cl + 1and θh =
ch + ph
ch + 1,
where cl and ch are given by (3.8). We can, therefore, express the ISP revenue as
R(c, x, pl) =cl
1 + cl
pl(1− pl) +ch
1 + ch
ph(1− ph)
=(1− pl)
[Apl + chcl
]
B, (3.29)
48

where A = (1+cl)(1+ch)cl+ch and B = (1+cl)2(1+ch). Thus, the ISP revenue maximization
problem can be expressed as an optimization in just one variable pl. Di�erentiating thisexpression for revenue with respect to pl and equating to zero, we get A(1−pl)−(Apl+chcl) =0, which gives us pl as a function of c and x:
pl(c, x) =1
2− chcl
2A=
1
2− chcl
2[(1 + cl)(1 + ch)cl + ch], (3.30)
and Theorem 3.2.2 is proven.
Proof of Corollary 3.2.4Proof From (3.30) we have pl(c, x) < 1
2, and we obtain ph as:
ph(c, x) =pl + cl
1 + cl
=1
2+
[1
2
(1 + ch)c2l
(1 + cl)(1 + ch)cl + ch
].
The expression in the square brackets is obviously positive and hence ph(c, x) > 1/2, andCorollary 3.2.4 is proven.
Proof of Theorem 3.2.5Substituting (3.30) into (3.29), and using cl = (1− x)c and ch = xc, we get
R(c, x) =((1 + xc)(1− x) + x)2c
4[(1 + (1− x)c)(1 + xc)(1− x) + x](1 + xc). (3.31)
To prove the theorem, we show that R(c, x) is maximized at a unique x. Since R(c, x) isdi�erentiable w.r.t. x, it is su�cient to prove that ∂R(c,x)
∂x= 0 at a single interior x and this
point is a maximum. Let
B = ((1 + xc)(1− x) + x)2c = (1 + xc− x2c)2c
and let
D = 4[(1 + (1− x)c)(1 + xc)(1− x) + x](1 + xc)
= 4[1 + c + x(1− x)(2− x)c2 + x2(1− x)2c3]
Now, R(c, x) = B/D and hence, di�erentiating w.r.t. x gives
∂R(c, x)
∂x=
D ∂B∂x−B ∂D
∂x
D2,
49

where the denominator is always positive. Hence, we focus on the numerator D ∂B∂x− B ∂D
∂x
only. We �nd∂B
∂x= 2(1 + xc− x2c)(1− 2x)c2 (3.32)
and∂D
∂x= 4[(2− 6x + 3x2)c2 + 2x(1− x)(1− 2x)c3]. (3.33)
From (3.32) and (3.33), after simplifying, we have
D∂B
∂x−B
∂D
∂x= 4(1 + xc− x2c)c2[2− 4x + (2x− 3x2)c + x3(1− x)c2]. (3.34)
Note that ∀x ∈ [0, 1],∀c > 0, we have 4(1 + xc − x2c)c2 > 0. Hence, this term does notcontribute any zeroes. Hence, if the second term (say ζ(x)) has a single zero in [0,1] and isstrictly positive in a small interval close to 0, then ∂R(c,x)
∂xhas a unique maximum in [0, 1].
ζ(x) = 2− 4x + (2x− 3x2)c + x3(1− x)c2
= 2 + (2c− 4)x− 3cx2 + c2x3 − c2x4.
It is clear that ζ(0) = 2 > 0. Next, we show that ζ(x) has a single zero in [0,1]. ζ(x) is afourth order equation in x with ζ(0) > 0 and ζ(1) = −2− 2c < 0. Hence, ζ(x) either has 1root or 3 roots in [0,1]. Now,
ζ′(x) = 2c− 4− 6cx + 3c2x2 − 4c2x3; (3.35)
ζ′′(x) = −6c + 6c2x− 12c2x2. (3.36)
For ζ(x) to have 3 roots in [0,1], ζ′(x) must have at least 2 roots and ζ
′′(x) must have at
least 1.Case 1: 0 < c < 8
ζ′′(x) = −6c + 6c2x − 12c2x2 = −6c + 6c2x(1 − 2x) ≤ −6c + 6c2/8 = 6c(c/8 − 1). For
0 < c < 8, 6c(c/8− 1) < 0 giving us ζ′′(x) < 0 ∀x ∈ [0, 1]. Hence, for c < 8, ζ(x) has exactly
one root in [0,1], by the strict concavity of ζ(x).Case 2: c ≥ 8
From case 1, we can rewrite ζ′′(x) as ζ
′′(x) = −6c+6c2x(1−2x). For x ∈ [1/2, 1], ζ
′′(x) < 0.
Further, ζ(1/2) = c/4+c2/16 > 0 and ζ(1) = −2−2c < 0 which implies that there is exactlyone root in [1/2,1] by the strict concavity of ζ(x).
Next, we need to show that there are no roots of ζ(x) in [0,1/2]. We will prove this byshowing that ζ
′(x) ≥ 0 in [0,1/2], i.e., ζ(x) is non-decreasing in [0,1/2]. Since ζ(0) = 2 > 0,
this implies ζ(x) > 0 ∀x in [0,1/2], and hence it cannot have any roots in [0,1/2].� Consider the interval [0,1/4].
Since 6c2x(1 − 2x) > 0, ζ′′(x) > −6c in [0,1/4]. Hence, the fastest rate at which ζ
′(x)
decreases is −6c anywhere in this interval. We know that ζ′(0) = 2c − 4 > 0 for c ≥ 8.
Hence ∀x ∈ [0, 1/4],ζ′(x) ≥ ζ
′(0)− 1/4× 6c = 2c− 4− 6c/4 = c/2− 4 ≥ 0
for c ≥ 8.
50

� Consider the interval [1/4,1/2].Since ζ
′′(x) = −6c + 6c2x(1− 2x), there is exactly one root of ζ
′′(x) in [1/4,1/2]. (The two
roots are 14±√
1− 8c
4.) Now, ζ
′′(1/4) = −6c + 6c2/8 ≥ 0 and ζ
′′(1/2) = −6c < 0 for c ≥ 8
which means that ζ′(x) �rst increases and then decreases in [1/4,1/2].
ζ′(1/4) = 2c− 4− 6c/4 + 3c2/42 − 4c2/43 = c/2− 4 + c2/8 ≥ 0 and
ζ′(1/2) = 2c − 4 − 6c/2 + 3c2/22 − 4c2/23 = −c − 4 + c2/4 > 0 for c ≥ 8. Hence, though
ζ′(x) decreases in some interval in [1/4,1/2], it never goes to 0, giving us the required result
that ∀x ∈ [1/4, 1/2], ζ′(x) ≥ 0.
Corollary 1: The monopoly pro�ts increase monotonously for x < x(c, 1). Proofζ(x) is non-decreasing in [0,1/2] (since ζ
′(x) ≥ 0 for x ∈ [0, 1/2]). Combining with ζ(0) > 0,
we have ζ(x) > 0 for x < x(c, 1). This implies that ∂R(c,x)∂x
> 0 for x < x(c, 1), which givesus our result.
Corollary 2: For any �xed c, the monopolist chooses
x(c, 1) > 1/2. (3.37)
Proof ζ(1/2) = c/4 + c2/16 > 0 and ζ(1) = −2− 2c < 0 which implies there is at least oneroot in (1/2,1). From Theorem 3.2.5, we know that the root in [0,1] is unique. Hence, thisroot must lie between 1/2 and 1. Thus, ∂R(c,x)
∂x= 0 for a unique x ∈ (1/2, 1), giving us our
desired result.
Proof of Theorem 3.2.6Let cm be sunk, and consider the m-th ISP's choice of xm. In optimum:
dRm
dxm= 0 or dRm
l
dxm= − Rm
h
dxm.
Since, under perfect competition, each ISP is too small to a�ect aggregate capacity division(cl and ch) and prices (pl and ph) we obtain:
pl(1− pl)
1 + cl
dcml
dxm= −ph(1− ph)
1 + ch
dcmh
dxm
and using cmh = xmcm and cm
l = (1− xm)cm we have:
pl(1− pl)
1 + cl
=ph(1− ph)
1 + ch
.
That is, for any ISP, average return on investment is equal in both service classes:
Rl
cl
=Rh
ch
, (3.38)
51
where the subscript m is dropped to simplify. Since under perfect competition each ISPpro�t is zero:
Π = Rl + Rh − τ(cl + ch) = 0,
we combine with (3.38), which gives us zero pro�t in each service class, from which
Πi =Ri
ci
− τ = 0,
i.e., Ri
ci
=1
1 + ci
pi(1− pi) = τ. (3.39)
Using the result of Theorem 3.2.2 that ph(c, x) = cl+pl(c,x)1+cl
(equation (3.17)) we infer
1
1 + cl
pl(1− pl) =1
1 + ch
(pl + cl)
1 + cl
(1− pl)
1 + cl
,
i.e., (1 + cl)(1 + ch)pl = (pl + cl),
which, for any c, givespl(c, x) =
1− x
1 + (1− x)xc, (3.40)
and we substitute this into (3.39):
1
1 + cl
pl(1− pl) = τ
to obtain the equation connecting c, x and τ :
(1− x)x = τ [1 + (1− x)xc]2 . (3.41)
Next, we use (3.40) and equate it with (3.17) for the equilibrium price in a general case (forany M), to obtain the relation between c and x:
pl = 1/2− clch
2 [(1 + cl)(1 + ch)cl + ch]=
1− x
1 + (1− x)xc,
and collecting all the terms we have:
(1− 2x)(1 + (1− x)c)− (1− x)2x2c2(1 + (1− x)c) = 0.
We divide by 1 + (1− x)c (which must be positive) and obtain the expression for c in termsof x:
(1− 2x)− (1− x)2x2c2 = 0,
c =2√
1− 2x
x(1− x). (3.42)
From (3.42), we see that x ∈ (0, 1/2). For x ∈ (0, 1/2), the numerator in the RHS of (3.42)strictly decreases while the denominator strictly increases. This implies that c is strictlydecreasing for x ∈ (0, 1/2) and takes all values between 0 and ∞. Hence, one can de�ne
52

an inverse function for x as a function of c ∈ (0,∞). Thus, we shown that, with perfectcompetition, for all c > 0, there exists a unique x in the equilibrium of the game G(c) and
x(c,∞) < 1/2. (3.43)
Substituting (3.42) into (3.41), we get:
(1− x)x = τ[1 + 2
√1− 2x
]2,
which permits only a unique x ∈ (0, 1/2) for any τ. We solve this equation numerically toobtain this unique x.
Proof of Theorem 3.2.7Under the assumption of symmetry, we show that there exists a unique optimal x =
x(c,M) at which the ISPs reach maximum pro�t sustainable in the equilibrium of our gameG(c). x ∈ (x(c,∞), x(c, 1)), where x(c,∞) and x(c, 1) are the equilibrium x in the gameG(c) under perfect competition and a monopolist respectively. From (3.37) and (3.43), theinterval (x(c,∞), x(c, 1)) is non-empty, and from Theorems 3.2.5 and 3.2.6, the fractionsx(c, 1) and x(c,∞) are unique. Consider the subgame in which the ISPs have already sunktheir investments and aggregate capacity is �xed at c.
To sum the proof, we evaluate dRm
dxm at x = x(c,∞), and show it is positive:
dRm
dxm
∣∣∣∣x(c,∞)
> 0, (3.44)
from which we will have x > x(c,∞). Next, we evaluate dRm
dxm at x = x(c, 1) and show it isnegative:
dRm
dxm
∣∣∣∣x(c,1)
< 0, (3.45)
from which we have x < x(c, 1).
Rm = (1− xm)cm pl(1− pl)
1 + cl
+ xmcm ph(1− ph)
1 + ch
.
We notice that for any f(cl, ch)
df(cl, ch)
dxm=
1
M
df(cl, ch)
dx,
from which, for i = l, h,
d
dxm
pi(1− pi)
1 + ci
=1
M
d
dx
{pi(1− pi)
1 + ci
}. (3.46)
53

We di�erentiate Rm with respect to xm to obtain:
dRm
dxm=
c
M[fh− fl] +
c
M
[(1− x)
d {fl}dxm
+ xd {fh}dxm
], (3.47)
where fh =ph(1− ph)
1 + ch
and fl =pl(1− pl)
1 + cl
,
and we use the fact that in a symmetric equilibrium cm = cM.
We use (3.46) to infer:
dRm
dxm=
c
M
([fh− fl] +
1
M
[(1− x)
d {fl}dxm
+ xd {fh}dxm
]). (3.48)
When M = 1, the FOC is:
dR
dx
∣∣∣∣x(c,1)
= c [fh− fl] + c
[(1− x)
d {fl}dxm
+ xd {fh}dxm
]= 0, (3.49)
and we have proven in Theorem 3.2.5 that
dR
dx
∣∣∣∣x<x(c,1)
> 0. (3.50)
For perfect competition (M →∞), the term inside the second square bracket of (3.48) couldbe ignored, which gives the FOC:
dRm
dxm
∣∣∣∣x(c,∞)
= [fh− fl] = 0. (3.51)
Since x(c,∞) is unique, for M →∞, for the m-th ISP, dRm
dxm
∣∣x>x(c,∞)
< 0. Thus,
dRm
dxm
∣∣∣∣x>x(c,∞)
= [fh− fl] < 0. (3.52)
From (3.49), (3.50) and (3.51), at x = x(c,∞), we infer that
dR
dx
∣∣∣∣x(c,∞)
=
[(1− x)
d
dx{fl}+ x
d
dx{fh}
]> 0.
Hence, the term inside the second square bracket in (3.47) is positive for any �nite M too.Thus, for any �nite M > 1, (3.44) is proven.
Next, from (3.49), we have dRdx
∣∣x=x(c,1)
= 0 for a monopolist. From (3.52), the �rst squarebracket in (3.49) is negative, which implies that the second square bracket is positive, givingus: [
(1− x)d {fl}dxm
+ xd {fh}dxm
]∣∣∣∣x(c,1)
= − [fh− fl]|x(c,1) > 0.
54

Thus, for any �nite M, the terms inside the square brackets in (3.47) are equal and oppositein sign. However, the positive term inside the second square bracket is multiplied by 1/M ,making the positive component lower than the negative component for M > 1, which endsthe proof for (3.45).
Therefore, from continuity of the underlying functions in the m-th ISP's FOC wrt xm,for any �nite M > 1, we infer
dRm
dxm
∣∣∣∣x=x
= 0, where x ∈ (x(c,∞), x(c, 1)).
From Theorem 3.2.5, aggregate ISP pro�t (and thus, due to symmetry, each ISP pro�t)increases with x. This gives us a unique x at which pro�t is maximal for a �xed c. Thus,the symmetric Pareto e�cient equilibrium in the game of M competing ISPs is unique, andTheorem 3.2.7 is proven.
55

Chapter 4
Missing Market - Security Insurance
Today, the Internet serves as the primary communication platform for both individu-als and businesses. At present, due to the nearly universal connectivity, a huge amount ofwealth is accessible online and the Internet has become a preferred destination for crim-inals. However, the Internet, which was originally conceived to be an academic network,has failed to address many of these security problems. Due to the ease of accessibility andprogrammability, unwary end users' computers are routinely infected with malware. Theseinfected computers could be employed for future crimes, resulting in an interdependent se-curity environment.
Technology-based defense and enforcement solutions are available, but a consensus amongsecurity researchers [7] is that the existing security problems cannot be solved by technologi-cal means alone. Indeed, these security problems primarily result from misaligned incentivesof the networked parties with respect to their security. Users under-invest in security sincethey do not bear the true societal costs of their actions, which causes a negative externality.
Existing research [13, 34, 67, 91, 81, 15] indicates that risk management in general andcyber-insurance in particular are potentially valuable tools for security management. Thischapter focuses on the e�ects of cyber-insurers on network security and user welfare, ina general setting with interdependent security and asymmetric information between usersand insurers. We believe that these features of the environment induce socially suboptimalnetwork security, and complicate the management of security risks.
In our model, all users are identical. Their wealth is identical and they su�er identicaldamage if cyber-attack on them is successful. The user's probability of being attackeddepends on both the user security level and the network security level, which individualusers take as given. Thus, there is an externality causing individually optimal user securitylevel to be lower than the socially optimal one.
First, we investigate the e�ects of information asymmetry in the setting with interde-pendent security. Though our model allows to study both moral hazard (when insurers are
56

not aware of user security levels) and adverse selection (when insurers cannot distinguishdi�erent user types), in this chapter, we address only moral hazard (see [83] for analysis ofadverse selection). We �nd that cyber-insurance fails to improve the network security levelthough it may improve user utility, if an equilibrium exists. Second, we assume no infor-mation asymmetry between the insurers and the users. We demonstrate that user utilityis higher with insurance, but surprisingly, even in this case, the network security level isnot necessarily higher. On reverse, for a substantial range of parameters, network securityworsens with insurers.
Our assumption of identical users is simplistic, and does not hold in the actual Internet.But, we argue that adding user and insurer heterogeneity to our setting only increasesinformational asymmetries. If insurers could separate users of di�erent types, our resultshold for every class of user types in such a heterogeneous environment. If insurers areunable to distinguish between users with di�erent types, the problem of adverse selectionarises due to which missing markets are likely, as [76] demonstrate. Finally, the presence ofdi�erent insurer types also brings the �lemon problem� [5], another manifestation of adverseselection, which also lead to missing markets. Hence, our results will continue to hold in aheterogeneous environment as well.1
The chapter is organized as follows. In Section 4.1, we describe the related work. InSection 4.2, we propose and analyze the base model. In Section 4.3, we add competitiveinsurers to our base model, and consider two cases: with non-contractible individual securitylevels, and with required individual security level included into user's insurance contract. InSection 4.4, we discuss the intuition behind our results. In Section 4.5, summarize our�ndings and conclude. The technical details are relegated to Appendix.
4.1 Related WorkCyber-insurance is complicated by the speci�c environment of the Internet, with cor-
relation and interdependence being the two major factors precluding its existence. E�ectsof correlated risks on cyber-insurance were considered by [13, 12]. The presence of an OSmonoculture in the Internet causes cyber-attacks which impose correlated damages on Inter-net systems. Such correlated damages result in higher insurance premiums, making cyber-insurance unviable for most institutions.
Bohme (2005) [13] derives the conditions under which the cyber coverage is viable despitethe monoculture of installed platforms. Speci�cally, he �nds that a potential market existswhen clients are highly risk averse, and loss probability is huge. Bohme and Kataria (2006)[12] introduce two tiers of cyber risk correlations. First, the internal correlation, the correla-tion of cyber risks within a �rm (i.e., a correlated failure of multiple systems on the internalnetwork), and second, the global correlation � correlation in risk at a global level, that iscorrelation in the insurer's portfolio. They demonstrate that the conditions for existence ofa cyber insurance market are high internal and low global risk correlation.
1See [83] where we extend our model to address moral hazard.
57

In this chapter, we focus on interdependent security. We build on the seminal ideasabout the role of information in insurance markets [76],2 which we combine with the ideasof interdependent security originated by [57, 35, 40].3 Although security interdependence ispresent in other contexts (such as terrorist attacks [58]), network security is especially proneto these e�ects because many millions of users are interlinked. Previous work dealing withinterdependent security include [72, 45, 63].
Ogut et.al. (2005) [72] provide a comprehensive analysis of e�ects of cyber insuranceon incentives for IT security investment in the presence of interdependent risks, but assumeno information asymmetry between the insurers and the insured. They demonstrate thatwith interdependent risks, security investments are lower than when no interdependence ispresent. They suggest that, with a high degree of interdependence, even with increasedcompetition in the insurance market, prices may not necessarily fall � because �rms useinsurance rather than investment to manage security risks. The main di�erence of our studyis that we address the question of information asymmetry between the insurers and insuredand calculate the premiums for perfectly competitive insurance market in the presence ofmoral hazard.
Hofmann (2005) [45] considers interdependent security, with a continuum of heteroge-neous agents, who di�er in their cost of security investment (prevention cost), which a�ectsthe probability of loss. If an agent invests in prevention, he reduces own loss (direct loss),but the indirect loss caused by interdependence with other networked agents remains. Inno-insurance equilibrium, the agents with low costs of prevention invest while those withhigh cost of prevention do not. Lelarge-Bolot (2009) [63] also use a model similar to [45].This setting is markedly di�erent from ours. Their user choice is binary � users either self-protect or not, but users di�er in their costs of self-protection. In our model, though ourusers have an identical cost function, they choose the amount of investment and the degreeof self-protection.
Hofmann's paper is somewhat di�erent from other papers on cyber insurance, because(as far as we are aware) this study is unique by considering such a strong tool as compulsorycyber insurance. The chapter demonstrates that, even with compulsory insurance, compet-itive insurers cannot achieve socially optimal prevention level. Hofmann proves that socialoptimum can be achieved by a monopolist insurer who engages in premium discriminationand acts "like a social planner". However, unlike our study, she does not directly tacklemoral hazard because she assumes that the insurer can perfectly observe whether a userinvests in protection. Lelarge-Bolot (2009) consider only the contracts with full coverage.This makes it hard to address moral hazard, and they admit to leave the design of goodincentives with moral hazard for future research. In our chapter, we address this question ofmoral hazard and derive the level of coverage o�ered in equilibrium.
2See [94] for the literature review.3See also [34, 36, 97, 72, 10, 31, 47, 45, 63, 75]. This list is by no means exhaustive. See [14]
58
4.2 ModelWe consider a network populated by N homogeneous (i.e., identical) users, each of whom
possesses a wealth W > 0. In the absence of network security problems, user i utility Ui is:Ui = f(W ),
where the function f is increasing and concave (f ′ > 0, and f ′′ ≤ 0), re�ecting that userwealth W has a positive but decreasing marginal bene�t for the user.
In the presence of network security problems, we assume that a user i incurs a monetarydamage D ∈ (0,W ) when he is successfully attacked, and we let pi denote the probabilityof successful attack. We assume that the probability pi depends on two factors: the securitylevel si ∈ [0, 1] chosen by user i and the network security level s ∈ [0, 1], which dependson the security choices of all network users. We de�ne the network security level s as theaverage security level in the network:
s =1
N
∑i=1,...N
si.
Further, we assume N to be large, i.e., each user has a negligible e�ect on s and takes thenetwork security level as given. Then, we de�ne the probability pi of a successful attack onuser i as
pi = (1− si)(1− s),
where the second term (1− s) can be viewed as the probability of an attack in the networkand the �rst term (1− si) can be viewed as the probability of success of such an attack onuser i.
We assume that, for any user i, achieving individual security si entails a cost h(si). Welet h be an increasing convex function (h′, h′′ ≥ 0), with h(0) = 0 representing a completelyinsecure user and h(1) = ∞ characterizing the costs required to maintain a �perfectly secure�system. The intuition is that user security costs increase with security, and that improvingsecurity level imposes an increasing marginal cost on the user. Additionally, for expositionalconvenience, we impose h′(0) = 0, to ensure positive user investments si > 0. We assumethat the user cannot modify his D by changing his investment h, i.e., users do not self-insuretheir damages. For e.g., users may backup their data to prevent loss of information. Suchself-insurance does not have an externality e�ect on other users since the advantages of thatinvestment are observed by the user alone [36]. One can also view our D as the residualdamages after self-insurance.
Thus, the expected user utility can be expressed asUi = (1− pi) · f(W ) + pi · f(W −D)− h(si). (4.1)
To simplify the exposition, we introduce the vulnerability of player i, vi = 1 − si and thenetwork vulnerability level v = 1− s. Then, the expected utility of user i is:
Ui = (1− viv) · f(W ) + viv · f(W −D)− g(vi), (4.2)where g(vi) = h(1−vi). This gives us: g′ ≤ 0, g′′ ≥ 0, and g(1) = 0, g′(1) = 0 and g(0) = ∞.
59

4.2.1 Social Optimum
We de�ne the social optimum as a level at which aggregate user utility is maximized. InAppendix, we show that the socially optimal security level is identical for all users: vi = v.Then, v = v, and from (4.2), we have:
U soc = (1− v2) · f(W ) + v2 · f(W −D)− g(v). (4.3)In any social optimum, ∂Usoc
∂v= 0, from which we have:
2vsoc [f(W )− f(W −D)] = −g′(vsoc), (4.4)and since ∂2Usoc
∂v2 < 0, the socially optimal vulnerability level is unique.
4.2.2 Nash Equilibrium
We assume that all parameters are known to users. As discussed above, a user takesthe network vulnerability v as given and chooses his vulnerability vi to maximize his utilitygiven by (4.2). Taking the partial derivative of (4.2) with respect to vi, and equating to zero,∂Ui
∂vi= 0, we obtain:
v [f(W )− f(W −D)] = −g′(vi). (4.5)From the properties of the function g, the solution of equation (4.5) is unique, from whichvulnerability choice is identical for all users. Hence, in equilibrium, all users have identicalsecurity (vulnerability) level, which we denote by v∗. Then, v = v∗ and the following holds:
v∗ [f(W )− f(W −D)] = −g′(v∗). (4.6)As in the case of social optimum, equilibrium vulnerability level is unique. Thus, in equi-librium, user security investments are identical and positive. Optimal investment increaseswhen the damage D increases relative to wealth W . From (4.2) and (4.6), the equilibriumexpected utility is:
U∗ = f(W ) + v∗g′(v∗)− g(v∗). (4.7)
Comparing (4.4) and (4.6), we observe that since the LHS in (4.4) grows twice as fast asin (4.6) (see Fig. 4.1), we must have the following proposition:
Proposition 4.2.1 Individually optimal user security is strictly positive, and it is strictly
lower than the socially optimal one (vsoc < v∗ or ssoc > s∗).
The expected per user loss due to network insecurity is:(v∗)2D,
which is higher than the expected per user loss in the social optimum: (vsoc)2D. Thus, inour model, users under-invest in security relative to a socially optimal level and this negativeexternality results in higher losses to society. In the next section, we will add competitivecyber-insurers to our base model and study how the presence of cyber-insurer a�ects networksecurity.
60

soc
Figure 4.1. Nash Equilibrium Vs Social Optimum
4.3 InsuranceEquilibrium is de�ned in a way similar to [76], where insurance equilibrium is examined
in the markets with adverse selection. Each insurer o�ers a single insurance contract in aclass of admissible contracts, or does nothing. A Nash equilibrium is de�ned as a set ofadmissible contracts such that: i) all contracts o�ered at least break even; ii) taking as giventhe contracts o�ered by incumbent insurers (those o�ering contracts) there is no additionalcontract which an entrant-insurer (one not o�ering a contract) can o�er and make a strictlypositive pro�t; and iii) taking as given the set of contracts o�ered by other incumbentinsurers, no incumbent can increase its pro�ts by altering his o�ered contract.
The literature referred to such contracts as �competitive,� because entry and exit arefree, and because no barrier to entry or scale economies are present. Thus, we will considerinsurance �rms (insurers), who are risk neutral and compete with each other. In addition tothese equilibrium conditions, we assume that individual insurers cannot a�ect the networkvulnerability, and thus, take it as given.
Let ρ be the premium charged to a user and L be the amount of loss covered by theinsurer. Let user vulnerability be v and network vulnerability be v. The user pays thepremium both when he is attacked and when he is not, but is covered a loss L when theattack occurs successfully. Thus, with probability vv, the user is successfully attacked andreceives utility
[f(W −D + L− ρ)− g(v)
]and with probability (1− vv), he obtains utility[
f(W − ρ)− g(v)]. Denoting U(v, v, ρ, L) as the corresponding expected user utility,
U(v, v, ρ, L) = (1− vv) · f(W ) + vv · f(W − D)− g(v), (4.8)
whereW = W − ρ and D = D − L.
The utility in (4.8) coincides with the no-insurance case if ρ = 0, L = 0. When v is identicalfor all users, we have v = v, and:
U(v, v, ρ, L) = (1− v2) · f(W ) + v2 · f(W − D)− g(v). (4.9)
61

4.3.1 Non-contractible User Security
In this subsection, we assume that insurers do not know, and have no control over usersecurity level. This occurs when it is impossible (too costly) for the insurers to monitor theusers' vulnerability v. Hence, the contract o�ered by an insurer will be of the form (ρ, L), i.e.,the insurer sets the premium and the amount of coverage, and stipulates that no additionalcoverage can be purchased.
Note that the user is free to choose his required vulnerability here. Hence, users willchoose the vulnerability level to maximize their utility, given the network security level.Thus, in the presence of competitive insurers, users choose which contract to buy, if any,and the corresponding vulnerability that maximizes their utility. In equilibrium, no userwishes to deviate from his equilibrium contract to any other contract or to not buying anyinsurance. We denote the equilibrium values in this non-contractible security case by thesuperscript †.
Social Planner
We assume that the social planner's objective is to maximize aggregate user utility withthe constraint that the equilibrium contracts must not be loss-making. When social plannero�ers some contract(s), the users optimal choices could be described as if they play a gameas in Section 4.2.2, but with wealth W = W − ρ and damage D = D − L. In Appendix, weshow that a social planner will o�er a single contract (ρ, L) only. Then, user optimal choiceis given by (4.6):
v†soc[f(W )− f(W − D)
]= −g′(v†soc). (4.10)
To maximize aggregate user utility, the social planner's contract must solve the followingoptimization problem:
maxρ,L
U(v†soc, v†soc, ρ, L),
subject to (4.10) and budget constraint ρ − (v†soc)2L ≥ 0. In Appendix, we show that allusers buy this insurance. No user deviates to not buying, when other users have bought theinsurance.
With the insurance provided by a social planner, user utility is higher, but, the vulnera-bility v†soc is also higher than in the no-insurance Nash equilibrium:
v†soc > v∗. (4.11)
Competitive Insurance
Insurers o�er contracts (ρ, L), and users maximize their utility by choosing the contractsand a corresponding preferred security levels, given the network security. In Appendix, weshow that in any equilibrium, the following proposition holds:
62

Proposition 4.3.1 With competitive insurers present, and non-contractible user security,
in equilibrium, the security is always worse than the security in the no-insurance Nash equi-
librium (v† > v∗ or s† < s∗).
Thus, we demonstrated that although insurers may allow users to reach a higher utility,the network security is strictly lower with insurers. The favorable e�ect of insurers on userutility is not free of cost for the society. The presence of insurers negatively impacts networksecurity level, which increase the losses from network insecurity. Expected per user loss dueto the insurers' presence increases relative to the no-insurance Nash equilibrium by ∆† givenby:
∆† =[(v†)2 − (v∗)2
]D.
This is what one expects when insurers cannot monitor user security level. Since user riskis covered, users tend to under-invest in security. Next, we study the case where the insurerhas perfect information about, and can perfectly enforce the security of his insured users.
4.3.2 Contractible User Security
Here, we assume that the insurers can monitor their insured users' vulnerability v at zerocost. Thus, we permit the contracts that specify user's required v. Let (v, ρ, L) be a contractthat sets the premium ρ, the coverage L, and requires user vulnerability to be at most v. Wedenote the equilibrium values in this contractible security case by the superscript ‡.
Social Planner
We assume that the social planner's objective is to maximize aggregate user utility withthe constraint that the equilibrium contracts must not be loss-making. In Appendix, wedemonstrate that the social planner o�ers a single contract (v, ρ, L) only. Thus, v = v, andto maximize total utility, the contract o�ered by the social planner must be a solution tothe following optimization problem:
maxv,ρ,L
U(v, v, ρ, L), s.t. v2L ≤ ρ.
In Appendix, we show that the solution (v‡soc, ρ‡soc, L‡soc) is unique and satis�es:
(v‡soc)2L‡soc = ρ‡soc
L‡soc = D
2v‡socDf ′(W − (v‡soc)2D) = −g′(v‡soc). (4.12)
Thus, the optimal contract makes no pro�t and o�ers full coverage. The social planner choicev‡soc is given by (4.12).
63

Competitive Insurance
In this case, insurers o�er contracts (v, ρ, L). In equilibrium, if the network vulnerabilityis v, then all equilibrium contracts must yield equal utility U(v, v, ρ, L) for the user. Ifthere exists a contract (v, ρ, L) that an insurer can o�er and improve this user utility, it ispreferred by the users and users will deviate and buy that contract. Hence, in equilibrium,the contracts chosen by the insurers must maximize U(v, v, ρ, L). In Appendix, we prove thefollowing proposition:
Proposition 4.3.2 With competitive insurers present, and security level contractible, in
equilibrium, pro�ts are zero (v‡2L‡ = ρ‡), and full coverage is o�ered (L‡ = D). The
equilibrium contract is unique and in this equilibrium, the security is always worse than what
will be chosen with a socially optimum insurance (v‡ > v‡soc). Also, compared to the no-
insurance equilibrium, security is worse (v‡ > v∗) except when the damage D is a small
fraction of the wealth W . Users are strictly better o� with insurers than when no insurers
are present (U ‡ > U∗).
When security level is observable by the insurers, insurer presence allows to improve userwelfare, but not necessarily the network security. Unless the damage is a small fraction ofthe wealth, with cyber-insurance, expected per user loss from network insecurity increasescompared to the no-insurance Nash equilibrium by ∆‡, where:
∆‡ =[(v‡)2 − (v∗)2
]D.
Thus, for a signi�cant range of parameters, the losses to society may increase when insuranceis available.
4.4 DiscussionOur basic model captures the e�ects of interdependent security on network security. It
highlights the incentive misalignment for end-user security investments, and captures a wellknown gap between individually and socially optimal user incentives for security (free-ridinge�ect). We use this model to investigate the e�ects of the presence of competitive cyber-insurance on user utility and network security level.
We consider competitive cyber-insurance under two cases - one in which informationasymmetry between the insurer and the user is present and the other in which it is absent.When this information asymmetry is present, the insurer is unable to observe and hence
64

enforce any contract based on the user security level. Thus, we consider the two extremecases (worst and best respectively) for cyber-insurance under the current network structure.We expect a real-life cyber-insurance to be intermediate between the two, re�ecting thefact that cyber-insurers may have some information about user vulnerability but may notknow/monitor user security level perfectly.
When information asymmetry is present, we show that the moral hazard problem becomesrelevant. Here, users are insured and their risks are covered. In the contract, no conditionsare imposed on user security, because even if they were, they cannot be enforced. In thiscase, users tend to further under-invest in security and the network security worsens in thepresence of cyber-insurers, as is expected in a standard model [76]. Though the total userutility of the network has increased due to user risk being covered, the total damages (costs)to society have increased due to the lower security levels.
When no information asymmetry is present between users and insurers, we show thatcompetitive cyber-insurers cover the entire user damage. However, even in this case, due tocompetitive pressures, in equilibrium, these insurers choose a security level that is lower thanthe socially optimum level. In this case, cyber-insurers free-ride on the security levels of theircompetitors which brings down the network security level. In fact, for a signi�cant rangeof parameters, the network security level is lower than the security level without insurance.Thus, again, though user utility goes up, the total damages to society may increase.
Note that in the second case, there is no information asymmetry between the insurersand the users. However, there is still ine�ciency of insurer action. Indeed, in our model,insurers cannot engage in an enforceable contract which would state the required securitylevel for their o�ered contracts. With such a contract, insurers could have reached a betterequilibrium, but this is unlikely because without an enforceable agreement, it is individuallyrational for each user to deviate and attract more users by o�ering a lax user contract.
Our assumption of identical users is simplistic, and does not hold in the actual Internet.But, adding user and insurer heterogeneity to our setting only increases informational asym-metries. When insurers could separate users of di�erent types, our results should continueto hold for every user sub-type present in a heterogeneous environment. When insurers areunable to distinguish between users with di�erent types, missing markets are likely, as [76]demonstrate. And, the presence of di�erent insurer types brings adverse selection problems,such as the �lemon problem� [5], also leading to missing markets.
To conclude, we suggest that, for cyber-insurance to be an e�ective tool for improvementof network security, we need to solve two problems, not one. The traditional informationasymmetry between insurers and users may be tackled by better monitoring and enforcingsecurity best practices (via software certi�cation techniques, for example). However, thefree-riding between insurers also needs to be resolved. One way this may be achieved is viaa mandate on the required user security in insurance contracts.
65

4.5 ConclusionIn this chapter, we investigate the e�ects of competitive cyber-insurers on network se-
curity and welfare. We highlight the impact of asymmetric information in the presence ofnetwork externalities and address the e�ects of interdependent security on the market forcyber-risks. The existing literature attributes cyber-insurance a signi�cant role in cyber-riskmanagement; it especially emphasizes positive e�ects of cyber-insurance market on securityincentives. We �nd that, on reverse, the presence of competitive cyber-insurers, in general,weakens user incentives to improve security.
Though insurance improves the utility for risk-averse users, it does not serve as an incen-tive device for improving security practices. Indeed, insurance is a tool for risk managementand redistribution, not necessarily a tool for risk reduction. To sum up, we argue that acombination of interdependent security and information asymmetries hinder cyber-insurancefrom performing the function of a catalyst for improvement of network security.
Appendix
Social Optimum with No Insurance
In the social optimum, the goal is to maximize aggregate user utility given by
Uagg =∑
i=1...N
[(1− viv)f(W ) + vivf(W −D)− g(vi)],
where v =
∑i=1...N
vi
N. To optimize this expression, we take the partial derivative w.r.t. vj for
some j ∈ 1, . . . , N and equate to zero:
∂Uagg
∂vj
= 0
∑i=1...N
[ vi
N{f(W −D)− f(W )}
]+ v{f(W −D)− f(W )} − g′(vj) = 0
2v{f(W )− f(W −D)} = −g′(vj). (4.13)
Since (4.13) is identical for all j, all users must be assigned an identical vulnerability tomaximize the aggregate utility.
66

Proposition 4.3.1
Social Planner
First, we show that the social planner will o�er a single contract in equilibrium only.Assume the reverse, and let there exist an equilibrium with network security v, and at leasttwo equilibrium contracts (ρ1, L1) and (ρ2, L2). Without loss of generality, let v1 > v > v2.
Then, for any user with contract (ρ1, L1) optimal v1 is the same as in the base modelwith W1 = W − ρ1 and D1 = D − L1, and thus v1 is identical for all users with contract(ρ1, L1) and is given from (4.5):
v[f(W1)− f(W1 − D1)
]= −g′(v1). (4.14)
Using (4.5), all these users' utility U1 can be written as
U1 = f(W1) + v1g′(v1)− g(v1), (4.15)
Similarly, for all users with contract (ρ2, L2) we have:
U2 = f(W2) + v2g′(v2)− g(v2).
Taking the derivative of vg′(v)− g(v) w.r.t. v, we get
g′(v)− g′(v) + vg′′ = vg′′ ≥ 0, (4.16)
which implies that vg′(v)− g(v) increases with v.Now, consider instead a single contract (ρ, L1) such that optimal user vulnerability in
the base model with W = W − ρ and D1 = D − L1 is v1, i.e., from (4.6),
v1
[f(W )− f(W − D1)
]= −g′(v1). (4.17)
Comparing the LHS of (4.14) and (4.17), we infer that, since v1 > v, W > W1 and henceρ < ρ1. Comparing the user utility with this single contract (ρ, L1) with (4.15), we have
U = f(W − ρ) + v1g′(v1)− g(v1) > U1 = U2,
since ρ < ρ1. Thus, this single contract (ρ, L1) permits the social planner to achieve higheruser utility and will be preferred to the two contracts (ρ1, L1) and (ρ2, L2). Hence, we haveproven that only a single contract will be o�ered in the social planner optimum.
Second, we demonstrate that the network vulnerability with the optimal contract(ρ†soc, L†soc) is higher than in the no-insurance Nash equilibrium, i.e., v†soc ≥ v∗. We knowthat U †soc must be higher than U∗ since U∗ can always be reached by the planner o�eringthe contract (ρ, L) = (0, 0) :
U †soc ≥ U∗.
67

Next, for any contract (ρ, L) with optimal vulnerability v, similar to (4.15), the user's utilitycan be written as
U = f(W − ρ) + vg′(v)− g(v). (4.18)From ρ > 0, the monotonicity of vg′−g from (4.16), (4.18) and (4.7), we infer that U †soc ≥ U∗
holds only ifv†soc > v∗.
Last, we show that all users purchase this insurance. If a user i deviates to no-insurance,she obtains U(vi, v
†soc, 0, 0), which is highest for vi = v determined from ∂U(vi,v†soc,0,0)
∂vi= 0,
which gives:v†soc [f(W )− f(W −D)] = −g′(v). (4.19)
Since v†soc ≥ v∗, comparing the LHS of (4.19) and (4.6), we have
v ≤ v∗ ≤ v†soc.
Next, we write U(v, v†soc, 0, 0) using (4.19):
U(v, v†soc, 0, 0) = f(W ) + vg′(v)− g(v). (4.20)
Comparing with (4.7) using the monotonicity of vg′− g derived in (4.16), we conclude that,since v ≤ v∗, the user utility from deviation U(v, v†soc, 0, 0) must be lower than U∗. Therefore,
U(v, v†soc, 0, 0) ≤ U∗ ≤ U †soc,
giving us the required result that no user will deviate and not buy insurance.
Competitive Insurers
In the case of competing insurers, there may exist multiple contracts in equilibrium.However, the resulting network vulnerability v† will not be lower than the vulnerability inthe Nash equilibrium v∗. Indeed, assume the reverse: v† < v∗. Let (ρ1, L1) be some contractadopted by a non-zero fraction of users in this equilibrium.
From (4.5), replacing W by W1 = W − ρ1 and D by D1 = D − L1, we get an expressionfor the vulnerability v1 chosen by users who adopt the contract (ρ1, L1):
v†[f(W1)− f(W1 − D1)
]= −g′(v1). (4.21)
Note that ρ1 ≤ L1, i.e., the premium must be lower than the coverage, else deviating from thiscontract to no-insurance gives higher utility to the users. Hence,
[f(W1)− f(W1 − D1)
]≤
[f(W )− f(W −D)].From our assumption that v† ≤ v∗, we observe that the LHS of (4.21) is lesser than the
LHS of (4.6) which implies that v1 ≥ v∗. (See Fig. 4.2(b).) However, the choice of (ρ1, L1)was arbitrary among all the contracts in equilibrium. Hence, the user adopting any contractin equilibrium will choose vulnerability not lower than v∗. This gives us v† ≥ v∗, whichcontradicts our assumption. Hence, v† ≥ v∗ in the competitive equilibrium as well.
68

†soc
(a) Nash Equilibrium Vs Social Optimum
† 1
1 1
1
(b) Deviation v1
Figure 4.2. Competitive Non-contractible Insurance
Proposition 4.3.2
Social Planner
First, we show that a social planner will o�er a single contract in equilibrium only.Indeed, assume the reverse. Let the social planner o�er two contracts (The proof for morecontracts is similar.) (v1, ρ1, L1) and (v2, ρ2, L2) to a fraction α and (1−α) of the populationrespectively. Thus,
v = αv1 + (1− α)v2.
From the budget constraint, we have
αρ1 + (1− α)ρ2 ≥ αv1vL1 + (1− α)v2vL2.
From (4.8), we observe that the contracts with L1 = L2 = D o�er users a higher utility.Hence, we will only focus on the contracts (v1, ρ1, D) and (v2, ρ2, D) for the rest of the proof.In this case, the budget constraint becomes
αρ1 + (1− α)ρ2 ≥ αv1vD + (1− α)v2vD = v2D. (4.22)
From (4.8), the aggregate utility with the contracts (v1, ρ1, D) and (v2, ρ2, D) will be:
Uagg = α[f(W − ρ1)− g(v1)] + (1− α)[f(W − ρ2)− g(v2)].
Since both f and (−g) are concave functions (and f ′ > 0),
Uagg < f(W − {αρ1 + (1− α)ρ2})− g(v)
≤ f(W − v2D)− g(v),
where the second inequality comes from (4.22).f(W − v2D)− g(v) is the utility obtained from the contract (v, v2D, D). Hence, there exists
69
the single contract (v, v2D, D) which always provides a higher aggregate user utility than allcontracts (v1, ρ1, L1) and (v2, ρ2, L2).
Thus, the social planner o�ers only a single contract. This contract must be a solutionto the following optimization problem:
maxv,ρ,L
U(v, v, ρ, L)
s.t. v2L ≤ ρ and v ≤ 1.
Next, we write the Lagrangian:
LAN = U(v, v, ρ, L)− λ1(v2L− ρ)− λ2(v − 1).
Let W = W − ρ and D = D − L. Taking the derivatives of LAN w.r.t. v, L and ρ andequating to 0 gives us the following equations.
∂LAN
∂v=
∂U(v, v, ρ, L)
∂v− 2λ1vL− λ2 = 0,
[−2v(f(W )− f(W − D)− g′(v)
]− 2λ1vL− λ2 = 0. (4.23)
∂LAN
∂L=
∂U(v, v, ρ, L)
∂L− λ1v
2 = 0,
v2f ′(W − D)− λ1v2 = 0. (4.24)
∂LAN
∂ρ=
∂U(v, v, ρ, L)
∂ρ+ λ1 = 0,
−v2f ′(W − D)− (1− v2)f ′(W ) + λ1 = 0. (4.25)
Further, from complementary slackness, we have
λ1(v2L− ρ) = 0, (4.26)
and λ2(v − 1) = 0. (4.27)
Note that v 6= 0, since that would require in�nite security costs for the users. Hence, from(4.24), we conclude that λ1 = f ′(W − D) > 0 and thus, constraint (4.26) binds:
v2L = ρ. (4.28)
Equating λ1 from (4.24) and (4.25), we obtain:
f ′(W − D) = v2f ′(W − D) + (1− v2)f ′(W ). (4.29)
Note that v 6= 1 because g′(1) = 0 and even a tiny decrease in v increases the expectedbene�t without increasing costs. Thus, from (4.29),
L = D. (4.30)
70

‡
2
(a) Large D
‡
2
(b) Small D
Figure 4.3. Competitive Equilibrium with Contractible Security
Next, we can substitute (4.28) and (4.30) into (4.24) to get λ1 = f ′(W −v2D). Also, λ2 = 0,since v < 1. Substituting λ1, λ2, (4.28) and (4.30) into (4.23), we get
−g′(v) = 2vDf ′(W − v2D). (4.31)
Since the LHS is monotone decreasing while the RHS is monotone increasing, v‡soc(< 1) isthe unique solution to (4.31).
With L = D, and ρ = v2D user utility at any v can be expressed as
U(v, v, v2D, D) = f(W − v2D)− g(v).
Maximum utility is reached at dU(v)dv
= 0:
−2vDf ′(W − v2D)− g′(v) = 0, (4.32)
and maximum is unique, because d2U(v)dv2 < 0:
4v2D2f ′′(W − v2D)− 2Df ′(W − v2D)− g′′(v) < 0,
due to the properties of the functions f and g. Thus, there exists a unique social planner'soptimum contract.
Competitive Insurers
First, we notice that in any equilibrium, due to competition, for any insurer, pro�t iszero, i.e. ρ = vvL for any equilibrium contract (v, ρ, L). If ρ > vvL, some entrant insurercould o�er a contract (v, ρ, L) s.t. ρ > ρ > vvL. From (4.8), the contract with a lowerpremium and same L, v and v improves user utility.
Second, full coverage, i.e. L = D will be o�ered due to competition. Indeed, the contract(v, vvD, D) o�ers users the highest utility. To see this, consider the family of contracts
71

(v, vvL, L) for L ≤ D. From (4.9), the utility U(v, v, vvL, L) will be (1 − p)f(W − pL) +pf(W − pL−D + L)− g(v), where p = vv. Di�erentiating w.r.t. L, and equating to 0, weget
p(1− p)f ′(W − pL) = p(1− p)f(W − pL−D + L).
If p 6= 0 or 1, then L = D, which gives the required result. Henceforth, we restrict ouranalysis to contracts (v, vvD,D) only.
Third, in any equilibrium, user utility from deviation to no-insurance gives user a strictlylower utility. Indeed, assume the reverse. Consider a contract (v1, v1vD, D) that has a non-zero number of users adopting it in equilibrium. If a customer of this contract prefers todeviate to vi with no insurance, then his utility without insurance must be greater than theutility with insurance contract, i.e., U(vi, v, 0, 0) ≥ U(v1, v, v1vD,D). Consider an entrantinsurer who o�ers a contract (vi, vivD,D) (full coverage at actuarially fair price). Adoptingthis contract improves user utility, which con�icts our equilibrium assumptions. Therefore,the utility from deviation to no-contract must be strictly lower than with a contract, andthus, all users strictly prefer to buy insurance.
Fourth, we prove that equilibrium contract is unique. Consider an equilibrium withnetwork security v. An entrant insurer could o�er a contract (v, vvD, D) that maximizesU(v, v, vvD,D) = f(W − vvD) − g(v). To determine v at which user utility is the highestwe di�erentiate
∂
∂vU(v, v, vvD,D) =
∂
∂v
(f(W − vvD)− g(v)
)= 0,
f ′(W − vvD)(−vD)− g′(v) = 0,
and since the second derivative is always negative:
f ′′(W − vvD)(vD)2 − g′′(v) < 0,
user utility reaches its maximum at a single point v only, which is exactly the contract o�eredin equilibrium. Thus, we have v = v = v†, and in any equilibrium, all users buy an identicalcontract (v‡, (v‡)2D, D), determined from
−g′(v‡) = v‡Df ′(W − (v‡)2D). (4.33)
The unique v‡ is strictly less than 1 since f ′(W − D) > 0. (If f ′(W − D) = 0, thenf(W ) = f(W − D) and insurance does not improve user utility and is hence redundant.)Since the RHS of (4.31) is twice the RHS of (4.33), we conclude that v‡ ≥ v‡soc, i.e., theequilibrium security under competitive insurers is worse than under a social planner.
Next, we determine how v‡ compares to v∗. We rewrite (4.33) as
−g′(v‡)v‡
= Df ′(W − (v‡)2D), (4.34)
and compare with the Nash equilibrium by rewriting (4.6) as:−g′(v∗)
v∗= f(W )− f(W −D). (4.35)
72

Note that, from f ′′ ≤ 0, we have f ′(W ) ≤ f(W )−f(W−D)D
≤ f ′(W − D). Also, f ′(W − v2D)
is an increasing function of v, and −g′(v)v
is decreasing. Hence, if Df ′(W − v∗2D) < f(W )−f(W −D) then v‡ > v∗ else v‡ ≤ v∗. Thus, if the marginal bene�t from full coverage o�eredat v∗ is lower than the average loss of bene�t per unit damage, insurance does not improvethe security level.
Figure 4.3 depicts the solution of (4.34). From the �gure, it is clear that only when Dbecomes small, the network security level in the equilibrium with insurers exceeds securitylevel of no-insurance equilibrium. Note that when D is small, v∗ is also large. Thus, compet-itive insurers improve network security only when equilibrium vulnerability in no-insuranceequilibrium is high.
73

Bibliography
[1] Comcast Powerboost. [Online]. Available: http://www.comcast.net/powerboost/
[2] D. Acemoglu, K. Bimpikis, and A. Ozdaglar, �Price and capacity competition,�Games and Economic Behavior, vol. In Press, Corrected Proof, 2008. [Online].Available: http://www.sciencedirect.com/science/article/B6WFW-4SWWT5G-2/2/f20546316e28b355815f539f0c1e9d3b
[3] D. Acemoglu and A. Ozdaglar, �Competition and e�ciency in congested markets.�Math. Oper. Res., vol. 32, no. 1, pp. 1�31, 2007.
[4] D. Acemoglu, A. Ozdaglar, and R. Srikant, �The Marginal User Principle for ResourceAllocation in Wireless Networks,� in Decision and Control, 2004. CDC. 43rd IEEEConference on, vol. 2, Dec 2004, pp. 1544�1549.
[5] G. A. Akerlof, �The market for 'lemons': Quality uncertainty and the marketmechanism,� The Quarterly Journal of Economics, vol. 84, no. 3, pp. 488�500, August1970. [Online]. Available: http://ideas.repec.org/a/tpr/qjecon/v84y1970i3p488-500.html
[6] J. Altmann, B. Rupp, and P. Varaiya, �E�ects of Pricing on Internet User Behavior,�Netnomics, vol. 3, no. 1, pp. 67�84, 2001.
[7] R. Anderson, R. Böehme, R. Clayton, and T. Moore, �Security economics and europeanpolicy,� in Proceedings of WEIS'08, Hanover, USA, Jun. 25-28 2008.
[8] T. Anderson, L. Peterson, S. Shenker, and J. Turner, �Overcoming the internet impassethrough virtualization,� Computer, vol. 38, no. 4, pp. 34�41, 2005.
[9] (1998) The economics of the Internet: Utility, utilization, pricing, and Quality ofService. AT&T Labs. [Online]. Available: http://www.dtc.umn.edu/~odlyzko/doc/internet.economics.pdf
[10] W. S. Baer and A. Parkinson, �Cyberinsurance in it security management,� IEEESecurity and Privacy, vol. 5, no. 3, pp. 50�56, 2007.
[11] J. P. Bailey, �The economics of internet interconnection agreements,� pp. 155�168,1997.
74

[12] R. Boehme and G. Kataria, �Models and measures for correlation in cyber-insurance,�in Fifth Workshop on the Economics of Information Security, 2006.
[13] R. Böhme, �Cyber-insurance revisited,� in Proceedings of WEIS'05, Cambridge, USA,2005.
[14] R. Bohme and G. Schwartz, �Cyber Insurance: Hopes and Practices - Summary ofthe Literature,� In preparation, Available March 2010, http://www1.inf.tu-dresden.de/~rb21/publications/BS2010_CyberInsuranceReview.pdf, 2010.
[15] J. Bolot and M. Lelarge, �A new perspective on internet security using insurance,� IN-FOCOM 2008. The 27th Conference on Computer Communications. IEEE, pp. 1948�1956, April 2008.
[16] L. Brakmo and L. Peterson, �Tcp vegas: end to end congestion avoidance on a globalinternet,� Selected Areas in Communications, IEEE Journal on, vol. 13, no. 8, pp. 1465�1480, oct 1995.
[17] B. Briscoe, A. Jacquet, C. Di Cairano-Gilfedder, A. Salvatori, A. Soppera, and M. Koy-abe, �Policing congestion response in an internetwork using re-feedback,� SIGCOMMComput. Commun. Rev., vol. 35, no. 4, pp. 277�288, 2005.
[18] V. Chandrasekhar, J. Andrews, and A. Gatherer, �Femtocell networks: a survey,�vol. 46, no. 9, pp. 59�67, Sept. 2008.
[19] V. Chandrasekhar and J. Andrews, �Uplink Capacity and Interference Avoidancefor Two-Tier Cellular Networks,� in Global Telecommunications Conference, 2007.GLOBECOM '07. IEEE, Nov. 2007, pp. 3322�3326.
[20] N. M. K. Chowdhury and R. Boutaba, �A survey of network virtualiza-tion,� Computer Networks, vol. 54, no. 5, pp. 862 � 876, 2010. [On-line]. Available: http://www.sciencedirect.com/science/article/B6VRG-4XKBYY4-4/2/91ac30e6e1c4d24c53d95798a6148f03
[21] H. Claussen, �Performance of Macro- and Co-Channel Femtocells in a HierarchicalCell Structure,� in Personal, Indoor and Mobile Radio Communications, 2007. PIMRC2007. IEEE 18th International Symposium on, Sept. 2007, pp. 1�5.
[22] H. Claussen, L. Ho, and L. Samuel, �Financial Analysis of a Pico-Cellular Home Net-work Deployment,� in Communications, 2007. ICC '07. IEEE International Confer-ence on, June 2007, pp. 5604�5609.
[23] R. H. Coase, �The problem of social cost,� Journal of Law and Economics, vol. 3, pp.1�44, 1960. [Online]. Available: http://www.jstor.org/stable/724810
[24] C. Courcoubetis and R. Weber, Pricing Communication Networks: Economics, Tech-nology and Modelling (Wiley Interscience Series in Systems and Optimization). JohnWiley & Sons, 2003.
75

[25] J. Crowcroft, S. Hand, R. Mortier, T. Roscoe, and A. War�eld, �QoS's Downfall: Atthe Bottom, or Not at All!� in RIPQoS '03: Proc. ACM SIGCOMM workshop onRevisiting IP QoS. New York, NY, USA: ACM, 2003, pp. 109�114.
[26] B. Davie, �Deployment Experience with Di�erentiated Services,� in RIPQoS '03: Proc.ACM SIGCOMM workshop on Revisiting IP QoS, 2003, pp. 131�136.
[27] M. D. M. de Montmarin, �A Result Similar to the Odlyzko's 'Paris Metro Pricing',�Applied Economics, vol. 38, pp. 1821�1824, 2006.
[28] J. Farrell and P. Klemperer, �Coordination and Lock-In: Competition with SwitchingCosts and Network E�ects,� SSRN eLibrary, 2006.
[29] J. Farrell and G. Saloner, �Installed base and compatibility: Innovation, productpreannouncements, and predation,� The American Economic Review, vol. 76, no. 5,pp. 940�955, 1986. [Online]. Available: http://www.jstor.org/stable/1816461
[30] E. Felten, �Nuts and Bolts of Network Neutrality,� Working Paper, http://itpolicy.princeton.edu/pub/neutrality.pdf, Center for Intormation Technology Policy, 2006.
[31] M. Fisk, �Causes and remedies for social acceptance of network insecurity,� in Proceed-ings of WEIS'02, Berkeley, USA, 2002.
[32] S. Floyd, M. Handley, J. Padhye, and J. Widmer, �Equation-based congestion controlfor unicast applications,� in SIGCOMM '00: Proceedings of the conference on Applica-tions, Technologies, Architectures, and Protocols for Computer Communication. NewYork, NY, USA: ACM, 2000, pp. 43�56.
[33] R. Gibbens, R. Mason, and R. Steinberg, �Internet Service Classes under Competition,�vol. 18, no. 12, pp. 2490�2498, Dec. 2000.
[34] L. A. Gordon, M. Loeb, and T. Sohail, �A framework for using insurance for cyber-riskmanagement,� Communications of the ACM, vol. 46, no. 3, pp. 81�85, 2003.
[35] L. A. Gordon and M. P. Loeb, �The economics of information security investment,�ACM Trans. Inf. Syst. Secur., vol. 5, no. 4, pp. 438�457, 2002.
[36] J. Grossklags, N. Christin, and J. Chuang, �Secure or insure?: a game-theoretic analysisof information security games,� in WWW '08: Proceeding of the 17th internationalconference on World Wide Web. New York, NY, USA: ACM, 2008, pp. 209�218.
[37] A. Gupta, B. Jukic, M. Li, D. O. Stahl, and A. B. Whinston, �Estimating InternetUsers' Demand Characteristics,� Computational Economics, vol. 17, no. 2-3, pp. 203�218, 2001.
[38] A. Gupta, D. O. Stahl, and A. B. Whinston, �Priority Pricing of Integrated ServicesNetworks,� Internet economics, pp. 323�352, 1997.
[39] ��, �The economics of network management,� Commun. ACM, vol. 42, no. 9, pp.57�63, 1999.
76
[40] K. Hausken, �Returns to information security investment: The e�ect of alternativeinformation security breach functions on optimal investment and sensitivity to vulner-ability,� Information Systems Frontiers, vol. 8, no. 5, pp. 338�349, 2006.
[41] L. He and J. Walrand, �Pricing Di�erentiated Internet Services,� Proc. IEEE INFO-COM 2005, vol. 1, pp. 195�204, Mar. 2005.
[42] B. E. Hermalin and M. L. Katz, �The Economics of Product-Line Restrictions Withan Application to the Network Neutrality Debate,� July 2006.
[43] L. Ho and H. Claussen, �E�ects of User-Deployed, Co-Channel Femtocells on the CallDrop Probability in a Residential Scenario,� in Personal, Indoor and Mobile RadioCommunications, 2007. PIMRC 2007. IEEE 18th International Symposium on, Sept.2007, pp. 1�5.
[44] J. D. Hobby and H. Claussen, �Deployment options for femtocells and their impacton existing macrocellular networks,� Bell Labs Technical Journal, vol. 13, no. 4, pp.145�160, 2009.
[45] A. Hofmann, �Internalizing externalities of loss prevention through insurancemonopoly: an analysis of interdependent risks,� Geneva Risk and Insurance Review,vol. 32, no. 1, pp. 91�111, 2007.
[46] L. G. S. Holger Claussen, Lester T. W. Ho, �An overview of the femtocell concept,�Bell Labs Technical Journal, vol. 13, no. 1, pp. 221�245, 2008.
[47] P. Honeyman, G. Schwartz, and A. V. Assche, �Interdependence of reliability andsecurity,� in Proceedings of WEIS'07, Pittsburg, PA, 2007.
[48] J. W. J. Musacchio and S. Wu, �A game theoretic model for network upgrade decisions,�in 44th Annual Allerton Conference on Communication and Control, 2006, pp. 191�200.
[49] L. Jiang, V. Anantharam, and J. Walrand, �E�ciency of sel�sh investments in networksecurity,� in NetEcon '08: Proceedings of the 3rd international workshop on Economicsof networked systems. New York, NY, USA: ACM, 2008, pp. 31�36.
[50] Y. Jin, S. Sen, R. Guérin, K. Hosanagar, and Z.-L. Zhang, �Dynamics of competitionbetween incumbent and emerging network technologies,� in NetEcon '08: Proceedingsof the 3rd international workshop on Economics of networked systems. New York,NY, USA: ACM, 2008, pp. 49�54.
[51] R. Johari and J. N. Tsitsiklis, �E�ciency loss in a network resource allocation game,�Mathematics of Operations Research, vol. 29, no. 3, pp. 407�435, 2004. [Online].Available: http://www.jstor.org/stable/30035659
[52] R. Johari and G. Y. Weintraub, �Competition in Prices and Service Level Guarantees,�SSRN eLibrary, 2007.
77

[53] D. Joseph, N. Shetty, J. Chuang, and I. Stoica, �Modeling the adoption of new networkarchitectures,� in CoNEXT '07: Proceedings of the 2007 ACM CoNEXT conference.New York, NY, USA: ACM, 2007, pp. 1�12.
[54] F. P. Kelly, A. K. Maulloo, and D. K. H. Tan, �Rate control for communicationnetworks: Shadow prices, proportional fairness and stability,� The Journal of theOperational Research Society, vol. 49, no. 3, pp. 237�252, 1998. [Online]. Available:http://www.jstor.org/stable/3010473
[55] E. Koutsoupias and C. Papadimitriou, �Worst-case equilibria,� Computer ScienceReview, vol. 3, no. 2, pp. 65 � 69, 2009. [Online]. Available: http://www.sciencedirect.com/science/article/B8JDG-4W9S30K-1/2/ebc5bf18b0ab9dda637a62d9b8a9c61f
[56] D. M. Kreps and J. A. Scheinkman, �Quantity precommitment and bertrandcompetition yield cournot outcomes,� Bell Journal of Economics, vol. 14, no. 2,pp. 326�337, Autumn 1983. [Online]. Available: http://ideas.repec.org/a/rje/bellje/v14y1983iautumnp326-337.html
[57] H. Kunreuther and G. Heal, �Interdependent security,� Journal of Risk andUncertainty, vol. 26, no. 2-3, pp. 231�49, March-May 2003. [Online]. Available:http://ideas.repec.org/a/kap/jrisku/v26y2003i2-3p231-49.html
[58] H. C. Kunreuther and E. O. Michel-Kerjan, �Evaluating the e�ectiveness ofterrorism risk �nancing solutions,� National Bureau of Economic Research,Inc, NBER Working Papers 13359, Oct. 2007. [Online]. Available: http://ideas.repec.org/p/nbr/nberwo/13359.html
[59] C. Labovitz, D. McPherson, and S. Iekel-Johnson. 2009 Internet Observatory Report.Arbor Networks. [Online]. Available: http://www.nanog.org/meetings/nanog47/abstracts.php?pt=MTQ1MyZuYW5vZzQ3&nm=nanog47
[60] P. Laskowski and J. Chuang, �Network monitors and contracting systems: competitionand innovation,� SIGCOMM Comput. Commun. Rev., vol. 36, no. 4, pp. 183�194, 2006.
[61] ��, �A Leap of Faith? From Large-Scale Testbed to the Global Internet,� 37thTelecommunications Policy Research Conference, 2009.
[62] M. Lelarge and J. Bolot, �Network externalities and the deployment of security featuresand protocols in the internet,� SIGMETRICS Perform. Eval. Rev., vol. 36, no. 1, pp.37�48, 2008.
[63] ��, �Economic incentives to increase security in the internet: The case for insurance,�in INFOCOM 2009, IEEE, April 2009, pp. 1494�1502.
[64] R. Levitan and M. Shubik, �Duopoly with price and quantity as strategic variables,�International Journal of Game Theory, vol. 7, no. 1, pp. 1�11, Mar. 1978. [Online].Available: http://www.springerlink.com/content/q14gp60741540455
78

[65] D. Lopez-Perez, A. Valcarce, G. De La Roche, E. Liu, and J. Zhang, �Access methods toWiMAX femtocells: A downlink system-level case study,� in Communication Systems,2008. ICCS 2008. 11th IEEE Singapore International Conference on, Nov. 2008, pp.1657�1662.
[66] J. K. MacKie-Mason, S. Shenker, and H. R. Varian, �Network Architecture and Con-tent Provision: An Economic Analysis,� THE INTERNET AND TELECOMMUNI-CATIONS POLICY, G. Brock and G. Rosston, eds., Lawrence Erlbaum: 1996.
[67] R. P. Majuca, W. Yurcik, and J. P. Kesan, �The evolution of cyberinsurance,� ACMComputing Research Repository, Tech. Rep. CR/0601020, 2006.
[68] N. McKeown, T. Anderson, H. Balakrishnan, G. Parulkar, L. Peterson, J. Rexford,S. Shenker, and J. Turner, �Open�ow: enabling innovation in campus networks,� SIG-COMM Comput. Commun. Rev., vol. 38, no. 2, pp. 69�74, 2008.
[69] D. C. North, �Economic performance through time,� The American Economic Review,vol. 84, no. 3, pp. 359�368, 1994. [Online]. Available: http://www.jstor.org/stable/2118057
[70] A. Odlyzko, �Paris Metro Pricing for the Internet,� in EC '99: Proc. of the 1st ACMconference on Electronic commerce. ACM, 1999, pp. 140�147.
[71] ��, �The Economics of the Internet: Utility, Utilization, Pricing, and Quality ofService,� Tech. Rep., 1999.
[72] H. Ogut, N. Menon, and S. Raghunathan, �Cyber insurance and it security investment:Impact of interdependent risk,� in Proceedings of WEIS'05, Cambridge, USA, 2005.
[73] picoChip Designs Ltd, �The Case for Home Base Stations,� White Pa-per, Apr. 2007. [Online]. Available: http://www.femtoforum.org/femto/Files/File/picoChipFemtocellWhitePaper1.1.pdf
[74] S. ping Yeh, S. Talwar, S. choon Lee, and H. Kim, �WiMAX femtocells: a perspectiveon network architecture, capacity, and coverage,� vol. 46, no. 10, pp. 58�65, Oct. 2008.
[75] S. Radosavac, J. Kempf, and U. Kozat, �Using insurance to increase internet security,�in Proceedings of NetEcon'08, Seattle, USA, Aug. 22 2008.
[76] M. Rothschild and J. E. Stiglitz, �Equilibrium in competitive insurance markets:An essay on the economics of imperfect information,� The Quarterly Journalof Economics, vol. 90, no. 4, pp. 630�49, November 1976. [Online]. Available:http://ideas.repec.org/a/tpr/qjecon/v90y1976i4p630-49.html
[77] ��, �Competition and insurance twenty years later,� The Geneva Risk andInsurance Review, vol. 22, no. 2, pp. 73�79, December 1997. [Online]. Available:http://ideas.repec.org/a/pal/genrir/v22y1997i2p73-79.html
79
[78] T. Roughgarden and E. Tardos, �How bad is sel�sh routing?� J. ACM, vol. 49, no. 2,pp. 236�259, 2002.
[79] ��, �How bad is sel�sh routing?� J. ACM, vol. 49, no. 2, pp. 236�259, 2002.
[80] C. Saraydar, N. Mandayam, and D. Goodman, �Pricing and power control in a multicellwireless data network,� vol. 19, no. 10, pp. 1883�1892, Oct. 2001.
[81] S. E. Schechter, �Computer security strength and risk: a quantitative approach,� Ph.D.dissertation, Cambridge, MA, USA, 2004, adviser-Smith� Michael D.
[82] H. Schulzrinne and J. Rosenberg, �Internet telephony: architecture and protocols�anietf perspective,� Comput. Netw., vol. 31, no. 3, pp. 237�255, 1999.
[83] G. Schwartz, N. Shetty, and J. Walrand, �Cyber Insurance with Interdepedent Secu-rity and Aysmmetric Information,� In preparation, www.eecs.berkeley.edu/~nikhils/EconSec.pdf, 2010.
[84] ��, �Impact of QoS on Internet User Welfare,� in 4th International WorkshopOn Internet And Network Economics (WINE), 2008. [Online]. Available: http://www.eecs.berkeley.edu/~nikhils/PublishedPapers/SSW-WINE08.pdf
[85] ��, �Network Neutrality: Avoiding the Extremes,� in Forty-sixth AnnualAllerton Conference, 2008. [Online]. Available: http://www.eecs.berkeley.edu/~nikhils/PublishedPapers/AllertonSSW-NNATE08.pdf
[86] ��, �Net Neutrality and ISPs Property Rights: Why Internet Lacks Di�erentiatedServices?� Working Paper, www.eecs.berkeley.edu/~nikhils/SSW-Econ.pdf, 2010.
[87] M. Schwartz and P. J. Weiser, �Introduction to a special issue on network neutrality,�Review of Network Economics, vol. 8, no. 1, pp. 1�12, Mar. 2009. [Online]. Available:http://ideas.repec.org/a/rne/rneart/v8y2009i1p1-12.html
[88] S. Shakkottai, R. Srikant, A. Ozdaglar, and D. Acemoglu, �The Price of Simplicity,�Selected Areas in Communications, IEEE Journal on, vol. 26, no. 7, pp. 1269�1276,Sep 2008.
[89] S. Shenker, D. Clark, D. Estrin, and S. Herzog, �Pricing in computer networks: re-shaping the research agenda,� SIGCOMM Comput. Commun. Rev., vol. 26, no. 2, pp.19�43, 1996.
[90] J. G. Sidak, �A consumer-welfare approach to network neutrality regulation of theInternet,� Journal of Competition Law and Economics, vol. 2, no. 3, pp. 349�474, 2006.[Online]. Available: http://jcle.oxfordjournals.org/cgi/content/abstract/2/3/349
[91] K. Soohoo, �How much is enough? a risk-management approach to computer security,�Ph.D. dissertation, Stanford University.
[92] P. Srinagesh, �Internet cost structures and interconnection agreements,� pp. 121�154,1997.
80

[93] D. O. Stahl, R. Dai, and A. B. Whinston, �An Economic Analysis of Multiple InternetQoS Channels,� 2003.
[94] J. E. Stiglitz, �Information and the change in the paradigm in economics,� AmericanEconomic Review, vol. 92, no. 3, pp. 460�501, June 2002. [Online]. Available:http://ideas.repec.org/a/aea/aecrev/v92y2002i3p460-501.html
[95] L. Subramanian, S. Agarwal, J. Rexford, and R. Katz, �Characterizing the internethierarchy from multiple vantage points,� in INFOCOM 2002. Twenty-First AnnualJoint Conference of the IEEE Computer and Communications Societies. Proceedings.IEEE, vol. 2, 2002, pp. 618 � 627 vol.2.
[96] B. van Schewick and D. Farber, �Point/counterpoint network neutrality nuances,�Commun. ACM, vol. 52, no. 2, pp. 31�37, 2009.
[97] H. Varian, �System reliability and free riding,� in Workshop on the Economics of In-formation Security, WEIS 2002, Cambridge, USA, 2002.
[98] H. R. Varian, �The Demand for Bandwidth: Evidence from the INDEX Project,�http://www.sims.berkeley.edu/~hal/Papers/brookings.pdf, 2001.
[99] J. Walrand, Economic Models of Communication Networks. Springer, 2008, ch. 3,pp. 57�87. [Online]. Available: http://www.springer.com/computer/hardware/book/978-0-387-79360-3
[100] Z. Wang, Internet QoS: Architectures and Mechanisms for Quality of Service. SanFrancisco, CA, USA: Morgan Kaufmann Publishers Inc., 2001.
[101] D. X. Wei, C. Jin, S. H. Low, and S. Hegde, �Fast tcp: motivation, architecture,algorithms, performance,� IEEE/ACM Trans. Netw., vol. 14, no. 6, pp. 1246�1259,2006.
[102] G. Y. Weintraub, R. Johari, and B. Van Roy, �Investment and Market Structure inIndustries with Congestion,� SSRN eLibrary, 2007.
[103] O. E. Williamson, �The economics of organization: The transaction cost approach,�The American Journal of Sociology, vol. 87, no. 3, pp. 548�577, 1981. [Online].Available: http://www.jstor.org/stable/2778934
[104] ��, �Transaction Cost Economics: How it Works; Where it is Headed,� SSRN eLi-brary, 1998.
[105] C. S. Yoo, �Network Neutrality and the Economics of Congestion,� Georgetown LawJournal, vol. 94, June 2006. [Online]. Available: http://ssrn.com/paper=825669
81