role of cd44 in clear cell renal cell carcinoma
TRANSCRIPT

21
Edusfarm 9 (2017), 21-40ISSN: 1886-6271
Rebut: 20 de setembre de 2017Acceptat: 29 de setembre de 2017
ROLE OF CD44 IN CLEAR CELL RENAL CELL CARCINOMA INVASIVENESS AFTER ANTIANGIOGENIC TREATMENT
Aparicio-Garcia, Maria1 Bellvitge Biomedical Research Institute (IDIBELL)
Faculty of Pharmacy and Food Sciences, University of Barcelona Av. Joan XXIII, s/n 08028 Barcelona
AbstractThroughout the previous century, a big effort to understand the biochemical basis of cancer was made. One of the principal branches of cancer research used drugs to prevent the formation of new blood vessels – a process called angiogenesis – responsible for nutrient supply to the tumour. These drugs are generally called antiangiogenics. It was discovered that some types of tumour have or develop resistance to these drugs. Therefore, mechanisms of resistance, aggressiveness, invasion and/or metastasis after treatment are now-adays relevant areas of study. Recently, a protein that could be involved in increased invasiveness of tumour cells after antiangiogenic treatment appeared. This project presents some evidence that indicates that this protein, CD44, might play a role in increased invasion after antiangiogenic treatment in mouse models of renal carcinoma.
Keywords: cancer, angiogenesis, resistance, CD44.
ResumenDurante el último siglo, se ha hecho un gran esfuerzo para profundizar en la base bioquímica de la investi-gación contra el cáncer. Una de las ramas principales de esta investigación usa fármacos que previenen la formación de nuevos vasos sanguíneos —proceso llamado angiogénesis— encargados de nutrir el tumor. Estos fármacos reciben el nombre de antiangiogénicos. Se ha descubierto que algunos tipos de tumor tie-nen o desarrollan resistencia a estos fármacos. Por esta razón, se está investigando cuáles son los mecanis-mos por los que aparece esta resistencia, como también el incremento de la agresividad, la invasión y/o el poder metastásico después del tratamiento. Recientemente se ha descubierto una proteína, CD44, que podría estar involucrada en el aumento de la invasión de las células tumorales después del tratamiento an-tiagniogénico.
Palabras clave: cáncer, resistencia, angiogénesis, CD44.
ResumDurant l’últim segle, s’ha fet un gran esforç per aprofundir en la base bioquímica de la investigació contra el càncer. Una de les branques principals d’aquesta investigació utilitza fàrmacs que prevenen la formació de nous vasos sanguinis —procés anomenat angiogènesi— encarregats de nodrir el tumor. Aquests fàrmacs, generalment, s’anomenen antiangiogènics. S’ha descobert que alguns tipus de tumor tenen o desenvolupen resistència a aquests fàrmacs. Per aquesta raó, s’està investigant quins són els mecanismes pels quals apareix aquesta resistència, com també l’increment de l’agressivitat, invasió i/o poder metastàtic després del trac-tament. Recentment s’ha descobert una proteïna, CD44, que podria estar involucrada en l’augment de la invasivitat de les cèl·lules tumorals després del tractament antiangiogènic.
Paraules clau: càncer, resistència, angiogènesi, CD44.
1 Graduada en Farmàcia, estudiant de doctorat a IDIBELL ([email protected]).

22
Maria Aparicio-Garcia
1. Introduction
More than one million new cases of cancer were diagnosed in 2016 in the United States, and nearly 600,000 people are going to die due to the disease (https://www.cancer.gov). Every year in Europe, cancer has been responsible for 20% of deaths (http://www.euro.who.int). Specifically, in Spain, the incidence of cancer in 2012 was nearly 216,000 new cases according to the Spanish oncology society SEOM (http://www.seom.org).
Kidney and renal cancer can be found in the list of the most common cancers in 2016 published by the National Cancer Institute (https://www.cancer.gov). Renal cell car-cinoma affects over 30,000 individuals in the United States every year (Linehan & Zbar, 2004) and is responsible for 2–3% of cancer in Spain (http://www.seom.org). If it is de-tected in the early stages and is localized in the kidneys, the survival rate of patients is approximately 95% over five years; nevertheless, if it is not detected in the early stages the survival rate decreases significantly (Linehan & Zbar, 2004).
Clear cell renal cell carcinoma (ccRCC) is the most common subtype of renal cancer (Tun et al., 2010). Its name is attributed to the high accumulation of lipids and glycogen into the cells, giving a white colour to the tumour after histological examination (Tun et al., 2010). This type of cancer is mainly characterized by a loss of renal function, a down-regulation of some metabolic pathways, and the activation of the immune system (Tun et al., 2010). It was found that patients had higher risk of developing ccRCC if they had Von Hippel Lindau syndrome (VHL). This syndrome is characterised by a loss-of-func-tion mutation in the VHL gene. In normoxic conditions, the VHL protein forms a complex that targets HIF1a (the hypoxia-inducible factor) for its degradation, but not in a hypoxic situation. Mutant VHL protein is unable to bind HIF1a so it cannot be destructed and its accumulation promotes increased transcription of some growth factors, such as VEGF, EGFR, TGFa and PDGF (Linehan & Zbar, 2004). Tumours need nutrients and oxygen to grow and survive, and these overexpressed growth factors contribute to the formation of new blood vessels. The appearance of new vessels is known as angiogenesis – or an-giogenic process. Angiogenesis is a physiological process seen in other circumstances such as pregnancy or menstruation (Casanovas et al., 2005). The main drawback appears when transcription of pro-angiogenic factors is increased to feed a tumour. Vascular en-dothelial growth factor (VEGF) is one of the pro-angiogenic signalling factors involved in that process, and is also the most studied in angiogenesis. Its receptor is called VEGF receptor (VEGFR), and there are three types: VEGFR1, VEGFR2, and VEGFR3. They all are transmembrane tyrosine kinase receptors found in endothelial cells from blood vessels (Casanovas et al., 2005).
When this mechanism of tumour survival was discovered, most researchers thought those tumours would not progress and tumour cells would be destructed if the forma-tion of new blood vessels was inhibited. For that reason, antiangiogenic therapy appeared (Moserle et al., 2014). Some drugs, like sunitinib and bevacizumab, are nowadays used in antiangiogenic treatment for renal cell carcinoma and other types of cancer. The tar-get of those drugs is different: sunitinib is a small molecule that inhibits VEGF and VEGF receptors (VEGFR), among other targets; bevacizumab is a monoclonal antibody that blocks the human ligand VEGF (Jiménez-Valerio & Casanovas, 2013). DC101 is another antiangio-genic drug used in animal experimentation which is a monoclonal antibody that inhibits murine VEGFR, specifically, receptor 2 (Lee et al., 2010). There is also a human monoclonal antibody capable of inhibiting human VEGFR2 called ramucirumab, or IMC-1121B, and it has been tested as an antiangiogenic drug on several tumour types (Spratlin, 2011).

23
Edusfarm 9 (2017), 21-40ISSN: 1886-6271
In initial pre-clinical experiments, animals were treated with DC101 for a short period of time (10 days), showing a significant decrease of tumour growth. The problem appeared when researchers continued the treatment for longer (4 weeks) and drug re-sistance appeared. It was observed that after a period of reduction and stabilization, the tumour regrew and its phenotype was more invasive and malignant than the initial tu-mour (Casanovas et al., 2005).
Later, two different types of resistance mechanisms to antiangiogenic treatments were discovered: adaptive – or acquired – resistance, and intrinsic resistance. While in adaptive resistance the treatment was effective at first but the tumour regrew, in intrinsic resistance tumours never responded to the treatment (Gabriele Bergers & Douglas Hanahan, 2008). Nowadays these mechanisms of resistance are being deep-ly studied.
Nevertheless, unpublished results from the Bellvitge Biomedical Research Institute (IDIBELL) laboratory showed that there were two types of tumour behaviour after anti-angiogenic treatment. One tumour cell type demonstrated an increase of invasion in the kidney after antiangiogenic treatment. On the other hand, the second type of tumour cell turned out not to increase invasion after treatment.
To continue investigating tumour invasiveness and possible implicated molecules, a massive RNA sequencing from tumour samples was developed and it pointed to CD44 protein, among others, as a candidate gene involved in resistance and increased malig-nancy after antiangiogenic treatment (unpublished results from the laboratory).
The protein CD44 is a cell-surface glycoprotein expressed on the surface of differ-ent cells, including endothelial cells, epithelial cells, fibroblasts, keratinocytes, and leu-cocytes (Naor et al., 2015). It is encoded on chromosome 11, in its short arm (Lalit et al., 2012). Its molecular weight is around 85-200KDa (Basakran, 2015). Due to an extensive splicing phenomenon, there are different isoforms of the protein called variant isoforms (CD44v) (Lalit et al., 2012). The shortest isoform of the protein is standard CD44 (CD44s or CD44), and it is also the most abundantly occurring one (Naor et al., 2015). Figure 1 represents the structure of CD44s and its isoforms.
Figure 1. Structural representation of standard CD44 (CD44s) and its variant isoforms (CD44v) (Misra et al., 2015).

24
Maria Aparicio-Garcia
The protein consists of an extracellular part, a transmembrane part, and a cytoplas-mic part, containing different numbers of amino acids: 270, 23, and 72 respectively (Lal-it et al., 2012).
The principal ligand of CD44 is hyaluronic acid, a high molecular weight linear poly-saccharide (Naor et al., 2015). That binding takes place in the extracellular domain of CD44, specifically in the N-terminal part, and is responsible for cellular signalling and regulation of other cell biologic processes (Basakran, 2015). Nevertheless, CD44 can bind to other extracellular matrix molecules, like fibronectin, collagen, cytokines, etc, (Misra et al., 2015).
CD44 takes part in some physiological processes, like cell proliferation, adhesion, migration, haematopoiesis, and lymphocyte activation (Naor et al., 2015).
It was seen that CD44 is a protein involved in metastasis and tumour growth, also after antiangiogenic treatment, and that there is a relation between CD44, primary tumour stages, distant metastasis, and poor prognosis (Naor et al., 2015; Mikami et al., 2015). Moreover, CD44 is used as a marker of cancer stem cells in several types of cancer (Mi-kami et al., 2015).
High levels of CD44 protein are found in some malignant tumours, chronic inflam-matory reactions and autoimmune alterations (Basakran, 2015). It was described that some variants of CD44, especially CD44v6, can induce tumour progression and metasta-sis in breast, lung and colon cancer (Misra et al., 2015).
In this project, we studied the role of CD44 in tumour invasiveness using a renal carcinoma mice model.
2. Hypothesis and objectives
2.1. Hypothesis
After unpublished results obtained in the laboratory, we thought that CD44 could be a pos-sible protein involved in increased tumour invasiveness after antiangiogenic treatment.
2.2. Objectives
• Determine the expression of CD44 in treated and non-treated samples with an-tiangiogenic drug in a cellular type of ccRCC induced in a mice model.
• Determine the distribution of CD44 in the tumour in treated and non-treated animals with antiangiogenic drug.
• Determine the invasiveness of the tumour and correlate it with the expression of CD44.
3. Materials and methods
3.1. Bibliographic research
The information needed to write this paper was researched in different scientific articles. To get those articles some databases like PubMed and Google Scholar were used. The main topic was renal cell carcinoma, focusing on antiangiogenic therapy and the poten-tial mechanisms that tumours use to develop resistance to this therapy.

25
Edusfarm 9 (2017), 21-40ISSN: 1886-6271
3.2. Bioinformatics analysis
Several programs were used for gene expression analysis, like cBioPortal, to find out the relationships between various proteins and genes expressed in patients with renal cell carcinoma and compare them with healthy patients.
The experimental part of the project included the execution of some techniques. The main ones were Western blotting and Immunohistochemistry, explained below.
All the data acquired was statistically analysed using RStudio and basic lineal mod-el fitting.
3.3. Cell lines
Renal tumour cells used in the experiments were SN12C and Ren99. These cell lines are pVHL-positive; their VHL gene is not mutated. They were grown at 37°C in RPMI 1640 medium supplemented with foetal bovine serum (FBS), penicillin, streptomycin sulphate and L-glutamine. Two types of cells were used: SN12C, an established cell line; and Ren 13, which were primary cells from the tumour and needed, apart from the supplement-ed medium, insulin, EGF (epithelial growth factor) and fungizone to grow.
3.4. pTRIPZ-shCD44 lentiviral production and transduction of SNC12 cells
To develop some experiments, it was necessary to silence CD44 protein. To do that, a pTRIPZ lentiviral inducible sh-RNA vector was used. pTRIPZ is a plasmid that was used to produce lentiviral particles. This plasmid (Figure 2) contains an sh-RNA that can bind to a specific target mRNA and destruct it. It also contains a tetracycline inducible element that allows sh-RNA expression only in the presence of tetracycline or doxycycline.
Figure 2. Representation of the plasmid and its parts used to generate the len-tivirus for cells transduction.
By cotransfection of pTRIPZ along packaging plasmids, lentiviral particles are pro-duced. This lentivirus can be used to infect tumour cells, leading to integration of the plasmid into the genome of the cells. Transduced cells are selected using puromycin, which kills cells not expressing the vector.
In our experiments, the target of the sh-RNA was CD44. A sh-RNA with no target was also performed (non-silencing or NS), as a control to evaluate the effectiveness of the CD44 silencing and verify that doxycycline and the incorporation of the vector itself did not have any effect.

26
Maria Aparicio-Garcia
Thus, two vectors were developed: sh-CD44-1, which inhibits the expression of CD44 protein; and sh-CD44-NS, as a control.
3.5. Generating tumour samples and in vivo experiments in mice
To obtain tumour samples, an established cellular line (SN12C tumour cells) and a series of animals were needed. Mice were injected with 50mL of culture media containing one-and-a-half million cells. The injection was done intrarenally, in the left kidney of athy-mic nude mice. These cells proliferated leading to a renal tumour. When the tumour was 1500-1750mm3, the mice were sacrificed and the tumours extracted and divided into piec-es. These pieces were re-implanted into other mice in order to amplify the number of subjects of the experiment and to perpetuate the tumour model.
For our experiment 24 animals were studied. They were randomly divided into four groups depending on the treatment received. The first group was non-treated; the sec-ond one received only DC101 – administrated via intraperitoneal; the third one was treat-ed only with doxycycline – dissolved in the drinking water of mice, and the fourth group received both DC101 and doxycycline. The animals were treated over three weeks. After that time, the mice were sacrificed and the tumour and some organs (liver, lungs, dia-phragm, right kidney and spleen) were removed. Tumour weight and volume were mea-sured. Then, the tumours were divided into 2 parts, allowing for observation of the front between tumour and kidney (invasive front). One part was embedded with optimal cut-ting temperature (OCT) and frozen (–80°C) and the other piece was fixed with formol and later treated to be embedded in paraffin. Additionally, a small portion of each part was cut and divided into smaller pieces, then frozen (–80°C) for molecular analysis.
3.6. Western blot
Western blot is a technique used to separate and identify proteins by means of an elec-trophoresis in a polyacrylamide gel. The gel is divided into a top and a bottom part. The applied voltage difference between the two parts of the gel separates the different pro-teins as a function of their molecular weight. Then, the proteins from the studied samples are identified comparing their displacements in the gel with the calibration ones from a known set of proteins previously selected (Mahmood & Yang, 2012).
Going into more detail, polyacrylamide gel is composed of two gels of different pH and polyacrylamide proportions. With a higher percentage of polyacrylamide, the pores of the gels are smaller and the smallest proteins can be separated better. For this reason the upper gel has a lower percentage of polyacrylamide, because we do not want to sep-arate proteins, we just want to pack them. However, in the lower gel the percentage of polyacrylamide is higher, because we are aiming for separation of the proteins. The lower gel is called resolving gel, and it is where the separation of the proteins takes place. The upper gel is called stacking gel, and helps to pack the proteins into a very narrow band.
First of all, solutions of both gels were prepared separately. Then, the solution of the resolving gel was introduced between two glasses held by a support. When it became solid, the stacking gel solution was loaded. Before solidification of the upper gel, we used a comb to generate 10/15 wells. Once solid, the comb was taken off and gels were placed into the electrophorator (Bio-Rad Laboratories Inc., California) filled with running buffer. Samples and a reference marker of molecular weight were loaded into the wells (~30mL). Then, electrophoresis was initiated.

27
Edusfarm 9 (2017), 21-40ISSN: 1886-6271
Once finished, proteins were transferred to a polyvinylidene difluoride (PVDF) mem-brane. To do that, a sandwich made of one sponge, two Watman papers, the gel, the membrane, two more Watman papers and another sponge was prepared. The sandwich was introduced into the electrophorator again, this time filled with transfer buffer. The transfer was carried out under cold conditions (4°C) for 90 minutes.
Next, the membranes were incubated with blocking buffer (Tris-HCl buffered saline, TBS with 0.1% Tween-20 and 5% non-fat milk) for 1 hour at room temperature, followed by incubation with a primary antibody that recognized the protein of interest, in a cold chamber (4°C) overnight.
After that, the membranes were washed and incubated for 1 hour with a second-ary antibody that recognized the primary. They were then washed again and put in con-tact for 2 minutes with ECL detection reagent. The light from the reaction between the secondary antibody and the ECL reagent was measured from the membranes with Chemi-docTouch (Bio-Rad Laboratories Inc., California), and after removing the excess liquid im-ages were taken and analysed with ImageLab software.
In our experiment, we used a specific primary mouse anti-human antibody to de-tect CD44 protein and another primary mouse anti-human antibody to detect β-actin. As a secondary antibody in both cases a goat anti-mouse antibody was used.
β-actin is a protein expressed in all tissues and was quantified to normalize the results.
3.7. Immunohistochemistry
This is a technique used to determine the localization of a protein or an antigen of inter-est using specific antibodies (Richard W. Burry, 2011).
To develop this technique, we used embedded tumour samples in paraffin blocks. These blocks were sectioned into slides. Once samples were prepared we could start the immunohistochemistry.
First, slides were put in a cuvette and it was introduced into a series of alcohols and xylenes: 10 minutes in 4 different xylenes; 5 minutes in 3 of absolute ethanol; 5 minutes in 3 of 96% ethanol; 5 minutes in a 70% ethanol, and 5 minutes more in a 50% ethanol. This process helped to take the paraffin off the sample.
Then, slides were washed for 5 minutes in distilled water. After that, using sodium citrate and under pressure and temperature, the antigen we would like to detect was unmasked.
Next, samples were incubated with hydrogen peroxide and during that process, peroxidases became inactivated. It is important to avoid oxidative reactions. Samples were washed again and then permeated by a solution of PBS and triton (a detergent). Permeation of the samples is important to let the antibody cross the tissue and all mem-brane and detect the antigen of interest.
The samples were then incubated in a wet chamber for 1 hour with goat serum to block unspecific interactions that could occur, and after that they were incubated over-night with primary antibody at 4°C.
The next day, the samples were washed for 5 minutes with PBS and triton (0.1%), and this was repeated 3 times.
Then, slides were incubated for 1 hour with the secondary antibody that recognis-es the primary one, at room temperature.
Once the incubation was finished, the samples were washed again. Next, they were treated with DAB, which is a substrate chromogen system, for 6 minutes. This treatment

28
Maria Aparicio-Garcia
stained the samples. Then washing was needed once again, but this time with running water. After that, the samples were stained with hematoxylin, to contrast the staining nuclei/cells, for 1 minute and immediately washed. Then they were rapidly passed through a cuvette with HCl, then water, then to another cuvette with NH3, and finally washed with more water.
The samples were then dehydrated. To do that the same alcohol and xylene series was used but this time backwards.
Once completed, tissue samples were covered with a slide cover using DPX as a mounting medium. Slides were analysed under a microscope.
3.8. Data analysis
The graphic and statistical results obtained from the experiments were analysed with the RStudio (Boston, USA) analysis program. For study of statistical significance the Mann- Whitney U test was used, since the number of individuals could not be considered to fol-low a normal distribution.
The graphic model used is a boxplot, schematically explained below (Figure 3).
Figure 3. Representation of a boxplot and its differ-ent parts.
Statistic difference between groups is represented by asterisks:• One asterisk (*): p <0.05• Two asterisks (**): p<0.01• Three asterisks (***): p< 0.001• Four asterisks (****): p< 0.0001
3.9. Evaluation of tumour local invasiveness
Evaluation of tumour invasion was studied with ImageJ software. Two methods to determine invasion were developed. One method consisted of ob-
taining 4X zoomed images from a microscope after staining with an immunohistochem-istry assay using anti-vimentin antibody; the other method used images taken from a loupe after haematoxylin-eosin (H&E) staining by immunohistochemistry assay.
29
Edusfarm 9 (2017), 21-40ISSN: 1886-6271
Then, independently of the method used to take the pictures, the tumour-kidney interface was traced in the images and the distance of the deepest protrusion of tumour into kidney was evaluated.
Due to an existing correlation between depth and tumour weight, invasion was cal-culated as the average of invasion depth (mm or pixels) normalized for tumour weight.
4. Results and discussion
4.1. Expression of CD44 in SN12C renal tumour cells
Our aim in this study was to determine the expression of CD44 protein in SN12C ccRCC cells and then correlate that expression with the invasiveness of the tumour. In that way, we could see if there is an increase of that protein after antiangiogenic treatment and if it is responsible for increased invasion of the tumour when resistance to the treatment appears.
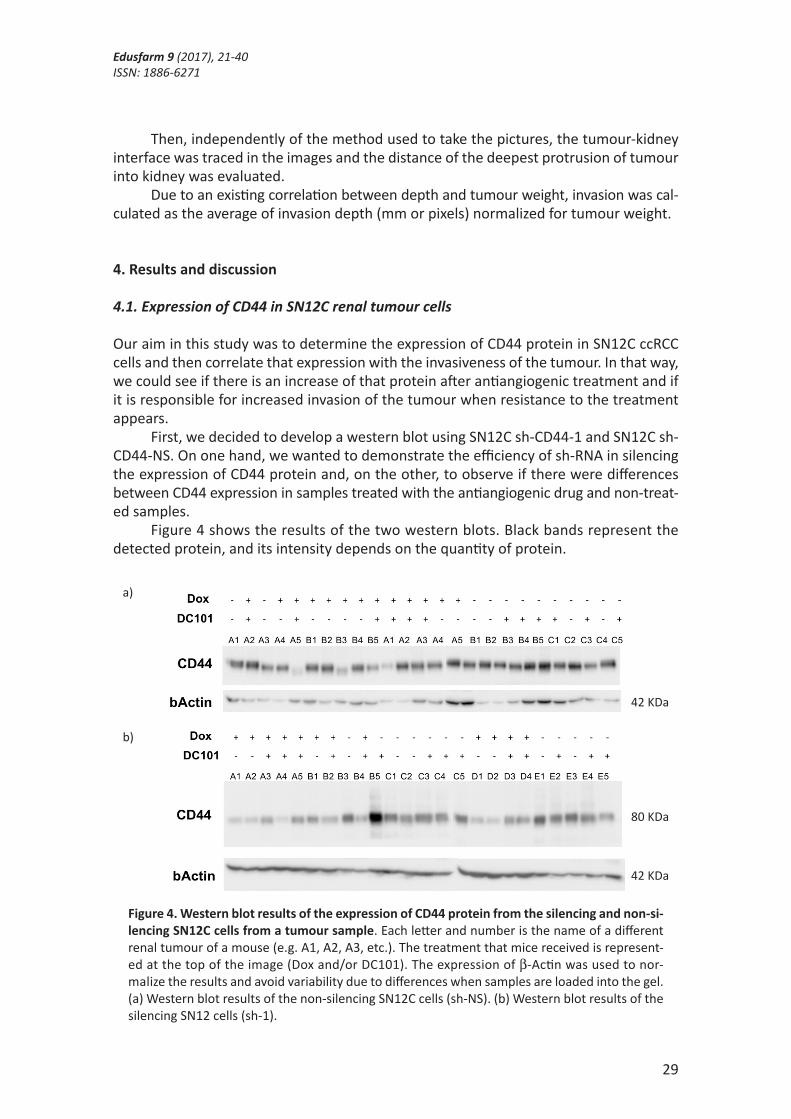
First, we decided to develop a western blot using SN12C sh-CD44-1 and SN12C sh-CD44-NS. On one hand, we wanted to demonstrate the efficiency of sh-RNA in silencing the expression of CD44 protein and, on the other, to observe if there were differences between CD44 expression in samples treated with the antiangiogenic drug and non-treat-ed samples.
Figure 4 shows the results of the two western blots. Black bands represent the detected protein, and its intensity depends on the quantity of protein.
80 KDa
42 KDa
a)
b)
42 KDa
Figure 4. Western blot results of the expression of CD44 protein from the silencing and non-si-lencing SN12C cells from a tumour sample. Each letter and number is the name of a different renal tumour of a mouse (e.g. A1, A2, A3, etc.). The treatment that mice received is represent-ed at the top of the image (Dox and/or DC101). The expression of β-Actin was used to nor-malize the results and avoid variability due to differences when samples are loaded into the gel. (a) Western blot results of the non-silencing SN12C cells (sh-NS). (b) Western blot results of the silencing SN12 cells (sh-1).

30
Maria Aparicio-Garcia
Each lane represents a piece of tumour from individual mice. We could see different levels of expression of the CD44 protein from each tumour in
the western blot figures. In order to understand how the expression of this protein depend-ed on the therapy, results were statistically analysed and expressed as boxplots. We wanted to observe if doxycycline affected the expression of CD44 independently of the antiangio-genic drug, and we also wanted to know if the treatment with DC101 led to an increase of CD44 independently of doxycycline. For that reason, we developed different boxplots that could help us to understand a bit more of the protein and the cell tumour type.
Boxplot analysis of CD44 expression in the non-silencing samples under the differ-ent treatments is shown in Figure 5. No statistical difference was found between any treat-ment condition (p>0.05).
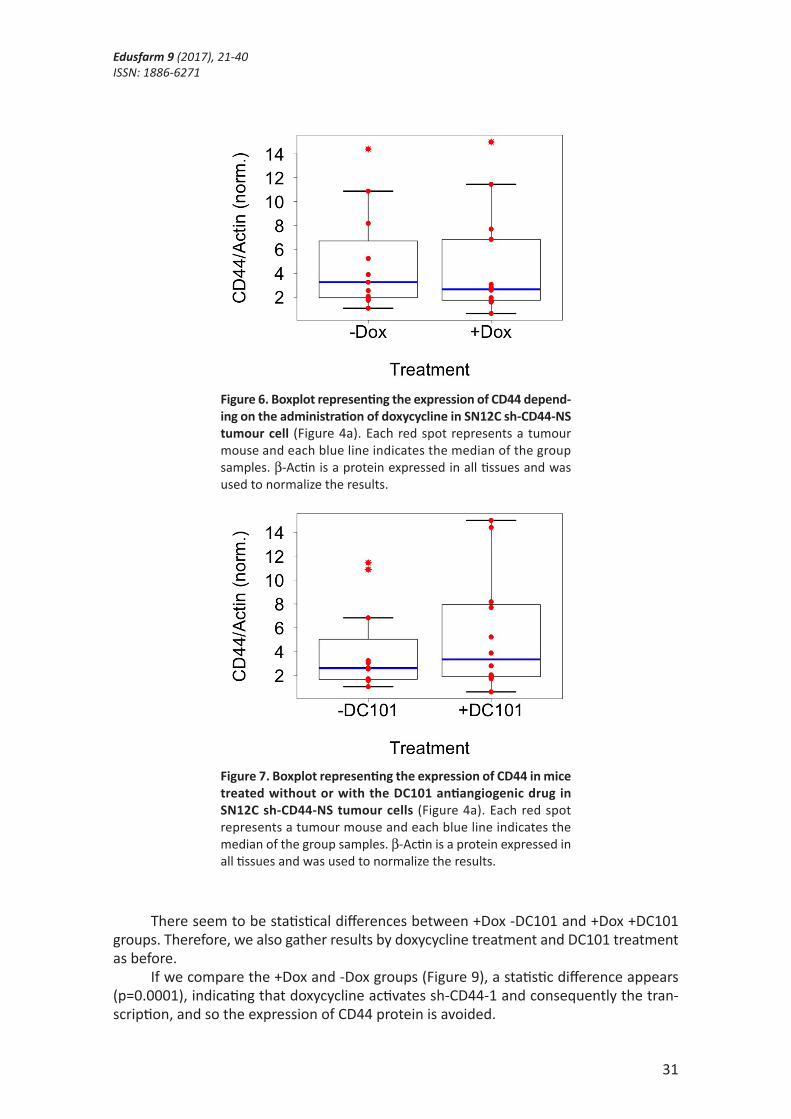
These results were interesting to compare because they show the different combi-nations of drug treatments that we administrated to the animals, and how the expression of the CD44 protein varied in each group. For this reason, these results were merged to-gether to analyse the effect of a single condition, with or without doxycycline (Figure 6), and with or without DC101 (Figure 7).
As we can see in the results, doxycycline treatment to the SN12C clear cell renal cell carcinoma cells without silencing of CD44 (Figure 6) does not reduce the expression of CD44 (p>0.05), indicating that the vector does not interfere in the transcription of the protein. Furthermore, the antiangiogenic treatment with DC101 to the tumour (Figure 7) does not increase the expression of CD44 (p>0.05), contrary to expectations. It could in-dicate that in this type of cells, the hypothesis we thought is not valid. Nevertheless, these are the results of one experiment and to confirm the rejection of the hypothesis, more experiments should be done with the same type of cells. Moreover, other cell types should be used to test that experiment, because maybe it works with other types of cells.
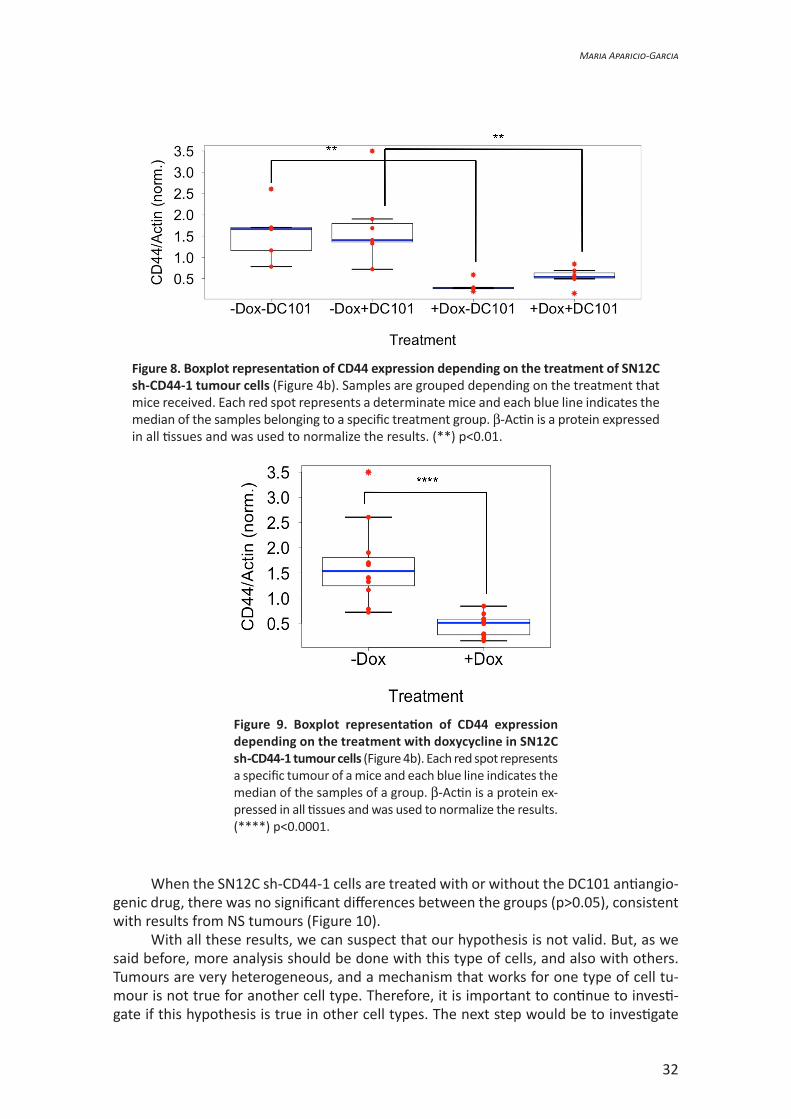
On the other hand, if we take a look at the samples transduced with the sh-CD44-1, statistic differences can be observed between –Dox -DC101 and +Dox -DC101 groups (p=0.014) and also between -Dox +DC101 and +Dox +DC101 groups (p=0.007) (Figure 8).
Figure 5. Boxplot representation of CD44 expression depending on the treatment of SN12C sh-CD44-NS tumour cells (Figure 4a). Samples are grouped depending on the treatment that the mice received. Each red spot represents a determinate mouse, and each blue line indicates the me-dian of the samples belonging to a specific treatment group. β-Actin is a protein expressed in all tis-sues and was used to normalize the results.
31
Edusfarm 9 (2017), 21-40ISSN: 1886-6271
There seem to be statistical differences between +Dox -DC101 and +Dox +DC101 groups. Therefore, we also gather results by doxycycline treatment and DC101 treatment as before.
If we compare the +Dox and -Dox groups (Figure 9), a statistic difference appears (p=0.0001), indicating that doxycycline activates sh-CD44-1 and consequently the tran-scription, and so the expression of CD44 protein is avoided.
Figure 6. Boxplot representing the expression of CD44 depend-ing on the administration of doxycycline in SN12C sh-CD44-NS tumour cell (Figure 4a). Each red spot represents a tumour mouse and each blue line indicates the median of the group samples. β-Actin is a protein expressed in all tissues and was used to normalize the results.
Figure 7. Boxplot representing the expression of CD44 in mice treated without or with the DC101 antiangiogenic drug in SN12C sh-CD44-NS tumour cells (Figure 4a). Each red spot represents a tumour mouse and each blue line indicates the median of the group samples. β-Actin is a protein expressed in all tissues and was used to normalize the results.
32
Maria Aparicio-Garcia
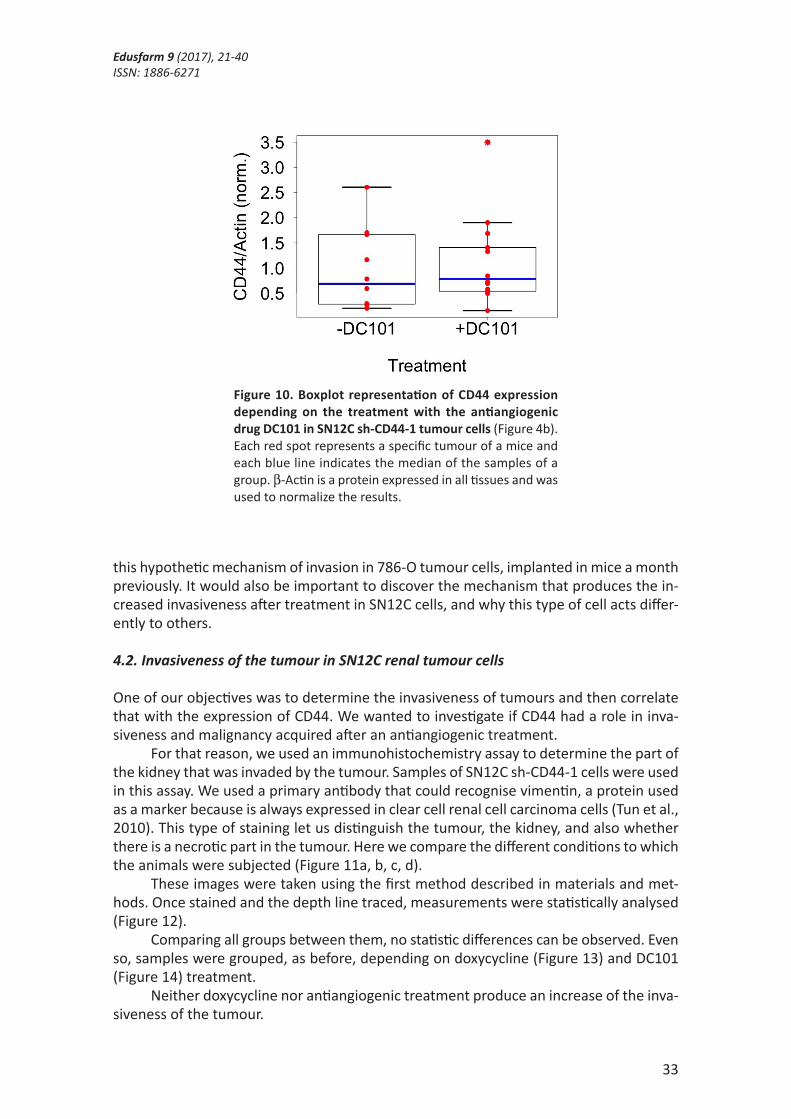
When the SN12C sh-CD44-1 cells are treated with or without the DC101 antiangio-genic drug, there was no significant differences between the groups (p>0.05), consistent with results from NS tumours (Figure 10).
With all these results, we can suspect that our hypothesis is not valid. But, as we said before, more analysis should be done with this type of cells, and also with others. Tumours are very heterogeneous, and a mechanism that works for one type of cell tu-mour is not true for another cell type. Therefore, it is important to continue to investi-gate if this hypothesis is true in other cell types. The next step would be to investigate
Figure 8. Boxplot representation of CD44 expression depending on the treatment of SN12C sh-CD44-1 tumour cells (Figure 4b). Samples are grouped depending on the treatment that mice received. Each red spot represents a determinate mice and each blue line indicates the median of the samples belonging to a specific treatment group. β-Actin is a protein expressed in all tissues and was used to normalize the results. (**) p<0.01.
Figure 9. Boxplot representation of CD44 expression depending on the treatment with doxycycline in SN12C sh-CD44-1 tumour cells (Figure 4b). Each red spot represents a specific tumour of a mice and each blue line indicates the median of the samples of a group. β-Actin is a protein ex-pressed in all tissues and was used to normalize the results. (****) p<0.0001.
33
Edusfarm 9 (2017), 21-40ISSN: 1886-6271
this hypothetic mechanism of invasion in 786-O tumour cells, implanted in mice a month previously. It would also be important to discover the mechanism that produces the in-creased invasiveness after treatment in SN12C cells, and why this type of cell acts differ-ently to others.
4.2. Invasiveness of the tumour in SN12C renal tumour cells
One of our objectives was to determine the invasiveness of tumours and then correlate that with the expression of CD44. We wanted to investigate if CD44 had a role in inva-siveness and malignancy acquired after an antiangiogenic treatment.
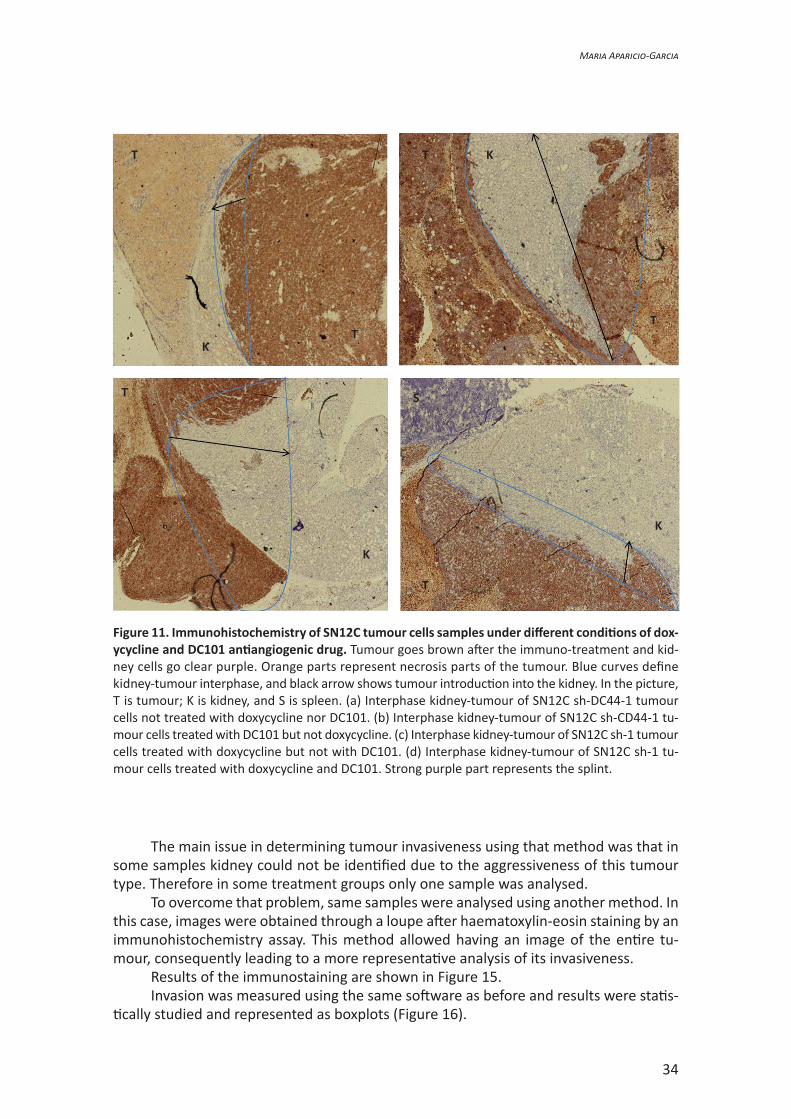
For that reason, we used an immunohistochemistry assay to determine the part of the kidney that was invaded by the tumour. Samples of SN12C sh-CD44-1 cells were used in this assay. We used a primary antibody that could recognise vimentin, a protein used as a marker because is always expressed in clear cell renal cell carcinoma cells (Tun et al., 2010). This type of staining let us distinguish the tumour, the kidney, and also whether there is a necrotic part in the tumour. Here we compare the different conditions to which the animals were subjected (Figure 11a, b, c, d).
These images were taken using the first method described in materials and met-hods. Once stained and the depth line traced, measurements were statistically analysed (Figure 12).
Comparing all groups between them, no statistic differences can be observed. Even so, samples were grouped, as before, depending on doxycycline (Figure 13) and DC101 (Figure 14) treatment.
Neither doxycycline nor antiangiogenic treatment produce an increase of the inva-siveness of the tumour.
Figure 10. Boxplot representation of CD44 expression depending on the treatment with the antiangiogenic drug DC101 in SN12C sh-CD44-1 tumour cells (Figure 4b). Each red spot represents a specific tumour of a mice and each blue line indicates the median of the samples of a group. β-Actin is a protein expressed in all tissues and was used to normalize the results.
34
Maria Aparicio-Garcia
The main issue in determining tumour invasiveness using that method was that in some samples kidney could not be identified due to the aggressiveness of this tumour type. Therefore in some treatment groups only one sample was analysed.
To overcome that problem, same samples were analysed using another method. In this case, images were obtained through a loupe after haematoxylin-eosin staining by an immunohistochemistry assay. This method allowed having an image of the entire tu-mour, consequently leading to a more representative analysis of its invasiveness.
Results of the immunostaining are shown in Figure 15.Invasion was measured using the same software as before and results were statis-
tically studied and represented as boxplots (Figure 16).
T
TT
T
T
T S
K
K
K
K
Figure 11. Immunohistochemistry of SN12C tumour cells samples under different conditions of dox-ycycline and DC101 antiangiogenic drug. Tumour goes brown after the immuno-treatment and kid-ney cells go clear purple. Orange parts represent necrosis parts of the tumour. Blue curves define kidney-tumour interphase, and black arrow shows tumour introduction into the kidney. In the picture, T is tumour; K is kidney, and S is spleen. (a) Interphase kidney-tumour of SN12C sh-DC44-1 tumour cells not treated with doxycycline nor DC101. (b) Interphase kidney-tumour of SN12C sh-CD44-1 tu-mour cells treated with DC101 but not doxycycline. (c) Interphase kidney-tumour of SN12C sh-1 tumour cells treated with doxycycline but not with DC101. (d) Interphase kidney-tumour of SN12C sh-1 tu-mour cells treated with doxycycline and DC101. Strong purple part represents the splint.

35
Edusfarm 9 (2017), 21-40ISSN: 1886-6271
All groups compared do not show statistical differences between them, and when compared depending on the treatment (doxycycline or DC101) statistical differences were not observed either (Figure 17 & Figure 18).
Both methods to determine the invasiveness were used to avoid method errors, because it was not easy to find a reliable method. As shown in boxplots, both methods presented the same results, which was positive.
Nevertheless, our hypothesis of increased invasiveness after antiangiogenic treat-ment was not validated in the SN12C tumour model.
Figure 12. Boxplot representation of tumour depth into kidney depending on the treat-ment of SN12C sh-CD44-1 tumour cells. Samples are grouped depending on the treatment that mice received. Each red spot represents a determinate mice and each blue line indicates the median of the samples belonging to a specific treatment group. Results were normalized by tumour weight.
Figure 13. Boxplot representation of tumour depth into kidney depending on the treatment with doxycycline in SN12C sh-CD44-1 tumour cells. Each red spot represents a specific tumour of a mice and each blue line indicates the medi-an of the samples of a group. Results were nor-malized by tumour weight.
Figure 14. Boxplot representation of tumour depth into kidney depending on the treatment with DC101 antiangiogenic drug in SN12C sh-CD44-1 tumour cells. Each red spot represents a specific tumour of a mice and each blue line indi-cates the median of the samples of a group. Re-sults were normalized by tumour weight.

36
Maria Aparicio-Garcia
We interpret that, probably, the behaviour of this tumour was not as we thought and it was a type for which, after antiangiogenic treatment, invasiveness was not increased, as was reported in other unpublished studies in the laboratory.
4.3. Distribution of CD44 in Ren99 renal tumour cells
Another feature of the renal tumour cells we wanted to investigate was the distribution of CD44 in the tumour. We suspected that CD44 was mostly expressed in the front be-
K
K
K
K
TT
T
T
Figure 15. Immunohistochemistry of SN12C tumour cells samples under different conditions of dox-ycycline and DC101 antiangiogenic drug. Tumour goes clear pink after the immuno-treatment and kidney cells go purple. Red and yellow curves define kidney-tumour interphase, and black arrow shows tumour introduction into the kidney. In the picture, T is tumour and K is kidney. (a) Interphase kid-ney-tumour of SN12C sh-DC44-1 tumour cells not treated with doxycycline nor DC101. (b) Interphase kidney-tumour of SN12C sh-CD44-1 tumour cells treated with DC101 but not doxycycline. (c) Inter-phase kidney-tumour of SN12C sh-1 tumour cells treated with doxycycline but not with DC101. (d) In-terphase kidney-tumour of SN12C sh-1 tumour cells treated with doxycycline and DC101.

37
Edusfarm 9 (2017), 21-40ISSN: 1886-6271
tween the tumour and the kidney and in the periphery of the tumour, because these are the principal invasive zones. For that reason, we stained samples by means of an immu-nohistochemistry assay.
For this experiment, we used Ren99 ccRCC tumour samples, that came from a ce-rebral metastasis of renal tumour Ren13. Importantly, this tumour type has been shown to increase local invasion and metastasis upon antiangiogenic treatment in mice (unpub-lished data from the laboratory).
Since our principal aim was to detect CD44, we used a mouse anti-human CD44 antibody as the primary antibody and we used an anti-mouse antibody as secondary
Figure 16. Boxplot representation of tumour depth into kidney depending on the treatment of SN12C sh-CD44-1 tumour cells. Samples are grouped depending on the treatment that mice received. Each red spot represents a determinate mice and each blue line indicates the median of the samples be-longing to a specific treatment group. Results were normalized by tumour weight.
Figure 17. Boxplot representation of tumour depth into kidney depending on the treatment with doxycycline in SN12C sh-CD44-1 tumour cells. Each red spot represents a specific tumour of a mice and each blue line indicates the median of the samples of a group. Results were normalized by tumour weight.
Figure 18. Boxplot representation of tumour depth into kidney depending on the treatment with DC101 antiangiogenic drug in SN12C sh-CD44-1 tumour cells. Each red spot represents a specific tumour of a mice and each blue line indi-cates the median of the samples of a group. Re-sults were normalized by tumour weight.

38
Maria Aparicio-Garcia
antibody. The result of this series of incubations are evident in a particular staining where cellular nucleus, tumoural and renal, goes bluish purple, and protein CD44 goes brown. Furthermore, murine stroma is not stained by the assay.
We analysed tumours of mice that did not receive treatment and tumours of mice treated with DC101. As we can see in the following images of the front between the tu-mour and the kidney (Figure 19), in the treated samples the staining is more intense than in the control ones.
If we take a look to the periphery of the tumour (Figure 20a, b), we can observe the same pattern as before. The expression of CD44 in the treated sample of Ren99 tumour
a) b)K
T
T
K
Figure 19. Immunohistochemistry staining of Ren99 cell tumour samples. The nucleii of the tu-moural and kidney cells go purple after the immunohistochemistry treatment, and CD44 protein be-came brown. Tumour cells and kidney cell can be differentiated by their shape: tumour cells are more irregular and grow more separately; renal cells are more circular and grow more joined. In the pic-ture, T is tumour and K is kidney. (a) Front between kidney and tumour cells of Ren99 control tumour sample. (b) Front between kidney and tumour cells of Ren99 tumour cells treated with CD101 anti-angiogenic drug.
a) b)T T
Figure 20. Immunohistochemistry staining of Ren99 cell tumour samples. The nucleus of the tu-moural cells goes purple after the immunohistochemistry treatment, and CD44 protein became brown. In the picture, T is tumour. (a) Periphery of tumour cells of Ren99 control tumour sample. (b) Periph-ery of tumour cells of Ren99 tumour cells treated with CD101 antiangiogenic drug.

39
Edusfarm 9 (2017), 21-40ISSN: 1886-6271
cells with DC101 (Figure 20b) is notably more intense than in the control samples (Fig-ure 20a), and again our hypothesis was confirmed.
Observing the middle of the tumour (Figure 21), the staining is less intense in both cases, control and treated samples. As we expected, the middle of the tumour is not an in-vasive area, and that is why the expression of CD44 is not as intense as in the other samples.
5. Conclusions
After completing all experiments and according to our objectives, our conclusions are:
• In silencing and non-silencing SN12C tumour cells, the expression of CD44 pro-tein in antiangiogenic treated mice with DC101 is not higher than in non-treat-ed mice.
• Silencing vector of CD44 protein is an effective method of inducing the reduc-tion of that protein expression by doxycycline.
• There is no relation between tumour invasiveness and expression of CD44 pro-tein in SN12C tumour cells.
• SN12C tumour cells do not increase in malignancy after antiangiogenic treatment.• In Ren 99 tumour cells, CD44 protein is mainly observed in the front kidney-tu-
mour and in the periphery.
6. Acknowledgments
I would like to thank Oriol Casanovas for giving me the opportunity of a stay in his anti-angiogenic research laboratory in IDIBELL, letting me participate in one of his projects and be part of a research group.
I would also like to thank Jordi Senserrich, a postdoc deeply involved in studying the role of CD44 in tumour cells after antiangiogenic treatment, and who shared with me all his experience in the laboratory.
a) b)
T T
Figure 21. Immunohistochemistry staining of Ren99 cell tumour samples. The nucleus of the tu-moural cells goes purple after the immunohistochemistry treatment, and CD44 protein became brown. In the picture, T is tumour. (a) Middle of tumour cells of Ren99 control tumour sample. (b) Middle of tumour cells of Ren99 tumour cells treated with CD101 antiangiogenic drug.
40
Maria Aparicio-Garcia
Also, I appreciate all the help from the other postdocs and PhD students when I needed it – they shared their knowledge with me and showed me the meaning of being a researcher.
Thank you to Jordi Morales Dalmau for his patience and advice, and for encourag-ing me to continue in my research.
7. Bibliography
Basakran, N.S. (2015), “CD44 as a potential diagnostic tumor marker”. Saudi Medical Journal, 36(3), pp. 273-279.
Bergers, G. and Hanahan, D. (2008), “Modes of resistance to anti-angiogenic therapy”. Nature Re-views, 8.
Burry, R.W. (2011), “Controls for Immunocytochemistry: An Update”. Journal of Histochemistry & Cytochemistry.
Casanovas, O., et al. (2005), “Drug resistance by evasion of antiangiogenic targeting of VEGF signal-ing in late-stage pancreatic islet tumors”. Cancer Cell.
Jiménez-Valerio, G., and Casanovas, O. (2013), “Anti-angiogenic therapy for cancer and the mecha-nisms of tumor resistance Angiogenesis in tumor development”. Contributions to Science, 9, pp. 67-73.
Lee, C.M., et al. (2010), “Targeted molecular imaging of VEGF receptors overexpressed in ischemic microvasculature using chitosan-DC101 conjugates”. Journal of Biomedical Materials Research - Part A.
Linehan, W.M. and Zbar, B. (2004), Focus on kidney cancer. Cancer Cell.Mahmood, T. and Yang, P.C. (2012), “Western blot: Technique, theory, and trouble shooting”. North
American Journal of Medical Sciences.Mikami, S., et al. (2015), “Expression of TNF-α and CD44 is implicated in poor prognosis, cancer cell
invasion, metastasis and resistance to the sunitinib treatment in clear cell renal cell carcino-mas”. International Journal of Cancer.
Misra, S., et al. (2015), “Interactions between Hyaluronan and its Receptors (CD44, RHAMM) Reg-ulate the Activities of Inflammation and Cancer”. Frontiers in Immunology, 6(May).
Moserle, L.; Jiménez-Valerio, G. and Casanovas, O. (2014), “Antiangiogenic therapies: Going beyond their limits”. Cancer Discovery.
National Cancer Institute. Available at: https://www.cancer.gov. Naor, D., et al. (2015), “The role of CD44 in disease pathophysiology and targeted treatment”. Fron-
tiers in Immunology.Negi, L.M.; Talegaonkar, S.; Jaggi, M.; Ahmad, F.J.; Iqbal, Z.; Khar, R.K. (2012), “Role of CD44 in tu-
mour progression and strategies for targeting”. Journal of Drug Targeting.Sociedad Española de Oncología Médica. Available from: http://www.seom.orgSpratlin, J. (2011), “Ramucirumab (IMC-1121B): Monoclonal antibody inhibition of vascular endo-
thelial growth factor receptor-2”. Current Oncology Reports, 13(2), pp. 97-102.Tun, H.W., et al. (2010), “Pathway signature and cellular differentiation in clear cell renal cell carci-
noma”. PLoS ONE.World Health Organization. Available from: http://www.euro.who.int.