rohan fisher - charles darwin universitylearnline.cdu.edu.au/units/ses101/env208/w7_files/gis...
TRANSCRIPT

Rohan Fisher

Who am I
• 25 years GIS/RS
– CSIRO Canberra
– NTG Alice Springs/Darwin
– Consultant Tiwi, NAILSMA…
– CDU 11 years
• Eastern Indonesia
• Darwin Centre for Bushfire Research

• For me spatial sciences necessarily require cross
disciplinary engagement. Maps have no meaning without (multiple) interpretation(s)
• Almost every field of research has a spatial component.


What do I do
• Eastern Indonesia
– NRM
– Health Information
• Savanna fire information
• Post Graduate supervision

MODIS IMAGE
• NRM
– Satellite imagery for fire 2003
– Spatial data NRM
– Small scale (Artisinal) mining
• West Timor
• Sulawesi

• Environmental • Erosion/Landslides
• Degradation/Sedimentation
• Health • Deaths from mine collapse
• Livelihoods • Livelihoods shifting from
susbsistance farming to small scale extractive mining.
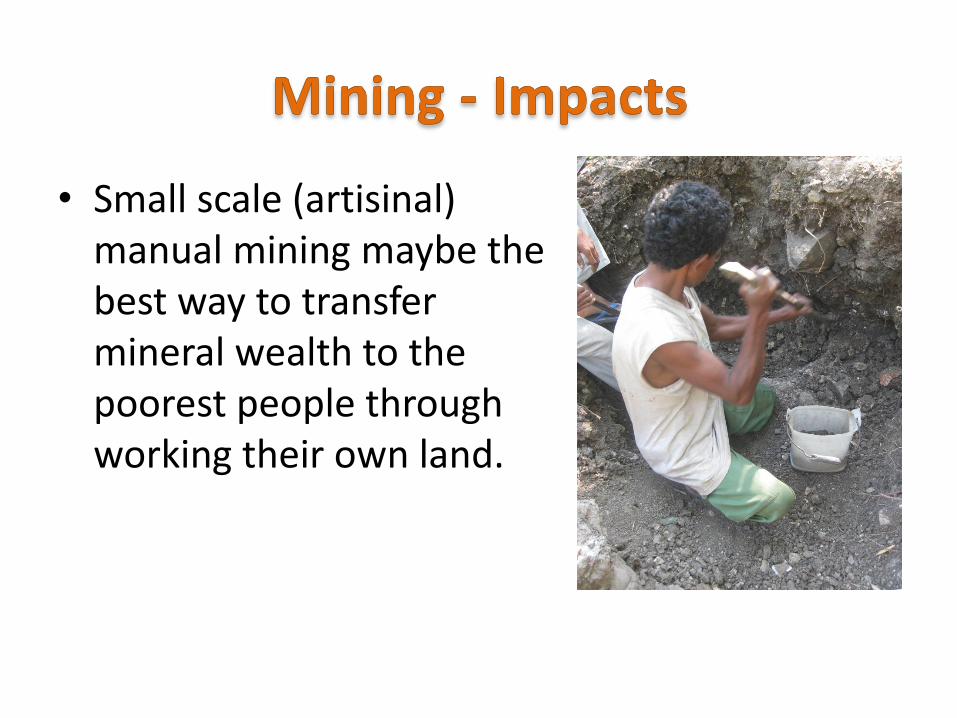
• Small scale (artisinal) manual mining maybe the best way to transfer mineral wealth to the poorest people through working their own land.

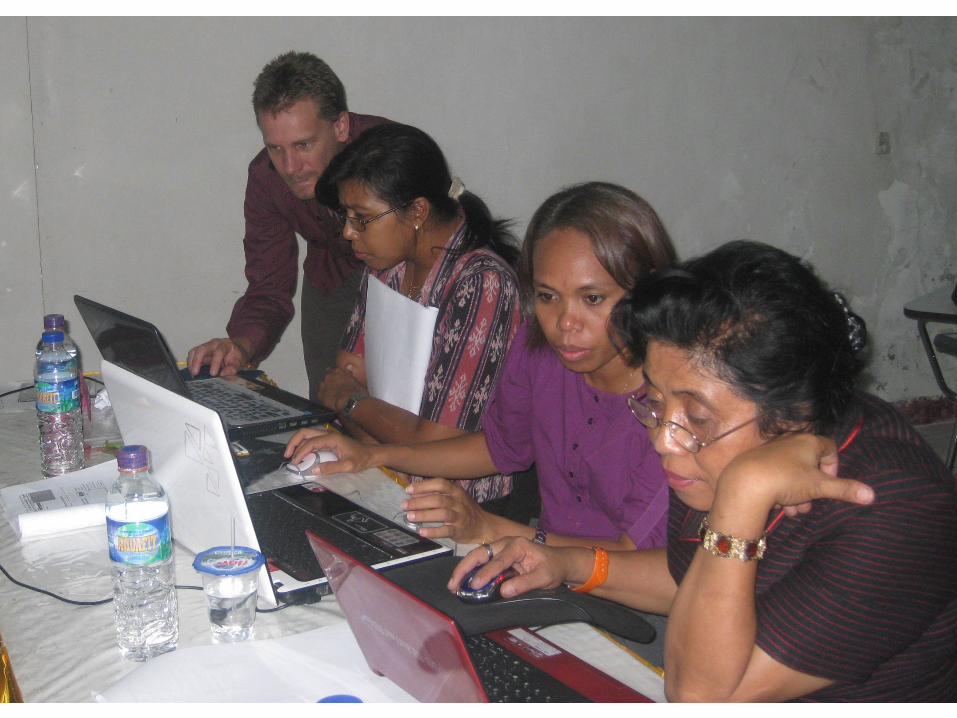
Proyek ini mulai dengn Cerita Cerita:
We have a problem!
Big impacts!
How big?
Very Big!


Belu 8
Kota Kupang 3
Kupang 25
Timor Tengah Selatan 66
Timor Tengah Utara 14
116
0
20
40
60
80


0
2
4
6
8
10
12
HutanLindung
HutanProduksi
Hutanproduksikonversi
HutanProduksiTerbatas
Kawasan hutan
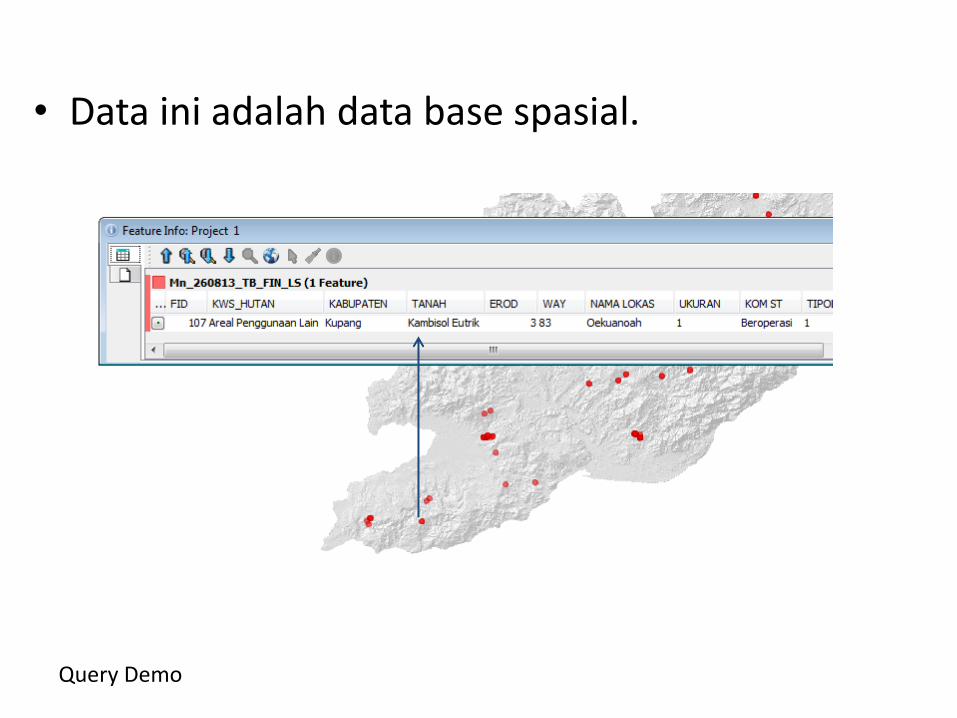
• Data ini adalah data base spasial.
Query Demo
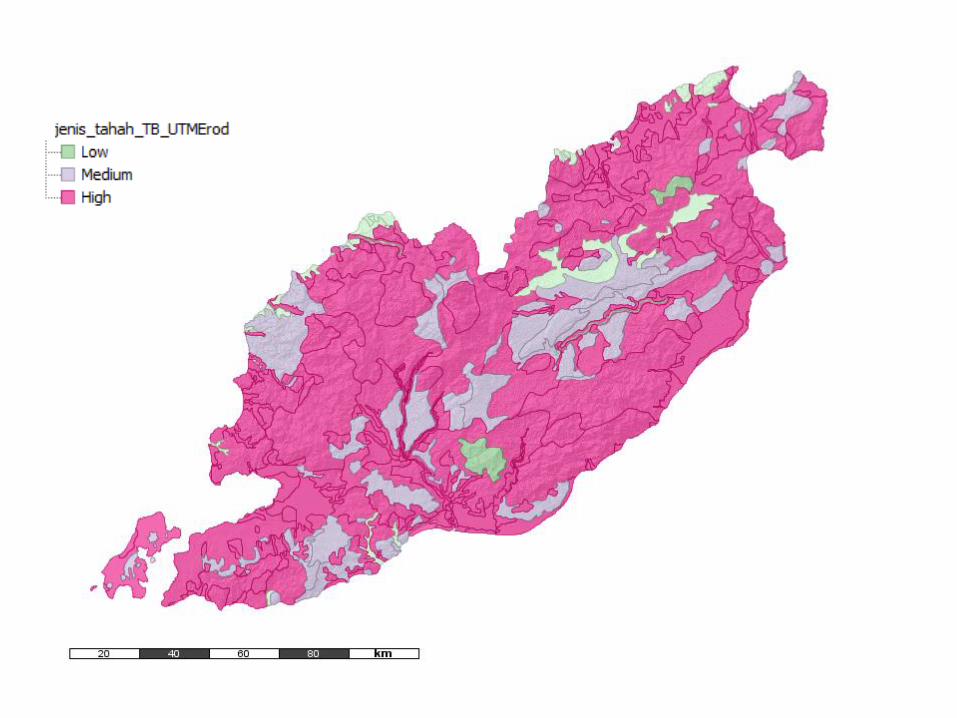

Lokasi risiko erosi tinggi
Kemirinagan>5% Luas > 50m2
Erodibilitas = 3
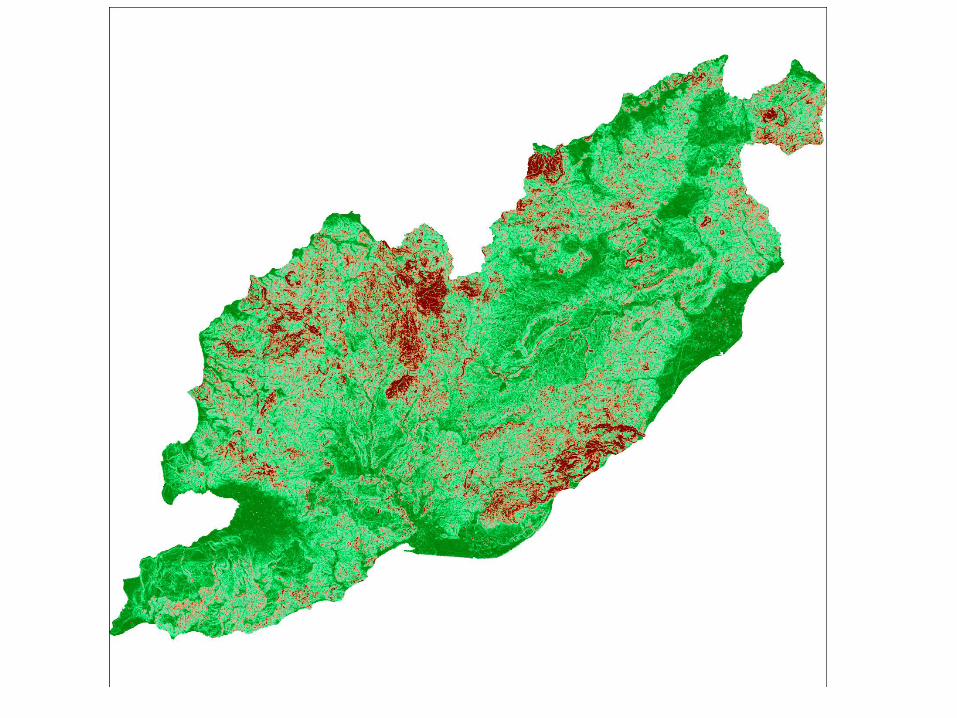
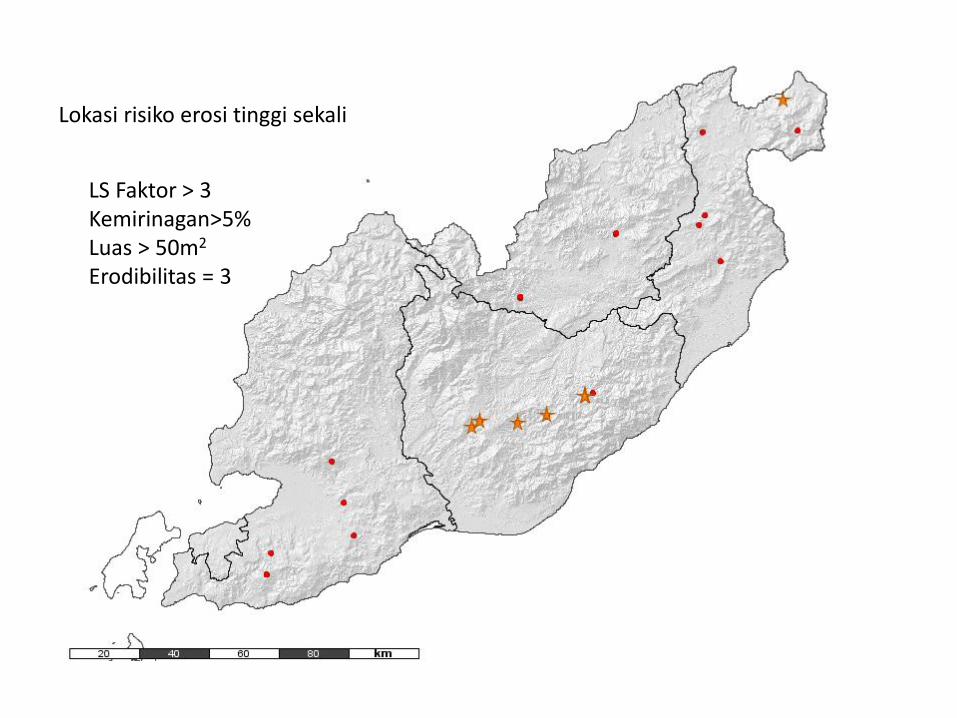
Lokasi risiko erosi tinggi sekali
LS Faktor > 3 Kemirinagan>5% Luas > 50m2
Erodibilitas = 3

ASMG Sulawesi
• Bombana
– Scale
– Sediment and environmental mercury
– Monitoring


• This landcover map produced as a result of project training shows the scale and extent of the mining (Red) and it’s proximity rice growing areas (Yellow) and an extensive aquaculture region (Dark Blue)
Map produced by Iradaf Mandaya

• This map, produced as a result of project training shows, the modelled potential sediment flow from the gold mining region. It is clear from this and the previous map that run off from the mining areas goes straight through to rice growing and aqua culture regions.
Map produced by Iradaf Mandaya

Health projects (2008-2013)
1. Mapping Health Indicators
2. Field Data collection
3. Access Modelling
4. SMS health reporting
• Reliable social, economic and health data are essential for sustainable development in eastern Indonesia.
• In eastern Indonesia through decentralisation, there has been a devolution of budgeting and planning power to the Kabupaten level without a corresponding provision of the base data and analysis skills for required for good decision making.

Data Collection ‘The experts’
Data Analysis
Understanding Data
Action
Data collection and analysis at the local level can increase data understanding and data quality.

Goal Empower local health professionals to analyse and understand the data they collect to guide better (more accurate) data collection to inform service delivery and program development at the local and national level.
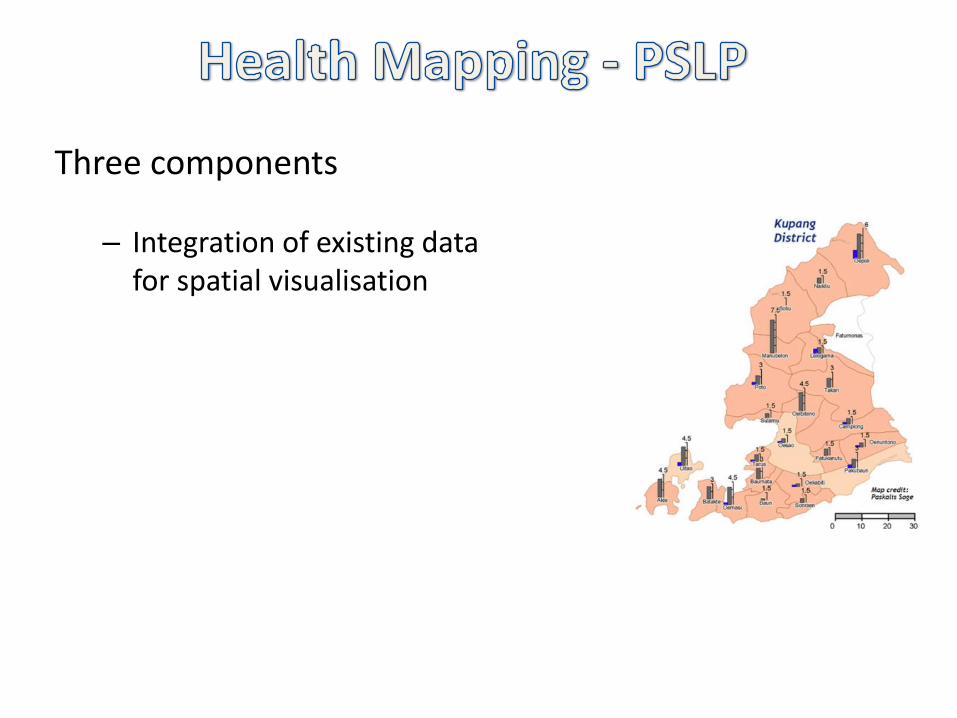
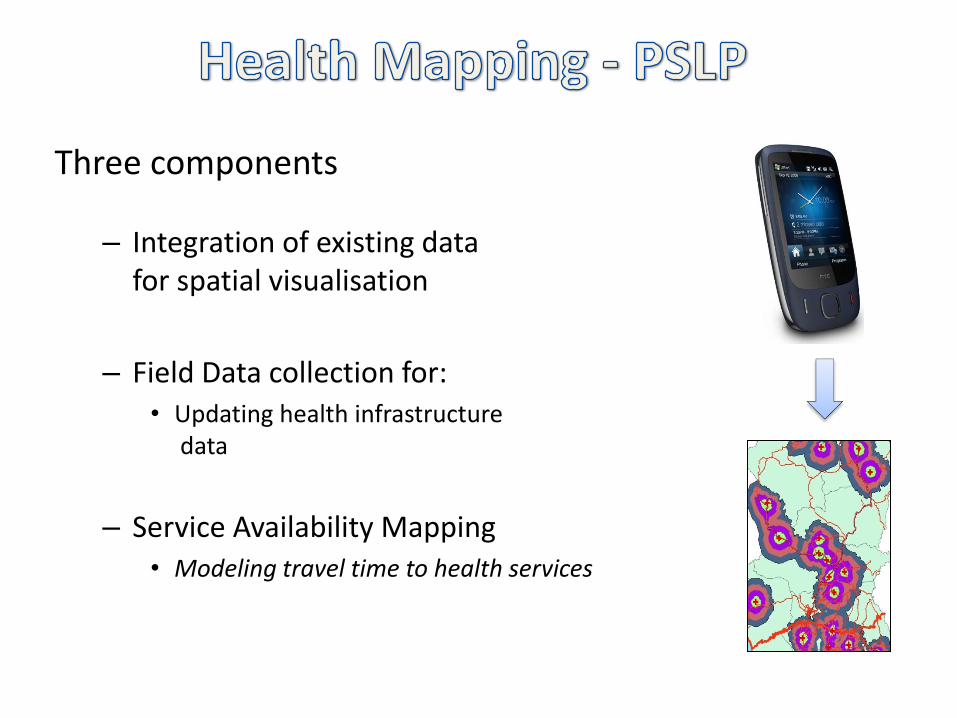
Three components
– Integration of existing data for spatial visualisation
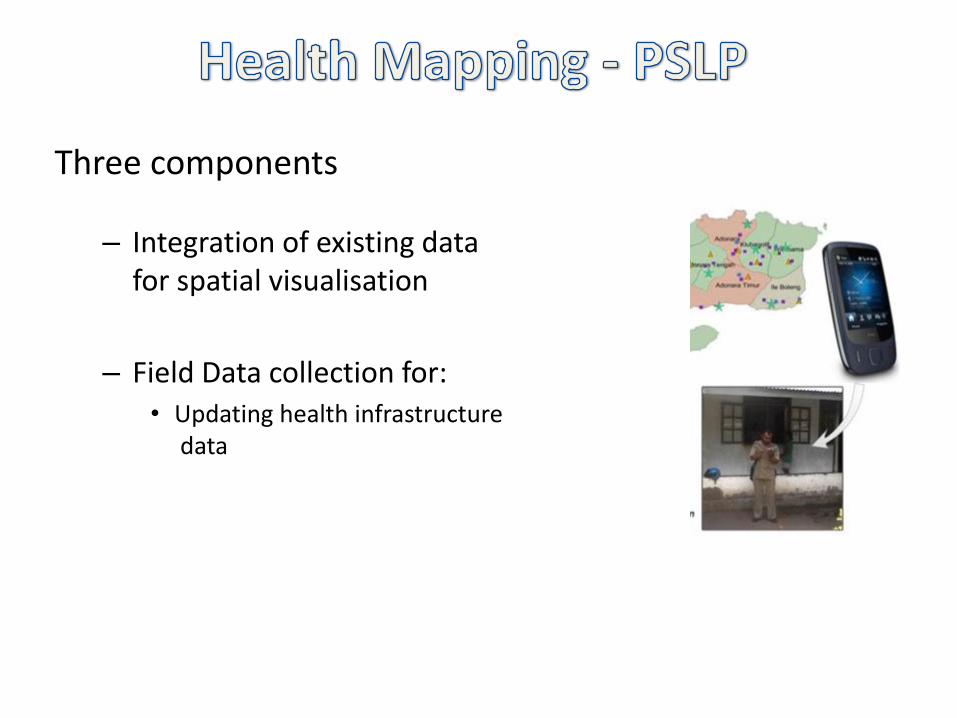
Three components
– Integration of existing data for spatial visualisation
– Field Data collection for: • Updating health infrastructure
data
Three components
– Integration of existing data for spatial visualisation
– Field Data collection for: • Updating health infrastructure
data
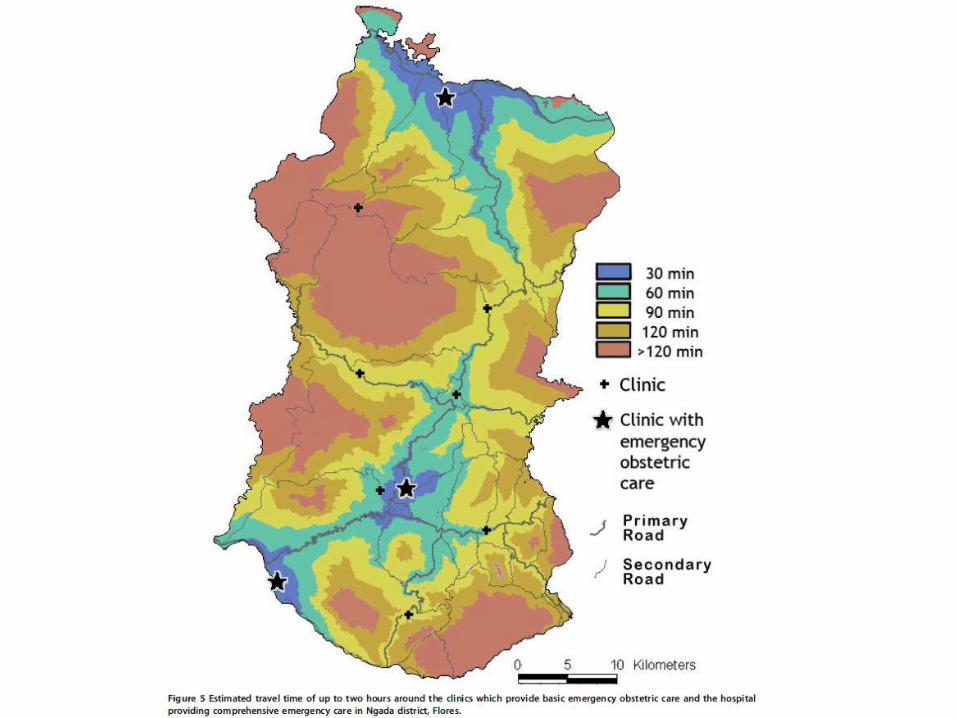
– Service Availability Mapping • Modeling travel time to health services


39
SERVICE AVAILABILITY MAPPING (SAM)
Travel Time Puskesmas
• Last 10 year produced Kakadu’s fire mapping.
• Last 4 years have produced the mapping for NAFI and as the base dataset for the CFI
• CFI as developed at the DCBR focused on (1) Indigenous livelihood opportunities (2) Biodiversity conservation (3) carbon abatement.

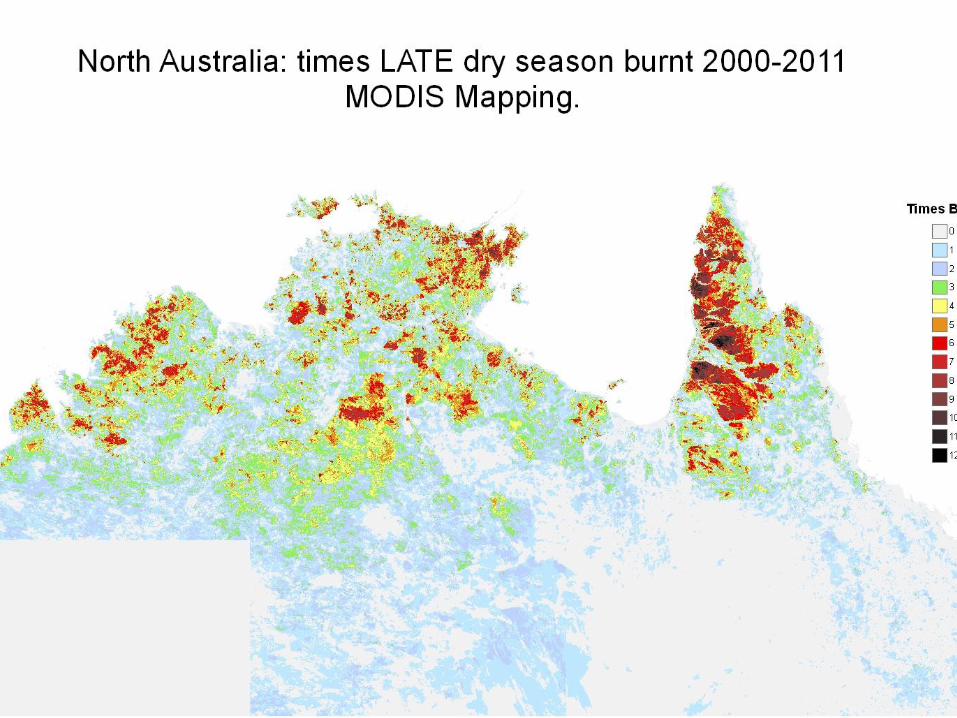
• The Savanna Burning methodology involves the use of early dry season strategic prescribed burning to reduce the area and severity of tropical savanna affected by fire.
• Fire history and vegetation maps are used to determine the 10 year baseline emissions from any property implementing an abatement project.
• Ongoing fire mapping from NAFI is then used to determine emissions under the new fire management regime and calculate greenhouse gas emissions abatement benefits.
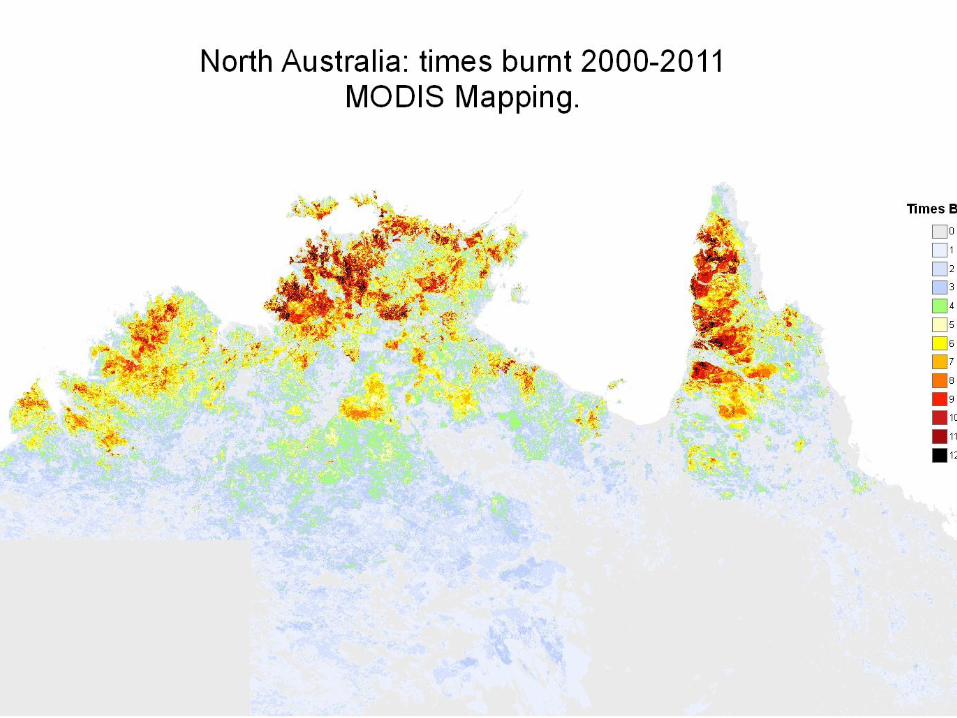
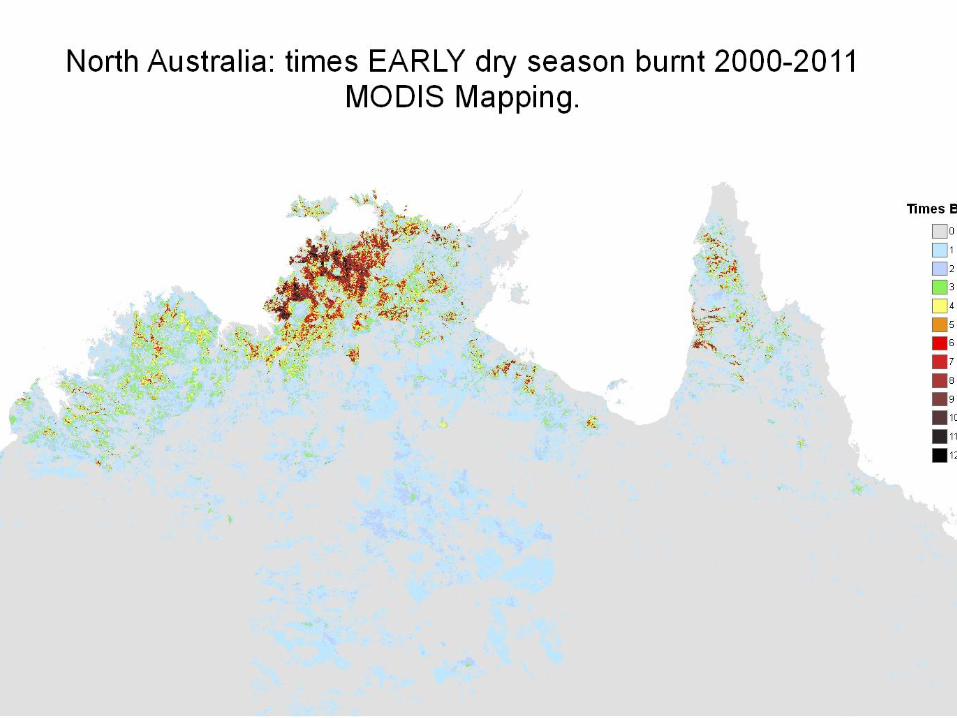
LDS_MODIS_00-11
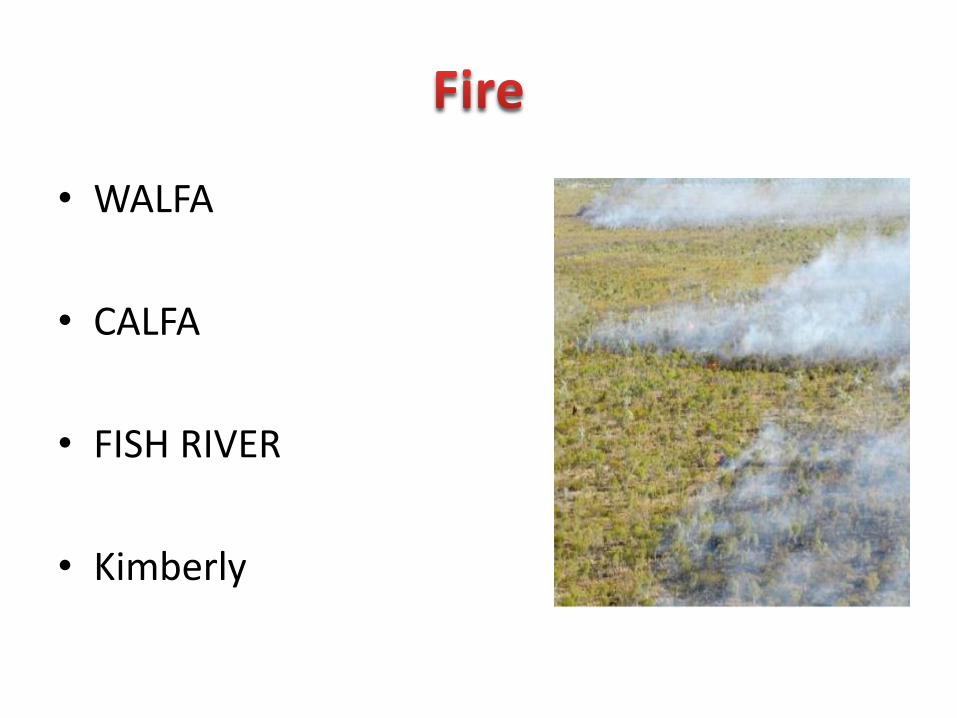
• WALFA
• CALFA
• FISH RIVER
• Kimberly

NAFI
Beyond NAFI -Alternative fire data and 3D fire
simulations

Core Duties- NAFI
• Weekly NAFI fire mapping NT/WA
• Liaising with QLD CYSF NAFI fire mapping
• Managing NAFI derived fire regime data
• Managing mapping methodology developments
• Responding to carbon project mapping requirements.
• Engaging with DCBR research activities
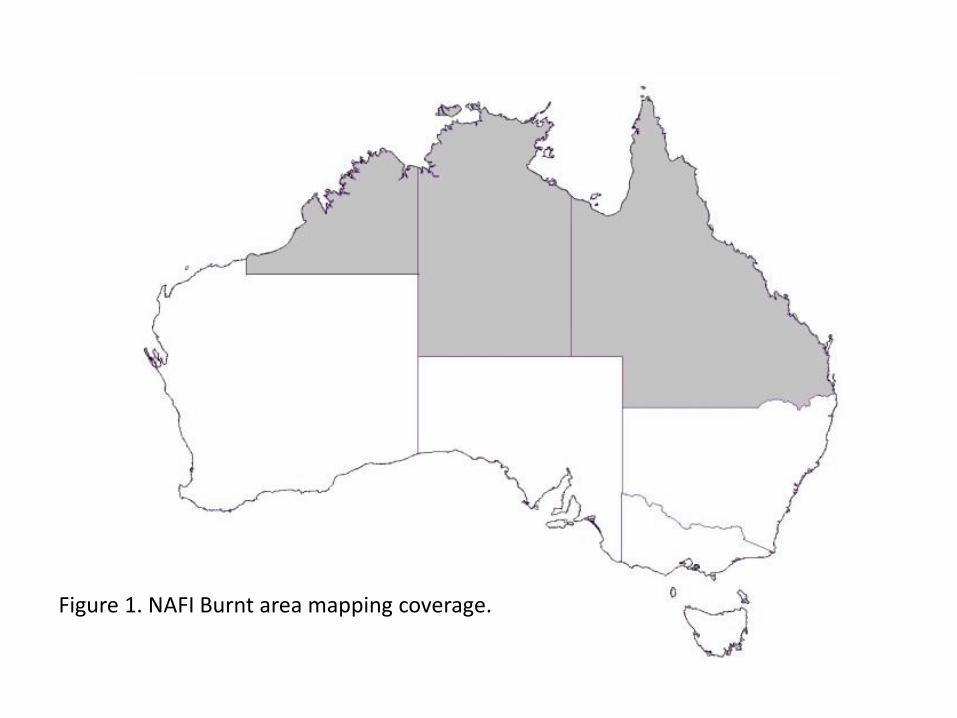
Figure 1. NAFI Burnt area mapping coverage.
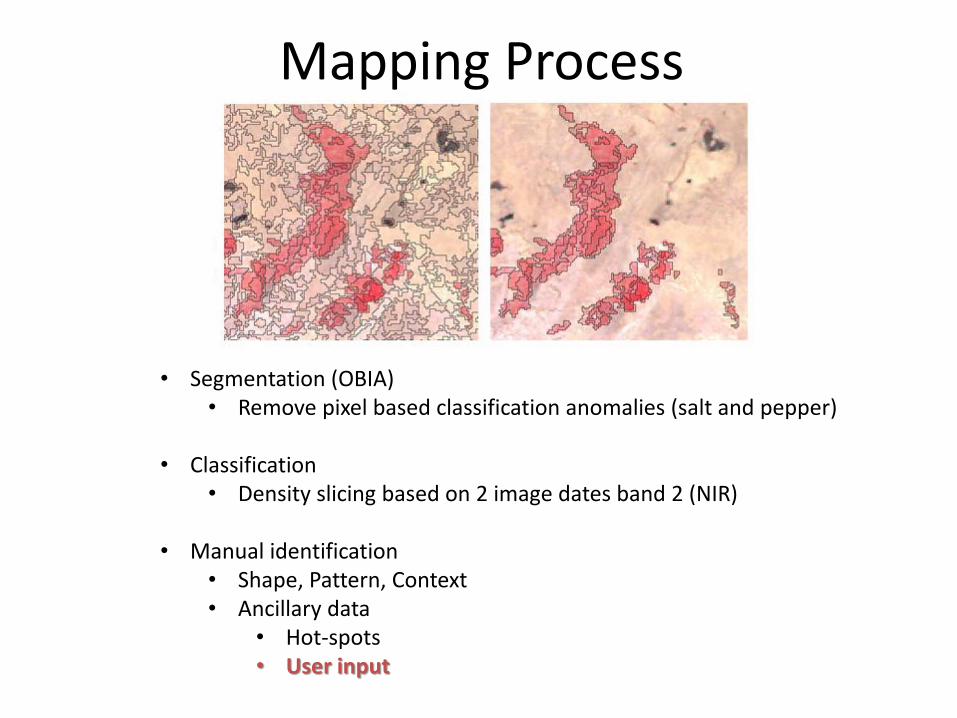
Mapping Process
• Segmentation (OBIA) • Remove pixel based classification anomalies (salt and pepper)
• Classification
• Density slicing based on 2 image dates band 2 (NIR)
• Manual identification • Shape, Pattern, Context • Ancillary data
• Hot-spots • User input

Mapping Process
• Mapping temporal scale • Every 1-2 weeks • Monthly mapping • Yearly double check • Ruled by cloud cover
• Validation • Annual areal transect data • For this chapter – LANDSAT
based comparison
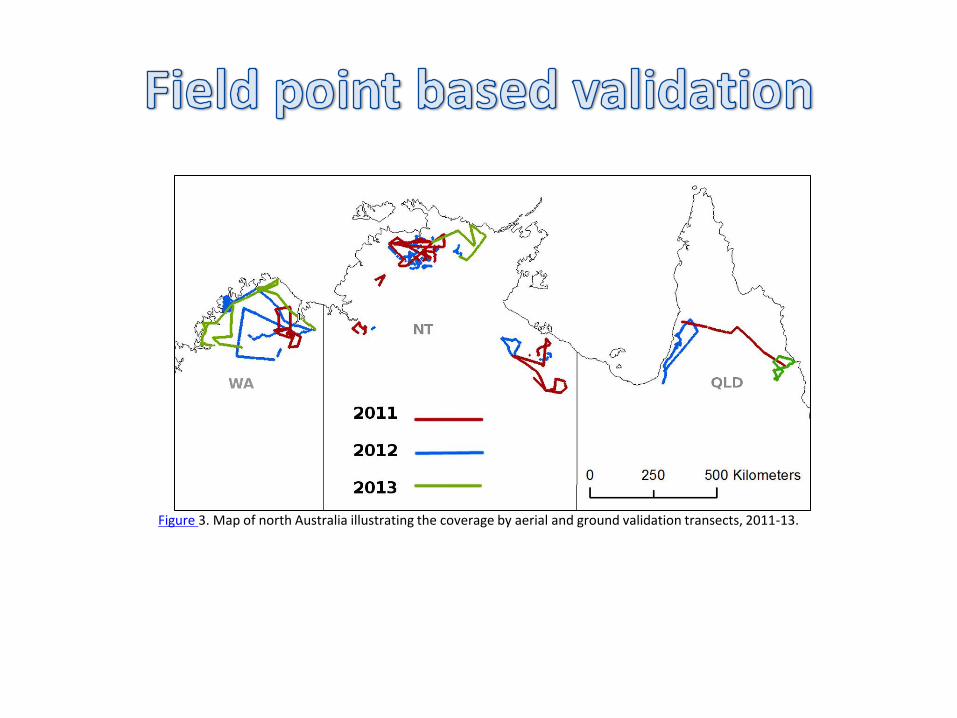
Figure 3. Map of north Australia illustrating the coverage by aerial and ground validation transects, 2011-13.

Error matrix assessment.
Year 2011 2012 2013 number of waypoints (n) 9,761 7,324 6,527 Overall accuracy 0.86 0.90 0.85 Burnt omission error 0.14 0.04 0.09 Burnt commission error 0.09 0.20 0.10 Unburnt omission error 0.06 0.14 0.12 Unburnt commission error 0.17 0.02 0.06 Kappa statistic 0.71 0.79 0.70

Land manger support activities
• Capacity building activities for landmagers
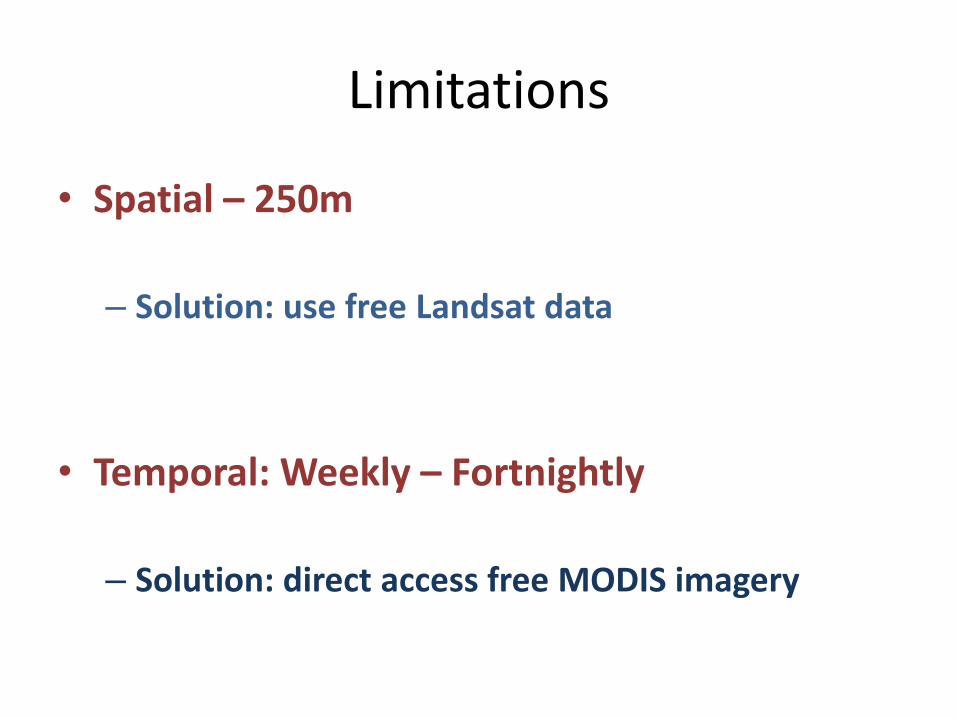
Limitations
• Spatial – 250m
– Solution: use free Landsat data
• Temporal: Weekly – Fortnightly
– Solution: direct access free MODIS imagery

Libra Development Seed download Go to the Libra development seed site at http://libra.developmentseed.org/.
Landsat data

MODIS
http://data.maitec.com.au/modis/modis-toa/

Image Visualisation
• Software
– SAGA GIS
– Free Open Source Software
– No installation
• Training material development • Screen shot video tutorials • Training manual
http://www.saga-gis.org/
• Software development collaboration with SAGA development team

Burnt area visualisation
• Hi-resolution Landsat 8 imagery – Fast simple image visualisation
– Assessing management burns
- MODIS – Near real-time data more
accurate than hot-spots
– Animating fire spread
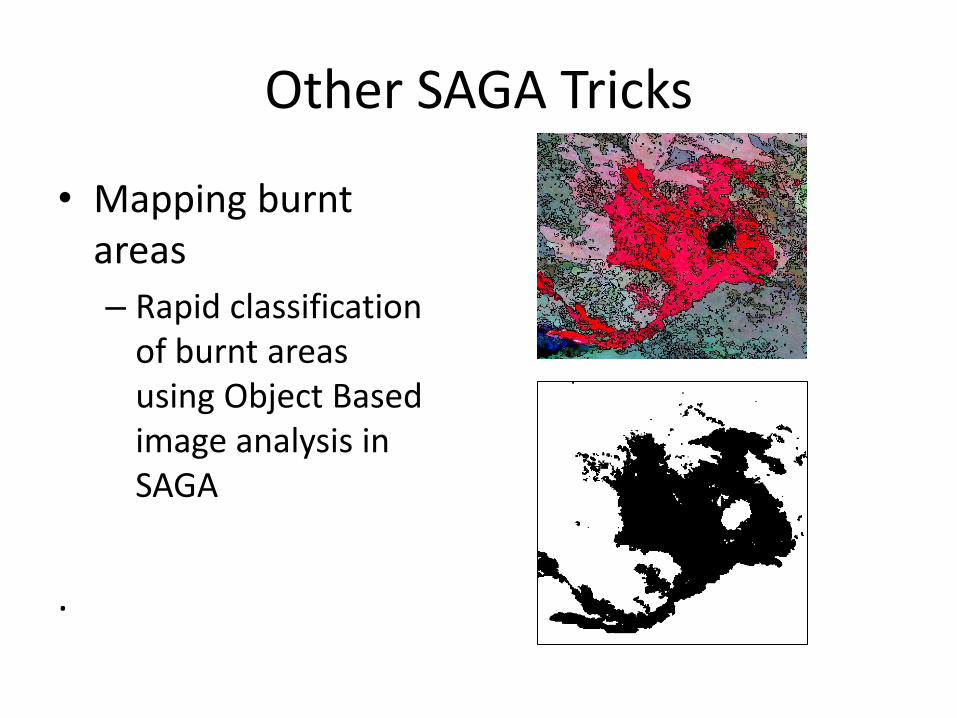
Other SAGA Tricks
• Mapping burnt areas
– Rapid classification of burnt areas using Object Based image analysis in SAGA
.
Other SAGA Tricks
• Exporting imagery from SAGA for field applications
– Using PDF maps with SAGA.

3D Interactive fire simulations
• Inspired by Sim Table – www.simtable.com
• Combined – Surface interactivity
– Agent based models (Fire spread)
– A sandpit
• Training support tool.

3D Interactive fire simulations
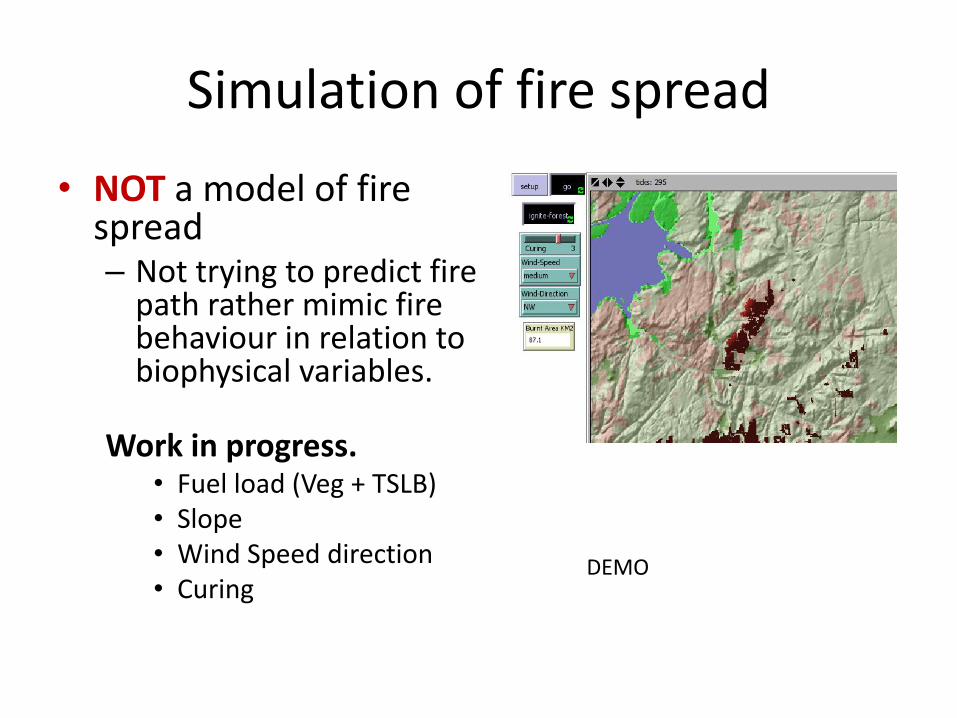
Simulation of fire spread
• NOT a model of fire spread – Not trying to predict fire
path rather mimic fire behaviour in relation to biophysical variables.
Work in progress.
• Fuel load (Veg + TSLB) • Slope • Wind Speed direction • Curing
DEMO

Sand
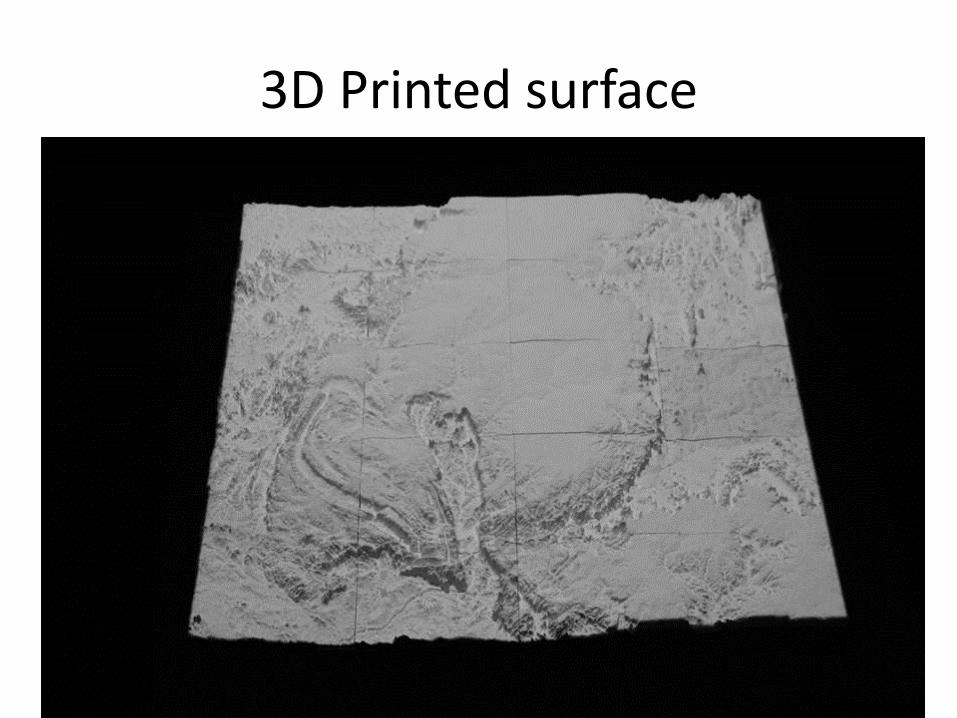
3D Printed surface
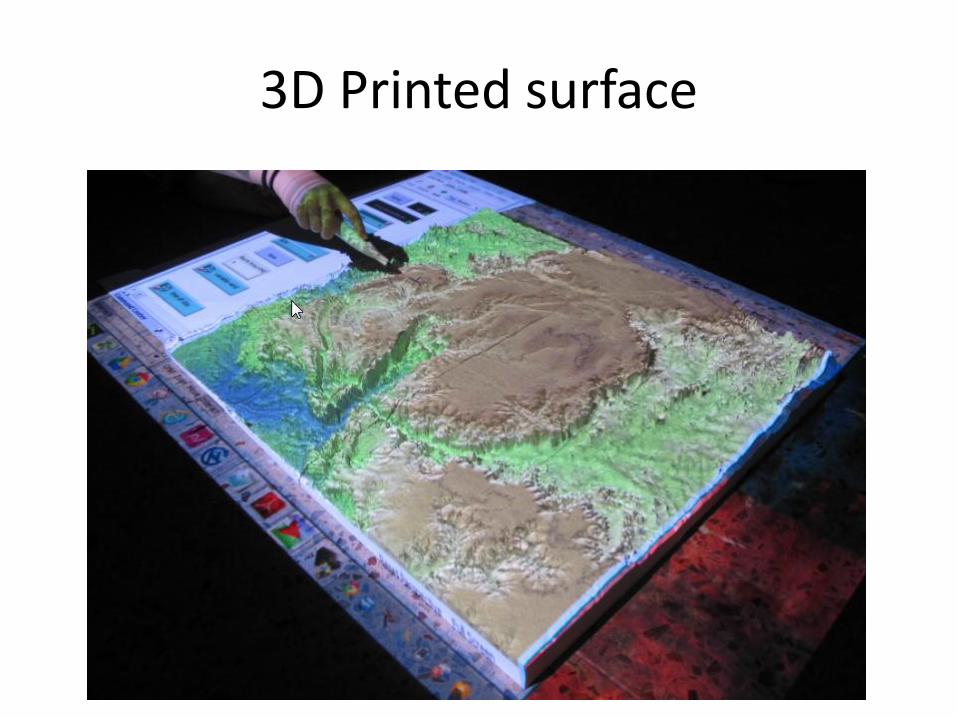
3D Printed surface

Simulation of fire spread
• Training/Gaming Tool – Looking to incorporate
• Measure of burning intensity
• Cost of chopper
• Burning efficiency
• ?
• rohanfisher.wordpress.com

• Sarah – Catchment Management - Sumba
• Kris – Biophysical assessment of Catchment West Timor
• Pia – tenure and rice production in West Timor/Particpatory mapping of marine protected areas.
• Frederika – Agent Based modelling of access to services – Nusa Tenngara Timor
• Abilio – Climate Change adaptation Timor Leste
• Participatory
• Open Source

• It’s free! • To use and distribute. Simple installation.
• Licensing costs is one of the major impediments to a broader uptake of GIS applications.
• It works. • Fits common spatial data standards
• Broad functionality
• Customisable
• Often easier to learn than proprietary packages.

• GIS has the potential to reduce or exacerbate
social inequities, to further concentrate power in
a techno-elite or to democratise information. It
all depends on who controls the information and
its analysis.
•Democratising GIS for local decision making
•Enabling better health data analysis at the clinic level.
•eg – forest management in Indonesia.

• Field data collection software • Cybertracker
• PDF Maps
• Vector mapping and analysis • Open Jump
• Quantumn GIS
• gvSIG
• Map Window
• Raster Vector Analysis software. • SAGA
• ILWIS
• SEGMENTATION - software

CyberTracker

• Java Based
• Very nice charting tools
• Good visualisation tools.
• My choice for our health project work.
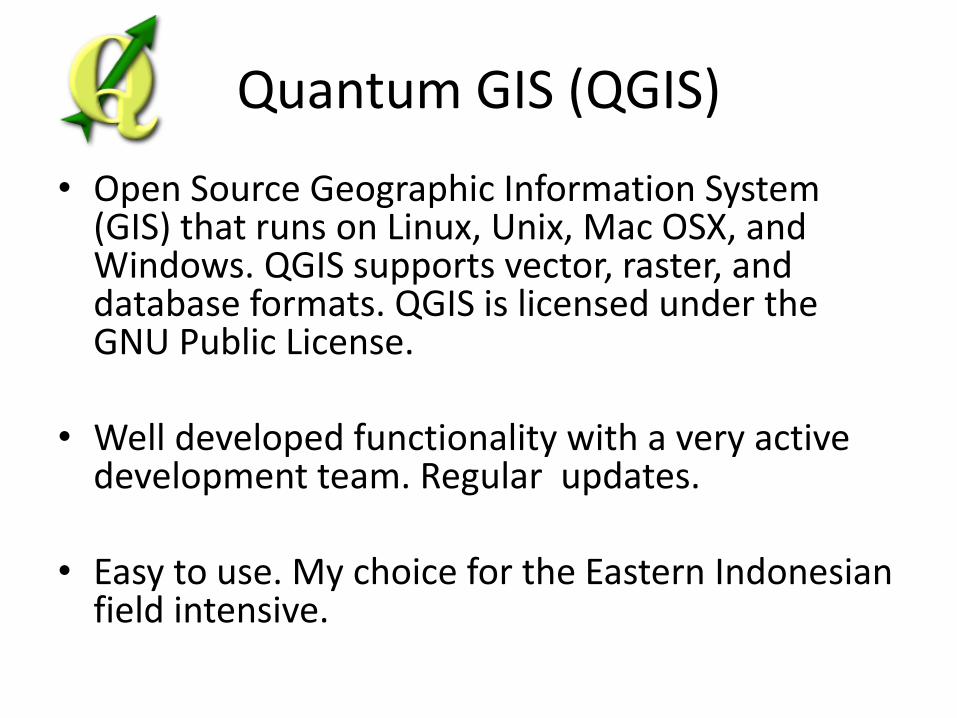
Quantum GIS (QGIS)
• Open Source Geographic Information System (GIS) that runs on Linux, Unix, Mac OSX, and Windows. QGIS supports vector, raster, and database formats. QGIS is licensed under the GNU Public License.
• Well developed functionality with a very active development team. Regular updates.
• Easy to use. My choice for the Eastern Indonesian field intensive.

• http://www.saga-gis.org