roger falcone physics department, uc berkeley advanced light source, lbnl 2008 warm dense matter...
TRANSCRIPT
Roger Falcone
Physics Department, UC BerkeleyAdvanced Light Source, LBNL
2008 Warm Dense Matter Winter School 2008 Warm Dense Matter Winter School January 10-16, 2008
Ultrafast Heating Experimentsand Diagnostics
Warm materials are dynamic
energy deposition of ~ one quanta per unit cell drives structural and other property changes that can be probed by time-resolved, x-ray scattering
a variety of quanta can be utilized to “heat” materials THz to far-IR directly drives phonon modes near-IR excites electrons from valence to conduction bands
with adjustable excess-energy that rapidly couples to other modes
optical to uv excites electronic transitions and charge transfer states
soft x-rays couple core levels to valence states hard x-rays penetrate and excite larger volumes
coupling of excitation to various modes is defined by the time-scale times << picoseconds can involve non-thermal processes
photochemistry, electron re-scattering times >> picoseconds involve thermal processes
mode diffusion, ablation consider… relevant scale length divided by relevant velocity
Warm materials are studied by pump-probe techniques
at a variety of facilities
small-scale laboratories provide intense, short-pulse lasers to create and probe warm (high-energy-density) materials
- probes include plasma x-ray sources, high-harmonic sources
intermediate-scale facilities include petawatt lasers, pulsed particle beams, x-ray synchrotrons,free-electron lasers, etc., and are widely accessible
large-scale facilities allow large volume studies to extreme high-energy-density conditions, but have limited access
- NIF megajoule laser, Vulcan PW laser, OMEGA kJ laser, pulsed power

Diamond High liquid
Low liquidGraphite
Molecular dynamics calculations predict:
high density liquid- mainly sp3 coordinated
and low density liquid:- mainly sp coordinated
An example of HEDS science: liquid carbon
Glosli, et al, PRL 82, 4659 (1999)

Phases of Carbon
Diamond
BC8 (P > 1100 GPa)- Body Centered Cubic with 8 atom basis
- Theoretical phase proposed in analogy with Si
- Semi-metallic, not yet found experimentally
Cubic- Metallic, not yet found experimentally
The goal is to study these phases under extreme conditions,
liquid phases and melting lines
QuickTime™ and aTIFF (LZW) decompressor
are needed to see this picture.
Liquid carbon
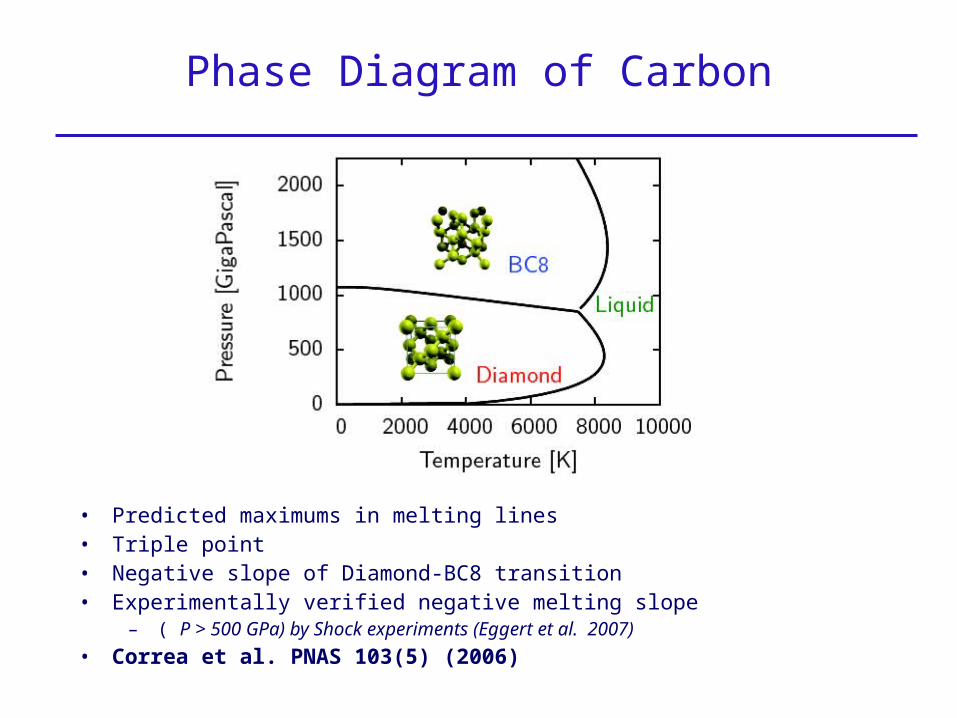
Phase Diagram of Carbon
• Predicted maximums in melting lines• Triple point• Negative slope of Diamond-BC8 transition• Experimentally verified negative melting slope
– ( P > 500 GPa) by Shock experiments (Eggert et al. 2007)
• Correa et al. PNAS 103(5) (2006)

Melting lines obtained by the two-phase simulation method
• Even with the most realistic molecular dynamic simulation, melting lines are not trivial to obtain
• Density Functional Molecular Dynamics on 128 carbon atoms
• Quantum mechanical electrons and Classical Ions
• Ab initio (no fitted parameters)• Solid and Liquid initially present
in same simulation• Interface evolves at a given P and
T.• Most stable phase grows• Melting line is bracketed
recursively
Correa et al. PNAS 103(5) (2006)
QuickTime™ and aTIFF (LZW) decompressor
are needed to see this picture.
Predicting absorption spectra

High-energy-density carbon has beenprobed by x-ray absorption (near and extended edge)
solid / liquid carbon
supports calculations indicating that the low-density phase of liquid carbon is predominately sp-bonded
S. Johnson, et alSilicon: PRL 91, 157403 (2003)Carbon: PRL 94, 057407 (2005)
Foil Sample
QuickTime™ and aTIFF (LZW) decompressor
are needed to see this picture.
Predicting high-T absorption spectra
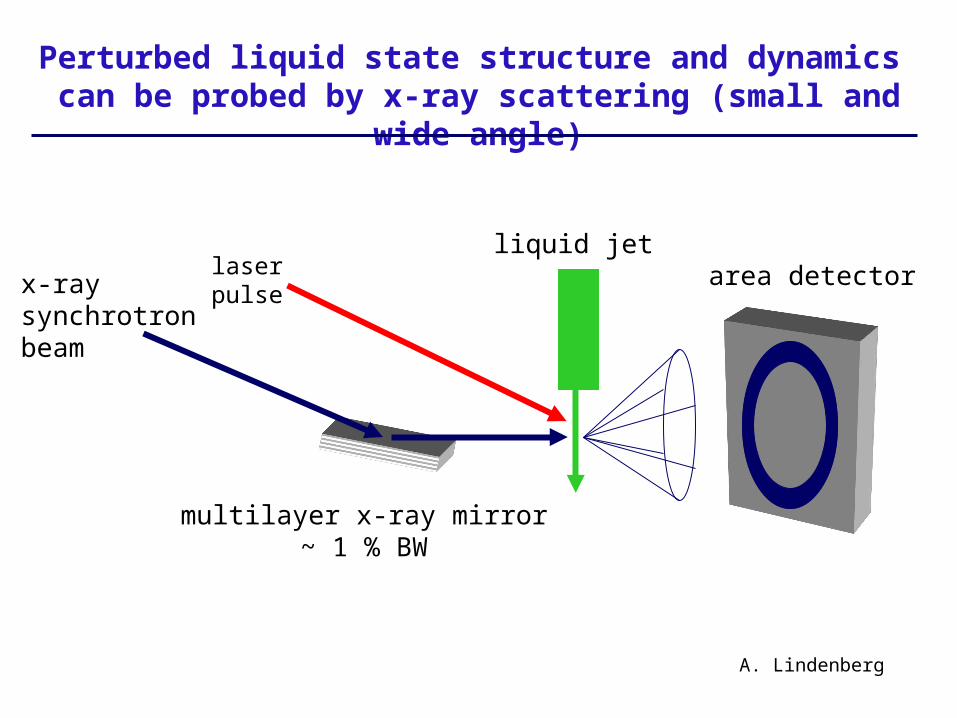
Perturbed liquid state structure and dynamics can be probed by x-ray scattering (small and wide
angle)
x-ray synchrotron beam
liquid jetarea detectorlaser
pulse
multilayer x-ray mirror~ 1 % BW
A. Lindenberg

Time-resolved structural changes in H2Oare seen upon charge injection
Difference signal at 100 ps following charge injection
S(Q)
Static scattering signal
• Implies molecular re-orientation around injected charge with similarities to thermally induced changes
A. Lindenberg

laser wiggler
bendmagnets
mirror
beamline x-rays
wiggler
femtosecond electron bunch
bend magnet beamline
30 ps electronbunch
femtosecondlaser pulse
spatial separationdispersive bend
W
electron-photon interaction in wiggler
femtosecond x-rays
e-beam
Laser-sliced x-ray pulses from synchrotronsare used as tunable probes of HED matter
Zholents and Zolotorev, Phys. Rev. Lett., 76, 916,1996
undulator
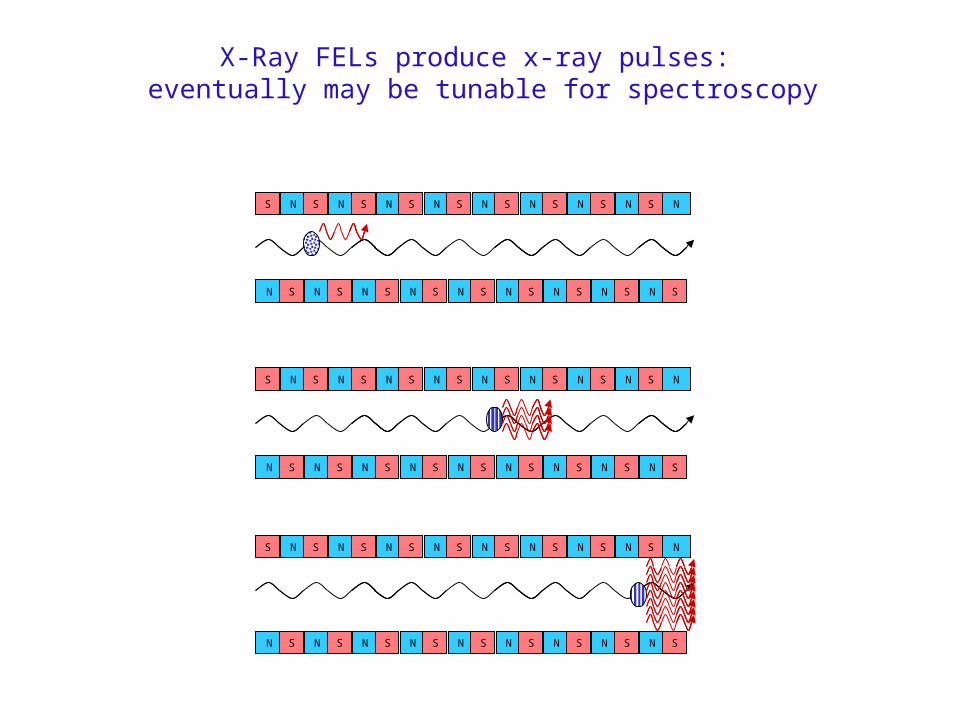
X-Ray FELs produce x-ray pulses: eventually may be tunable for spectroscopy
N S NS N SN SN S N S N S N S N S
N N SS N SN SN S N S N S N S N S
N S NS N SN SN S N S N S N S N S
N N SS N SN SN S N S N S N S N S
N S NS N SN SN S N S N S N S N S
N N SS N SN SN S N S N S N S N S

• tunable soft x-ray peak power > 1 MW• beam divergence < 1 mrad• shot to shot fluctuations < 10%• pulse length < 30 fs• spatial and temporal coherence• examine non-linear phenomena
High-order harmonic radiation from multi-TW lasers produces intense soft x-ray fluxes for pump-probe HED
science
Allison, Belkacem,
Hertlein, VanTilborg
Photocathode
AnodeSweepPlates
Magnetic Lens 2-D Detector
Experiment
Tim
e
Space
RecordedStreak Image
Sw
eep
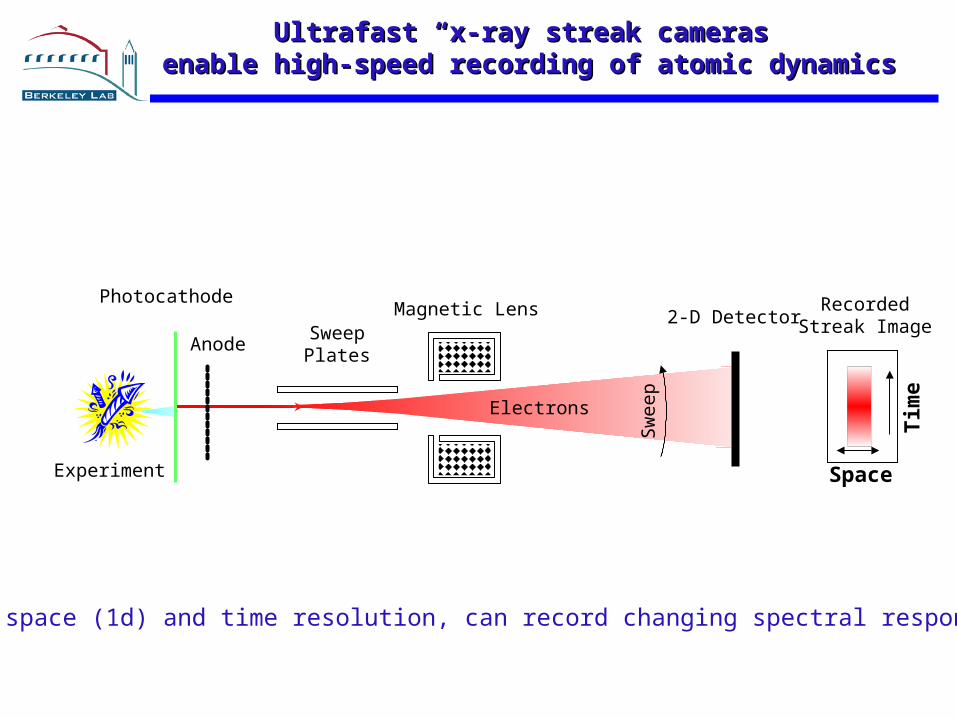
Ultrafast “x-ray streak cameras”Ultrafast “x-ray streak cameras”enable high-speed recording of atomic dynamicsenable high-speed recording of atomic dynamics
Electrons
With space (1d) and time resolution, can record changing spectral response
ESG June 7,07, Jun Feng
0.0 0.2 0.4 0.6 0.8 1.0 1.2 1.40
10
20
30
40
50
60
70
Intensity(a.u)
Time(ps)0.0 0.2 0.4 0.6 0.8 1.0
0
10
20
30
40
50
60
Intensity (a.u)
Time(ps)
400fs233fs
0 20 40 60 80 100 120 1400
10
20
30
40
50
60
70
Intensity(a.u)
size(μ )m
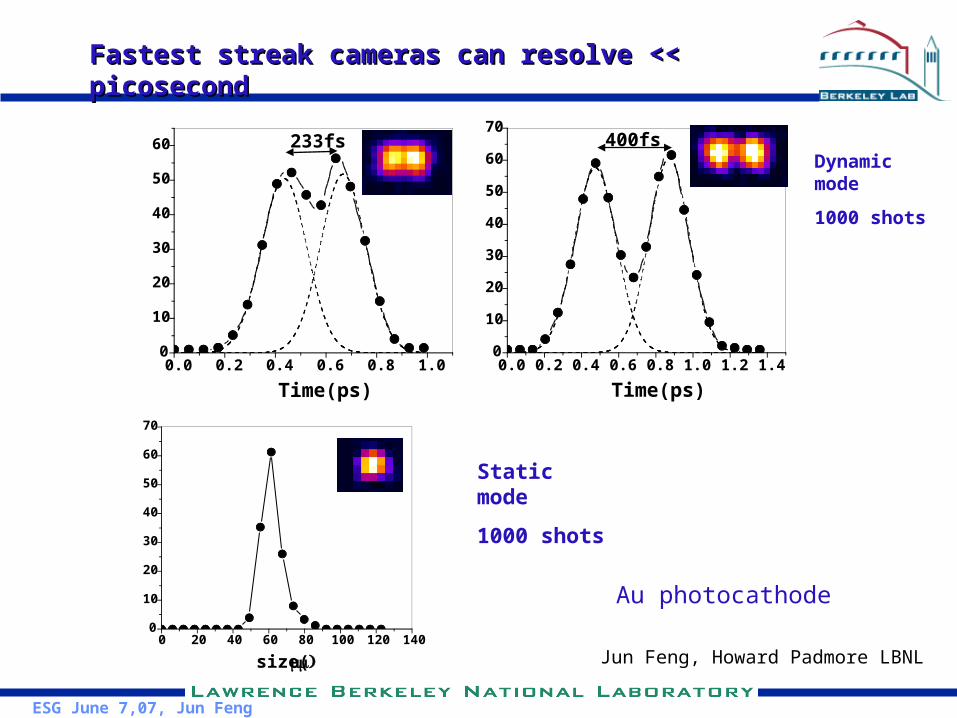
Fastest streak cameras can resolve << Fastest streak cameras can resolve << picosecond picosecond
Au photocathode
Dynamic mode
1000 shots
Static mode
1000 shots
Jun Feng, Howard Padmore LBNL
ESG June 7,07, Jun Feng
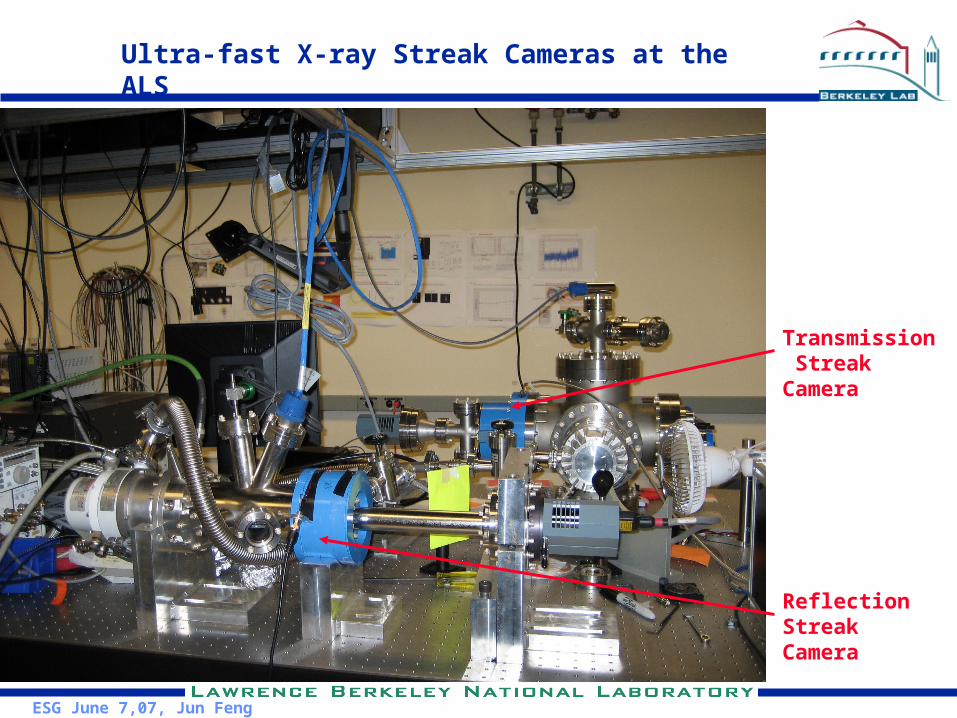
Ultra-fast X-ray Streak Cameras at the ALS
Reflection Streak Camera
Transmission Streak Camera

Lindenberg et al., Phys Rev. Lett. 84, 111 (2000)
Synchrotron x-ray source
Sample
Laser
Detector
Laser-generated strain, bond-breaking, and hot electron-phonon coupling can initiate a solid-to-liquid phase transition
which can be probed by ultrafast x-ray scattering
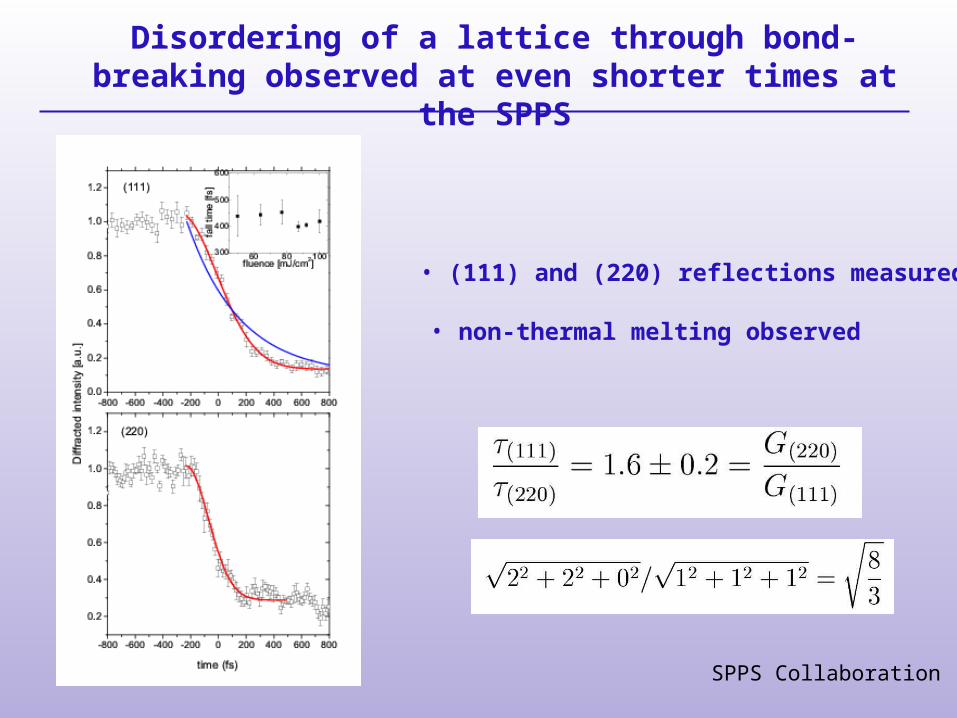
• (111) and (220) reflections measured
• non-thermal melting observed
Disordering of a lattice through bond-breaking observed at even shorter times at
the SPPS
SPPS Collaboration

High Energy Density Matter occurs widely
• Hot Dense Matter (HDM) occurs in:
• Supernova, stellar interiors, accretion disks
• Plasma devices: laser produced plasmas, Z-pinches
• Directly and indirectly driven inertial fusion experiments
• Warm Dense Matter (WDM) occurs in:
• Cores of large planets
• X-ray driven inertial fusion experiments
HED
WDM
Hydrogen phase diagram
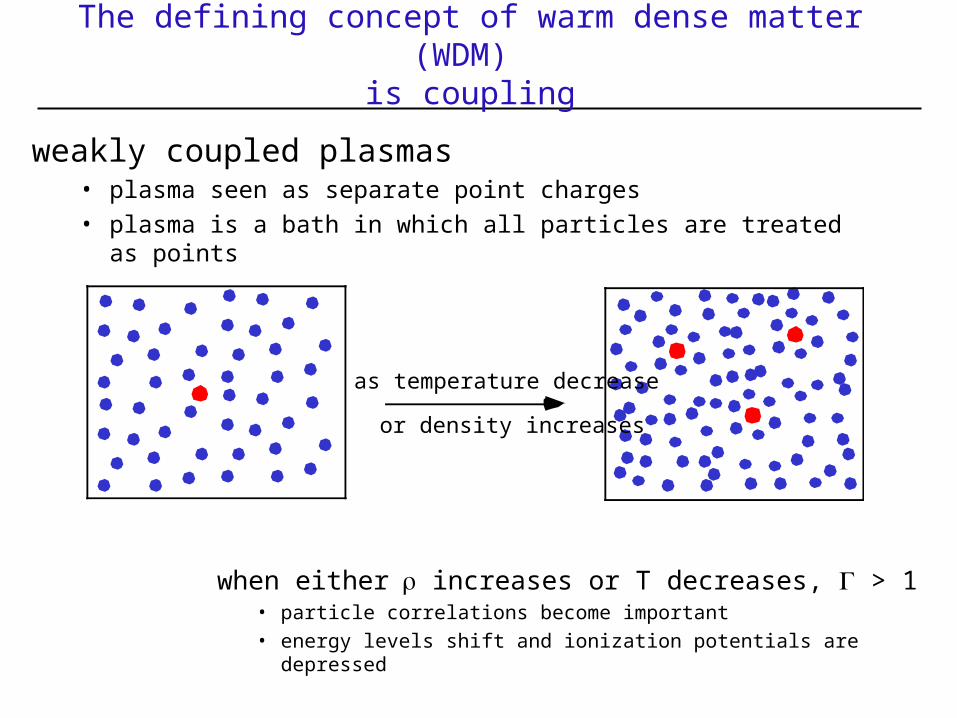
The defining concept of warm dense matter (WDM) is coupling
weakly coupled plasmas• plasma seen as separate point charges
• plasma is a bath in which all particles are treated as points
when either increases or T decreases, > 1• particle correlations become important
• energy levels shift and ionization potentials are depressed
as temperature decrease
or density increases
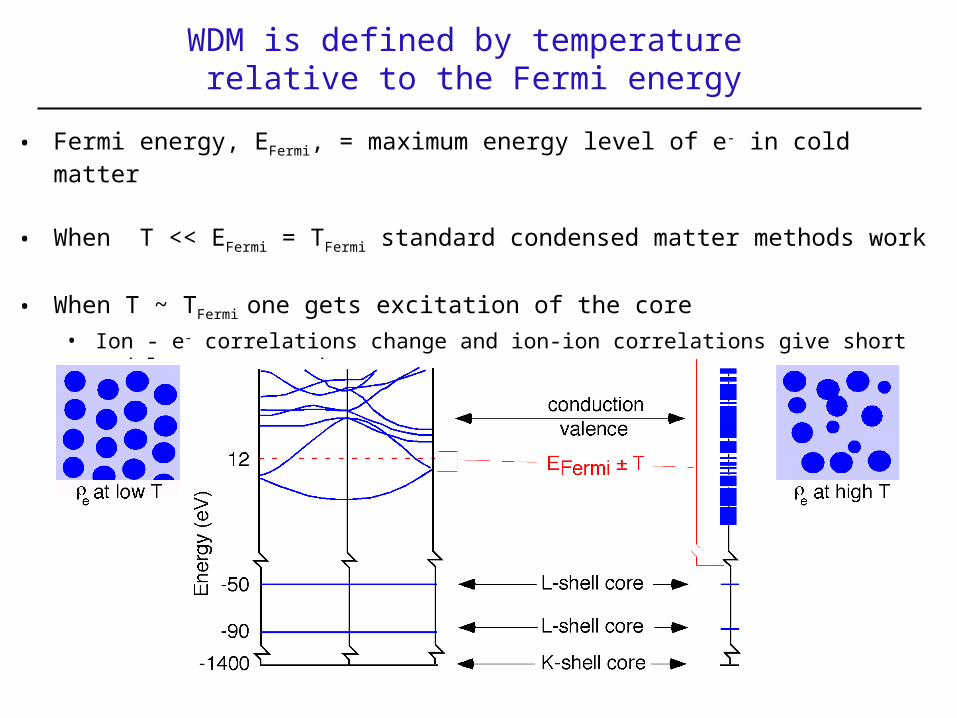
WDM is defined by temperature relative to the Fermi energy
• Fermi energy, EFermi, = maximum energy level of e- in cold matter
• When T << EFermi = TFermi standard condensed matter methods work
• When T ~ TFermi one gets excitation of the core• Ion - e- correlations change and ion-ion correlations give short and long range
order
c la s s ic a l p la s m a
d e n s e
p la s m a
=1
=1 0
Density(g/cm3)
103
104
101
102
102 104100
10-4 10-2 1
=1 0 0
h ig h
d e n s ity
m a tte r
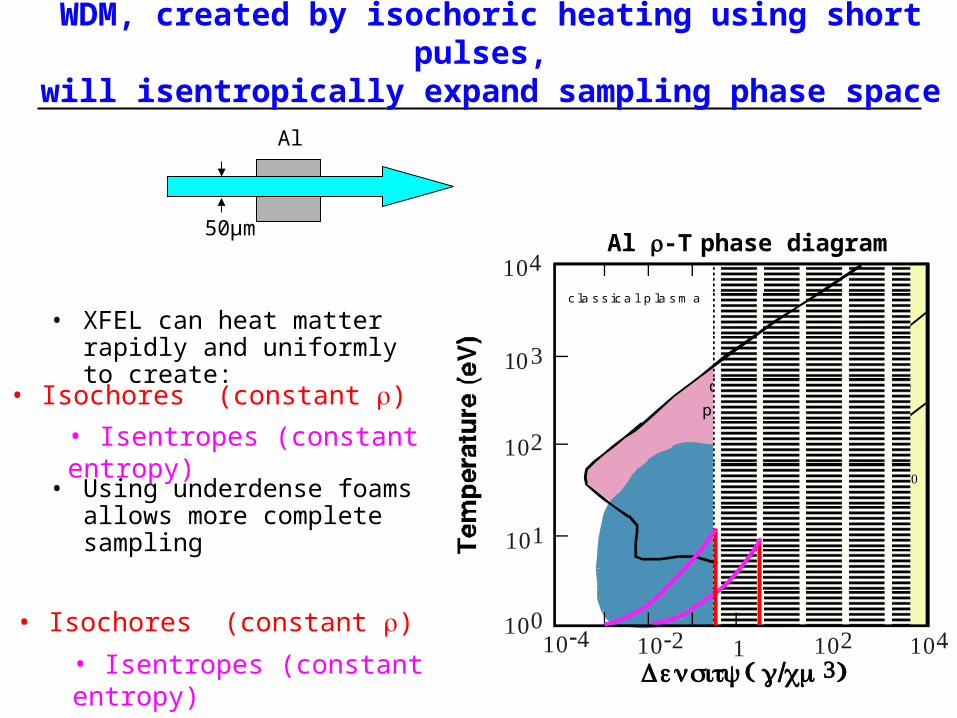
WDM, created by isochoric heating using short pulses,
will isentropically expand sampling phase space
• XFEL can heat matter rapidly and uniformly to create:
• Using underdense foams allows more complete sampling
Al
50µmAl -T phase diagram
• Isochores (constant )
• Isentropes (constant entropy)
• Isochores (constant )
• Isentropes (constant entropy)
Ablation of a surface under high energy flux
QuickTime™ and aYUV420 codec decompressor
are needed to see this picture.
G. Gilmer, B. Sadigh, LLNL
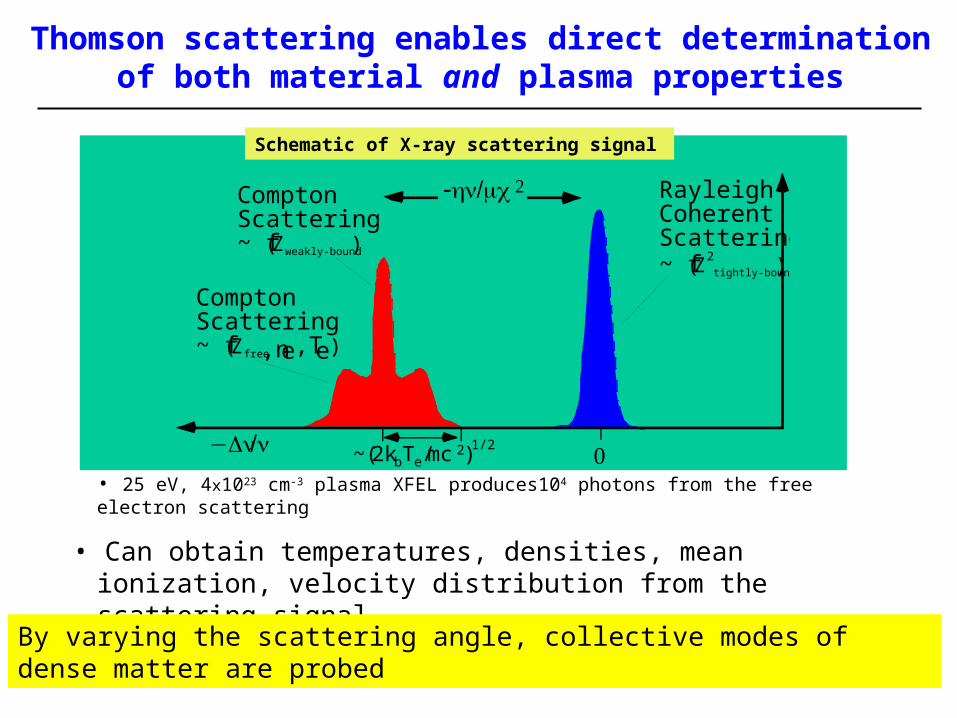
Thomson scattering enables direct determination of both material and plasma properties
• 25 eV, 4x1023 cm-3 plasma XFEL produces104 photons from the free electron scattering
• Can obtain temperatures, densities, mean ionization, velocity distribution from the scattering signal
Schematic of X-ray scattering signal
RayleighCoherentScattering~ f(Z2
tightly-bound)
ComptonScattering~ f(Zfree,ne,Te)
ComptonScattering~ f(Zweakly-bound)
~(2kbTe/mc2)1/2−Δν/ν
-hν/mc2
0
By varying the scattering angle, collective modes of dense matter are probed

• Due to absorption, refraction, & reflection, visible lasers cannot probe high density
• X-ray scattering from free electrons provides a measure of the Te, ne, f(v), and plasma damping
• x-ray FEL scattering signals will be well above noise for HED matter
Al Scattering and absorption
10-2
10-1
100
101
102
103
104
Absorption or Scattering Length (1/cm)
2015105
Photon Energy (keV)
Photo-absorption
Scattering
Rayleigh - coherent Thomson - incoherent bound electrons Thomson - incoherent free electrons
FEL
X-rays provide a unique probe of HED matter
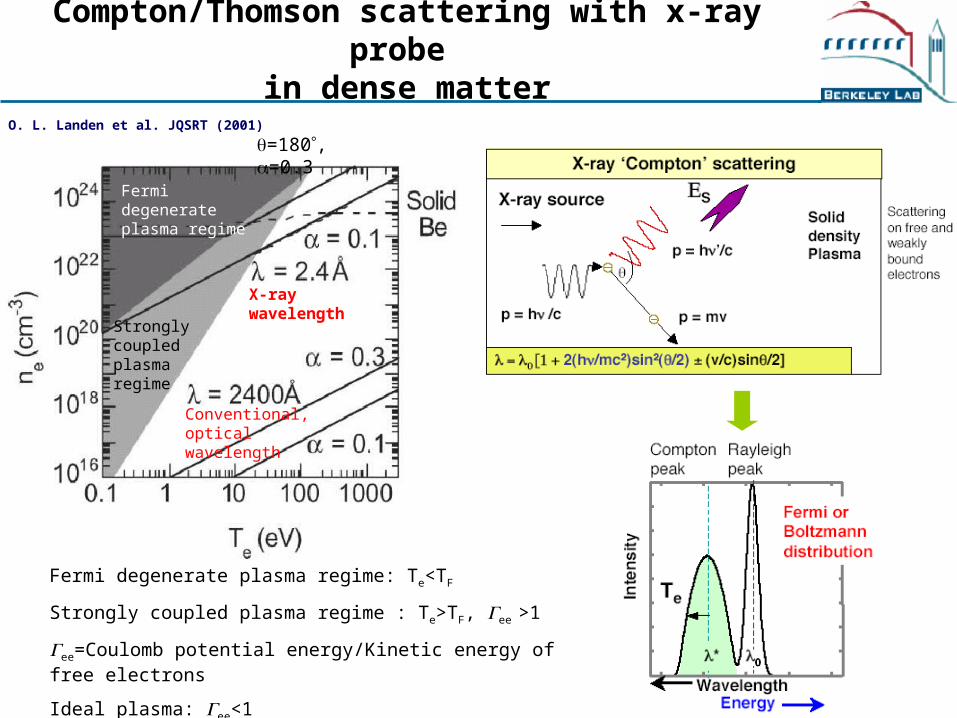
Fermi degenerate plasma regime: Te<TF
Strongly coupled plasma regime : Te>TF, ee >1
ee=Coulomb potential energy/Kinetic energy of free electrons
Ideal plasma: ee<1
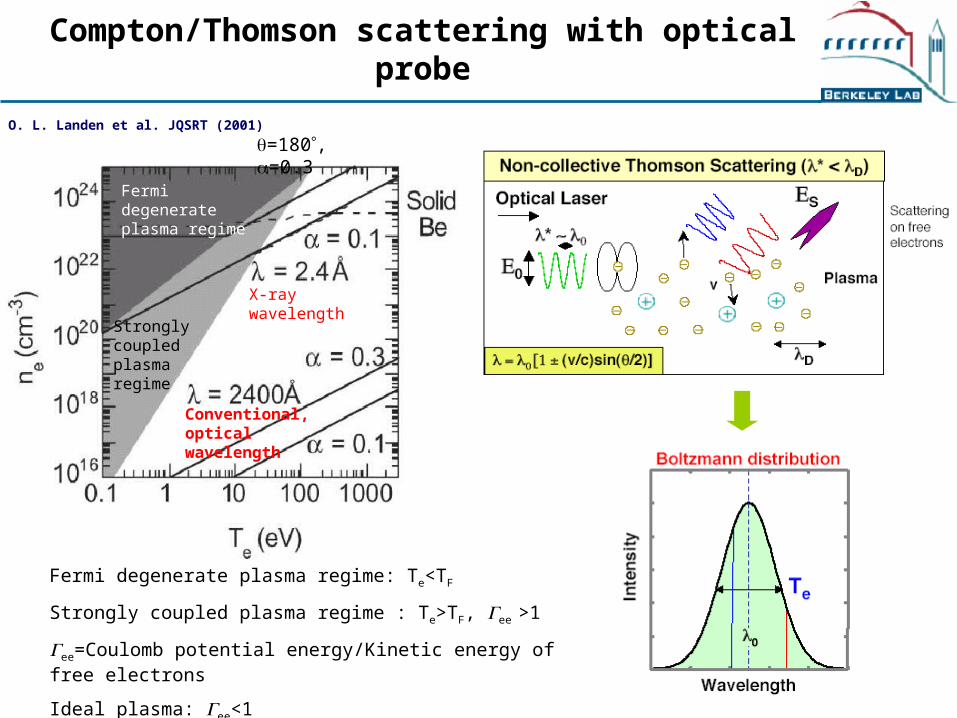
Compton/Thomson scattering with optical probe
Fermi degenerate plasma regime
Strongly coupled plasma regime
X-ray wavelength
Conventional, optical wavelength
=180, =0.3O. L. Landen et al. JQSRT (2001)
Fermi degenerate plasma regime: Te<TF
Strongly coupled plasma regime : Te>TF, ee >1
ee=Coulomb potential energy/Kinetic energy of free electrons
Ideal plasma: ee<1
Compton/Thomson scattering with x-ray probe in dense matter
Fermi degenerate plasma regime
Strongly coupled plasma regime
X-ray wavelength
Conventional, optical wavelength
=180, =0.3O. L. Landen et al. JQSRT (2001)

Scattering regimes in the -T plane
In dense plasmas
- standard theoretical approaches fail
- theoretical uncertainties are large
Collective scattering in dense plasmas
- probes transition region
X-ray source
- penetrates dense plasmas

Forward scattering and plasmon in dense matter
X Raysv
D
1kk0
Detector
kS
k
Forward scatter on Plasmons Scattering parameter
=1/(kD)~ L/ (4Dsin(/2)) */D
>1 : Collective regime, * > D,
Orderly oscillatory behavior under the long-range Coulomb forces.
The density fluctuation in the plasma behave collectively and oscillate around p.
0
2
4
6
4.4 4.6 4.8 5.0Energy (keV)
Plasmon scatter Detailed balance
Best fit:ne = 3 x 1023 cm-34.5 x 1023 cm-3
2.9 2.961.5 x 1023 cm-3
,)0,(),(2
1),( dtktke
NkS ee
ti >−<= ∫rr
ρρπ
ω ω
From the fluctuation-dissipation theorem
),,(Im1
1),( 1
/2
20 εε k
enek
kS Tke
B
−
−−= h
h
)exp(),(
),(
TkkS
kS
B
h
−=−−
Sensitive to Te
With x-ray probe for WDM, strong asymmetry or almost gone of blue-shifted peak.
From the plasmon peak, we can have better accurate information about Te!!
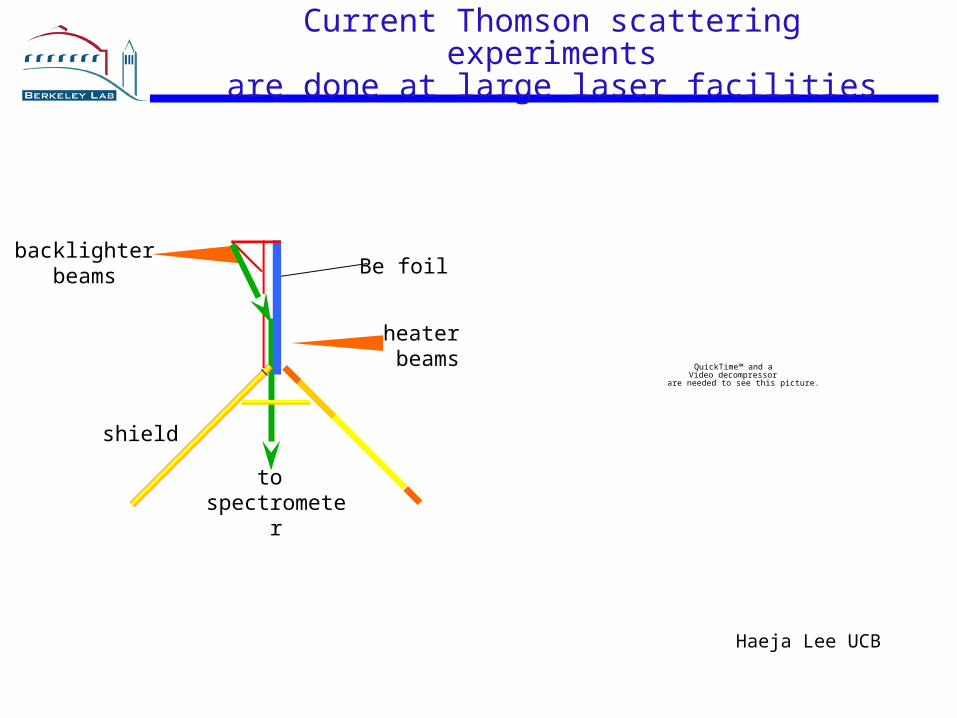
Current Thomson scattering experimentsare done at large laser facilities
QuickTime™ and aVideo decompressor
are needed to see this picture.
heater beams
backlighterbeams Be foil
to spectrometer
shield
Haeja Lee UCB
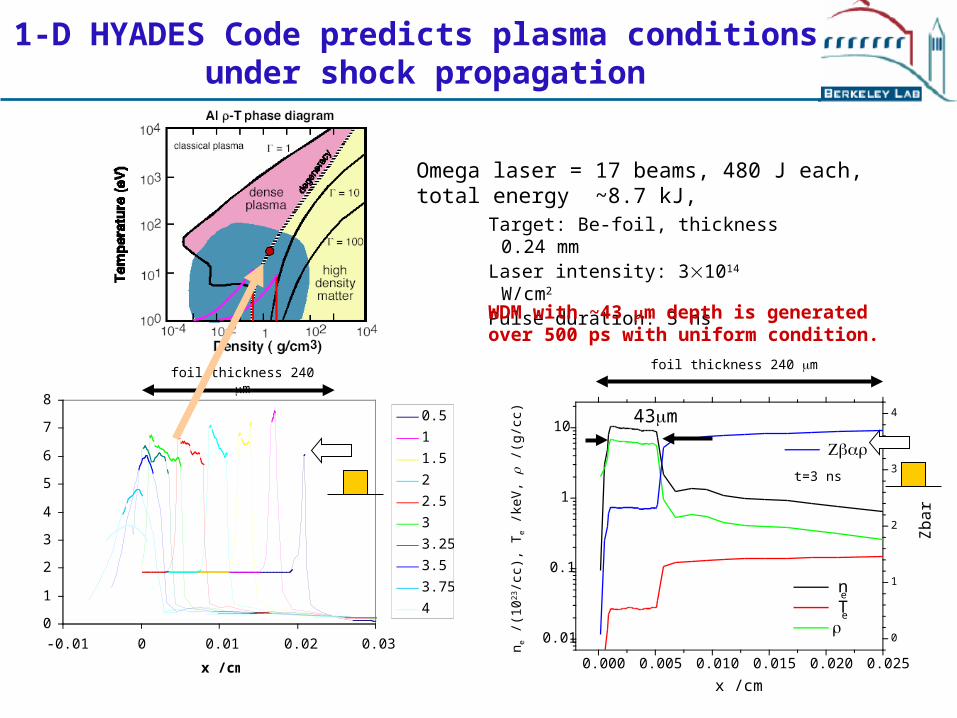
1-D HYADES Code predicts plasma conditions under shock propagation
Omega laser = 17 beams, 480 J each, total energy ~8.7 kJ,
Target: Be-foil, thickness 0.24 mmLaser intensity: 3 1014 W/cm2
Pulse duration: 3 ns
x /cm
n e /(
1023
/cc)
, Te /k
eV,
/(g/
cc)
Zb
ar
foil thickness 240 m
0
1
2
3
4
5
6
7
8
-0.01 0 0.01 0.02 0.03
x /cm
rho /(g/cc)
0.5
1
1.5
2
2.5
3
3.25
3.5
3.75
4
foil thickness 240 m
0.000 0.005 0.010 0.015 0.020 0.025
0.01
0.1
1
10
0
1
2
3
4
ne
Te
Zbar
t=3 ns
43m
WDM with ~43 μm depth is generated over 500 ps with uniform condition.
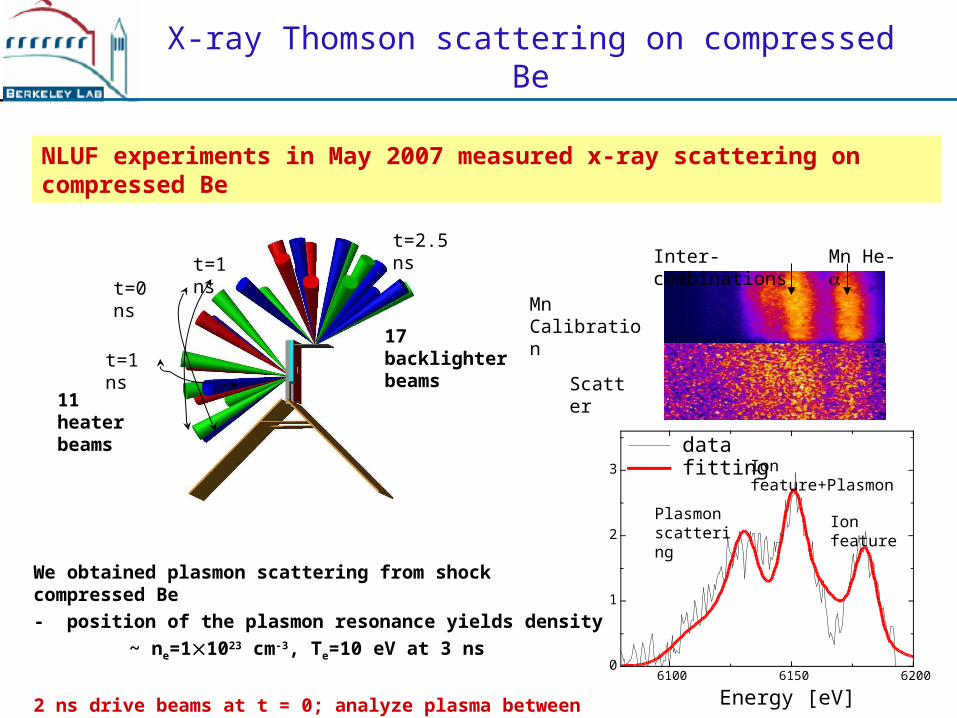
X-ray Thomson scattering on compressed Be
NLUF experiments in May 2007 measured x-ray scattering on compressed Be
Mn Calibration
Scatter
Mn He-Inter-combinations
6100 6150 62000
1
2
3
Intensity
Energy [eV]
data fitting
Ion feature
Ion feature+Plasmon
Plasmon scattering
We obtained plasmon scattering from shock compressed Be
- position of the plasmon resonance yields density
~ ne=11023 cm-3, Te=10 eV at 3 ns
2 ns drive beams at t = 0; analyze plasma between 2.6-3.4 ns.
t=0 nst=1 ns
t=1 ns
11 heater beams
t=2.5 ns
17 backlighter beams

- for x-ray pulse backlighting of warm matter on high-energy laser systems, we use multiple laser beams with about 10,000 J in a few ns, for pumping a plasma on a surface that radiates K- and He- x-rays
- this converts to about 1 J of x-ray photons radiated into 4
- there is then about 1 mJ for use in illuminating the sample, within the collected solid angle
- this probe x-ray beam compares well in energy per pulse with the LCLS per pulse energy, which has 1 mJ
- LCLS pulses will be more collimated, narrower BW, and shorter in duration (~ 200 fs)
Thomson scattering at large laser facilities or XFELs ?

B. Remington, Presentation to: B. Richter, 10/30/06NIF-1006-12910.ppt
Remington_v13_final.ppt;37
Materials science and lattice dynamics at ultrahigh pressures and strain rates
define a frontier of condensed matter science
Lattice Dynamics Phase Diagram of Iron
2000
1000
00 10 20
Pressure (GPa)
Tem
per
atu
re (
K)
Unexplored regimes of solid-state dynamics at
extremely high pressures and strain rates will be accessible
on NIF
Dynamic Diffraction Lattice Msmt
Iron,Pshk ~20 GPa
[D.H. Kalantar et al., PRL 95 ,075502 (2005); J. Hawreliak et al., PRB, in press (2006)]
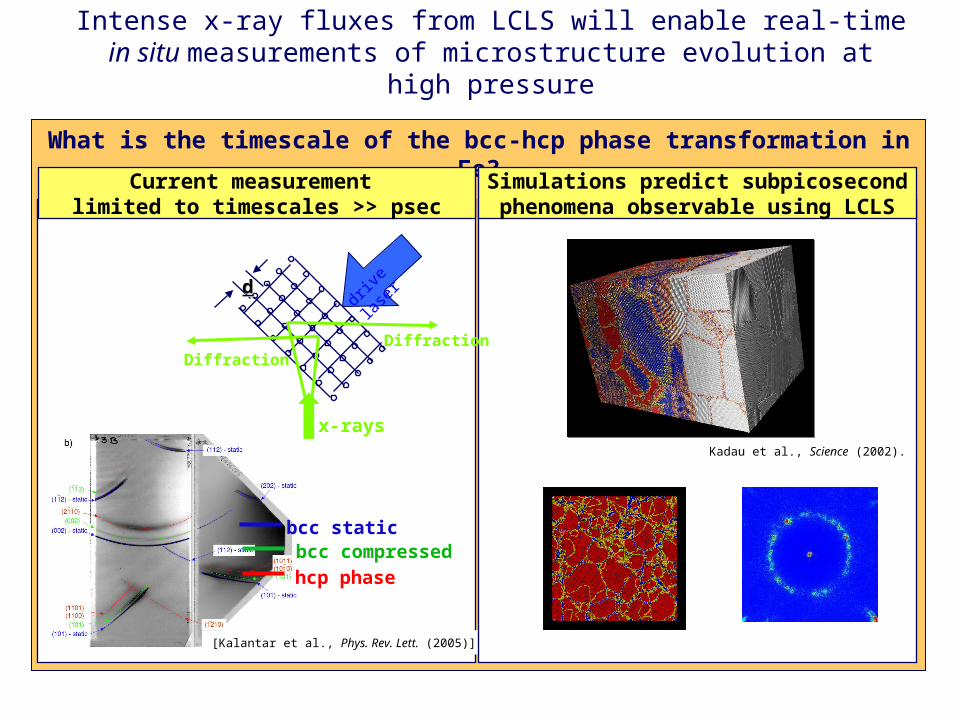
What is the timescale of the bcc-hcp phase transformation in Fe?
Intense x-ray fluxes from LCLS will enable real-time in situ measurements of microstructure evolution at high pressure
bcc staticbcc compressedhcp phase
[Kalantar et al., Phys. Rev. Lett. (2005)]
CuCurrent measurement limited to timescales >> psec
Simulations predict subpicosecond phenomena observable using LCLS
Kadau et al., Science (2002).
x-rays
DiffractionDiffraction
dddr
ive la
ser
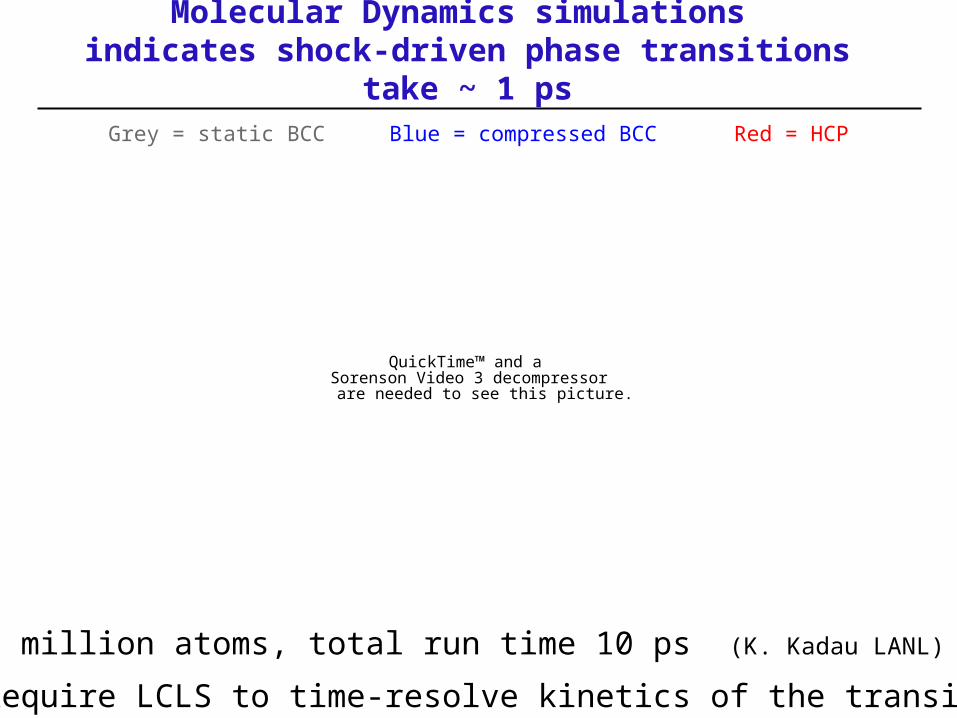
Molecular Dynamics simulations indicates shock-driven phase transitions take
~ 1 ps
• 8 million atoms, total run time 10 ps (K. Kadau LANL)
• Require LCLS to time-resolve kinetics of the transition
Grey = static BCC Blue = compressed BCC Red = HCP
QuickTime™ and aSorenson Video 3 decompressorare needed to see this picture.
QuickTime™ and aYUV420 codec decompressor
are needed to see this picture.
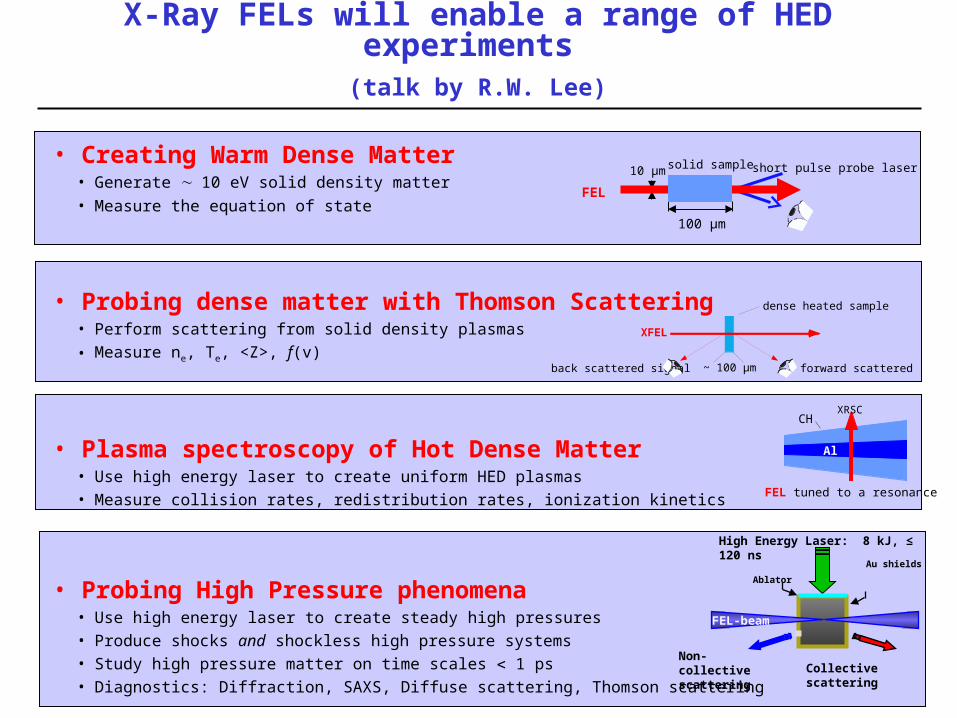
• Creating Warm Dense Matter • Generate 10 eV solid density matter
• Measure the equation of state
• Probing dense matter with Thomson Scattering• Perform scattering from solid density plasmas
• Measure ne, Te, <Z>, f(v)
• Plasma spectroscopy of Hot Dense Matter• Use high energy laser to create uniform HED plasmas• Measure collision rates, redistribution rates, ionization kinetics
• Probing High Pressure phenomena• Use high energy laser to create steady high pressures• Produce shocks and shockless high pressure systems • Study high pressure matter on time scales 1 ps• Diagnostics: Diffraction, SAXS, Diffuse scattering, Thomson scattering
CH
Al
FEL tuned to a resonance
XRSC
XFEL
dense heated sample
forward scattered signalback scattered signal ~ 100 µm
FEL
10 µm
100 µm
solid sample short pulse probe laser
High Energy Laser: 8 kJ, ≤ 120 ns
Non-collective scattering Collective scattering
Ablator
Au shields
FEL-beam
X-Ray FELs will enable a range of HED experiments (talk by R.W. Lee)

Preparation for foils experiments: Dispersed Cu spectrum
• Copper absorption spectrum measured in 10 ms
L3
L2
Cu
L3
•Copper absorption spectrum measured in 10 ALS pulses–Intensity limited by undulator gap, aperturing beam and detector efficiency (100)

Band s
truct
ure
: Le
vy, PR
B 1
98
7
Optical excitation process:Eesley, PRB 1986
Eesley, PRB 1986
Properties of Copper
(n-1)2 + k2
(n+1)2 + k2R =
ds,p
We photoexcite sample with 3eV photons. Absorption from the d-band to p-states above EF is strong. This is the same absorption process that gives Cu its color.
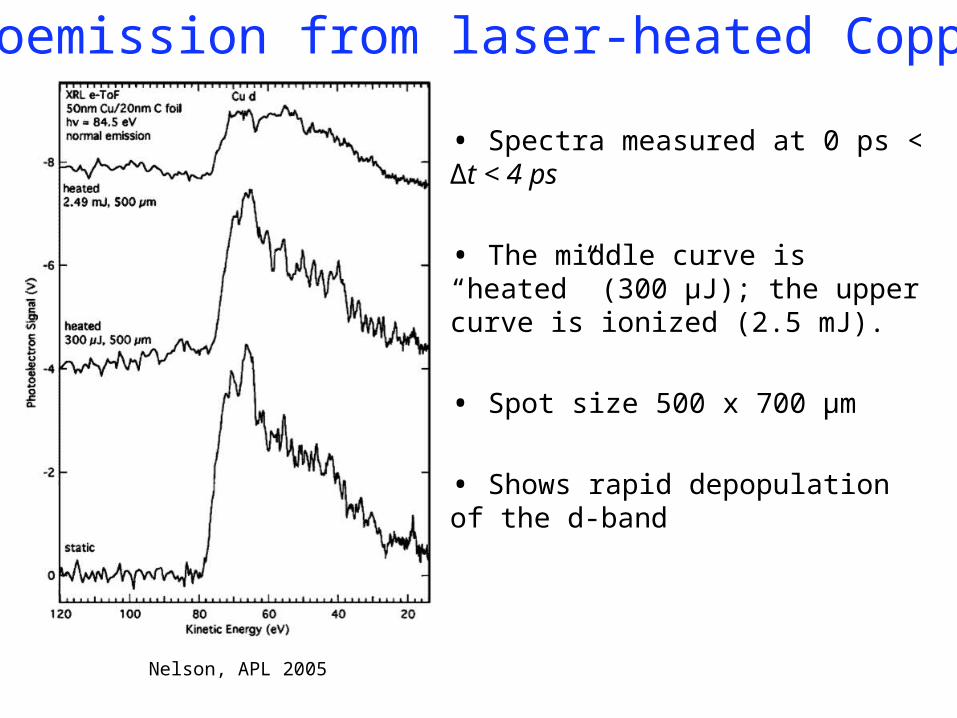
Photoemission from laser-heated Copper
Nelson, APL 2005
• Spectra measured at 0 ps < Δt < 4 ps
• The middle curve is “heated” (300 μJ); the upper curve is ionized (2.5 mJ).
• Spot size 500 x 700 μm
• Shows rapid depopulation of the d-band
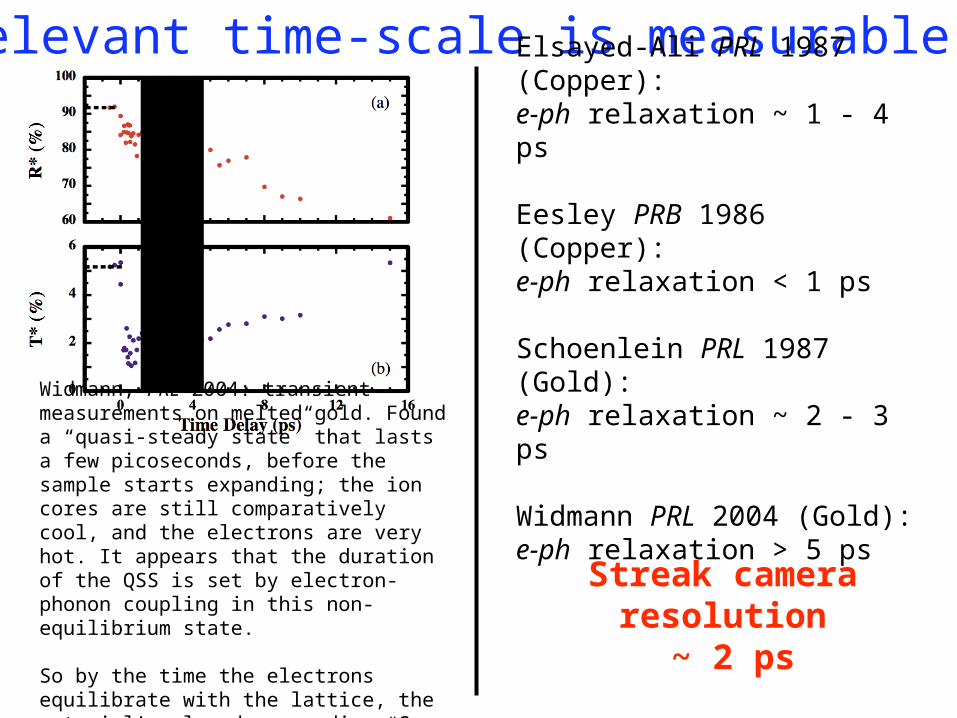
Relevant time-scale is measurable
Widmann, PRL 2004: transient measurements on melted gold. Found a “quasi-steady state” that lasts a few picoseconds, before the sample starts expanding; the ion cores are still comparatively cool, and the electrons are very hot. It appears that the duration of the QSS is set by electron-phonon coupling in this non-equilibrium state.
So by the time the electrons equilibrate with the lattice, the material’s already expanding. So you never measure a “thermal” sample.
Elsayed-Ali PRL 1987 (Copper): e-ph relaxation ~ 1 - 4 ps
Eesley PRB 1986 (Copper): e-ph relaxation < 1 ps
Schoenlein PRL 1987 (Gold): e-ph relaxation ~ 2 - 3 ps
Widmann PRL 2004 (Gold): e-ph relaxation > 5 ps
Streak camera resolution ~ 2 ps
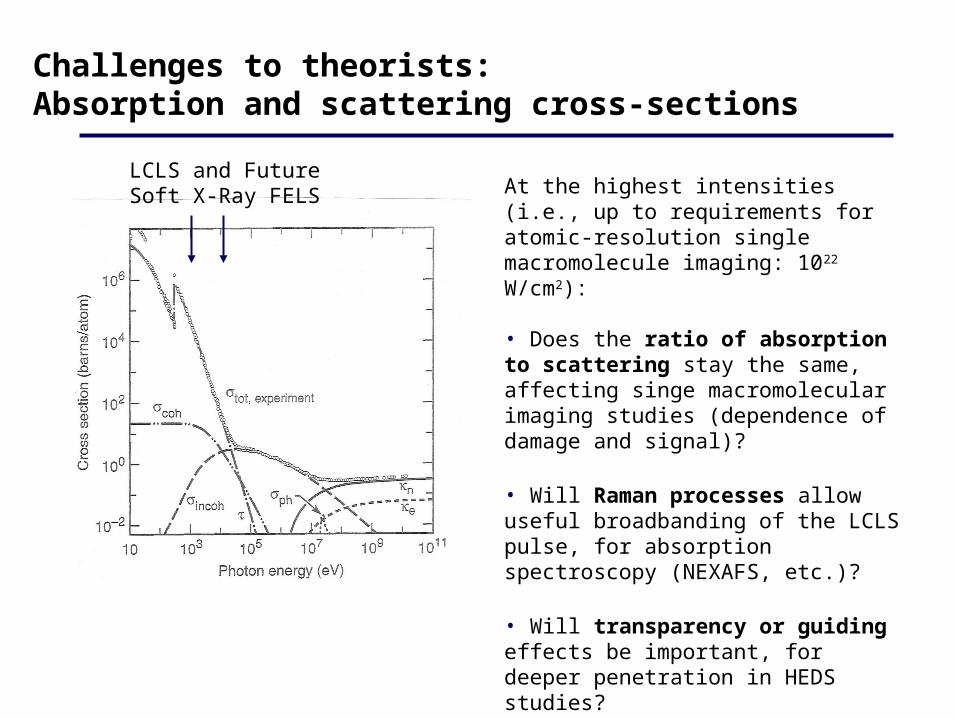
Challenges to theorists:Absorption and scattering cross-sections
At the highest intensities (i.e., up to requirements for atomic-resolution single macromolecule imaging: 1022 W/cm2):
• Does the ratio of absorption to scattering stay the same, affecting singe macromolecular imaging studies (dependence of damage and signal)?
• Will Raman processes allow useful broadbanding of the LCLS pulse, for absorption spectroscopy (NEXAFS, etc.)?
• Will transparency or guiding effects be important, for deeper penetration in HEDS studies?
LCLS and Future Soft X-Ray FELS
Challenges under “warm” conditions in condensed matter, materials physics, and plasma physics
can be addressed
- understand the dynamic interplay between electronic structure (energy levels, charge distributions, bonding, spin) and atomic structure (coordination, bond distances, arrangements)
Fundamental time scales range from picoseconds (conformational relaxations in molecular systems, and electron-lattice energy transfer times in solids), to ~100 fs (vibrational periods), to ~10 fs (electron-electron scattering), to <1 fs (electron-electron correlations)
X-rays are ideal probes of atomic structure, electronic structure, and plasma properties
New x-ray sources should enable the application of x-ray spectroscopic and scattering techniques (XANES, EXAFS, XMLD, XMCD, RIXS) on fundamental time-scales.