rodriguezr_wbfinal
DESCRIPTION
Nutrition FinalTRANSCRIPT

1
Robin Rodriguez
Nutrition 25
Spring 25
C. Betty Crocker
M
T Mt. San Antonio College
2
Your Diet Analysis Work Thus Far
WB 1: See Appendix 1
WB 2: Cover page
WB 3: Super Food List:
Water Milk Avocado
Carrots
Broccoli
Almonds
Banana
Steak
Leafy Greens
Apple
3
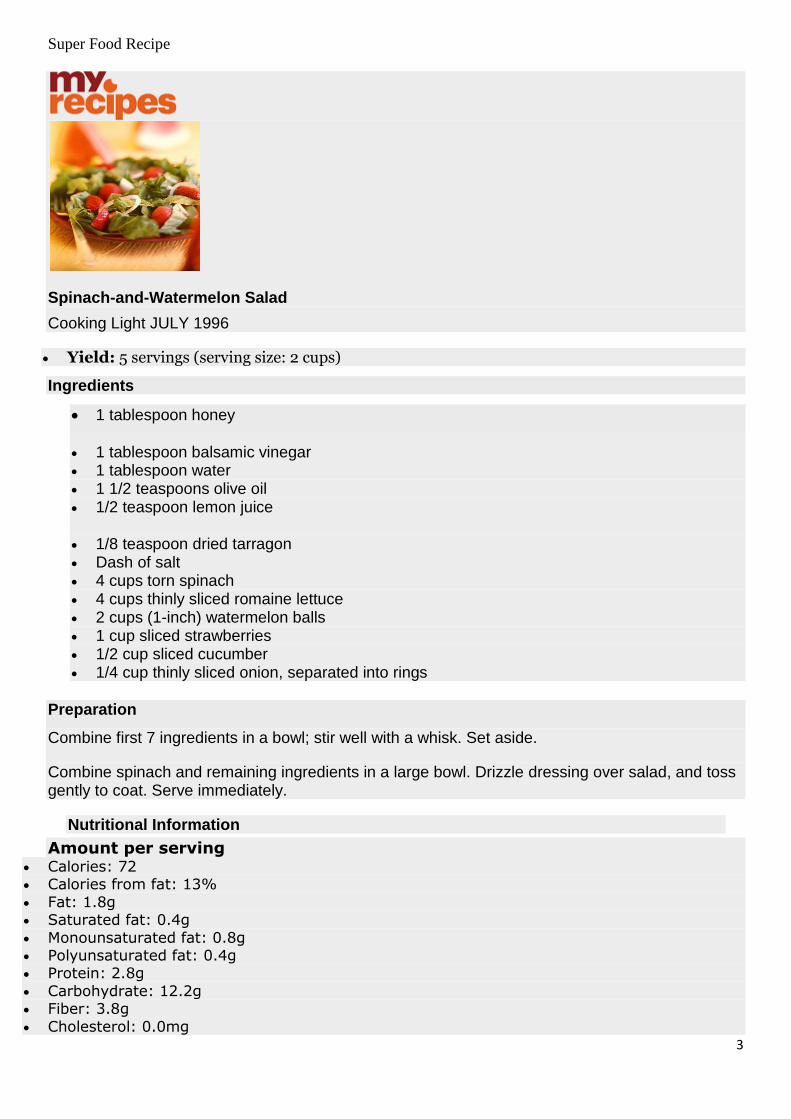
Super Food Recipe
Spinach-and-Watermelon Salad
Cooking Light JULY 1996
Yield: 5 servings (serving size: 2 cups)
Ingredients
1 tablespoon honey
1 tablespoon balsamic vinegar 1 tablespoon water 1 1/2 teaspoons olive oil 1/2 teaspoon lemon juice
1/8 teaspoon dried tarragon Dash of salt 4 cups torn spinach 4 cups thinly sliced romaine lettuce 2 cups (1-inch) watermelon balls 1 cup sliced strawberries 1/2 cup sliced cucumber 1/4 cup thinly sliced onion, separated into rings
Preparation
Combine first 7 ingredients in a bowl; stir well with a whisk. Set aside.
Combine spinach and remaining ingredients in a large bowl. Drizzle dressing over salad, and toss gently to coat. Serve immediately.
Nutritional Information
Amount per serving Calories: 72 Calories from fat: 13%
Fat: 1.8g Saturated fat: 0.4g
Monounsaturated fat: 0.8g Polyunsaturated fat: 0.4g Protein: 2.8g
Carbohydrate: 12.2g Fiber: 3.8g
Cholesterol: 0.0mg
4
Iron: 2mg
Sodium: 46mg Calcium: 74mg
WB: 4 Perfect 3 Day
See Appendix 2
WB 5: Data Storage (URL)
WB6: Your #1 Super Food
Spinach
See Appendix 3
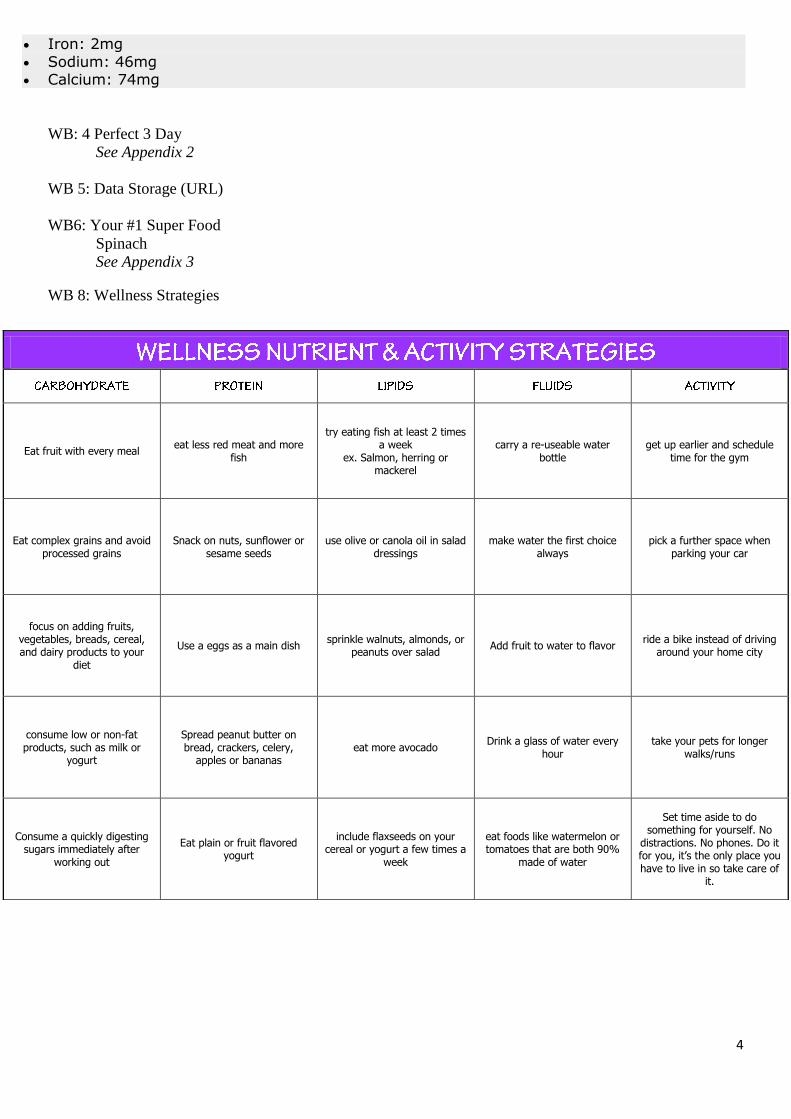
WB 8: Wellness Strategies
Eat fruit with every meal eat less red meat and more
fish
try eating fish at least 2 times a week
ex. Salmon, herring or mackerel
carry a re-useable water bottle
get up earlier and schedule time for the gym
Eat complex grains and avoid processed grains
Snack on nuts, sunflower or sesame seeds
use olive or canola oil in salad dressings
make water the first choice always
pick a further space when parking your car
focus on adding fruits, vegetables, breads, cereal, and dairy products to your
diet
Use a eggs as a main dish sprinkle walnuts, almonds, or
peanuts over salad Add fruit to water to flavor
ride a bike instead of driving around your home city
consume low or non-fat products, such as milk or
yogurt
Spread peanut butter on bread, crackers, celery,
apples or bananas eat more avocado
Drink a glass of water every hour
take your pets for longer walks/runs
Consume a quickly digesting sugars immediately after
working out
Eat plain or fruit flavored yogurt
include flaxseeds on your cereal or yogurt a few times a
week
eat foods like watermelon or tomatoes that are both 90%
made of water
Set time aside to do something for yourself. No
distractions. No phones. Do it for you, it’s the only place you have to live in so take care of
it.

5
WB9: WB Workbook
Appendix 4
1. Quality Levels
“1. Quality”
See Appendix 4 (pg.56)
o Tools: Exam Excel, Tab: 1. Quality”
o Summary Quantify quality based DRI goals to calculate “GOOD” (10-19%) or
“EXCELLENT” (20%) source.
o Instructions: According to the FDA and the National Education Labeling Act (NELA),
nutrients claims on labels must follow this strict protocol: “GOOD” (10-19%) or
“EXCELLENT” (20%) source. Simply input your DRI goals from WB! (Numbers only, no
units) and the rest is automatically calculated.
o Import: Paste the complete QUALITY LEVELS as a PDF in your master document
2. My Nutrition Profile
“2. 3-Day”
See Appendix 4 (pg. 57)
o Tools: WB 1 and Excel tab “2. 3 Day-3”
o Summary: You will identify all DRI “Intake vs. Goal” nutrient deficiencies and excess from
WB1 “Intake vs. Goal.” From this, you will research and provide a summary of the nutrient
profiles a summary of the nutrient profiles and the outcome of chronic deficiencies and
excess of these nutrients
o Instructions: From WB1 input DRI Goals, Intakes, and Intakes vs. Goals on “2.PPA.”
Identify all deficient nutrients that fell below 80 % on column B with highlighted color.
Highlight all excess nutrients (above 120% DRI goal) on column B. Paste this worksheet on
your document. For each excess/deficient nutrient provide the following in bullet format:
1. Main function(s)
2. Result of chronic deficiencies or chronic excesses
3. List 3 food sources (deficiencies only)
4. Resources: Use your text, or you can access the information on the NIH website:
DRI Tables (bottom of page): http://ods.od.nih.gov/Health_Information/Dietary
_Reference_Intakes.aspx.
Facts Sheets (doesn’t list all)” http;//ods.od.nih.gov/factsheets/list-all/
DEFICIENT
o Water
Main Function: Water helps to transport oxygen and nutrients to different parts of the
body. It also aids in the ability for the body to remove toxins and waste from the
body, all the while regulating the body’s temperature through perspiration.
Results of Chronic Deficiencies: Suffering from lack of the consumption of water can
lead to many complications such as severe dehydration, joint pain, constipation, and
depression.
3 Food Sources:
Water
Watermelon
Tomato
6
Resources: http://nutritioninfo.tripod.com
http://www.self.com/blogs/flash/2011/08/6-high-fat-foods-that-are-good.html
o Kcals
Main Function: Through the food that we consume your body has the ability to turn it
into energy. The calories are equivalent to the amount of energy unit present in the
body and the energy that we get from it allows us to perform well our day-to-day
functions.
Results from chronic Deficiencies: Being undernourished makes it more difficult to
perform daily tasks. Studying becomes more difficult, working or any other physical
activity almost become impossible. Children that are chronically hungry fail to grow
as quickly as they should. Mentally they develop more slowly. Being constantly
hungry weakens the immune system and makes a person more vulnerable to disease
and infections. Mothers that live in constant hunger will often times give birth to an
underweight and weak baby, and they face increasing risk of death.
3 Food Source
Eggs
Avocado
Fatty Fish
Resources: http://www.fao.org/hunger/en/
Macronutrients
o Fiber
Main Function: Fiber’s main function in the body is to aid in the regulation of
digestion.
Results from chronic deficiencies: Maintaining a diet that lacks fiber can lead to many
serious and uncomfortable complications. Being deficient in fiber can lead to
constipation. Hemorrhoids are also a side effect from prolonged constipation, caused
by the strain being put on the bowel. It can also lead to diverticular disease, a painful
condition in which pouches form in the colon and can become inflamed. Also studies
have shown a connection with those who lack fibers in their diets have a higher risk
for having a heart attack. Fiber is also been shown to add in maintaining a healthy
weight due to the fact fiber is what aids in the feeling of fullness after consuming a
meal.
3 Food Sources
Bread, Pasta
Flax Seed
Yogurt
Resources: http://healthyeating.sfgate.com/longterm-risks-low-fiber-1267.html
Lipids
o Saturated Fats
Main Function: Saturated fats are most mostly found in meats and dairy products, as
well as some vegetable oils. Saturated fats tend to increase blood cholesterol levels.
Most saturated fats tend to solid at room temperature.
Results from chronic deficiencies: Having a lack of saturated fats in a diet, aid in
lower the risk for atherosclerosis cardiovascular disease, stroke and cancer.
3 Foods Resources
Coconut Oil
Butter
Dark Chocolate
Resources: http://www.ncbi.nlm.nih.gov/pmc/articles/PMC2943062/
http://www.healthaliciousness.com/articles/foods-highest-in-saturated-fat.php
o EFA:n-6
Main Function:
7
Results from chronic deficiencies:
3 Food Sources
Pecans
Sunflower seed oil
Whole grain breads
o EFA: n-3
Main Function: Omega 3 fatty acids are vital for normal metabolism. It also helps
lower the risk of chronic diseases such as heart disease, cancer, and arthritis . Omega
3 fatty acids are highly concentrated in the brain and are important for cognitive and
behavioral function
Results from chronic deficiencies: Include fatigue, poor memory, dry skin
3 Food Sources
Fish oils
Flaxseed oil
Hemp oil
Resources: http://www.umm.edu/altmed/articles/omega-3-000316.htm
Vitamins
o Vitamin D
Main Function: is to maintain normal blood levels of calcium and phosphorus.
Vitamin D aid in the absorption of calcium helping form and maintain strong bones
Results from chronic deficiencies: Rickets and osteomalacia are classic vitamin D
deficiency diseases.
3 Food Sources
Fish
Eggs
Fortified Milk
o Vitamin E
Main function: Vitamin E has been proposed for the prevention or treatment of
numerous conditions, often based on its antioxidant properties
Results from chronic deficiencies: the treatment for a lack of Vitamin D is rare
3 Food Sources
Meats
Nuts
Poultry
Minerals
o Magnesium
Main Function: It helps maintain normal muscle and nerve function, keeps the heart
rhythm steady, supports a healthy immune system, and keeps bones strong.
Results from chronic deficiencies: symptoms of deficiency may include agitation,
anxiety, restless leg syndrome (RLS), sleep disorders, irritability, nausea, and
vomiting
3 Food Sources
Whole grains
Green vegetables
Leafy greens
o Zinc
Main Function: it is needed for the body’s defensive (immune) system to properly
work.
Results from Chronic deficiencies: Difficulty sleeping through the night, dandruff,
hangs nails, skin lesions hair loss, inflammatory bowel disease.
3 Food Sources
Oysters
8
Toasted Wheat Germ
o Sodium
Main Function: maintaining blood volume and blood pressure by attracting and
holding water.
Results of chronic deficiency: Hypontraemia, is a condition that occurs when the
levels of sodium in the body is abnormally low
3 Food Sources
Meat
Fish
Dairy
Resources: http://extension.usu.edu/files/publications/publication/FN_220.pdf http://www.mayoclinic.com/health/hyponatremia/DS00974
EXCESS
Vitamins
o Thiamin
Main Function : Helps the body’s cell convert carbohydrates into energy. It is also
essential for the functioning of the heart, muscles, and nervous system
Results from chronic deficiency: Wet beriberi and dry beriberi. Wet beriberi includes
symptoms somewhat like those of congestive heart failure, including difficulty
breathing and lower leg swelling. Dry beriberi affects nerves and has symptoms that
include weakness and paralysis.
Resources: http://health.nytimes.com/health/guides/nutrition/thiamine/overview.html o Riboflavin
Main Function : helps convert carbohydrates in into fuel. It also works as an
antioxidant by fighting damaging particles in the body.
Results from chronic deficiency: Produces lesions on the skin, lesions of smooth
surfaces in the digestive tract, or nervous system
o Niacin
Main Function: Is needed for energy, metabolism, proper digestion, and healthy
nervous system.
Results from chronic deficiency: Skin lesions, edema on the tongue, ulcerations on
the inside of the cheek, mucous membrane of the lower lip.
o B6
Main function: is essential for growth, development, and a variety of other bodily
functions
Results from chronic deficiency: Are rarely seen in people
o B12
Main Function: is needed for building proteins in the body, red blood cells and normal
function of nervous system.
Results from chronic deficiency: pernicious anemia
o Folate
Main Function: Is a highly essential nutrient for the proper functioning and
maintenance of our body
Results from chronic deficiency: Include headache, fatigue, palpitations, diarrhea, and
difficulty concentrating
o Vitamin C
Main functions: Contributes to good cellular growth, promote functions of the
circulatory system, and generally help our bodies develop and maintain themselves
Results from chronic deficiency: Fatigue, Mood changes . weight loss, Joint and
muscle aches, bruising, dry hair and skin, infections
o Vitamin A
Main Function: Helps maintain healthy skin, teeth, skeletal and soft tissue ,a nod
vision

9
Results from chronic deficiency: Changes in eyes, nictalopia or blindness,
Xerophthalmia, Epithelial changes, skin changes
Minerals
o Iron
Main Function: To make oxygen-carrying proteins hemoglobin and myglobin
Results from chronic deficiency: anemia
3. Perfect Plan Analysis (PPA)
“3.PPA”
See Appendix 4 (pg. 58)
o Tools: WB4 and Excel tab “3.PPA”
o Summary: Complete tab 3 by inputting WB4 “Intake vs. Goal.” This will provide the data in
which you can analyze your baseline meal plan (WB1) to you thoughtfully nutritious WB4 3-
day meal plan.
o Instructions: Input the WB4 data in the tab “3.PPA” for Column C and D. Keep in mind that
you should ONLY INPUT NUMBERS. The formulas have been setup for your convenience,
but will only work if you follow these instructions. Highlight Column D according to your
forgivables.
o Highlight the nutrients on Colum F which you overcame deficiencies and excess from
WB1. Provide a bulleted discussion for each nutrient affected and how you overcame
these.
OVERCAME DEFICIENCIES
Water
Fiber
Saturated
EFAn-6
EFA
o Essay:
In the comparison between the dietary log from WB1 and WB4 a dramatic change occurred.
Although WB4 was designed to be the “perfect day” that actually did not occur, it put into perspective for
me how much easier it is to obtain the nutrients from the food consumed without in taking other unnecessary
chemicals and calories. Coordinating the “perfect day” was not as difficult as I thought it would be given the
ranges I had to follow I was able to add in most importantly more consumption of water, along with adding
in various types of whole foods such fruits and vegetables. While at the same eliminating processed foods
that did not contain the nutritional value as that of the whole foods.
The recommended daily intake value for Sodium as followed by the DASH diet recommendation
falls between 1,500 mg/d to 2,300 mg/d. Personally the food that I was consuming that was prepared by
another often times was what was higher in my sodium intake from WB1, ex. Eggs Benedict (860.25 mg),
home fries (356.7mg), rice with steamed vegetables (3125.11), and Gatorade (190.3mg). I have since
decided to change my eating habits to include more at home meals versus going out to eat at restaurants, this
way I am able to control the amount of salt (sodium) that is added to my food. In regards to the minerals I
was only lacking in Vitamin D. In WB4 I actually was not able to raise to the appropriate level, I actually
decreased in the amount I consumed. In researching Vitamin D foods I now know I need to consume more
foods such as Milk, Cereal or Salmon all of which are fortified with Vitamin D.
The DASH (Dietary Approach to Stop Hypertension) is a dietary plan promoted by the U.S. based
National Heart, Lung, and Blood Institute. It was developed to prevent and control hypertension. The DASH
diet is rich in fruits vegetables whole grains, and low fat dairy foods. It was designed to affect blood
pressure, as well as be a basis for a well balanced approach to eating.
10
4. Super Foods
WB4 & Excel Tab 4
See Appendix 4
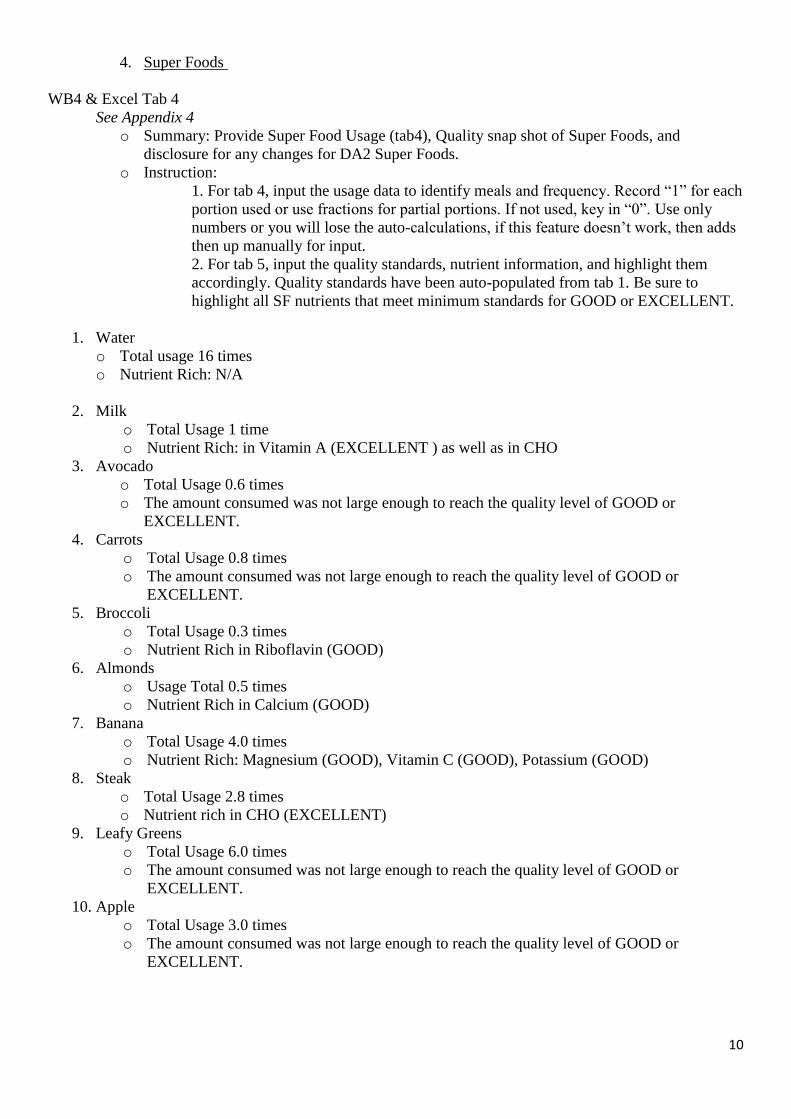
o Summary: Provide Super Food Usage (tab4), Quality snap shot of Super Foods, and
disclosure for any changes for DA2 Super Foods.
o Instruction:
1. For tab 4, input the usage data to identify meals and frequency. Record “1” for each
portion used or use fractions for partial portions. If not used, key in “0”. Use only
numbers or you will lose the auto-calculations, if this feature doesn’t work, then adds
then up manually for input.
2. For tab 5, input the quality standards, nutrient information, and highlight them
accordingly. Quality standards have been auto-populated from tab 1. Be sure to
highlight all SF nutrients that meet minimum standards for GOOD or EXCELLENT.
1. Water
o Total usage 16 times
o Nutrient Rich: N/A
2. Milk
o Total Usage 1 time
o Nutrient Rich: in Vitamin A (EXCELLENT ) as well as in CHO
3. Avocado
o Total Usage 0.6 times
o The amount consumed was not large enough to reach the quality level of GOOD or
EXCELLENT.
4. Carrots
o Total Usage 0.8 times
o The amount consumed was not large enough to reach the quality level of GOOD or
EXCELLENT.
5. Broccoli
o Total Usage 0.3 times
o Nutrient Rich in Riboflavin (GOOD)
6. Almonds
o Usage Total 0.5 times
o Nutrient Rich in Calcium (GOOD)
7. Banana
o Total Usage 4.0 times
o Nutrient Rich: Magnesium (GOOD), Vitamin C (GOOD), Potassium (GOOD)
8. Steak
o Total Usage 2.8 times
o Nutrient rich in CHO (EXCELLENT)
9. Leafy Greens
o Total Usage 6.0 times
o The amount consumed was not large enough to reach the quality level of GOOD or
EXCELLENT.
10. Apple
o Total Usage 3.0 times
o The amount consumed was not large enough to reach the quality level of GOOD or
EXCELLENT.
11
The main motivation behind choosing these foods was availability. Adjusting ones diet can often
times make it difficult to continue to live a healthy life style if the changes are that are made occur
too drastically. With choosing my super foods I choose things that are easily accessible and really
have not preparation time, except Meat. Having the ability to go to a local farmer’s market that I
frequently visit, in Claremont on Sunday mornings was my primary reason for choosing these top 10
food s for me.
5. Farm to Table
WB 6 & WB 7
See pages 3-4
Super Food: Spinach
Eating more fruits and vegetables is all part of maintaining a healthy diet and lifestyle. Trying to
broadened ones choices of vegetables can begin with making the simple choice of eating more spinach.
Spinach is a leafy green that is abundant in vitamins and minerals especially folic acid. Studies have shown
that spinach is very beneficial to eye health, bone development, and aids in the maintenance of the digestive
system.
Spinach is an edible flowering plant in the family of Amaranthaceae. It is native to central and
southwestern Asia. Over the past few years California and Arizona are leading producers of spinach.
California produces far more fresh spinach than processing spinach but is also the leading producer of
processing spinach. Arizona mainly produces fresh spinach. California produces spinach in four areas: the
southern desert valleys (Imperial and Riverside Counties); the southern coast (Santa Barbara and Ventura
Counties); the central coast (Monterey, San Benito, Santa Clara, and Santa Cruz Counties); and the central
San Joaquin Valley. Spinach is produced virtually all year in the coastal valleys, with a slight decrease in
December and January. The market for spinach has three commodities, the fresh clipped and bagged, and
fresh market bunched, and frozen.
This flower like plant is a quick-maturing cool-season vegetable crop. The seed germinate at 35 to 85
degrees F but most growth is rapid between 60 to 65 degrees. Spinach is able to withstand low temperatures
without great injury. There is a variety of soils used for spinach production, but in most regions loam soil is
preferred, depending on the nature of the soil conditions 2 – 4 inches of water are applied using sprinklers to
moisten the soil for tillage and seedbed preparation. Spinach grows quickly and it can be harvested and
eaten after only 37 to 45 days.
Because a significant percentage of spinach is grown for use on prewashed, packaged salad mixtures,
tolerance for insect damage and presence of insects is extremely low. Hence, insect management is critical
for this commodity. Leaf miners are a serious problem, the damage results from when the female flies
puncture leaves to feed on the plant sap and laying their eggs in the leaf tissue. After the eggs hatch larvae
feed between the upper and lower leaf surfaces and make distinctive winding, whitish tunnels or mines.
Mining reduces photosynthetic capacity of the leaves and also renders them unmarketable.
With in the past few months spinach has not made news headlines. But in the month of February
Taylor Farms Retail Inc., located across the United States including Tracy, Salinas, and Gonzales,
California, placed a voluntary withdrawal of organic baby spinach in fears that it may be contaminated with
E. coli bacteria. The recall was for organic baby spinach sold in 5-ounce or 16-ounce salad trays under five
brand names, Central Market Organics, Full Circle Organics, Marketside Organics, Simple Truth Organic,
and Taylor Farms Organic. The company said it knew of no one who had gotten sick, and that they do not
know how the spinach may have been contaminated.
References
http://www.agmrc.org/commodities__products/vegetables/spinach-profile/

12
http://anrcatalog.ucdavis.edu/pdf/7212.pdf
http://www.webmd.com/food-recipes/food-poisoning/news/20130219/taylor-farms-spinach-recall
6. My Plate WB 4
See Appendix4
o Tools: WB 4
o Summary; Provide summary analysis of WB4 DRI (Intake vs. Goal) and compare this to My plate.
o Instructions: Simple provide six bullets corresponding to your WB 4 “My Plate Analysis” categories.
For each section:
o State the “goal”, “actual” and % Goal
1.
o What is your opinion as to the quality of the information provided on the MyPlate analysis
vs. DRI Goals?
The quality of information that is provided on the My Plate Analysis personally I think is more beneficial. It
allows the user a better understanding of the components of what they are eating and exactly what is in they
are consuming. The DRI goals are a little more generalized where as My Plate goes more in depth
o Do you believe MyPlate is a user friendly application that many can access? Discuss your
rationale behind your answer and give some specifics.
Yes, I believe My Plate is a user friendly application that anyone can use. As you continually use it you will
find tricks to getting around the application more easily. When you enter the application the website is set up
with 6 main headers and clicking on them will take you more in depth into the category. For example if you
click on the “My Plate”, 6 different categories are populated Fruits, Vegetables, Grains, Protein Foods,
Dairy, and Oils. After choosing a topic you can learn, What’s in the Fruit Group?, How Much is needed?.
What counts as a cup?, The health benefits and Nutrients, and Tips to help you eat fruits.
7. Water
Water: The human body was created to work as efficiently and productively as possible. The fuel
that is used to maintain this level of productivity is created from the food and nutrients that is absorbed into
the body on a daily basis. From a variety of foods we gain a multitude of vitamins and minerals, but often
we forget about the importance of consistently incorporating water into our diet. Water makes up to at least
70% of the human body; muscles consist of 75 % water, the brain consists of 90 % water, bones consist of
22% water, and blood is made up 83% water. Water serves a vital part in maintaining the functionality of the
body. Water transports nutrients and oxygen into cells, protects the vital organs, detoxifies, regulates body
temperature, and helps with metabolism.
Incorporating more water into your daily diet can be beneficial in many different ways. The results
are not only shown on the exterior but on the interior as well. We need to remember that in your diet we
need to “eat our calories and not drink them,” because when you drink your calories often times we are
naive to how much we are actually consuming. Comparing a regular glass of water to a soda, or juice, there
are certain things found in those drinks that are not found in water. Those ingredients are often times

13
caffeine, sugar, and calories. Ingesting these drinks that are loaded with calories, and unnecessary sugars,
will often leave your thirst unsatisfied causing you to drink more and ingest more and more calories. It has
been proven that when drinks that are high in sugar or caffeine are replaced with water a person is liable to
lose more and maintain a healthy weight than if they did not. The body can only burn so much of the sugar
that is ingested to the point that the body stores the sugar as fat causing individuals to gain weight over a
period of time, if the sugar is not being burned right away. The storage of sugar into fat can lead to different
health conditions such as obesity, and diabetes.
Including juices in a meal plan instead of water I used to think could not possibly cause that much
harm, but after watching, Weight of a Nation, I now realize that doing so is not the intelligent decision that
we should be making. I must admit that I used to think that juice comes from fruit so it must be okay to
drink, not realizing everything that goes into making the juice. It was hard for me to understand that one 8
oz. glass of orange juice could possibly contain as much as 10 tablespoons of sugar in it, was astounding.
Having that example placed in front of me made an impact on my decisions on how much juice I consume.
Being shown the examples of the individuals affected me as well because often times the ones
effected are the ones that have no other choice and those individuals are, the children. Gaining the
knowledge needed to teach children about the food they chose to put into their bodies and the adverse
reactions their decisions make is extremely important and will help the children grow up healthy and disease
free. Making sure people are aware of what they put into their bodies is important,
8. Fiber
Dietary Fiber is essential for a healthy diet. Fiber provides many health benefits. Dietary fiber is found
mainly in fruits, vegetables, whole grains and legumes, it is best known for its ability to prevent or relieve
constipation. Foods that contain fiber can provide other health benefits as well, such as helping maintain a
healthy weight and lowering your risk of diabetes and heart disease. Consuming the daily recommended
amount of fiber , 21-29 grams for adults’ women and 30-38 grams for adult men, aids in the promotion of
colon health, reduce the cholesterol and help maintain normal blood sugar levels after meals. Dietary Fiber
also increases satiety and studies have shown that certain fibers may help maintain normal blood pressure or
have a protective effect against certain cancers.
Fiber is also known as bulk, it includes all parts of plant foods that your body can’t digest or absorb. Unlike
other food components, such as fats, proteins or carbohydrates, fiber isn’t digested by your body. instead it
passes relatively intact through your stomach, small intestine, and colon and out your body. Fiber helps to
keep your bowel movements regular and ward off certain disease. Carcinogens in our intestines bind to it
and move more quickly than they otherwise would, reducing our risk for colon cancer. Fiber also helps
transport cholesterol out of the body, reducing your risk for heart disease.
Populations that eat greater amounts of fiber rich foods are generally healthier. Fibers greatest value is that it
aids in helping us keep slim. Fiber makes us feel full sooner and stay in your stomach longer than other
substances we eat, slowing down your rate of digestion and keeping us full longer. For example the fiber
content in a single serving of whole grain bread is more filling than two servings of white bread. Fiber also
moves fat through our digestive system faster so that less of it is absorbed.
Not all fiber is the same , there are different kinds and each type provides health benefits. Fiber is often
classified as soluble, dissolves in water or insoluble fiber, does not dissolve in water. Fiber is found in
numerous foods, including yogurt, cereals, breads, fruit juices, milk, tortillas, baked goods, ice cream, hard
and chewy candies, and nutrition supplement bars and beverages.
I think including juices into a meal plan in reference to fiber is a good idea as a last alternative. When eating
your food you want to get the most amounts of nutrients from the food you actually chew. Drinking your
nutrients is not the most beneficial way to consume the most the necessary components, because while it is
convenient in some ways in other ways you are losing in taking of other components that in it outweighs the
benefits. Juices taste good and quench the thirst we have at that moment but at what cost. Drinking our fiber
14
will not add in the feeling of satiety, that chewing and swallowing your food can give you, so if you must
drink your fiber but for me I prefer a piece of broccoli over a juiced cup of broccoli.
http://www.ncbi.nlm.nih.gov/pubmed/19857627
9. My Wellness Life
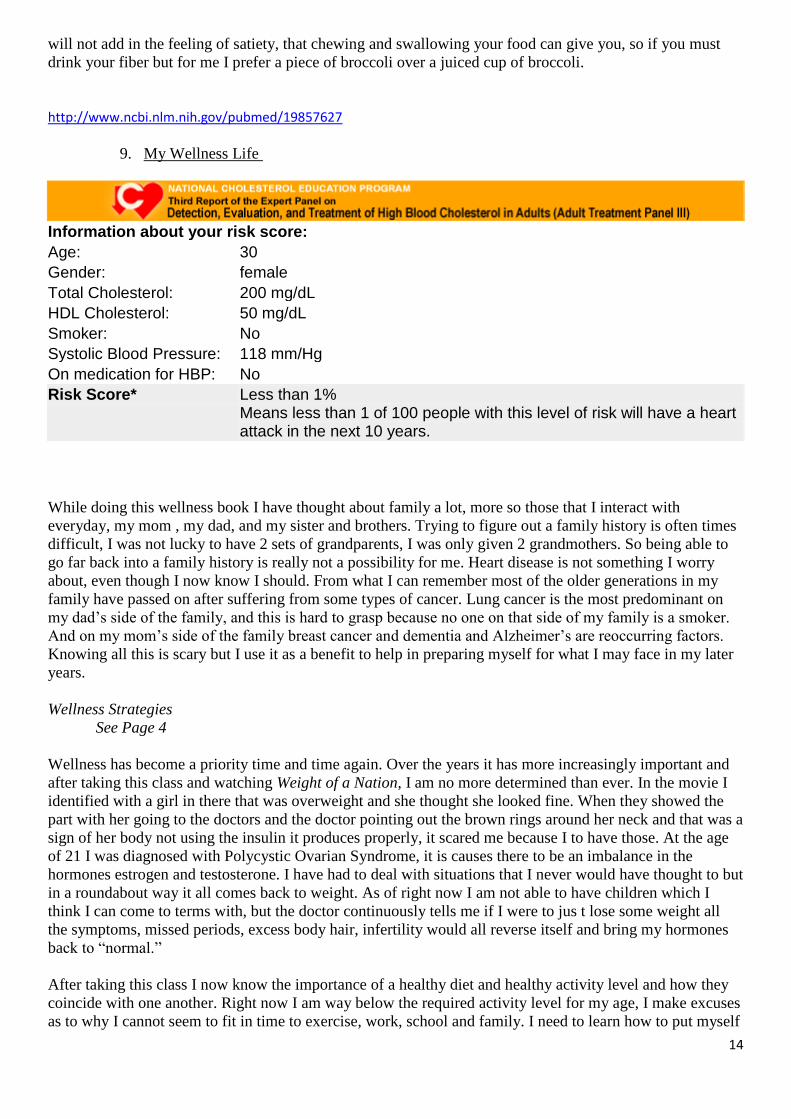
Information about your risk score:
Age: 30
Gender: female
Total Cholesterol: 200 mg/dL
HDL Cholesterol: 50 mg/dL
Smoker: No
Systolic Blood Pressure: 118 mm/Hg
On medication for HBP: No
Risk Score* Less than 1% Means less than 1 of 100 people with this level of risk will have a heart attack in the next 10 years.
While doing this wellness book I have thought about family a lot, more so those that I interact with
everyday, my mom , my dad, and my sister and brothers. Trying to figure out a family history is often times
difficult, I was not lucky to have 2 sets of grandparents, I was only given 2 grandmothers. So being able to
go far back into a family history is really not a possibility for me. Heart disease is not something I worry
about, even though I now know I should. From what I can remember most of the older generations in my
family have passed on after suffering from some types of cancer. Lung cancer is the most predominant on
my dad’s side of the family, and this is hard to grasp because no one on that side of my family is a smoker.
And on my mom’s side of the family breast cancer and dementia and Alzheimer’s are reoccurring factors.
Knowing all this is scary but I use it as a benefit to help in preparing myself for what I may face in my later
years.
Wellness Strategies
See Page 4
Wellness has become a priority time and time again. Over the years it has more increasingly important and
after taking this class and watching Weight of a Nation, I am no more determined than ever. In the movie I
identified with a girl in there that was overweight and she thought she looked fine. When they showed the
part with her going to the doctors and the doctor pointing out the brown rings around her neck and that was a
sign of her body not using the insulin it produces properly, it scared me because I to have those. At the age
of 21 I was diagnosed with Polycystic Ovarian Syndrome, it is causes there to be an imbalance in the
hormones estrogen and testosterone. I have had to deal with situations that I never would have thought to but
in a roundabout way it all comes back to weight. As of right now I am not able to have children which I
think I can come to terms with, but the doctor continuously tells me if I were to jus t lose some weight all
the symptoms, missed periods, excess body hair, infertility would all reverse itself and bring my hormones
back to “normal.”
After taking this class I now know the importance of a healthy diet and healthy activity level and how they
coincide with one another. Right now I am way below the required activity level for my age, I make excuses
as to why I cannot seem to fit in time to exercise, work, school and family. I need to learn how to put myself

15
first, I am scared of no tabooing able to succeed in the attempt to lose weight. It is a scary feeling but I think
it is more accomplishable now that I am armed with all the nutritional information that I have gained from
this class. Nutrition has becomes very important to me. I plan to continue this journey for the rest of my life,
and incorporate it in to my daily life.
16
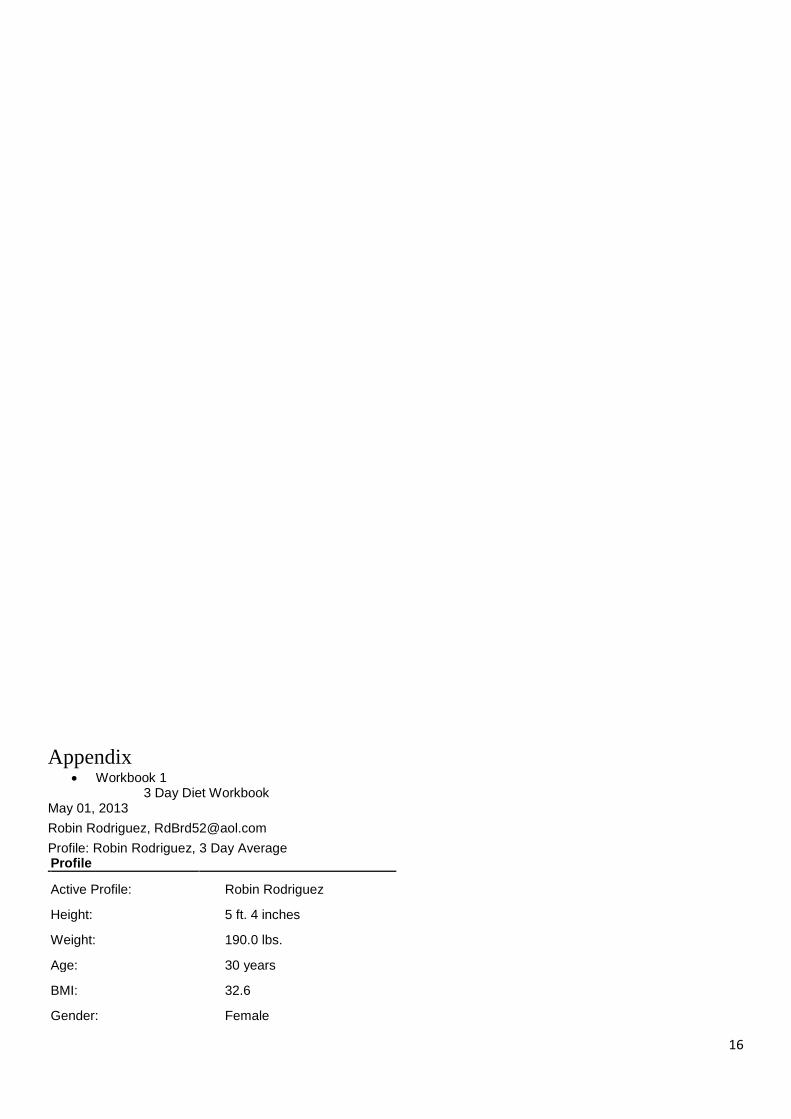
Appendix
Workbook 1 3 Day Diet Workbook
May 01, 2013 Robin Rodriguez, [email protected] Profile: Robin Rodriguez, 3 Day Average Profile
Active Profile: Robin Rodriguez
Height: 5 ft. 4 inches
Weight: 190.0 lbs.
Age: 30 years
BMI: 32.6
Gender: Female

17
Pregnancy: Not Pregnant
Activity Level: Low Active
Smoker: No
Strict Vegetarian/Vegan: No
DRI Goals
Nutrient DRI
Energy
Kilocalories 2431 kcal
Protein 68.95 g Daily requirement based on grams per
kilogram of body weight
Carbohydrate 270.0 - 390.0 g
Fat, Total 53.0 - 93.0 g No recommendation
Fat
Saturated Fat < 24 g Less than 10% of calories
Monounsaturated Fat * No recommendation
Polyunsaturated Fat * No recommendation
Trans Fatty Acid * No recommendation
Cholesterol < 300 mg Less than 300mg recommended
Essential Fatty Acids
Omega-6 Linoleic 12 g
Omega-3 Linolenic 1.1 g
Carbohydrates
18
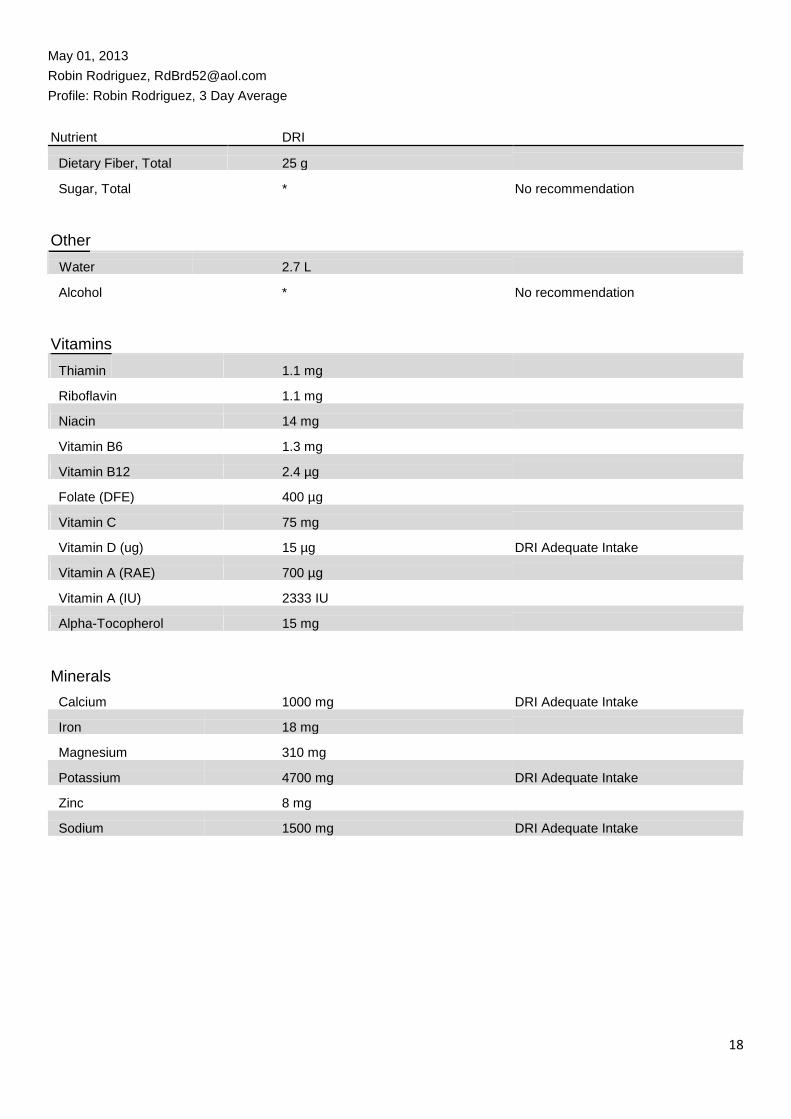
May 01, 2013 Robin Rodriguez, [email protected] Profile: Robin Rodriguez, 3 Day Average
Nutrient DRI
Dietary Fiber, Total 25 g
Sugar, Total * No recommendation
Other
Water 2.7 L
Alcohol * No recommendation
Vitamins
Thiamin 1.1 mg
Riboflavin 1.1 mg
Niacin 14 mg
Vitamin B6 1.3 mg
Vitamin B12 2.4 µg
Folate (DFE) 400 µg
Vitamin C 75 mg
Vitamin D (ug) 15 µg DRI Adequate Intake
Vitamin A (RAE) 700 µg
Vitamin A (IU) 2333 IU
Alpha-Tocopherol 15 mg
Minerals
Calcium 1000 mg DRI Adequate Intake
Iron 18 mg
Magnesium 310 mg
Potassium 4700 mg DRI Adequate Intake
Zinc 8 mg
Sodium 1500 mg DRI Adequate Intake
19
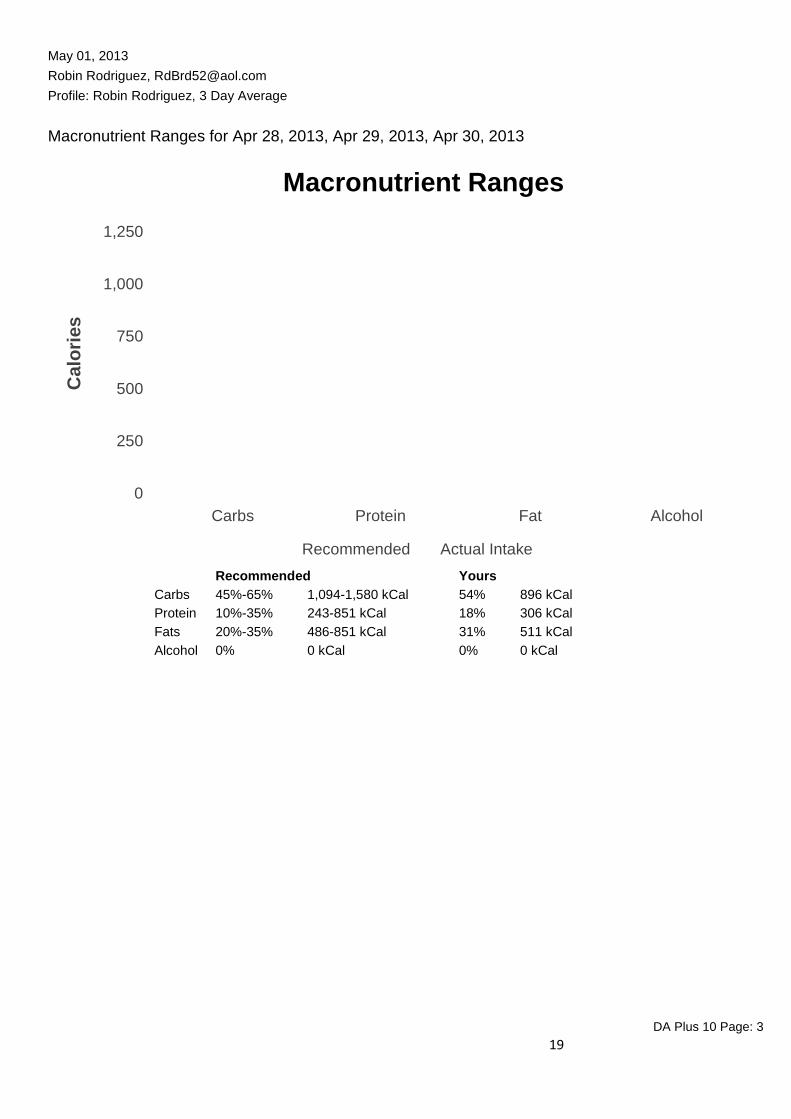
May 01, 2013 Robin Rodriguez, [email protected] Profile: Robin Rodriguez, 3 Day Average
Macronutrient Ranges for Apr 28, 2013, Apr 29, 2013, Apr 30, 2013
Macronutrient Ranges
Ca
lori
es
1,250
1,000
750
500
250
0
Carbs Protein Fat Alcohol
Recommended Actual Intake
Recommended Yours
Carbs 45%-65% 1,094-1,580 kCal 54% 896 kCal
Protein 10%-35% 243-851 kCal 18% 306 kCal
Fats 20%-35% 486-851 kCal 31% 511 kCal
Alcohol 0% 0 kCal 0% 0 kCal DA Plus 10 Page: 3

20
May 01, 2013 Robin Rodriguez, [email protected] Profile: Robin Rodriguez, 3 Day Average
Fat Breakdown for Apr 28, 2013, Apr 29, 2013, Apr 30, 2013 Source of Fat 0% 25% 50% 75% 100% Saturated Fat 8%
Monounsaturated Fat 10%
Polyunsaturated Fat 6%
Trans Fatty Acid 2%
Unspecified 4% * Transfat data is not yet reported by all sources and therefore may be under-represented.
DA Plus 10 Page: 4
21
May 01, 2013 Robin Rodriguez, [email protected] Profile: Robin Rodriguez, 3 Day Average
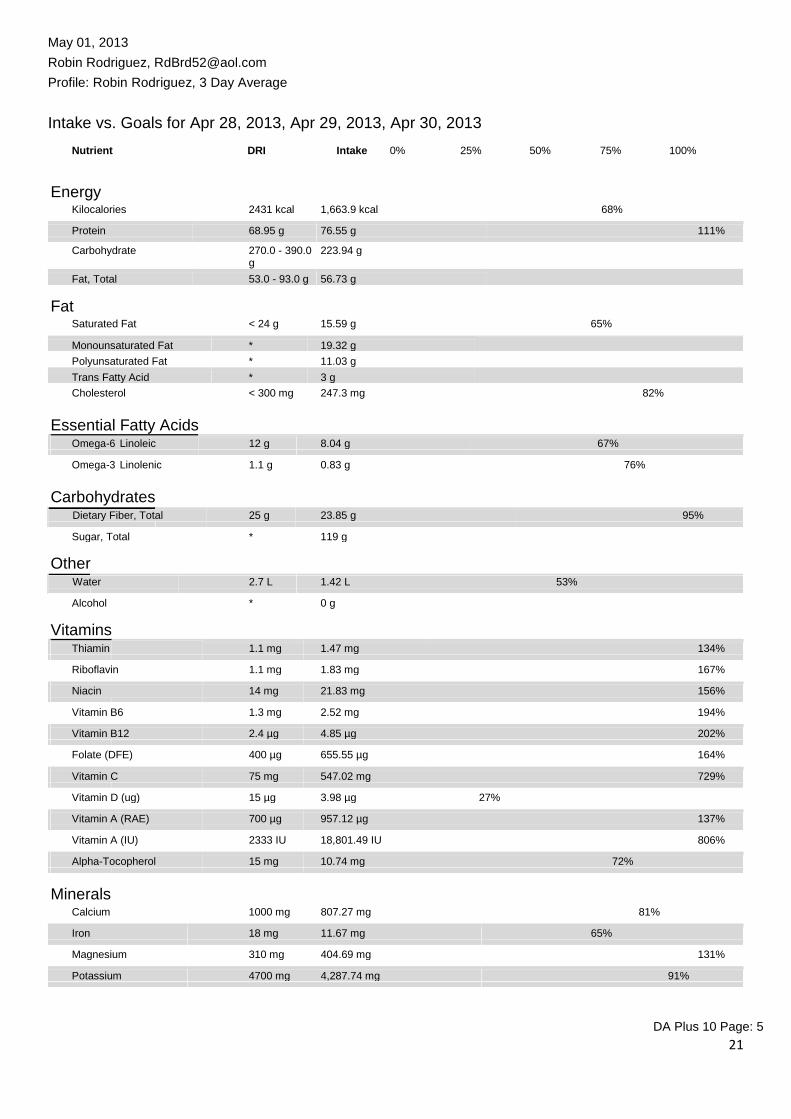
Intake vs. Goals for Apr 28, 2013, Apr 29, 2013, Apr 30, 2013
Nutrient DRI Intake 0% 25% 50% 75% 100%
Energy Kilocalories 2431 kcal 1,663.9 kcal 68%
Protein 68.95 g 76.55 g 111%
Carbohydrate 270.0 - 390.0 223.94 g g
Fat, Total 53.0 - 93.0 g 56.73 g Fat
Saturated Fat < 24 g 15.59 g 65%
Monounsaturated Fat * 19.32 g
Polyunsaturated Fat * 11.03 g
Trans Fatty Acid * 3 g
Cholesterol < 300 mg 247.3 mg 82% Essential Fatty Acids Omega-6 Linoleic 12 g 8.04 g 67%
Omega-3 Linolenic 1.1 g 0.83 g 76% Carbohydrates
Dietary Fiber, Total 25 g 23.85 g 95%
Sugar, Total * 119 g Other
Water 2.7 L 1.42 L 53%
Alcohol * 0 g Vitamins Thiamin 1.1 mg 1.47 mg 134%
Riboflavin 1.1 mg 1.83 mg 167%
Niacin 14 mg 21.83 mg 156%
Vitamin B6 1.3 mg 2.52 mg 194%
Vitamin B12 2.4 µg 4.85 µg 202%
Folate (DFE) 400 µg 655.55 µg 164%
Vitamin C 75 mg 547.02 mg 729%
Vitamin D (ug) 15 µg 3.98 µg 27%
Vitamin A (RAE) 700 µg 957.12 µg 137%
Vitamin A (IU) 2333 IU 18,801.49 IU 806%
Alpha-Tocopherol 15 mg 10.74 mg 72%
Minerals
Calcium 1000 mg 807.27 mg 81%
Iron 18 mg 11.67 mg 65%
Magnesium 310 mg 404.69 mg 131%
Potassium 4700 mg 4,287.74 mg 91%
DA Plus 10 Page: 5
22
May 01, 2013 Robin Rodriguez, [email protected] Profile: Robin Rodriguez, 3 Day Average
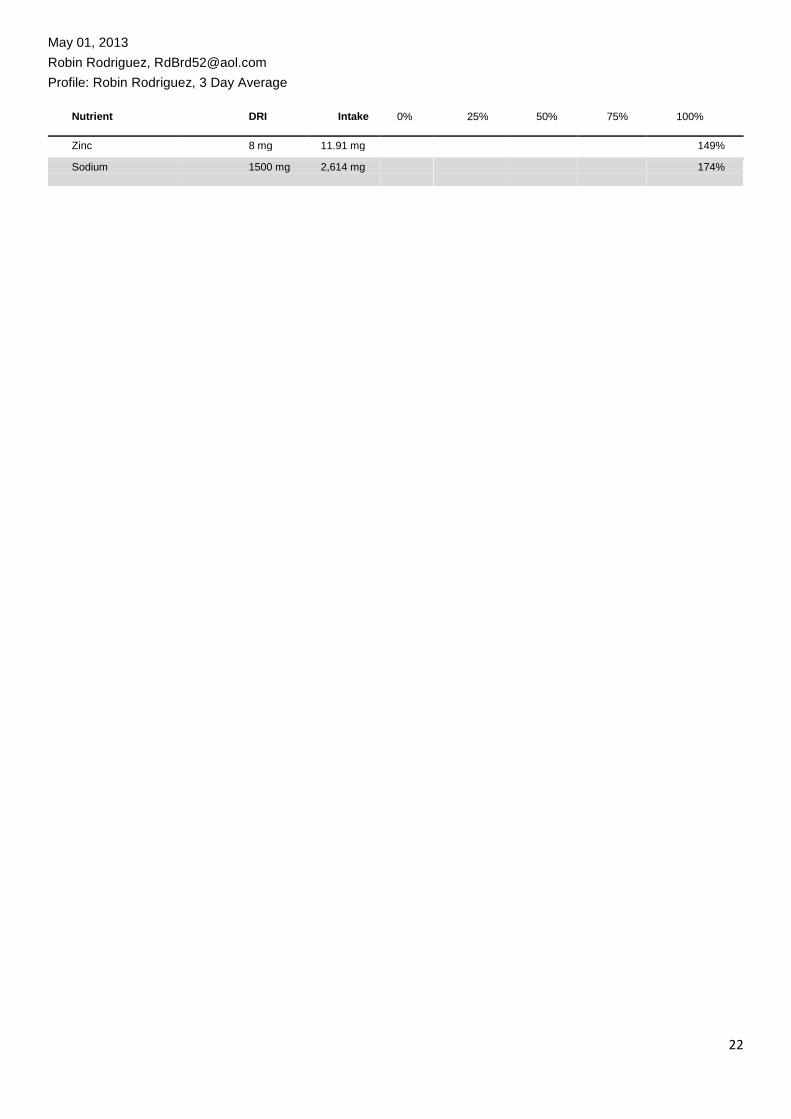
Nutrient DRI Intake 0% 25% 50% 75% 100%
Zinc 8 mg 11.91 mg 149%
Sodium 1500 mg 2,614 mg 174%
23
May 01, 2013 Robin Rodriguez, [email protected] Profile: Robin Rodriguez, 3 Day Average
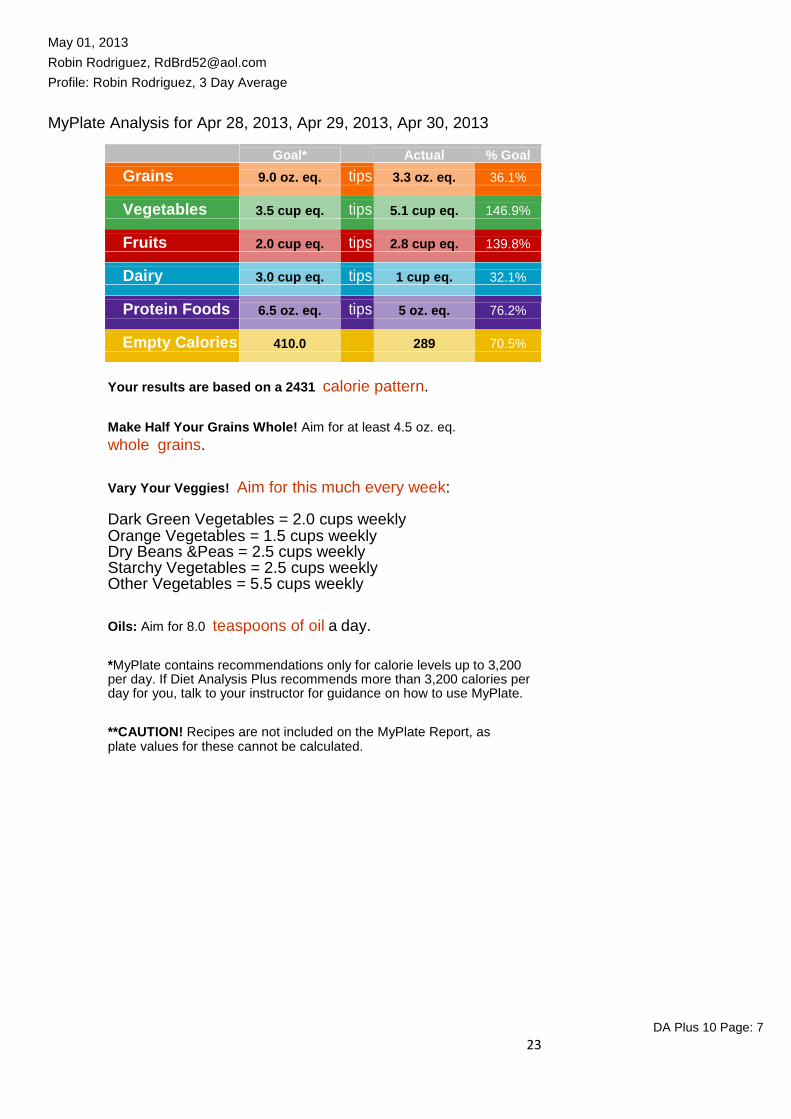
MyPlate Analysis for Apr 28, 2013, Apr 29, 2013, Apr 30, 2013
Goal* Actual % Goal
Grains 9.0 oz. eq. tips 3.3 oz. eq. 36.1%
Vegetables 3.5 cup eq. tips 5.1 cup eq. 146.9%
Fruits 2.0 cup eq. tips 2.8 cup eq. 139.8%
Dairy 3.0 cup eq. tips 1 cup eq. 32.1%
Protein Foods 6.5 oz. eq. tips 5 oz. eq. 76.2%
Empty Calories 410.0 289 70.5%
Your results are based on a 2431 calorie pattern.
Make Half Your Grains Whole! Aim for at least 4.5 oz. eq.
whole grains.
Vary Your Veggies! Aim for this much every week:
Dark Green Vegetables = 2.0 cups weekly Orange Vegetables = 1.5 cups weekly Dry Beans &Peas = 2.5 cups weekly Starchy Vegetables = 2.5 cups weekly Other Vegetables = 5.5 cups weekly
Oils: Aim for 8.0 teaspoons of oil a day.
*MyPlate contains recommendations only for calorie levels up to 3,200 per day. If Diet Analysis Plus recommends more than 3,200 calories per day for you, talk to your instructor for guidance on how to use MyPlate.
**CAUTION! Recipes are not included on the MyPlate Report, as plate values for these cannot be calculated.
DA Plus 10 Page: 7
24
May 01, 2013 Robin Rodriguez, [email protected] Profile: Robin Rodriguez, 3 Day Average
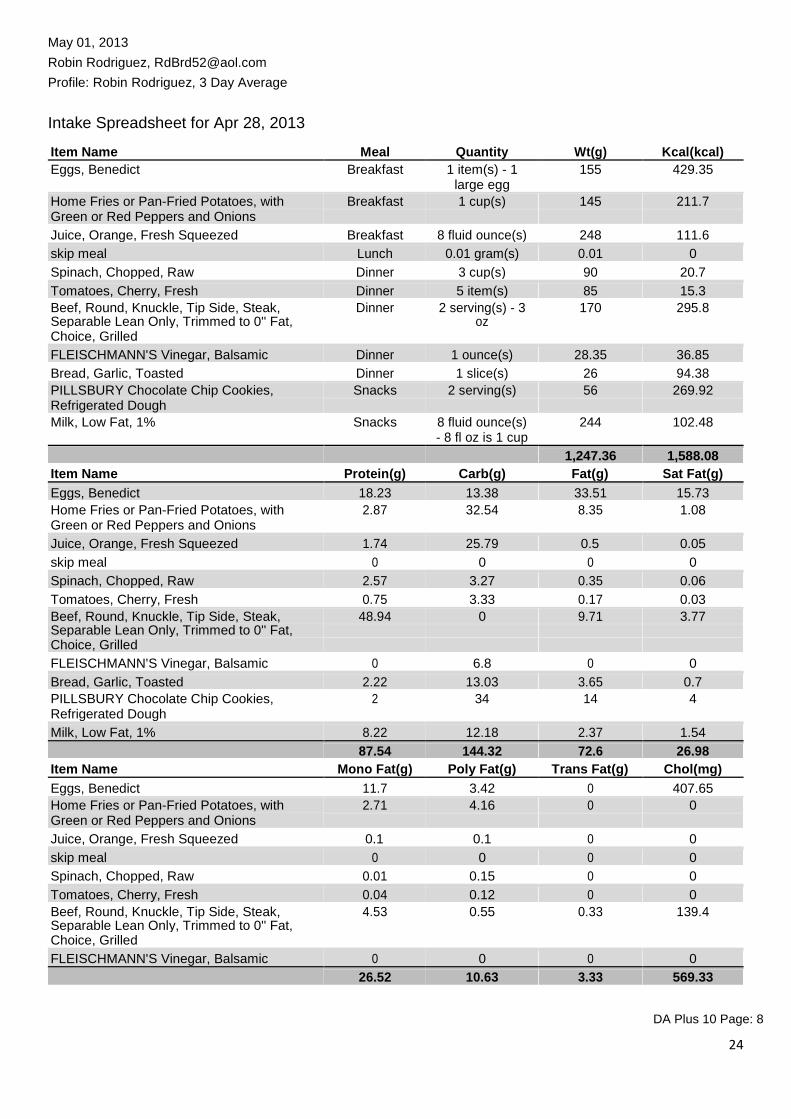
Intake Spreadsheet for Apr 28, 2013 Item Name Meal Quantity Wt(g) Kcal(kcal) Eggs, Benedict Breakfast 1 item(s) - 1 155 429.35 large egg
Home Fries or Pan-Fried Potatoes, with Breakfast 1 cup(s) 145 211.7 Green or Red Peppers and Onions
Juice, Orange, Fresh Squeezed Breakfast 8 fluid ounce(s) 248 111.6
skip meal Lunch 0.01 gram(s) 0.01 0
Spinach, Chopped, Raw Dinner 3 cup(s) 90 20.7
Tomatoes, Cherry, Fresh Dinner 5 item(s) 85 15.3 Beef, Round, Knuckle, Tip Side, Steak, Dinner 2 serving(s) - 3 170 295.8 Separable Lean Only, Trimmed to 0'' Fat, oz
Choice, Grilled
FLEISCHMANN'S Vinegar, Balsamic Dinner 1 ounce(s) 28.35 36.85
Bread, Garlic, Toasted Dinner 1 slice(s) 26 94.38 PILLSBURY Chocolate Chip Cookies, Snacks 2 serving(s) 56 269.92 Refrigerated Dough
Milk, Low Fat, 1% Snacks 8 fluid ounce(s) 244 102.48 - 8 fl oz is 1 cup
1,247.36 1,588.08 Item Name Protein(g) Carb(g) Fat(g) Sat Fat(g)
Eggs, Benedict 18.23 13.38 33.51 15.73 Home Fries or Pan-Fried Potatoes, with 2.87 32.54 8.35 1.08 Green or Red Peppers and Onions
Juice, Orange, Fresh Squeezed 1.74 25.79 0.5 0.05
skip meal 0 0 0 0
Spinach, Chopped, Raw 2.57 3.27 0.35 0.06
Tomatoes, Cherry, Fresh 0.75 3.33 0.17 0.03 Beef, Round, Knuckle, Tip Side, Steak, 48.94 0 9.71 3.77 Separable Lean Only, Trimmed to 0'' Fat,
Choice, Grilled
FLEISCHMANN'S Vinegar, Balsamic 0 6.8 0 0
Bread, Garlic, Toasted 2.22 13.03 3.65 0.7 PILLSBURY Chocolate Chip Cookies, 2 34 14 4 Refrigerated Dough
Milk, Low Fat, 1% 8.22 12.18 2.37 1.54
87.54 144.32 72.6 26.98 Item Name Mono Fat(g) Poly Fat(g) Trans Fat(g) Chol(mg)
Eggs, Benedict 11.7 3.42 0 407.65 Home Fries or Pan-Fried Potatoes, with 2.71 4.16 0 0 Green or Red Peppers and Onions
Juice, Orange, Fresh Squeezed 0.1 0.1 0 0
skip meal 0 0 0 0
Spinach, Chopped, Raw 0.01 0.15 0 0
Tomatoes, Cherry, Fresh 0.04 0.12 0 0 Beef, Round, Knuckle, Tip Side, Steak, 4.53 0.55 0.33 139.4 Separable Lean Only, Trimmed to 0'' Fat,
Choice, Grilled
FLEISCHMANN'S Vinegar, Balsamic 0 0 0 0
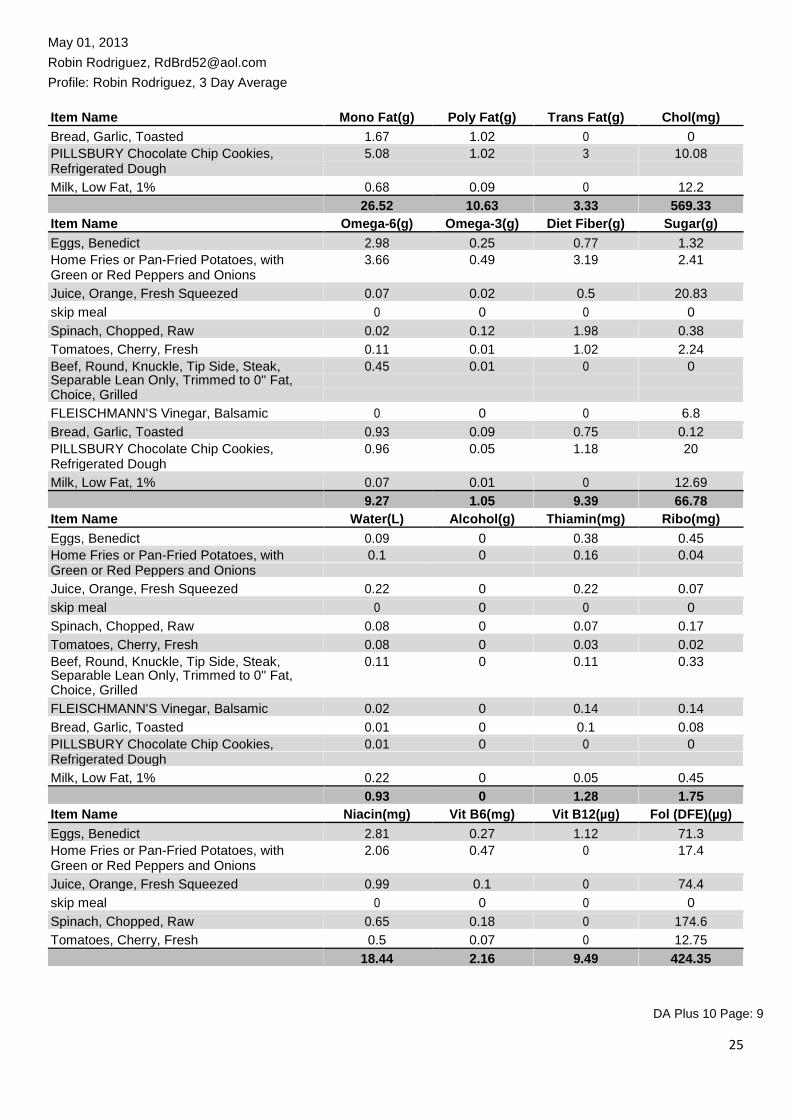
26.52 10.63 3.33 569.33 DA Plus 10 Page: 8
25
May 01, 2013 Robin Rodriguez, [email protected] Profile: Robin Rodriguez, 3 Day Average
Item Name Mono Fat(g) Poly Fat(g) Trans Fat(g) Chol(mg)
Bread, Garlic, Toasted 1.67 1.02 0 0 PILLSBURY Chocolate Chip Cookies, 5.08 1.02 3 10.08 Refrigerated Dough
Milk, Low Fat, 1% 0.68 0.09 0 12.2 26.52 10.63 3.33 569.33 Item Name Omega-6(g) Omega-3(g) Diet Fiber(g) Sugar(g)
Eggs, Benedict 2.98 0.25 0.77 1.32 Home Fries or Pan-Fried Potatoes, with 3.66 0.49 3.19 2.41 Green or Red Peppers and Onions
Juice, Orange, Fresh Squeezed 0.07 0.02 0.5 20.83
skip meal 0 0 0 0
Spinach, Chopped, Raw 0.02 0.12 1.98 0.38
Tomatoes, Cherry, Fresh 0.11 0.01 1.02 2.24 Beef, Round, Knuckle, Tip Side, Steak, 0.45 0.01 0 0 Separable Lean Only, Trimmed to 0'' Fat,
Choice, Grilled
FLEISCHMANN'S Vinegar, Balsamic 0 0 0 6.8
Bread, Garlic, Toasted 0.93 0.09 0.75 0.12 PILLSBURY Chocolate Chip Cookies, 0.96 0.05 1.18 20 Refrigerated Dough
Milk, Low Fat, 1% 0.07 0.01 0 12.69 9.27 1.05 9.39 66.78 Item Name Water(L) Alcohol(g) Thiamin(mg) Ribo(mg)
Eggs, Benedict 0.09 0 0.38 0.45 Home Fries or Pan-Fried Potatoes, with 0.1 0 0.16 0.04 Green or Red Peppers and Onions
Juice, Orange, Fresh Squeezed 0.22 0 0.22 0.07
skip meal 0 0 0 0
Spinach, Chopped, Raw 0.08 0 0.07 0.17
Tomatoes, Cherry, Fresh 0.08 0 0.03 0.02 Beef, Round, Knuckle, Tip Side, Steak, 0.11 0 0.11 0.33 Separable Lean Only, Trimmed to 0'' Fat,
Choice, Grilled
FLEISCHMANN'S Vinegar, Balsamic 0.02 0 0.14 0.14
Bread, Garlic, Toasted 0.01 0 0.1 0.08 PILLSBURY Chocolate Chip Cookies, 0.01 0 0 0 Refrigerated Dough
Milk, Low Fat, 1% 0.22 0 0.05 0.45 0.93 0 1.28 1.75 Item Name Niacin(mg) Vit B6(mg) Vit B12(µg) Fol (DFE)(µg)
Eggs, Benedict 2.81 0.27 1.12 71.3 Home Fries or Pan-Fried Potatoes, with 2.06 0.47 0 17.4 Green or Red Peppers and Onions
Juice, Orange, Fresh Squeezed 0.99 0.1 0 74.4
skip meal 0 0 0 0
Spinach, Chopped, Raw 0.65 0.18 0 174.6
Tomatoes, Cherry, Fresh 0.5 0.07 0 12.75
18.44 2.16 9.49 424.35 DA Plus 10 Page: 9
26
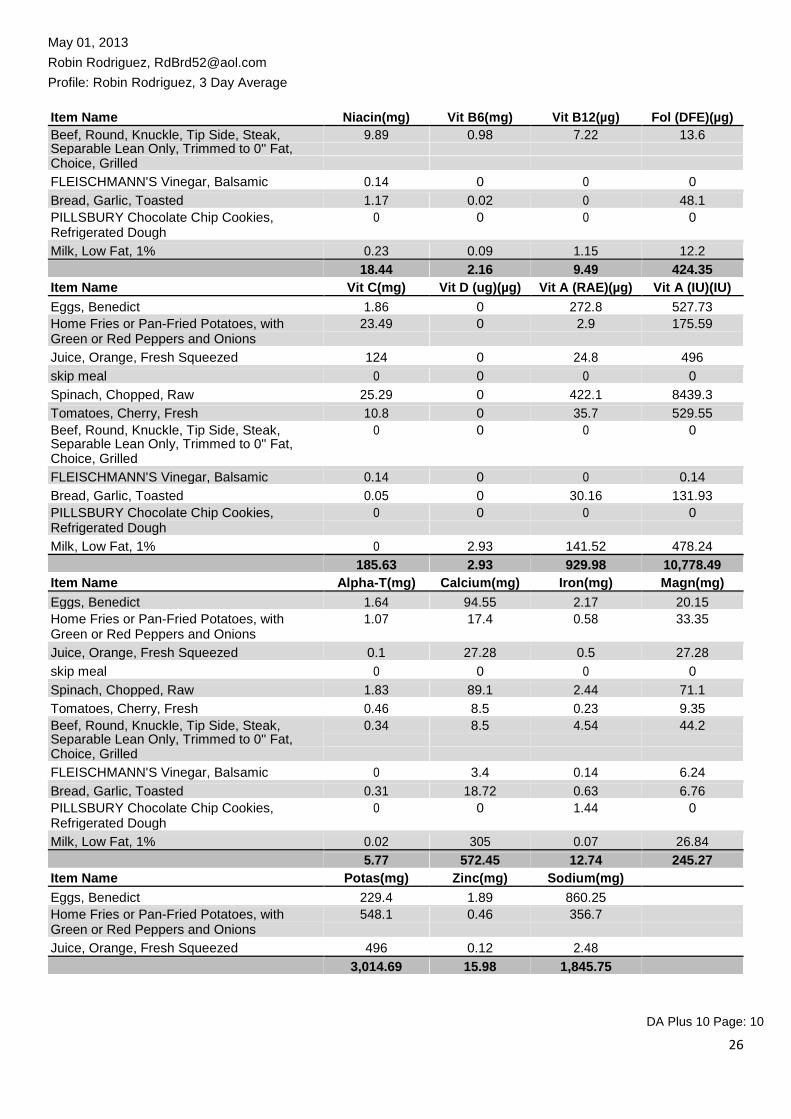
May 01, 2013 Robin Rodriguez, [email protected] Profile: Robin Rodriguez, 3 Day Average
Item Name Niacin(mg) Vit B6(mg) Vit B12(µg) Fol (DFE)(µg) Beef, Round, Knuckle, Tip Side, Steak, 9.89 0.98 7.22 13.6 Separable Lean Only, Trimmed to 0'' Fat,
Choice, Grilled
FLEISCHMANN'S Vinegar, Balsamic 0.14 0 0 0
Bread, Garlic, Toasted 1.17 0.02 0 48.1 PILLSBURY Chocolate Chip Cookies, 0 0 0 0 Refrigerated Dough
Milk, Low Fat, 1% 0.23 0.09 1.15 12.2 18.44 2.16 9.49 424.35 Item Name Vit C(mg) Vit D (ug)(µg) Vit A (RAE)(µg) Vit A (IU)(IU)
Eggs, Benedict 1.86 0 272.8 527.73 Home Fries or Pan-Fried Potatoes, with 23.49 0 2.9 175.59 Green or Red Peppers and Onions
Juice, Orange, Fresh Squeezed 124 0 24.8 496
skip meal 0 0 0 0
Spinach, Chopped, Raw 25.29 0 422.1 8439.3
Tomatoes, Cherry, Fresh 10.8 0 35.7 529.55 Beef, Round, Knuckle, Tip Side, Steak, 0 0 0 0 Separable Lean Only, Trimmed to 0'' Fat,
Choice, Grilled
FLEISCHMANN'S Vinegar, Balsamic 0.14 0 0 0.14
Bread, Garlic, Toasted 0.05 0 30.16 131.93 PILLSBURY Chocolate Chip Cookies, 0 0 0 0 Refrigerated Dough
Milk, Low Fat, 1% 0 2.93 141.52 478.24 185.63 2.93 929.98 10,778.49 Item Name Alpha-T(mg) Calcium(mg) Iron(mg) Magn(mg)
Eggs, Benedict 1.64 94.55 2.17 20.15 Home Fries or Pan-Fried Potatoes, with 1.07 17.4 0.58 33.35 Green or Red Peppers and Onions
Juice, Orange, Fresh Squeezed 0.1 27.28 0.5 27.28
skip meal 0 0 0 0
Spinach, Chopped, Raw 1.83 89.1 2.44 71.1
Tomatoes, Cherry, Fresh 0.46 8.5 0.23 9.35 Beef, Round, Knuckle, Tip Side, Steak, 0.34 8.5 4.54 44.2 Separable Lean Only, Trimmed to 0'' Fat,
Choice, Grilled
FLEISCHMANN'S Vinegar, Balsamic 0 3.4 0.14 6.24
Bread, Garlic, Toasted 0.31 18.72 0.63 6.76 PILLSBURY Chocolate Chip Cookies, 0 0 1.44 0 Refrigerated Dough
Milk, Low Fat, 1% 0.02 305 0.07 26.84 5.77 572.45 12.74 245.27 Item Name Potas(mg) Zinc(mg) Sodium(mg)
Eggs, Benedict 229.4 1.89 860.25
Home Fries or Pan-Fried Potatoes, with 548.1 0.46 356.7 Green or Red Peppers and Onions
Juice, Orange, Fresh Squeezed 496 0.12 2.48
3,014.69 15.98 1,845.75 DA Plus 10 Page: 10

27
May 01, 2013 Robin Rodriguez, [email protected] Profile: Robin Rodriguez, 3 Day Average
Item Name Potas(mg) Zinc(mg) Sodium(mg)
skip meal 0 0 0
Spinach, Chopped, Raw 502.2 0.48 71.1
Tomatoes, Cherry, Fresh 201.45 0.14 4.25 Beef, Round, Knuckle, Tip Side, Steak, 620.5 11.63 93.5 Separable Lean Only, Trimmed to 0'' Fat,
Choice, Grilled
FLEISCHMANN'S Vinegar, Balsamic 19.84 0 5.67
Bread, Garlic, Toasted 31.2 0.23 174.2 PILLSBURY Chocolate Chip Cookies, 0 0 170.24 Refrigerated Dough
Milk, Low Fat, 1% 366 1.02 107.36 3,014.69 15.98 1,845.75
DA Plus 10 Page: 11
28
May 01, 2013 Robin Rodriguez, [email protected] Profile: Robin Rodriguez, 3 Day Average
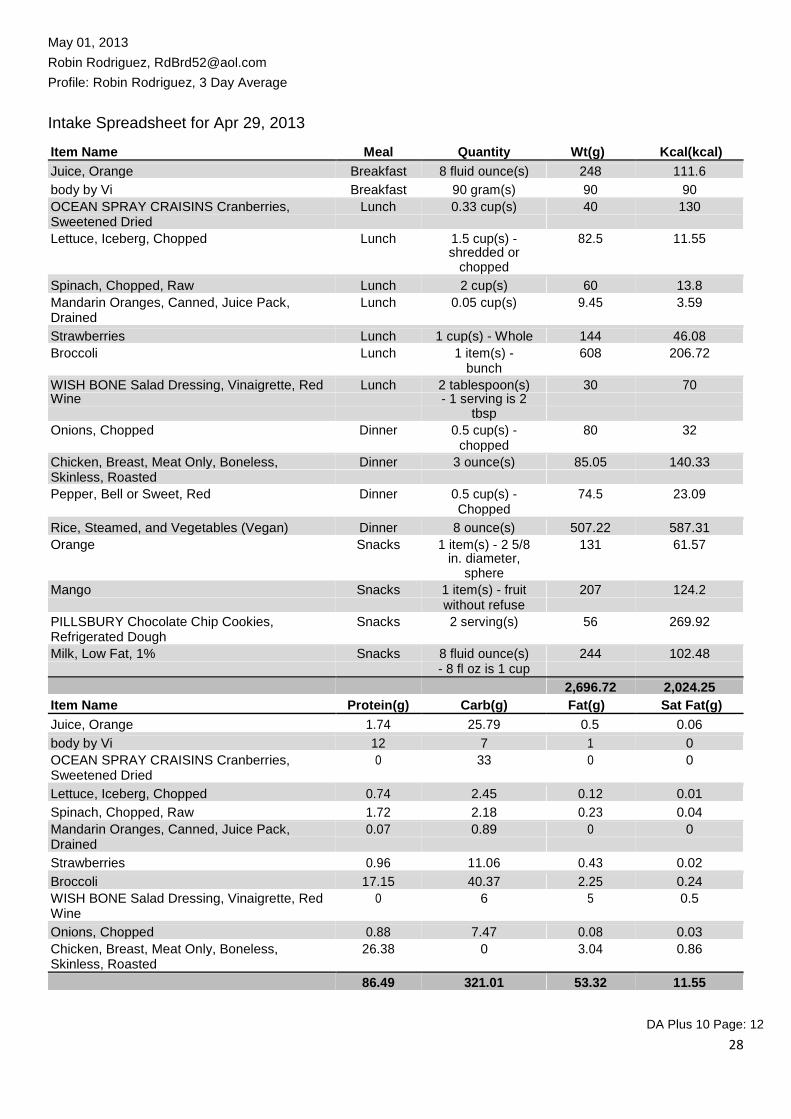
Intake Spreadsheet for Apr 29, 2013 Item Name Meal Quantity Wt(g) Kcal(kcal)
Juice, Orange Breakfast 8 fluid ounce(s) 248 111.6
body by Vi Breakfast 90 gram(s) 90 90 OCEAN SPRAY CRAISINS Cranberries, Lunch 0.33 cup(s) 40 130 Sweetened Dried
Lettuce, Iceberg, Chopped Lunch 1.5 cup(s) - 82.5 11.55 shredded or
chopped
Spinach, Chopped, Raw Lunch 2 cup(s) 60 13.8 Mandarin Oranges, Canned, Juice Pack, Lunch 0.05 cup(s) 9.45 3.59 Drained
Strawberries Lunch 1 cup(s) - Whole 144 46.08 Broccoli Lunch 1 item(s) - 608 206.72 bunch
WISH BONE Salad Dressing, Vinaigrette, Red Lunch 2 tablespoon(s) 30 70 Wine - 1 serving is 2
tbsp
Onions, Chopped Dinner 0.5 cup(s) - 80 32 chopped
Chicken, Breast, Meat Only, Boneless, Dinner 3 ounce(s) 85.05 140.33 Skinless, Roasted
Pepper, Bell or Sweet, Red Dinner 0.5 cup(s) - 74.5 23.09 Chopped
Rice, Steamed, and Vegetables (Vegan) Dinner 8 ounce(s) 507.22 587.31 Orange Snacks 1 item(s) - 2 5/8 131 61.57 in. diameter,
sphere
Mango Snacks 1 item(s) - fruit 207 124.2 without refuse
PILLSBURY Chocolate Chip Cookies, Snacks 2 serving(s) 56 269.92 Refrigerated Dough
Milk, Low Fat, 1% Snacks 8 fluid ounce(s) 244 102.48 - 8 fl oz is 1 cup
2,696.72 2,024.25 Item Name Protein(g) Carb(g) Fat(g) Sat Fat(g)
Juice, Orange 1.74 25.79 0.5 0.06
body by Vi 12 7 1 0 OCEAN SPRAY CRAISINS Cranberries, 0 33 0 0 Sweetened Dried
Lettuce, Iceberg, Chopped 0.74 2.45 0.12 0.01
Spinach, Chopped, Raw 1.72 2.18 0.23 0.04 Mandarin Oranges, Canned, Juice Pack, 0.07 0.89 0 0 Drained
Strawberries 0.96 11.06 0.43 0.02
Broccoli 17.15 40.37 2.25 0.24 WISH BONE Salad Dressing, Vinaigrette, Red 0 6 5 0.5 Wine
Onions, Chopped 0.88 7.47 0.08 0.03 Chicken, Breast, Meat Only, Boneless, 26.38 0 3.04 0.86 Skinless, Roasted
86.49 321.01 53.32 11.55 DA Plus 10 Page: 12
29
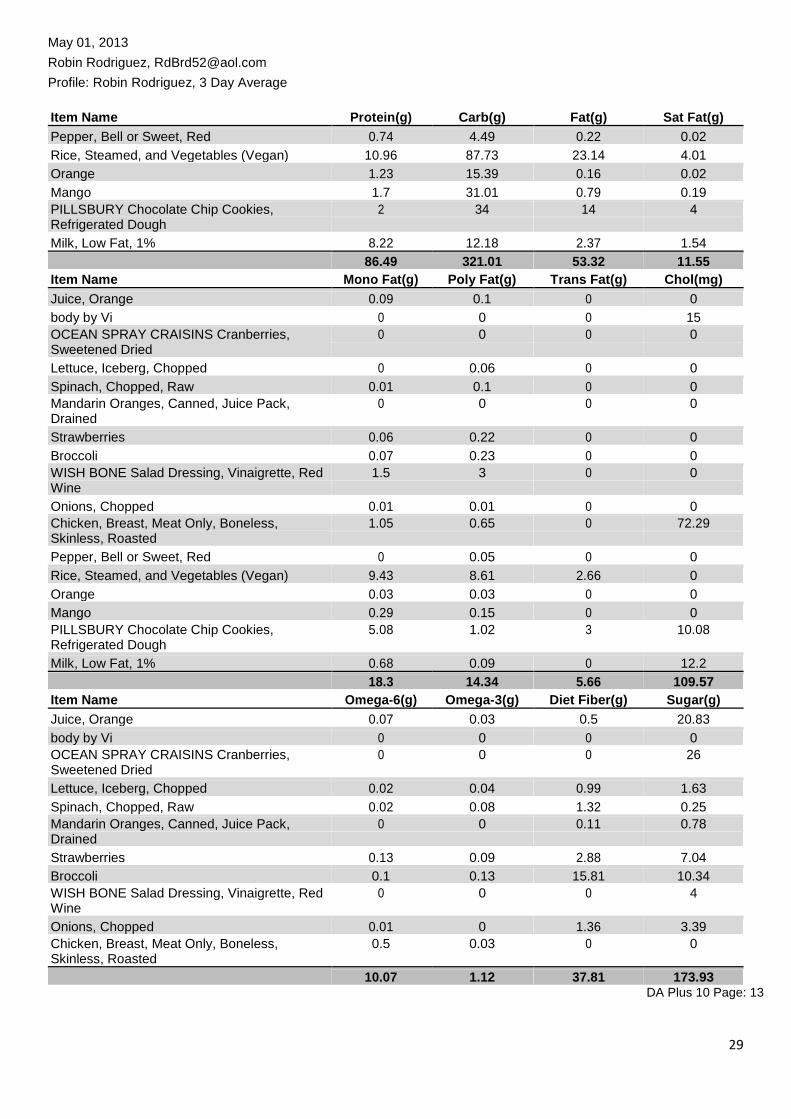
May 01, 2013 Robin Rodriguez, [email protected] Profile: Robin Rodriguez, 3 Day Average
Item Name Protein(g) Carb(g) Fat(g) Sat Fat(g)
Pepper, Bell or Sweet, Red 0.74 4.49 0.22 0.02
Rice, Steamed, and Vegetables (Vegan) 10.96 87.73 23.14 4.01
Orange 1.23 15.39 0.16 0.02
Mango 1.7 31.01 0.79 0.19 PILLSBURY Chocolate Chip Cookies, 2 34 14 4 Refrigerated Dough
Milk, Low Fat, 1% 8.22 12.18 2.37 1.54 86.49 321.01 53.32 11.55 Item Name Mono Fat(g) Poly Fat(g) Trans Fat(g) Chol(mg)
Juice, Orange 0.09 0.1 0 0
body by Vi 0 0 0 15 OCEAN SPRAY CRAISINS Cranberries, 0 0 0 0 Sweetened Dried
Lettuce, Iceberg, Chopped 0 0.06 0 0
Spinach, Chopped, Raw 0.01 0.1 0 0 Mandarin Oranges, Canned, Juice Pack, 0 0 0 0 Drained
Strawberries 0.06 0.22 0 0
Broccoli 0.07 0.23 0 0 WISH BONE Salad Dressing, Vinaigrette, Red 1.5 3 0 0 Wine
Onions, Chopped 0.01 0.01 0 0 Chicken, Breast, Meat Only, Boneless, 1.05 0.65 0 72.29 Skinless, Roasted
Pepper, Bell or Sweet, Red 0 0.05 0 0
Rice, Steamed, and Vegetables (Vegan) 9.43 8.61 2.66 0
Orange 0.03 0.03 0 0
Mango 0.29 0.15 0 0 PILLSBURY Chocolate Chip Cookies, 5.08 1.02 3 10.08 Refrigerated Dough
Milk, Low Fat, 1% 0.68 0.09 0 12.2
18.3 14.34 5.66 109.57 Item Name Omega-6(g) Omega-3(g) Diet Fiber(g) Sugar(g)
Juice, Orange 0.07 0.03 0.5 20.83
body by Vi 0 0 0 0 OCEAN SPRAY CRAISINS Cranberries, 0 0 0 26 Sweetened Dried
Lettuce, Iceberg, Chopped 0.02 0.04 0.99 1.63
Spinach, Chopped, Raw 0.02 0.08 1.32 0.25 Mandarin Oranges, Canned, Juice Pack, 0 0 0.11 0.78 Drained
Strawberries 0.13 0.09 2.88 7.04
Broccoli 0.1 0.13 15.81 10.34 WISH BONE Salad Dressing, Vinaigrette, Red 0 0 0 4 Wine
Onions, Chopped 0.01 0 1.36 3.39 Chicken, Breast, Meat Only, Boneless, 0.5 0.03 0 0 Skinless, Roasted
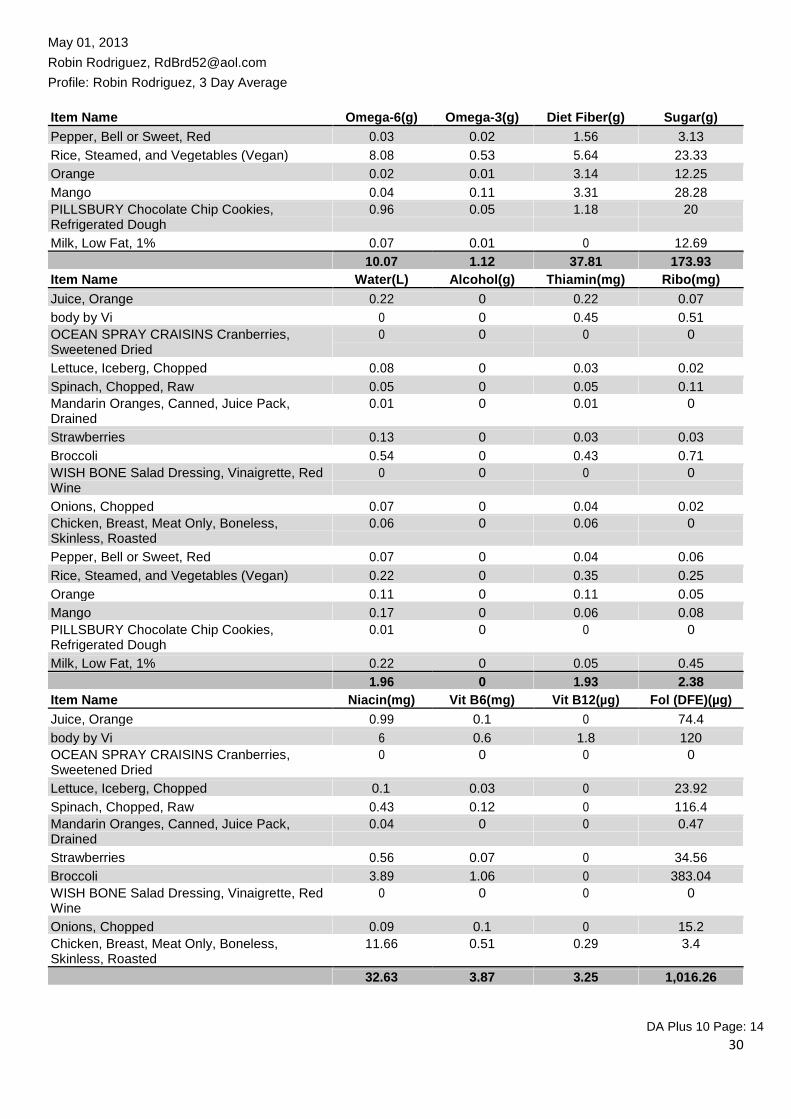
10.07 1.12 37.81 173.93 DA Plus 10 Page: 13
30
May 01, 2013 Robin Rodriguez, [email protected] Profile: Robin Rodriguez, 3 Day Average
Item Name Omega-6(g) Omega-3(g) Diet Fiber(g) Sugar(g)
Pepper, Bell or Sweet, Red 0.03 0.02 1.56 3.13
Rice, Steamed, and Vegetables (Vegan) 8.08 0.53 5.64 23.33
Orange 0.02 0.01 3.14 12.25
Mango 0.04 0.11 3.31 28.28 PILLSBURY Chocolate Chip Cookies, 0.96 0.05 1.18 20 Refrigerated Dough
Milk, Low Fat, 1% 0.07 0.01 0 12.69 10.07 1.12 37.81 173.93 Item Name Water(L) Alcohol(g) Thiamin(mg) Ribo(mg)
Juice, Orange 0.22 0 0.22 0.07
body by Vi 0 0 0.45 0.51 OCEAN SPRAY CRAISINS Cranberries, 0 0 0 0 Sweetened Dried
Lettuce, Iceberg, Chopped 0.08 0 0.03 0.02
Spinach, Chopped, Raw 0.05 0 0.05 0.11 Mandarin Oranges, Canned, Juice Pack, 0.01 0 0.01 0 Drained
Strawberries 0.13 0 0.03 0.03
Broccoli 0.54 0 0.43 0.71 WISH BONE Salad Dressing, Vinaigrette, Red 0 0 0 0 Wine
Onions, Chopped 0.07 0 0.04 0.02 Chicken, Breast, Meat Only, Boneless, 0.06 0 0.06 0 Skinless, Roasted
Pepper, Bell or Sweet, Red 0.07 0 0.04 0.06
Rice, Steamed, and Vegetables (Vegan) 0.22 0 0.35 0.25
Orange 0.11 0 0.11 0.05
Mango 0.17 0 0.06 0.08 PILLSBURY Chocolate Chip Cookies, 0.01 0 0 0 Refrigerated Dough
Milk, Low Fat, 1% 0.22 0 0.05 0.45
1.96 0 1.93 2.38 Item Name Niacin(mg) Vit B6(mg) Vit B12(µg) Fol (DFE)(µg)
Juice, Orange 0.99 0.1 0 74.4
body by Vi 6 0.6 1.8 120 OCEAN SPRAY CRAISINS Cranberries, 0 0 0 0 Sweetened Dried
Lettuce, Iceberg, Chopped 0.1 0.03 0 23.92
Spinach, Chopped, Raw 0.43 0.12 0 116.4 Mandarin Oranges, Canned, Juice Pack, 0.04 0 0 0.47 Drained
Strawberries 0.56 0.07 0 34.56
Broccoli 3.89 1.06 0 383.04 WISH BONE Salad Dressing, Vinaigrette, Red 0 0 0 0 Wine
Onions, Chopped 0.09 0.1 0 15.2 Chicken, Breast, Meat Only, Boneless, 11.66 0.51 0.29 3.4 Skinless, Roasted
32.63 3.87 3.25 1,016.26
DA Plus 10 Page: 14
31
May 01, 2013 Robin Rodriguez, [email protected] Profile: Robin Rodriguez, 3 Day Average
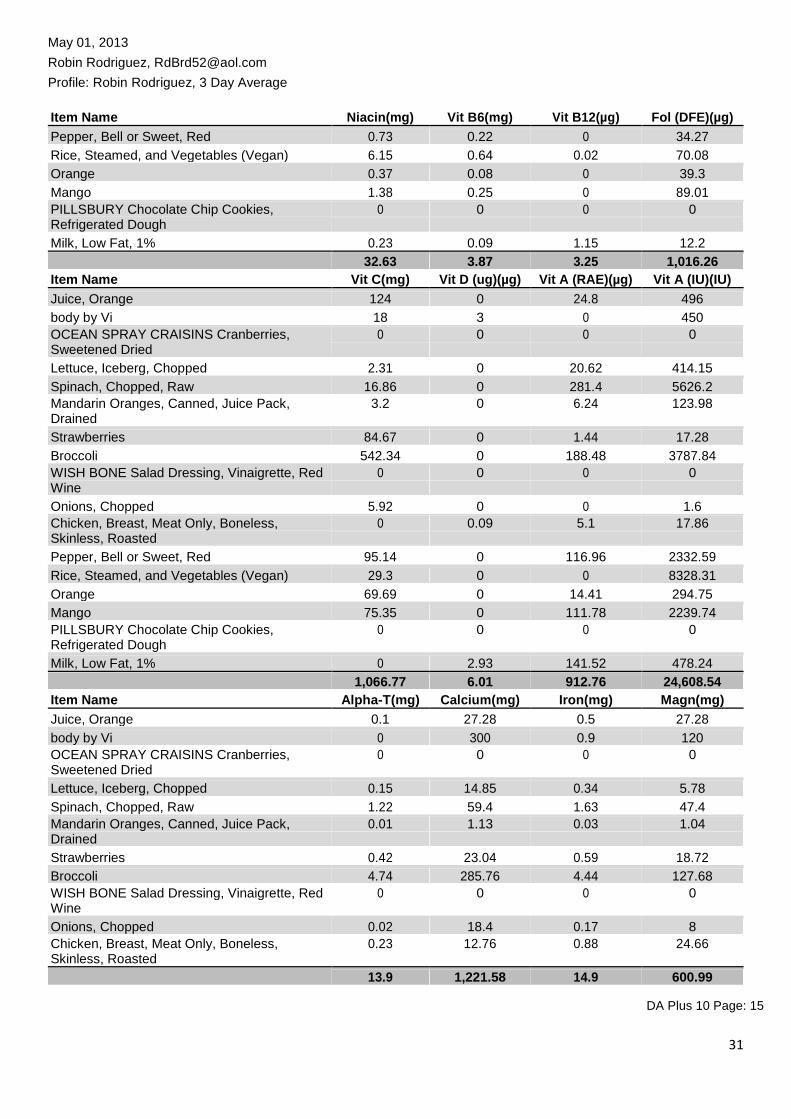
Item Name Niacin(mg) Vit B6(mg) Vit B12(µg) Fol (DFE)(µg)
Pepper, Bell or Sweet, Red 0.73 0.22 0 34.27
Rice, Steamed, and Vegetables (Vegan) 6.15 0.64 0.02 70.08
Orange 0.37 0.08 0 39.3
Mango 1.38 0.25 0 89.01 PILLSBURY Chocolate Chip Cookies, 0 0 0 0 Refrigerated Dough
Milk, Low Fat, 1% 0.23 0.09 1.15 12.2 32.63 3.87 3.25 1,016.26 Item Name Vit C(mg) Vit D (ug)(µg) Vit A (RAE)(µg) Vit A (IU)(IU)
Juice, Orange 124 0 24.8 496
body by Vi 18 3 0 450 OCEAN SPRAY CRAISINS Cranberries, 0 0 0 0 Sweetened Dried
Lettuce, Iceberg, Chopped 2.31 0 20.62 414.15
Spinach, Chopped, Raw 16.86 0 281.4 5626.2 Mandarin Oranges, Canned, Juice Pack, 3.2 0 6.24 123.98 Drained
Strawberries 84.67 0 1.44 17.28
Broccoli 542.34 0 188.48 3787.84 WISH BONE Salad Dressing, Vinaigrette, Red 0 0 0 0 Wine
Onions, Chopped 5.92 0 0 1.6 Chicken, Breast, Meat Only, Boneless, 0 0.09 5.1 17.86 Skinless, Roasted
Pepper, Bell or Sweet, Red 95.14 0 116.96 2332.59
Rice, Steamed, and Vegetables (Vegan) 29.3 0 0 8328.31
Orange 69.69 0 14.41 294.75
Mango 75.35 0 111.78 2239.74 PILLSBURY Chocolate Chip Cookies, 0 0 0 0 Refrigerated Dough
Milk, Low Fat, 1% 0 2.93 141.52 478.24
1,066.77 6.01 912.76 24,608.54 Item Name Alpha-T(mg) Calcium(mg) Iron(mg) Magn(mg)
Juice, Orange 0.1 27.28 0.5 27.28
body by Vi 0 300 0.9 120 OCEAN SPRAY CRAISINS Cranberries, 0 0 0 0 Sweetened Dried
Lettuce, Iceberg, Chopped 0.15 14.85 0.34 5.78
Spinach, Chopped, Raw 1.22 59.4 1.63 47.4 Mandarin Oranges, Canned, Juice Pack, 0.01 1.13 0.03 1.04 Drained
Strawberries 0.42 23.04 0.59 18.72
Broccoli 4.74 285.76 4.44 127.68 WISH BONE Salad Dressing, Vinaigrette, Red 0 0 0 0 Wine
Onions, Chopped 0.02 18.4 0.17 8 Chicken, Breast, Meat Only, Boneless, 0.23 12.76 0.88 24.66 Skinless, Roasted
13.9 1,221.58 14.9 600.99 DA Plus 10 Page: 15
32
May 01, 2013 Robin Rodriguez, [email protected] Profile: Robin Rodriguez, 3 Day Average
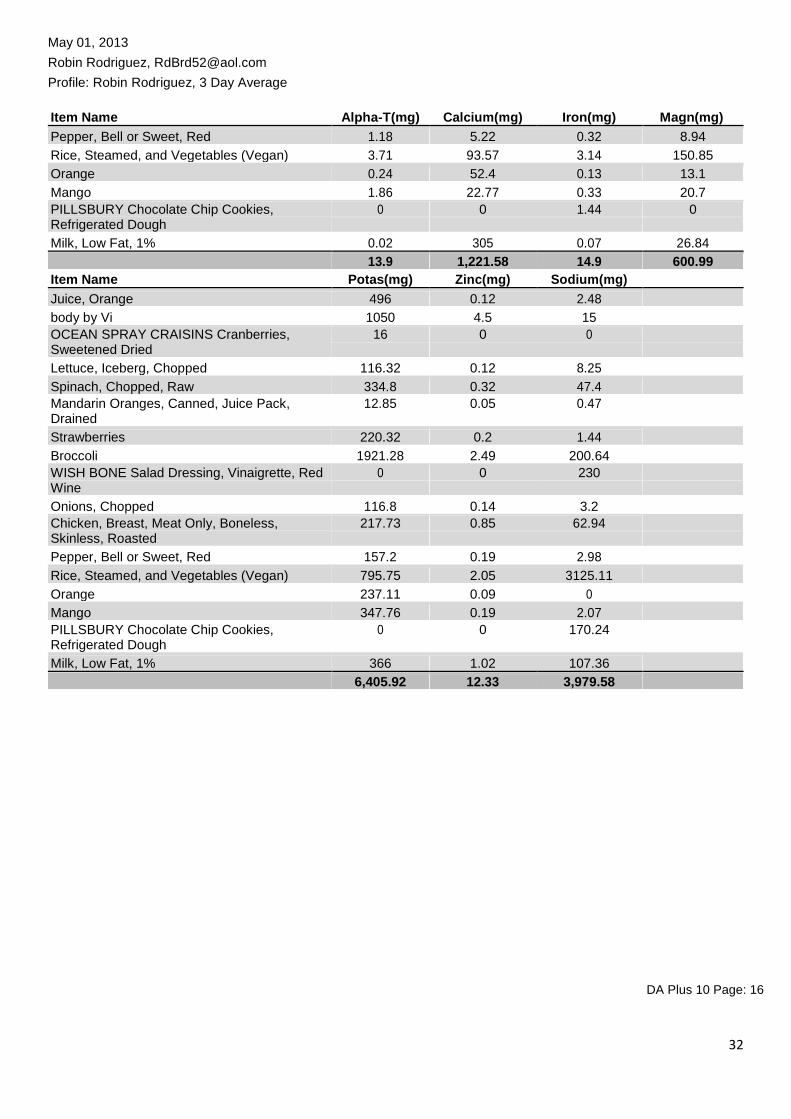
Item Name Alpha-T(mg) Calcium(mg) Iron(mg) Magn(mg)
Pepper, Bell or Sweet, Red 1.18 5.22 0.32 8.94
Rice, Steamed, and Vegetables (Vegan) 3.71 93.57 3.14 150.85
Orange 0.24 52.4 0.13 13.1
Mango 1.86 22.77 0.33 20.7 PILLSBURY Chocolate Chip Cookies, 0 0 1.44 0 Refrigerated Dough
Milk, Low Fat, 1% 0.02 305 0.07 26.84 13.9 1,221.58 14.9 600.99 Item Name Potas(mg) Zinc(mg) Sodium(mg)
Juice, Orange 496 0.12 2.48
body by Vi 1050 4.5 15 OCEAN SPRAY CRAISINS Cranberries, 16 0 0 Sweetened Dried
Lettuce, Iceberg, Chopped 116.32 0.12 8.25
Spinach, Chopped, Raw 334.8 0.32 47.4 Mandarin Oranges, Canned, Juice Pack, 12.85 0.05 0.47 Drained
Strawberries 220.32 0.2 1.44
Broccoli 1921.28 2.49 200.64 WISH BONE Salad Dressing, Vinaigrette, Red 0 0 230 Wine
Onions, Chopped 116.8 0.14 3.2 Chicken, Breast, Meat Only, Boneless, 217.73 0.85 62.94 Skinless, Roasted
Pepper, Bell or Sweet, Red 157.2 0.19 2.98
Rice, Steamed, and Vegetables (Vegan) 795.75 2.05 3125.11
Orange 237.11 0.09 0
Mango 347.76 0.19 2.07 PILLSBURY Chocolate Chip Cookies, 0 0 170.24 Refrigerated Dough
Milk, Low Fat, 1% 366 1.02 107.36
6,405.92 12.33 3,979.58 DA Plus 10 Page: 16

33
May 01, 2013 Robin Rodriguez, [email protected] Profile: Robin Rodriguez, 3 Day Average
Intake Spreadsheet for Apr 30, 2013 Item Name Meal Quantity Wt(g) Kcal(kcal)
body by Vi Breakfast 90 gram(s) 90 90
Juice, Orange Breakfast 8 fluid ounce(s) 248 111.6 WISH BONE Salad Dressing, Vinaigrette, Red Lunch 2 tablespoon(s) 30 70 Wine - 1 serving is 2
tbsp
Mandarin Oranges, Canned, Juice Pack, Lunch 0.5 cup(s) 94.5 35.91 Drained
Cucumber, Peeled Lunch 0.67 cup(s) - 79.33 9.52 Sliced
Strawberries Lunch 0.5 cup(s) - 72 23.04 Whole
Carrots Lunch 0.5 cup(s) - 61 25.01 Strips or slices
Lettuce, Iceberg, Chopped Lunch 1.5 cup(s) - 82.5 11.55 shredded or
chopped
Spinach, Chopped, Raw Lunch 2 cup(s) 60 13.8 JASON'S DELI Sandwich (Kidwich), Ham & Dinner 1 item(s) - 1 174 331 Cheese on Wheat item is 1
sandwich
FRITO LAY FUNYUNS Onion Flavored Rings Dinner 1 ounce(s) - 28.35 140 About 13 pieces
GATORADE, Fruit Flavor Dinner 2 serving(s) - 8 488 126.88 fl oz
Orange Snacks 1 item(s) - 2 5/8 131 61.57 in. diameter,
sphere
Mango Snacks 1 item(s) - fruit 207 124.2 without refuse
Almonds, Dry Roasted, without Salt Added Snacks 0.25 cup(s) 34.5 205.27
1,880.18 1,379.35 Item Name Protein(g) Carb(g) Fat(g) Sat Fat(g)
body by Vi 12 7 1 0
Juice, Orange 1.74 25.79 0.5 0.06 WISH BONE Salad Dressing, Vinaigrette, Red 0 6 5 0.5 Wine
Mandarin Oranges, Canned, Juice Pack, 0.71 8.89 0.04 0 Drained
Cucumber, Peeled 0.47 1.71 0.13 0
Strawberries 0.48 5.53 0.22 0.01
Carrots 0.57 5.84 0.15 0.02
Lettuce, Iceberg, Chopped 0.74 2.45 0.12 0.01
Spinach, Chopped, Raw 1.72 2.18 0.23 0.04 JASON'S DELI Sandwich (Kidwich), Ham & 25 38 11 5 Cheese on Wheat
FRITO LAY FUNYUNS Onion Flavored Rings 2 18 7 1
GATORADE, Fruit Flavor 0 31.38 0 0
Orange 1.23 15.39 0.16 0.02
55.62 206.49 44.27 8.25 DA Plus 10 Page: 17

34
May 01, 2013 Robin Rodriguez, [email protected] Profile: Robin Rodriguez, 3 Day Average
Item Name Protein(g) Carb(g) Fat(g) Sat Fat(g)
Mango 1.7 31.01 0.79 0.19
Almonds, Dry Roasted, without Salt Added 7.27 7.31 17.96 1.39 55.62 206.49 44.27 8.25 Item Name Mono Fat(g) Poly Fat(g) Trans Fat(g) Chol(mg)
body by Vi 0 0 0 15
Juice, Orange 0.09 0.1 0 0 WISH BONE Salad Dressing, Vinaigrette, Red 1.5 3 0 0 Wine
Mandarin Oranges, Canned, Juice Pack, 0.01 0.01 0 0 Drained
Cucumber, Peeled 0 0 0 0
Strawberries 0.03 0.11 0 0
Carrots 0.01 0.07 0 0
Lettuce, Iceberg, Chopped 0 0.06 0 0
Spinach, Chopped, Raw 0.01 0.1 0 0 JASON'S DELI Sandwich (Kidwich), Ham & 0 0 0 48 Cheese on Wheat
FRITO LAY FUNYUNS Onion Flavored Rings 0 0 0 0
GATORADE, Fruit Flavor 0 0 0 0
Orange 0.03 0.03 0 0
Mango 0.29 0.15 0 0
Almonds, Dry Roasted, without Salt Added 11.17 4.48 0 0
13.14 8.11 0 63 Item Name Omega-6(g) Omega-3(g) Diet Fiber(g) Sugar(g)
body by Vi 0 0 0 0
Juice, Orange 0.07 0.03 0.5 20.83 WISH BONE Salad Dressing, Vinaigrette, Red 0 0 0 4 Wine
Mandarin Oranges, Canned, Juice Pack, 0 0 1.13 7.8 Drained
Cucumber, Peeled 0 0 0.56 1.09
Strawberries 0.06 0.05 1.44 3.52
Carrots 0.07 0 1.71 2.89
Lettuce, Iceberg, Chopped 0.02 0.04 0.99 1.63
Spinach, Chopped, Raw 0.02 0.08 1.32 0.25 JASON'S DELI Sandwich (Kidwich), Ham & 0 0 6 6 Cheese on Wheat
FRITO LAY FUNYUNS Onion Flavored Rings 0 0 0.5 0.5
GATORADE, Fruit Flavor 0 0 0 25.57
Orange 0.02 0.01 3.14 12.25
Mango 0.04 0.11 3.31 28.28
Almonds, Dry Roasted, without Salt Added 4.48 0 3.76 1.7
4.79 0.32 24.36 116.31 Item Name Water(L) Alcohol(g) Thiamin(mg) Ribo(mg)
body by Vi 0 0 0.45 0.51
Juice, Orange 0.22 0 0.22 0.07
1.38 0 1.21 1.37 DA Plus 10 Page: 18

35
May 01, 2013 Robin Rodriguez, [email protected] Profile: Robin Rodriguez, 3 Day Average
Item Name Water(L) Alcohol(g) Thiamin(mg) Ribo(mg) WISH BONE Salad Dressing, Vinaigrette, Red 0 0 0 0 Wine
Mandarin Oranges, Canned, Juice Pack, 0.08 0 0.08 0.03 Drained
Cucumber, Peeled 0.08 0 0 0
Strawberries 0.07 0 0.02 0.02
Carrots 0.05 0 0.04 0.04
Lettuce, Iceberg, Chopped 0.08 0 0.03 0.02
Spinach, Chopped, Raw 0.05 0 0.05 0.11 JASON'S DELI Sandwich (Kidwich), Ham & 0 0 0 0 Cheese on Wheat
FRITO LAY FUNYUNS Onion Flavored Rings 0 0 0.06 0.1
GATORADE, Fruit Flavor 0.46 0 0.05 0
Orange 0.11 0 0.11 0.05
Mango 0.17 0 0.06 0.08
Almonds, Dry Roasted, without Salt Added 0 0 0.03 0.33
1.38 0 1.21 1.37 Item Name Niacin(mg) Vit B6(mg) Vit B12(µg) Fol (DFE)(µg)
body by Vi 6 0.6 1.8 120
Juice, Orange 0.99 0.1 0 74.4 WISH BONE Salad Dressing, Vinaigrette, Red 0 0 0 0 Wine
Mandarin Oranges, Canned, Juice Pack, 0.42 0.04 0 4.72 Drained
Cucumber, Peeled 0 0 0 11.11
Strawberries 0.28 0.03 0 17.28
Carrots 0.6 0.08 0 11.59
Lettuce, Iceberg, Chopped 0.1 0.03 0 23.92
Spinach, Chopped, Raw 0.43 0.12 0 116.4 JASON'S DELI Sandwich (Kidwich), Ham & 0 0 0 0 Cheese on Wheat
FRITO LAY FUNYUNS Onion Flavored Rings 1.55 0.04 0 0
GATORADE, Fruit Flavor 1.07 0.11 0 0
Orange 0.37 0.08 0 39.3
Mango 1.38 0.25 0 89.01
Almonds, Dry Roasted, without Salt Added 1.23 0.04 0 18.28
14.43 1.53 1.8 526.02 Item Name Vit C(mg) Vit D (ug)(µg) Vit A (RAE)(µg) Vit A (IU)(IU)
body by Vi 18 3 0 450
Juice, Orange 124 0 24.8 496 WISH BONE Salad Dressing, Vinaigrette, Red 0 0 0 0 Wine
Mandarin Oranges, Canned, Juice Pack, 32.04 0 62.37 1239.84 Drained
Cucumber, Peeled 2.54 0 3.17 57.12
Strawberries 42.34 0 0.72 8.64
Carrots 3.6 0 509.35 10190.65
388.67 3 1,028.63 21,017.44 DA Plus 10 Page: 19
36
May 01, 2013 Robin Rodriguez, [email protected] Profile: Robin Rodriguez, 3 Day Average
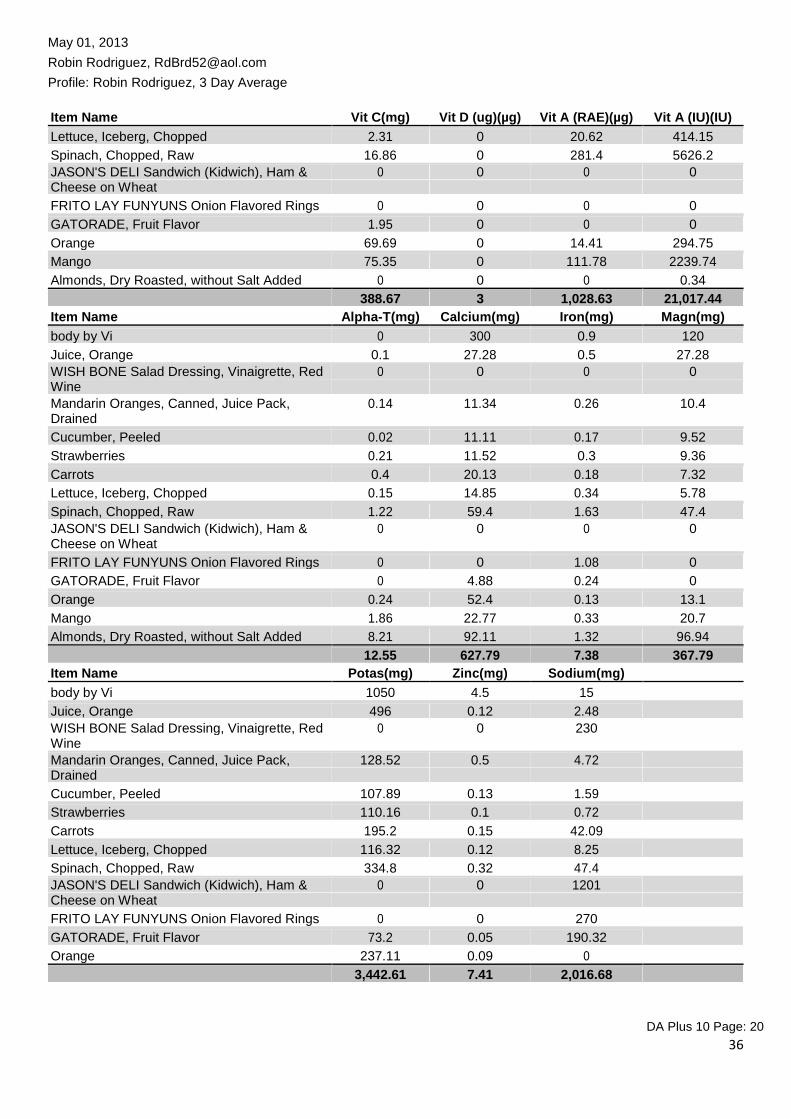
Item Name Vit C(mg) Vit D (ug)(µg) Vit A (RAE)(µg) Vit A (IU)(IU)
Lettuce, Iceberg, Chopped 2.31 0 20.62 414.15
Spinach, Chopped, Raw 16.86 0 281.4 5626.2 JASON'S DELI Sandwich (Kidwich), Ham & 0 0 0 0 Cheese on Wheat
FRITO LAY FUNYUNS Onion Flavored Rings 0 0 0 0
GATORADE, Fruit Flavor 1.95 0 0 0
Orange 69.69 0 14.41 294.75
Mango 75.35 0 111.78 2239.74
Almonds, Dry Roasted, without Salt Added 0 0 0 0.34
388.67 3 1,028.63 21,017.44 Item Name Alpha-T(mg) Calcium(mg) Iron(mg) Magn(mg)
body by Vi 0 300 0.9 120
Juice, Orange 0.1 27.28 0.5 27.28 WISH BONE Salad Dressing, Vinaigrette, Red 0 0 0 0 Wine
Mandarin Oranges, Canned, Juice Pack, 0.14 11.34 0.26 10.4 Drained
Cucumber, Peeled 0.02 11.11 0.17 9.52
Strawberries 0.21 11.52 0.3 9.36
Carrots 0.4 20.13 0.18 7.32
Lettuce, Iceberg, Chopped 0.15 14.85 0.34 5.78
Spinach, Chopped, Raw 1.22 59.4 1.63 47.4 JASON'S DELI Sandwich (Kidwich), Ham & 0 0 0 0 Cheese on Wheat
FRITO LAY FUNYUNS Onion Flavored Rings 0 0 1.08 0
GATORADE, Fruit Flavor 0 4.88 0.24 0
Orange 0.24 52.4 0.13 13.1
Mango 1.86 22.77 0.33 20.7
Almonds, Dry Roasted, without Salt Added 8.21 92.11 1.32 96.94
12.55 627.79 7.38 367.79 Item Name Potas(mg) Zinc(mg) Sodium(mg)
body by Vi 1050 4.5 15
Juice, Orange 496 0.12 2.48 WISH BONE Salad Dressing, Vinaigrette, Red 0 0 230 Wine
Mandarin Oranges, Canned, Juice Pack, 128.52 0.5 4.72 Drained
Cucumber, Peeled 107.89 0.13 1.59
Strawberries 110.16 0.1 0.72
Carrots 195.2 0.15 42.09
Lettuce, Iceberg, Chopped 116.32 0.12 8.25
Spinach, Chopped, Raw 334.8 0.32 47.4 JASON'S DELI Sandwich (Kidwich), Ham & 0 0 1201 Cheese on Wheat
FRITO LAY FUNYUNS Onion Flavored Rings 0 0 270
GATORADE, Fruit Flavor 73.2 0.05 190.32
Orange 237.11 0.09 0
3,442.61 7.41 2,016.68
DA Plus 10 Page: 20

37
May 01, 2013 Robin Rodriguez, [email protected] Profile: Robin Rodriguez, 3 Day Average
Item Name Potas(mg) Zinc(mg) Sodium(mg)
Mango 347.76 0.19 2.07
Almonds, Dry Roasted, without Salt Added 245.64 1.14 1.03 3,442.61 7.41 2,016.68
DA Plus 10 Page: 21

38
May 01, 2013 Robin Rodriguez, [email protected] Profile: Robin Rodriguez, 3 Day Average
Energy Balance for Apr 28, 2013, Apr 29, 2013, Apr 30, 2013
Date kCal Consumed kCal Burned Net kCal
Apr 28, 2013 1588 2275 -687
Apr 29, 2013 2025 2275 -250
Apr 30, 2013 1381 2275 -894
Total: 4994 6825 -1831
Daily Caloric Summary kCal
Recommended: 2431
Average Intake: 1665
Average Expenditure: 2275
Average Net Gain/Loss: -610
DA Plus 10 Page: 22

39
Appendix 2
May 09, 2013 Robin Rodriguez, [email protected] Profile: Robin Rodriguez, 3 Day Average Profile
Active Profile: Robin Rodriguez
Height: 5 ft. 4 inches
Weight: 190.0 lbs.
Age: 30 years
BMI: 32.6
Gender: Female
Pregnancy: Not Pregnant
Activity Level: Low Active
Smoker: No
Strict Vegetarian/Vegan: No
DRI Goals
Nutrient DRI
Energy
Kilocalories 2431 kcal
Protein 68.95 g Daily requirement based on grams per
kilogram of body weight
Carbohydrate 270.0 - 390.0 g
Fat, Total 53.0 - 93.0 g No recommendation
Fat
Saturated Fat < 24 g Less than 10% of calories
Monounsaturated Fat * No recommendation
Polyunsaturated Fat * No recommendation
Trans Fatty Acid * No recommendation
Cholesterol < 300 mg Less than 300mg recommended
Essential Fatty Acids
Omega-6 Linoleic 12 g
Omega-3 Linolenic 1.1 g
Carbohydrates
40
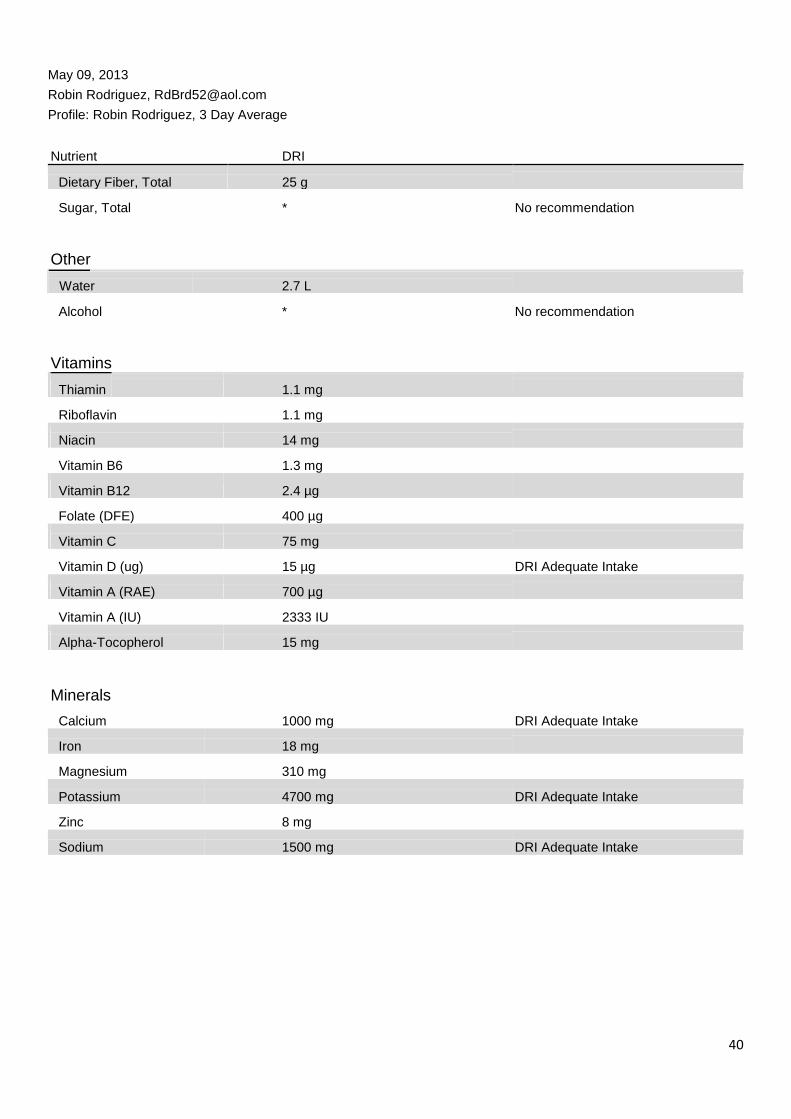
May 09, 2013 Robin Rodriguez, [email protected] Profile: Robin Rodriguez, 3 Day Average
Nutrient DRI
Dietary Fiber, Total 25 g
Sugar, Total * No recommendation
Other
Water 2.7 L
Alcohol * No recommendation
Vitamins
Thiamin 1.1 mg
Riboflavin 1.1 mg
Niacin 14 mg
Vitamin B6 1.3 mg
Vitamin B12 2.4 µg
Folate (DFE) 400 µg
Vitamin C 75 mg
Vitamin D (ug) 15 µg DRI Adequate Intake
Vitamin A (RAE) 700 µg
Vitamin A (IU) 2333 IU
Alpha-Tocopherol 15 mg
Minerals
Calcium 1000 mg DRI Adequate Intake
Iron 18 mg
Magnesium 310 mg
Potassium 4700 mg DRI Adequate Intake
Zinc 8 mg
Sodium 1500 mg DRI Adequate Intake
41
DA Plus 10 Page: 2
May 09, 2013 Robin Rodriguez, [email protected] Profile: Robin Rodriguez, 3 Day Average
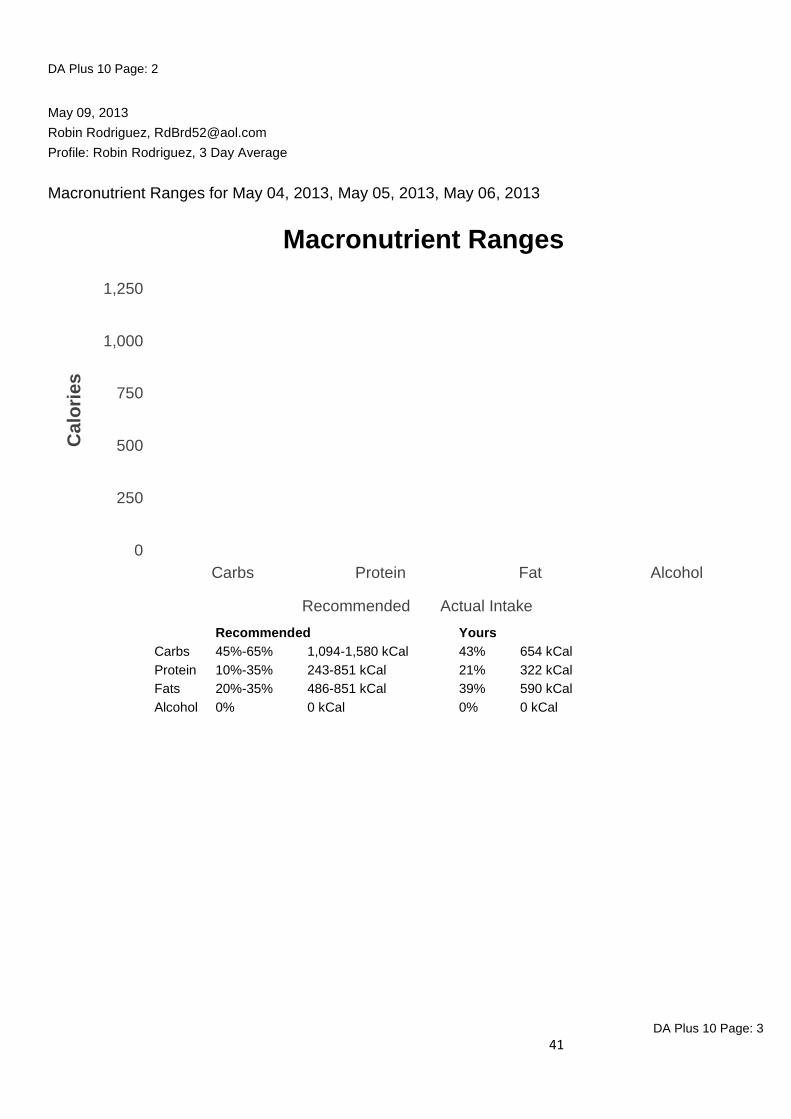
Macronutrient Ranges for May 04, 2013, May 05, 2013, May 06, 2013
Macronutrient Ranges
Ca
lori
es
1,250
1,000
750
500
250
0
Carbs Protein Fat Alcohol
Recommended Actual Intake
Recommended Yours
Carbs 45%-65% 1,094-1,580 kCal 43% 654 kCal
Protein 10%-35% 243-851 kCal 21% 322 kCal
Fats 20%-35% 486-851 kCal 39% 590 kCal
Alcohol 0% 0 kCal 0% 0 kCal DA Plus 10 Page: 3
42
May 09, 2013 Robin Rodriguez, [email protected] Profile: Robin Rodriguez, 3 Day Average
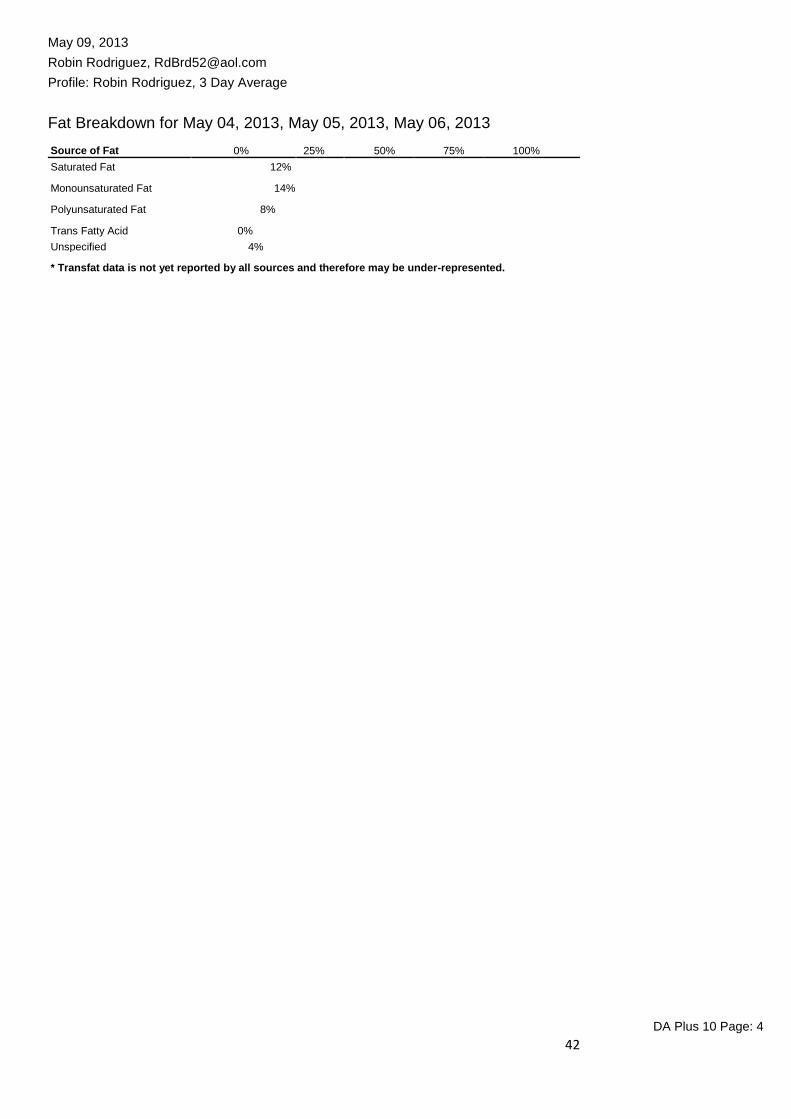
Fat Breakdown for May 04, 2013, May 05, 2013, May 06, 2013 Source of Fat 0% 25% 50% 75% 100% Saturated Fat 12%
Monounsaturated Fat 14%
Polyunsaturated Fat 8%
Trans Fatty Acid 0% Unspecified 4% * Transfat data is not yet reported by all sources and therefore may be under-represented.
DA Plus 10 Page: 4
43
May 09, 2013 Robin Rodriguez, [email protected] Profile: Robin Rodriguez, 3 Day Average
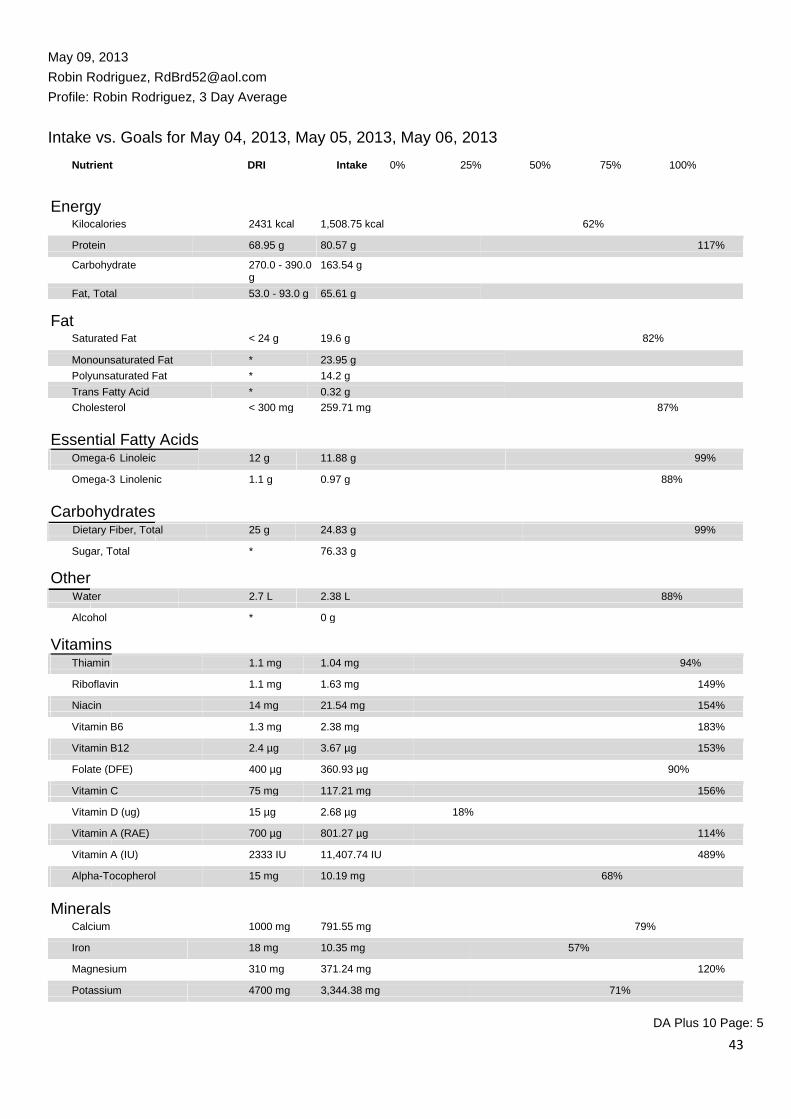
Intake vs. Goals for May 04, 2013, May 05, 2013, May 06, 2013
Nutrient DRI Intake 0% 25% 50% 75% 100%
Energy Kilocalories 2431 kcal 1,508.75 kcal 62%
Protein 68.95 g 80.57 g 117%
Carbohydrate 270.0 - 390.0 163.54 g g
Fat, Total 53.0 - 93.0 g 65.61 g Fat
Saturated Fat < 24 g 19.6 g 82%
Monounsaturated Fat * 23.95 g
Polyunsaturated Fat * 14.2 g
Trans Fatty Acid * 0.32 g
Cholesterol < 300 mg 259.71 mg 87% Essential Fatty Acids Omega-6 Linoleic 12 g 11.88 g 99%
Omega-3 Linolenic 1.1 g 0.97 g 88% Carbohydrates
Dietary Fiber, Total 25 g 24.83 g 99%
Sugar, Total * 76.33 g Other
Water 2.7 L 2.38 L 88%
Alcohol * 0 g Vitamins Thiamin 1.1 mg 1.04 mg 94%
Riboflavin 1.1 mg 1.63 mg 149%
Niacin 14 mg 21.54 mg 154%
Vitamin B6 1.3 mg 2.38 mg 183%
Vitamin B12 2.4 µg 3.67 µg 153%
Folate (DFE) 400 µg 360.93 µg 90%
Vitamin C 75 mg 117.21 mg 156%
Vitamin D (ug) 15 µg 2.68 µg 18%
Vitamin A (RAE) 700 µg 801.27 µg 114%
Vitamin A (IU) 2333 IU 11,407.74 IU 489%
Alpha-Tocopherol 15 mg 10.19 mg 68%
Minerals
Calcium 1000 mg 791.55 mg 79%
Iron 18 mg 10.35 mg 57%
Magnesium 310 mg 371.24 mg 120%
Potassium 4700 mg 3,344.38 mg 71%
DA Plus 10 Page: 5

44
May 09, 2013 Robin Rodriguez, [email protected] Profile: Robin Rodriguez, 3 Day Average
Nutrient DRI Intake 0% 25% 50% 75% 100%
Zinc 8 mg 8.7 mg 109%
Sodium 1500 mg 1,414.71 mg 94%
DA Plus 10 Page: 6

45
May 09, 2013 Robin Rodriguez, [email protected] Profile: Robin Rodriguez, 3 Day Average
MyPlate Analysis for May 04, 2013, May 05, 2013, May 06, 2013
Goal* Actual % Goal
Grains 9.0 oz. eq. tips 2.1 oz. eq. 22.9%
Vegetables 3.5 cup eq. tips 3.1 cup eq. 87.5%
Fruits 2.0 cup eq. tips 2.9 cup eq. 145.2%
Dairy 3.0 cup eq. tips 1.2 cup eq. 38.7%
Protein Foods 6.5 oz. eq. tips 8.6 oz. eq. 131.6%
Empty Calories 410.0 294.3 71.8%
Your results are based on a 2431 calorie pattern.
Make Half Your Grains Whole! Aim for at least 4.5 oz. eq.
whole grains.
Vary Your Veggies! Aim for this much every week:
Dark Green Vegetables = 2.0 cups weekly Orange Vegetables = 1.5 cups weekly Dry Beans &Peas = 2.5 cups weekly Starchy Vegetables = 2.5 cups weekly Other Vegetables = 5.5 cups weekly
Oils: Aim for 8.0 teaspoons of oil a day.
*MyPlate contains recommendations only for calorie levels up to 3,200 per day. If Diet Analysis Plus recommends more than 3,200 calories per day for you, talk to your instructor for guidance on how to use MyPlate.
**CAUTION! Recipes are not included on the MyPlate Report, as plate values for these cannot be calculated.
DA Plus 10 Page: 7

46
May 09, 2013 Robin Rodriguez, [email protected] Profile: Robin Rodriguez, 3 Day Average
MyPlate Analysis for May 04, 2013, May 05, 2013, May 06, 2013
Goal* Actual % Goal
Grains 9.0 oz. eq. tips 2.1 oz. eq. 22.9%
Vegetables 3.5 cup eq. tips 3.1 cup eq. 87.5%
Fruits 2.0 cup eq. tips 2.9 cup eq. 145.2%
Dairy 3.0 cup eq. tips 1.2 cup eq. 38.7%
Protein Foods 6.5 oz. eq. tips 8.6 oz. eq. 131.6%
Empty Calories 410.0 294.3 71.8%
Your results are based on a 2431 calorie pattern.
Make Half Your Grains Whole! Aim for at least 4.5 oz. eq.
whole grains.
Vary Your Veggies! Aim for this much every week:
Dark Green Vegetables = 2.0 cups weekly Orange Vegetables = 1.5 cups weekly Dry Beans &Peas = 2.5 cups weekly Starchy Vegetables = 2.5 cups weekly Other Vegetables = 5.5 cups weekly
Oils: Aim for 8.0 teaspoons of oil a day.
*MyPlate contains recommendations only for calorie levels up to 3,200 per day. If Diet Analysis Plus recommends more than 3,200 calories per day for you, talk to your instructor for guidance on how to use MyPlate.
**CAUTION! Recipes are not included on the MyPlate Report, as plate values for these cannot be calculated.
DA Plus 10 Page: 7
47
May 09, 2013 Robin Rodriguez, [email protected] Profile: Robin Rodriguez, 3 Day Average
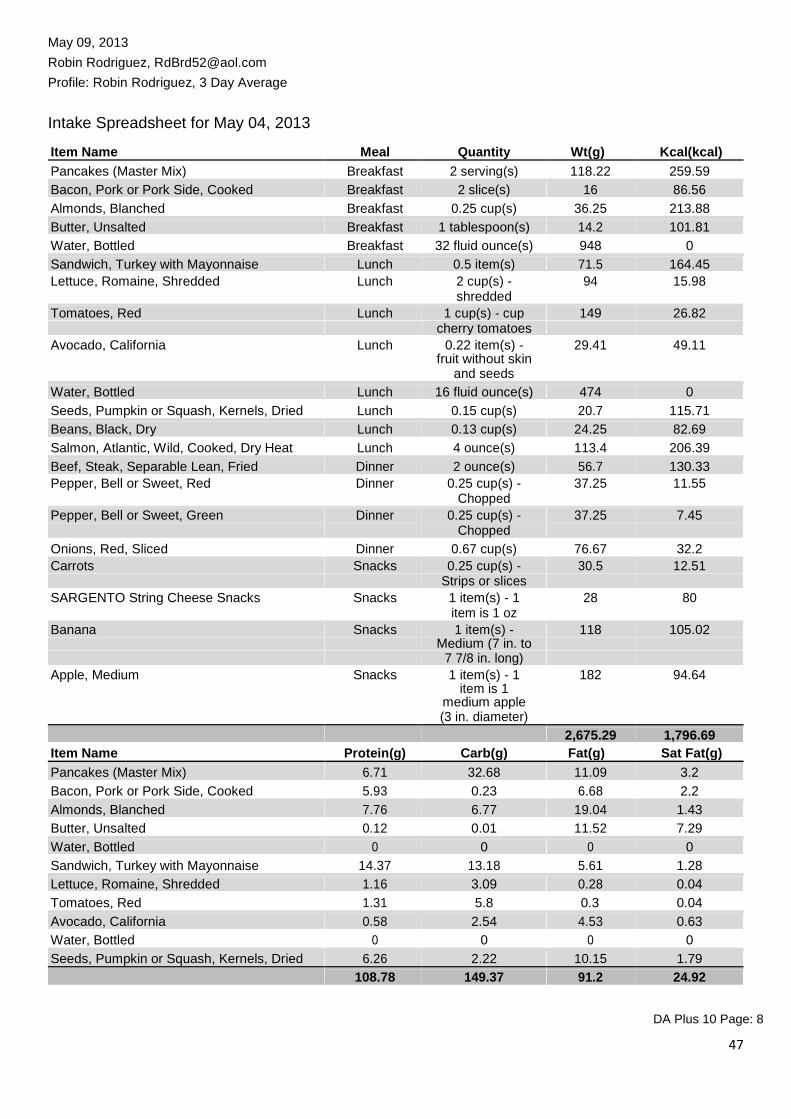
Intake Spreadsheet for May 04, 2013 Item Name Meal Quantity Wt(g) Kcal(kcal)
Pancakes (Master Mix) Breakfast 2 serving(s) 118.22 259.59
Bacon, Pork or Pork Side, Cooked Breakfast 2 slice(s) 16 86.56
Almonds, Blanched Breakfast 0.25 cup(s) 36.25 213.88
Butter, Unsalted Breakfast 1 tablespoon(s) 14.2 101.81
Water, Bottled Breakfast 32 fluid ounce(s) 948 0
Sandwich, Turkey with Mayonnaise Lunch 0.5 item(s) 71.5 164.45 Lettuce, Romaine, Shredded Lunch 2 cup(s) - 94 15.98 shredded
Tomatoes, Red Lunch 1 cup(s) - cup 149 26.82 cherry tomatoes
Avocado, California Lunch 0.22 item(s) - 29.41 49.11 fruit without skin
and seeds
Water, Bottled Lunch 16 fluid ounce(s) 474 0
Seeds, Pumpkin or Squash, Kernels, Dried Lunch 0.15 cup(s) 20.7 115.71
Beans, Black, Dry Lunch 0.13 cup(s) 24.25 82.69
Salmon, Atlantic, Wild, Cooked, Dry Heat Lunch 4 ounce(s) 113.4 206.39
Beef, Steak, Separable Lean, Fried Dinner 2 ounce(s) 56.7 130.33 Pepper, Bell or Sweet, Red Dinner 0.25 cup(s) - 37.25 11.55 Chopped
Pepper, Bell or Sweet, Green Dinner 0.25 cup(s) - 37.25 7.45 Chopped
Onions, Red, Sliced Dinner 0.67 cup(s) 76.67 32.2 Carrots Snacks 0.25 cup(s) - 30.5 12.51 Strips or slices
SARGENTO String Cheese Snacks Snacks 1 item(s) - 1 28 80 item is 1 oz
Banana Snacks 1 item(s) - 118 105.02 Medium (7 in. to
7 7/8 in. long)
Apple, Medium Snacks 1 item(s) - 1 182 94.64 item is 1
medium apple
(3 in. diameter)
2,675.29 1,796.69 Item Name Protein(g) Carb(g) Fat(g) Sat Fat(g)
Pancakes (Master Mix) 6.71 32.68 11.09 3.2
Bacon, Pork or Pork Side, Cooked 5.93 0.23 6.68 2.2
Almonds, Blanched 7.76 6.77 19.04 1.43
Butter, Unsalted 0.12 0.01 11.52 7.29
Water, Bottled 0 0 0 0
Sandwich, Turkey with Mayonnaise 14.37 13.18 5.61 1.28
Lettuce, Romaine, Shredded 1.16 3.09 0.28 0.04
Tomatoes, Red 1.31 5.8 0.3 0.04
Avocado, California 0.58 2.54 4.53 0.63
Water, Bottled 0 0 0 0
Seeds, Pumpkin or Squash, Kernels, Dried 6.26 2.22 10.15 1.79
108.78 149.37 91.2 24.92 DA Plus 10 Page: 8

48
May 09, 2013 Robin Rodriguez, [email protected] Profile: Robin Rodriguez, 3 Day Average
Item Name Protein(g) Carb(g) Fat(g) Sat Fat(g)
Beans, Black, Dry 5.24 15.12 0.34 0.09
Salmon, Atlantic, Wild, Cooked, Dry Heat 28.85 0 9.22 1.43
Beef, Steak, Separable Lean, Fried 19.07 0 5.41 1.76
Pepper, Bell or Sweet, Red 0.37 2.25 0.11 0.01
Pepper, Bell or Sweet, Green 0.32 1.73 0.06 0.02
Onions, Red, Sliced 0.71 7.75 0.06 0.02
Carrots 0.28 2.92 0.07 0.01
SARGENTO String Cheese Snacks 8 1 6 3.5
Banana 1.29 26.95 0.39 0.13
Apple, Medium 0.47 25.13 0.31 0.05
108.78 149.37 91.2 24.92 Item Name Mono Fat(g) Poly Fat(g) Trans Fat(g) Chol(mg)
Pancakes (Master Mix) 3.35 3.76 0 68.81
Bacon, Pork or Pork Side, Cooked 2.96 0.73 0 17.6
Almonds, Blanched 12.11 4.48 0.01 0
Butter, Unsalted 2.98 0.43 0.47 30.53
Water, Bottled 0 0 0 0
Sandwich, Turkey with Mayonnaise 1.28 2.41 0 33.6
Lettuce, Romaine, Shredded 0.01 0.15 0 0
Tomatoes, Red 0.05 0.12 0 0
Avocado, California 2.88 0.53 0 0
Water, Bottled 0 0 0 0
Seeds, Pumpkin or Squash, Kernels, Dried 3.36 4.34 0.01 0
Beans, Black, Dry 0.03 0.15 0 0
Salmon, Atlantic, Wild, Cooked, Dry Heat 3.06 3.69 0 80.51
Beef, Steak, Separable Lean, Fried 1.99 0.89 0 54.97
Pepper, Bell or Sweet, Red 0 0.03 0 0
Pepper, Bell or Sweet, Green 0 0.02 0 0
Onions, Red, Sliced 0.02 0.05 0 0
Carrots 0 0.04 0 0
SARGENTO String Cheese Snacks 0 0 0 15
Banana 0.04 0.09 0 0
Apple, Medium 0.01 0.09 0 0
34.14 22 0.49 301.03 Item Name Omega-6(g) Omega-3(g) Diet Fiber(g) Sugar(g)
Pancakes (Master Mix) 3.43 0.3 0.98 4.13
Bacon, Pork or Pork Side, Cooked 0.64 0.03 0 0
Almonds, Blanched 4.48 0 3.59 1.68
Butter, Unsalted 0.39 0.04 0 0.01
Water, Bottled 0 0 0 0
Sandwich, Turkey with Mayonnaise 2.05 0.22 0.64 1.13
Lettuce, Romaine, Shredded 0.04 0.11 1.97 1.12
Tomatoes, Red 0.12 0 1.79 3.92
Avocado, California 0.49 0.04 2 0.09
Water, Bottled 0 0 0 0
17.18 1.42 26.76 53.4 DA Plus 10 Page: 9
49
May 09, 2013 Robin Rodriguez, [email protected] Profile: Robin Rodriguez, 3 Day Average
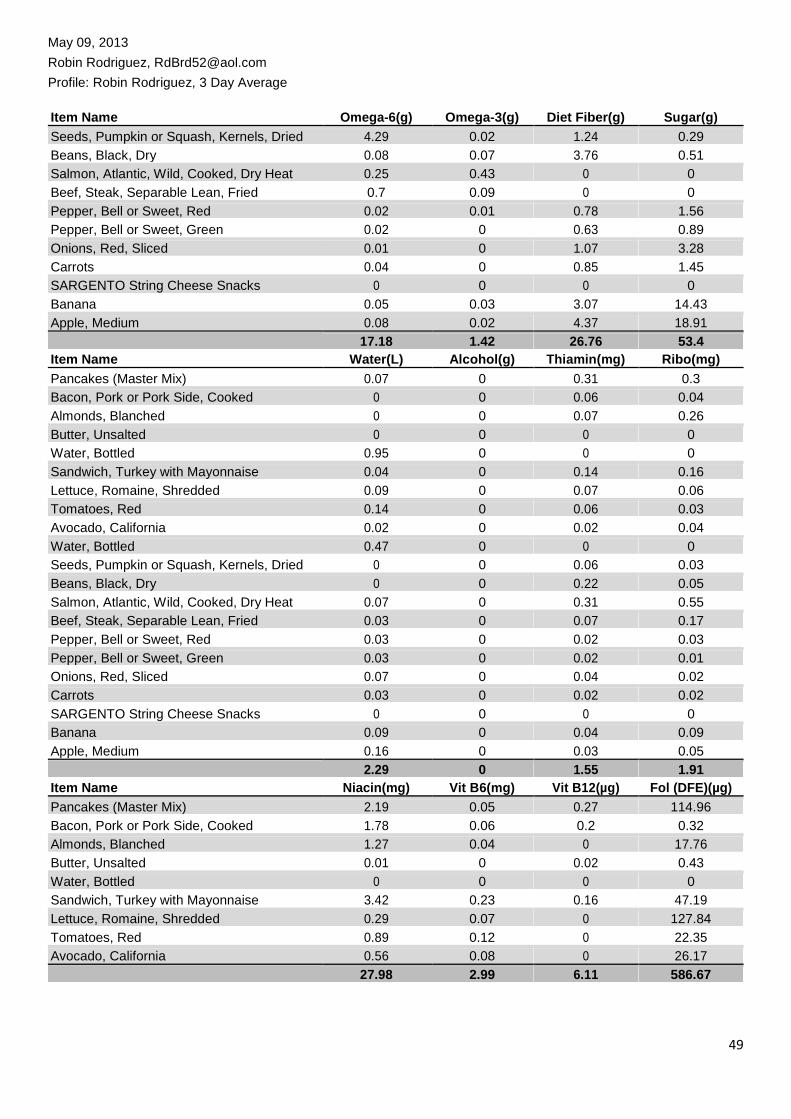
Item Name Omega-6(g) Omega-3(g) Diet Fiber(g) Sugar(g)
Seeds, Pumpkin or Squash, Kernels, Dried 4.29 0.02 1.24 0.29
Beans, Black, Dry 0.08 0.07 3.76 0.51
Salmon, Atlantic, Wild, Cooked, Dry Heat 0.25 0.43 0 0
Beef, Steak, Separable Lean, Fried 0.7 0.09 0 0
Pepper, Bell or Sweet, Red 0.02 0.01 0.78 1.56
Pepper, Bell or Sweet, Green 0.02 0 0.63 0.89
Onions, Red, Sliced 0.01 0 1.07 3.28
Carrots 0.04 0 0.85 1.45
SARGENTO String Cheese Snacks 0 0 0 0
Banana 0.05 0.03 3.07 14.43
Apple, Medium 0.08 0.02 4.37 18.91 17.18 1.42 26.76 53.4 Item Name Water(L) Alcohol(g) Thiamin(mg) Ribo(mg)
Pancakes (Master Mix) 0.07 0 0.31 0.3
Bacon, Pork or Pork Side, Cooked 0 0 0.06 0.04
Almonds, Blanched 0 0 0.07 0.26
Butter, Unsalted 0 0 0 0
Water, Bottled 0.95 0 0 0
Sandwich, Turkey with Mayonnaise 0.04 0 0.14 0.16
Lettuce, Romaine, Shredded 0.09 0 0.07 0.06
Tomatoes, Red 0.14 0 0.06 0.03
Avocado, California 0.02 0 0.02 0.04
Water, Bottled 0.47 0 0 0
Seeds, Pumpkin or Squash, Kernels, Dried 0 0 0.06 0.03
Beans, Black, Dry 0 0 0.22 0.05
Salmon, Atlantic, Wild, Cooked, Dry Heat 0.07 0 0.31 0.55
Beef, Steak, Separable Lean, Fried 0.03 0 0.07 0.17
Pepper, Bell or Sweet, Red 0.03 0 0.02 0.03
Pepper, Bell or Sweet, Green 0.03 0 0.02 0.01
Onions, Red, Sliced 0.07 0 0.04 0.02
Carrots 0.03 0 0.02 0.02
SARGENTO String Cheese Snacks 0 0 0 0
Banana 0.09 0 0.04 0.09
Apple, Medium 0.16 0 0.03 0.05
2.29 0 1.55 1.91 Item Name Niacin(mg) Vit B6(mg) Vit B12(µg) Fol (DFE)(µg)
Pancakes (Master Mix) 2.19 0.05 0.27 114.96
Bacon, Pork or Pork Side, Cooked 1.78 0.06 0.2 0.32
Almonds, Blanched 1.27 0.04 0 17.76
Butter, Unsalted 0.01 0 0.02 0.43
Water, Bottled 0 0 0 0
Sandwich, Turkey with Mayonnaise 3.42 0.23 0.16 47.19
Lettuce, Romaine, Shredded 0.29 0.07 0 127.84
Tomatoes, Red 0.89 0.12 0 22.35
Avocado, California 0.56 0.08 0 26.17
27.98 2.99 6.11 586.67

50
May 09, 2013 Robin Rodriguez, [email protected] Profile: Robin Rodriguez, 3 Day Average
Item Name Niacin(mg) Vit B6(mg) Vit B12(µg) Fol (DFE)(µg)
Water, Bottled 0 0 0 0
Seeds, Pumpkin or Squash, Kernels, Dried 1.03 0.03 0 12.01
Beans, Black, Dry 0.47 0.07 0 107.67
Salmon, Atlantic, Wild, Cooked, Dry Heat 11.43 1.07 3.46 32.89
Beef, Steak, Separable Lean, Fried 2.79 0.32 1.99 6.8
Pepper, Bell or Sweet, Red 0.36 0.11 0 17.14
Pepper, Bell or Sweet, Green 0.18 0.08 0 3.72
Onions, Red, Sliced 0.06 0.12 0 14.57
Carrots 0.3 0.04 0 5.8
SARGENTO String Cheese Snacks 0 0 0 0
Banana 0.78 0.43 0 23.6
Apple, Medium 0.17 0.08 0 5.46
27.98 2.99 6.11 586.67 Item Name Vit C(mg) Vit D (ug)(µg) Vit A (RAE)(µg) Vit A (IU)(IU)
Pancakes (Master Mix) 0.15 0.48 0 140.26
Bacon, Pork or Pork Side, Cooked 0 0 1.76 0
Almonds, Blanched 0 0 0 2.54
Butter, Unsalted 0 0.21 97.13 354.86
Water, Bottled 0 0 0 0
Sandwich, Turkey with Mayonnaise 0 0 2.86 9.54
Lettuce, Romaine, Shredded 3.76 0 409.84 8187.4
Tomatoes, Red 20.41 0 62.58 1241.17
Avocado, California 2.59 0 2.06 43.23
Water, Bottled 0 0 0 0
Seeds, Pumpkin or Squash, Kernels, Dried 0.39 0 0.21 3.31
Beans, Black, Dry 0 0 0 4.12
Salmon, Atlantic, Wild, Cooked, Dry Heat 0 0 14.74 49.9
Beef, Steak, Separable Lean, Fried 0 0 0 0
Pepper, Bell or Sweet, Red 47.57 0 58.48 1166.3
Pepper, Bell or Sweet, Green 29.95 0 6.7 137.82
Onions, Red, Sliced 4.91 0 0 0
Carrots 1.8 0 254.68 5095.33
SARGENTO String Cheese Snacks 0 0 60.06 200
Banana 10.27 0 3.54 75.52
Apple, Medium 8.37 0 5.46 98.28 130.16 0.69 980.1 16,809.58 Item Name Alpha-T(mg) Calcium(mg) Iron(mg) Magn(mg)
Pancakes (Master Mix) 0.25 88.64 2.01 13.51
Bacon, Pork or Pork Side, Cooked 0.05 1.76 0.23 5.28
Almonds, Blanched 8.61 85.55 1.19 97.15
Butter, Unsalted 0.33 3.41 0 0.28
Water, Bottled 0 94.8 0 18.96
Sandwich, Turkey with Mayonnaise 0.37 50.05 1.73 17.16
Lettuce, Romaine, Shredded 0.12 31.02 0.91 13.16
Tomatoes, Red 0.8 14.9 0.4 16.39
13.09 732.33 13.87 485.62 DA Plus 10 Page: 11

51
May 09, 2013 Robin Rodriguez, [email protected] Profile: Robin Rodriguez, 3 Day Average
Item Name Alpha-T(mg) Calcium(mg) Iron(mg) Magn(mg)
Avocado, California 0.58 3.82 0.18 8.53
Water, Bottled 0 47.4 0 9.48
Seeds, Pumpkin or Squash, Kernels, Dried 0.45 9.52 1.83 122.54
Beans, Black, Dry 0.05 29.83 1.22 41.47
Salmon, Atlantic, Wild, Cooked, Dry Heat 0 17.01 1.17 41.96
Beef, Steak, Separable Lean, Fried 0.08 4.53 1.96 19.27
Pepper, Bell or Sweet, Red 0.59 2.61 0.16 4.47
Pepper, Bell or Sweet, Green 0.14 3.72 0.13 3.72
Onions, Red, Sliced 0.02 16.87 0.15 7.67
Carrots 0.2 10.06 0.09 3.66
SARGENTO String Cheese Snacks 0 200 0 0
Banana 0.12 5.9 0.31 31.86
Apple, Medium 0.33 10.92 0.22 9.1
13.09 732.33 13.87 485.62 Item Name Potas(mg) Zinc(mg) Sodium(mg)
Pancakes (Master Mix) 143.25 0.55 481.48
Bacon, Pork or Pork Side, Cooked 90.4 0.56 369.6
Almonds, Blanched 238.89 1.08 6.89
Butter, Unsalted 3.41 0.01 1.56
Water, Bottled 0 0 18.96
Sandwich, Turkey with Mayonnaise 152.29 1.5 282.42
Lettuce, Romaine, Shredded 232.18 0.22 7.52
Tomatoes, Red 353.13 0.25 7.45
Avocado, California 149.11 0.2 2.35
Water, Bottled 0 0 9.48
Seeds, Pumpkin or Squash, Kernels, Dried 167.46 1.62 1.45
Beans, Black, Dry 359.63 0.89 1.21
Salmon, Atlantic, Wild, Cooked, Dry Heat 712.14 0.93 63.5
Beef, Steak, Separable Lean, Fried 276.53 3.04 224.4
Pepper, Bell or Sweet, Red 78.6 0.09 1.49
Pepper, Bell or Sweet, Green 65.19 0.05 1.12
Onions, Red, Sliced 110.4 0.12 2.3
Carrots 97.6 0.07 21.05
SARGENTO String Cheese Snacks 0 0 210
Banana 422.44 0.18 1.18
Apple, Medium 194.74 0.07 1.82
3,847.4 11.43 1,717.23 DA Plus 10 Page: 12

52
May 09, 2013 Robin Rodriguez, [email protected] Profile: Robin Rodriguez, 3 Day Average
Intake Spreadsheet for May 05, 2013 Item Name Meal Quantity Wt(g) Kcal(kcal) Eggs, Scrambled or Omelet, Fat Added in Breakfast 1 item(s) - 2 62 93.62 Cooking large eggs
Salsa Breakfast 2 tablespoon(s) 32 8.64 Banana Breakfast 1 item(s) - 118 105.02 Medium (7 in. to
7 7/8 in. long)
Avocado, California Breakfast 0.22 item(s) - 29.41 49.11 fruit without skin
and seeds
Salad, Green Lunch 2 cup(s) 276 44.16 Broccoli Lunch 0.25 cup(s) - 22.75 7.74 Chopped
Carrots Lunch 0.25 cup(s) - 30.5 12.51 Strips or slices
Tomatoes, Red Lunch 1 item(s) - 123 22.14 Medium whole
(2 3/5 in.
diameter)
Apple, Medium Lunch 1 item(s) - 1 182 94.64 item is 1
medium apple
(3 in. diameter)
Beef, Tenderloin, Choice, Filet Mignon, 0'' Dinner 3 ounce(s) 85.05 196.46 Fat, Broiled
Potatoes, Baked, Flesh and Skin with Salt Dinner 0.5 item(s) - 1 86.5 80.44 item is 1
medium potato
(2 1/4'' x 3 1/4'')
Water, Bottled Dinner 24 fluid ounce(s) 711 0 SARGENTO String Cheese Snacks Snacks 1 item(s) - 1 28 80 item is 1 oz
Milk, Chocolate, Reduced Fat Snacks 8 fluid ounce(s) 250 190
Water, Bottled Snacks 32 fluid ounce(s) 948 0 Banana Snacks 1 item(s) - 118 105.02 Medium (7 in. to
7 7/8 in. long)
3,102.21 1,089.5 Item Name Protein(g) Carb(g) Fat(g) Sat Fat(g) Eggs, Scrambled or Omelet, Fat Added in 6.49 1.3 6.74 2 Cooking
Salsa 0.49 2 0.05 0.01
Banana 1.29 26.95 0.39 0.13
Avocado, California 0.58 2.54 4.53 0.63
Salad, Green 3.45 8.89 0.19 0.03
Broccoli 0.64 1.51 0.08 0.01
Carrots 0.28 2.92 0.07 0.01
Tomatoes, Red 1.08 4.78 0.25 0.03
Apple, Medium 0.47 25.13 0.31 0.05
57.49 152.6 34.42 13.6 DA Plus 10 Page: 13

53
May 09, 2013 Robin Rodriguez, [email protected] Profile: Robin Rodriguez, 3 Day Average
Item Name Protein(g) Carb(g) Fat(g) Sat Fat(g) Beef, Tenderloin, Choice, Filet Mignon, 0'' 23.79 0 10.55 4.09 Fat, Broiled
Potatoes, Baked, Flesh and Skin with Salt 2.16 18.29 0.11 0.03
Water, Bottled 0 0 0 0
SARGENTO String Cheese Snacks 8 1 6 3.5
Milk, Chocolate, Reduced Fat 7.47 30.33 4.75 2.94
Water, Bottled 0 0 0 0
Banana 1.29 26.95 0.39 0.13
57.49 152.6 34.42 13.6 Item Name Mono Fat(g) Poly Fat(g) Trans Fat(g) Chol(mg) Eggs, Scrambled or Omelet, Fat Added in 2.69 1.16 0 198.4 Cooking
Salsa 0.01 0.04 0 0
Banana 0.04 0.09 0 0
Avocado, California 2.88 0.53 0 0
Salad, Green 0.01 0.09 0 0
Broccoli 0 0.01 0 0
Carrots 0 0.04 0 0
Tomatoes, Red 0.04 0.1 0 0
Apple, Medium 0.01 0.09 0 0 Beef, Tenderloin, Choice, Filet Mignon, 0'' 4.32 0.39 0 76.54 Fat, Broiled
Potatoes, Baked, Flesh and Skin with Salt 0 0.05 0 0
Water, Bottled 0 0 0 0
SARGENTO String Cheese Snacks 0 0 0 15
Milk, Chocolate, Reduced Fat 1.14 0.22 0 20
Water, Bottled 0 0 0 0
Banana 0.04 0.09 0 0
11.18 2.9 0 309.94 Item Name Omega-6(g) Omega-3(g) Diet Fiber(g) Sugar(g) Eggs, Scrambled or Omelet, Fat Added in 1.01 0.07 0 1.34 Cooking
Salsa 0.03 0 0.51 0.98
Banana 0.05 0.03 3.07 14.43
Avocado, California 0.49 0.04 2 0.09
Salad, Green 0 0 5.96 3.98
Broccoli 0 0 0.59 0.39
Carrots 0.04 0 0.85 1.45
Tomatoes, Red 0.1 0 1.48 3.23
Apple, Medium 0.08 0.02 4.37 18.91 Beef, Tenderloin, Choice, Filet Mignon, 0'' 0.29 0 0 0 Fat, Broiled
Potatoes, Baked, Flesh and Skin with Salt 0.04 0.01 1.9 1.02
Water, Bottled 0 0 0 0
SARGENTO String Cheese Snacks 0 0 0 0
Milk, Chocolate, Reduced Fat 0.2 0 1.75 23.88
2.38 0.21 25.55 84.12 DA Plus 10 Page: 14
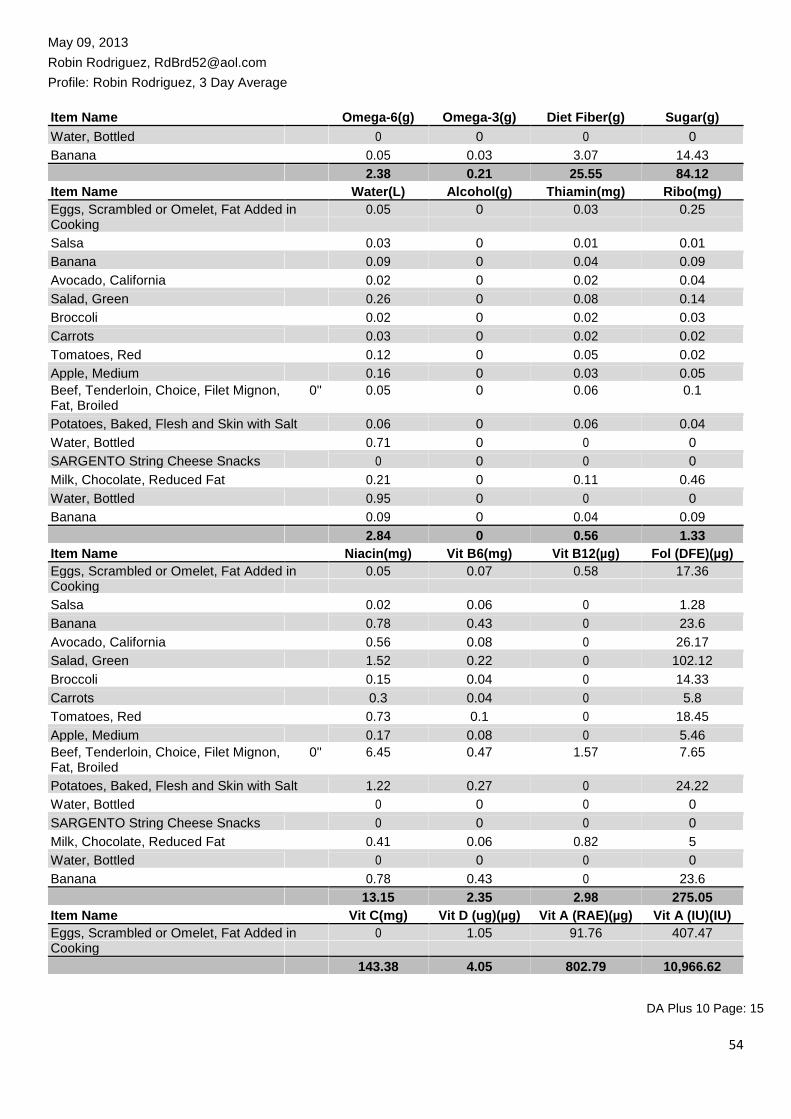
54
May 09, 2013 Robin Rodriguez, [email protected] Profile: Robin Rodriguez, 3 Day Average
Item Name Omega-6(g) Omega-3(g) Diet Fiber(g) Sugar(g)
Water, Bottled 0 0 0 0
Banana 0.05 0.03 3.07 14.43 2.38 0.21 25.55 84.12 Item Name Water(L) Alcohol(g) Thiamin(mg) Ribo(mg) Eggs, Scrambled or Omelet, Fat Added in 0.05 0 0.03 0.25 Cooking
Salsa 0.03 0 0.01 0.01
Banana 0.09 0 0.04 0.09
Avocado, California 0.02 0 0.02 0.04
Salad, Green 0.26 0 0.08 0.14
Broccoli 0.02 0 0.02 0.03
Carrots 0.03 0 0.02 0.02
Tomatoes, Red 0.12 0 0.05 0.02
Apple, Medium 0.16 0 0.03 0.05 Beef, Tenderloin, Choice, Filet Mignon, 0'' 0.05 0 0.06 0.1 Fat, Broiled
Potatoes, Baked, Flesh and Skin with Salt 0.06 0 0.06 0.04
Water, Bottled 0.71 0 0 0
SARGENTO String Cheese Snacks 0 0 0 0
Milk, Chocolate, Reduced Fat 0.21 0 0.11 0.46
Water, Bottled 0.95 0 0 0
Banana 0.09 0 0.04 0.09
2.84 0 0.56 1.33 Item Name Niacin(mg) Vit B6(mg) Vit B12(µg) Fol (DFE)(µg) Eggs, Scrambled or Omelet, Fat Added in 0.05 0.07 0.58 17.36 Cooking
Salsa 0.02 0.06 0 1.28
Banana 0.78 0.43 0 23.6
Avocado, California 0.56 0.08 0 26.17
Salad, Green 1.52 0.22 0 102.12
Broccoli 0.15 0.04 0 14.33
Carrots 0.3 0.04 0 5.8
Tomatoes, Red 0.73 0.1 0 18.45
Apple, Medium 0.17 0.08 0 5.46 Beef, Tenderloin, Choice, Filet Mignon, 0'' 6.45 0.47 1.57 7.65 Fat, Broiled
Potatoes, Baked, Flesh and Skin with Salt 1.22 0.27 0 24.22
Water, Bottled 0 0 0 0
SARGENTO String Cheese Snacks 0 0 0 0
Milk, Chocolate, Reduced Fat 0.41 0.06 0.82 5
Water, Bottled 0 0 0 0
Banana 0.78 0.43 0 23.6
13.15 2.35 2.98 275.05 Item Name Vit C(mg) Vit D (ug)(µg) Vit A (RAE)(µg) Vit A (IU)(IU) Eggs, Scrambled or Omelet, Fat Added in 0 1.05 91.76 407.47 Cooking
143.38 4.05 802.79 10,966.62 DA Plus 10 Page: 15
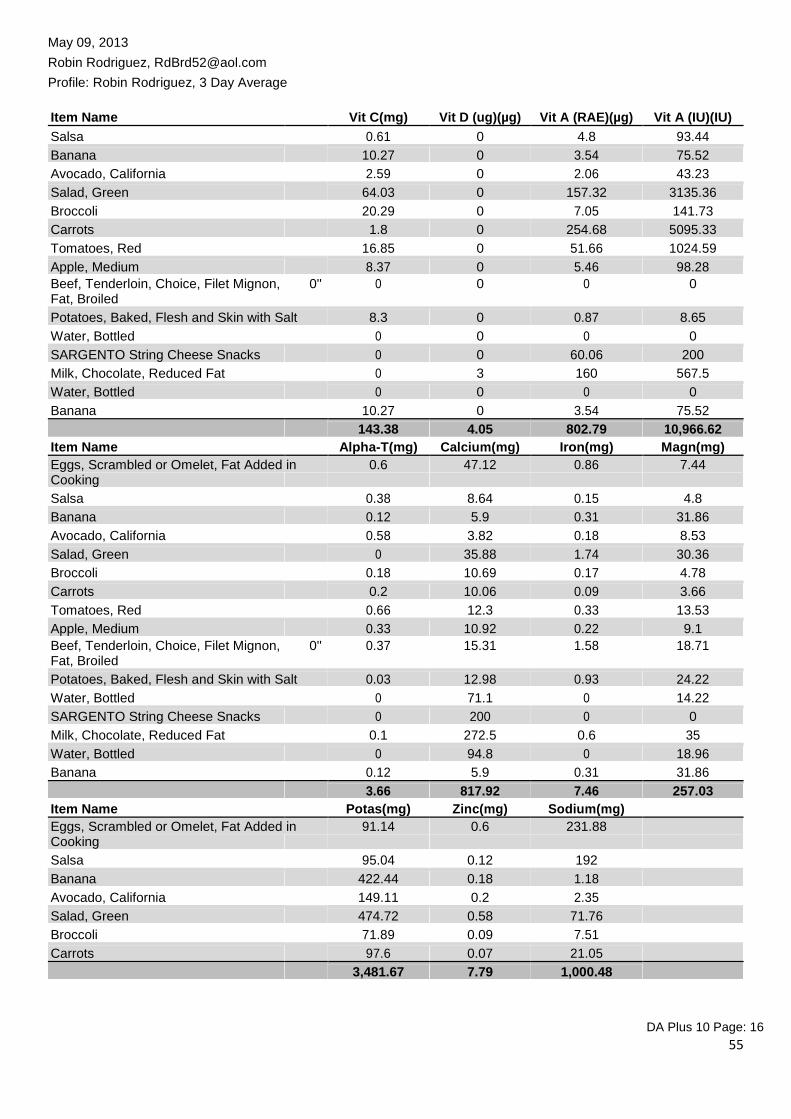
55
May 09, 2013 Robin Rodriguez, [email protected] Profile: Robin Rodriguez, 3 Day Average
Item Name Vit C(mg) Vit D (ug)(µg) Vit A (RAE)(µg) Vit A (IU)(IU)
Salsa 0.61 0 4.8 93.44
Banana 10.27 0 3.54 75.52
Avocado, California 2.59 0 2.06 43.23
Salad, Green 64.03 0 157.32 3135.36
Broccoli 20.29 0 7.05 141.73
Carrots 1.8 0 254.68 5095.33
Tomatoes, Red 16.85 0 51.66 1024.59
Apple, Medium 8.37 0 5.46 98.28 Beef, Tenderloin, Choice, Filet Mignon, 0'' 0 0 0 0 Fat, Broiled
Potatoes, Baked, Flesh and Skin with Salt 8.3 0 0.87 8.65
Water, Bottled 0 0 0 0
SARGENTO String Cheese Snacks 0 0 60.06 200
Milk, Chocolate, Reduced Fat 0 3 160 567.5
Water, Bottled 0 0 0 0
Banana 10.27 0 3.54 75.52 143.38 4.05 802.79 10,966.62 Item Name Alpha-T(mg) Calcium(mg) Iron(mg) Magn(mg) Eggs, Scrambled or Omelet, Fat Added in 0.6 47.12 0.86 7.44 Cooking
Salsa 0.38 8.64 0.15 4.8
Banana 0.12 5.9 0.31 31.86
Avocado, California 0.58 3.82 0.18 8.53
Salad, Green 0 35.88 1.74 30.36
Broccoli 0.18 10.69 0.17 4.78
Carrots 0.2 10.06 0.09 3.66
Tomatoes, Red 0.66 12.3 0.33 13.53
Apple, Medium 0.33 10.92 0.22 9.1 Beef, Tenderloin, Choice, Filet Mignon, 0'' 0.37 15.31 1.58 18.71 Fat, Broiled
Potatoes, Baked, Flesh and Skin with Salt 0.03 12.98 0.93 24.22
Water, Bottled 0 71.1 0 14.22
SARGENTO String Cheese Snacks 0 200 0 0
Milk, Chocolate, Reduced Fat 0.1 272.5 0.6 35
Water, Bottled 0 94.8 0 18.96
Banana 0.12 5.9 0.31 31.86
3.66 817.92 7.46 257.03 Item Name Potas(mg) Zinc(mg) Sodium(mg)
Eggs, Scrambled or Omelet, Fat Added in 91.14 0.6 231.88 Cooking
Salsa 95.04 0.12 192
Banana 422.44 0.18 1.18
Avocado, California 149.11 0.2 2.35
Salad, Green 474.72 0.58 71.76
Broccoli 71.89 0.09 7.51
Carrots 97.6 0.07 21.05
3,481.67 7.79 1,000.48 DA Plus 10 Page: 16
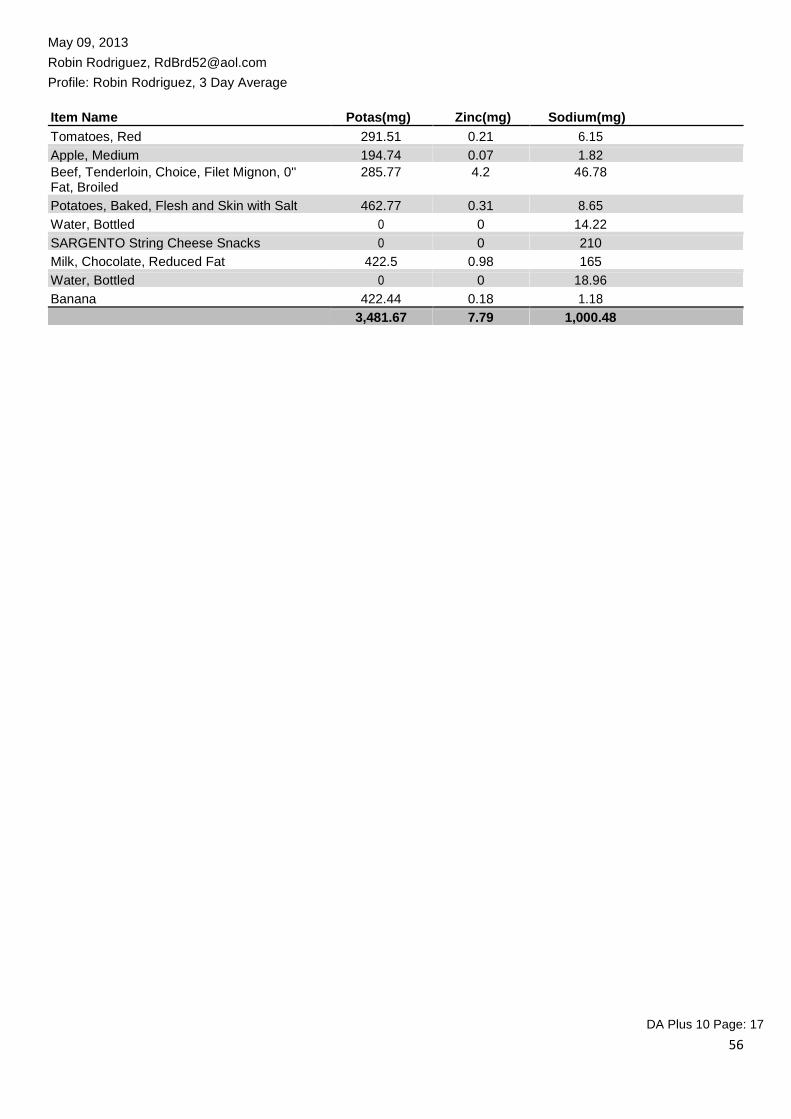
56
May 09, 2013 Robin Rodriguez, [email protected] Profile: Robin Rodriguez, 3 Day Average
Item Name Potas(mg) Zinc(mg) Sodium(mg)
Tomatoes, Red 291.51 0.21 6.15
Apple, Medium 194.74 0.07 1.82 Beef, Tenderloin, Choice, Filet Mignon, 0'' 285.77 4.2 46.78 Fat, Broiled
Potatoes, Baked, Flesh and Skin with Salt 462.77 0.31 8.65
Water, Bottled 0 0 14.22
SARGENTO String Cheese Snacks 0 0 210
Milk, Chocolate, Reduced Fat 422.5 0.98 165
Water, Bottled 0 0 18.96
Banana 422.44 0.18 1.18 3,481.67 7.79 1,000.48
DA Plus 10 Page: 17
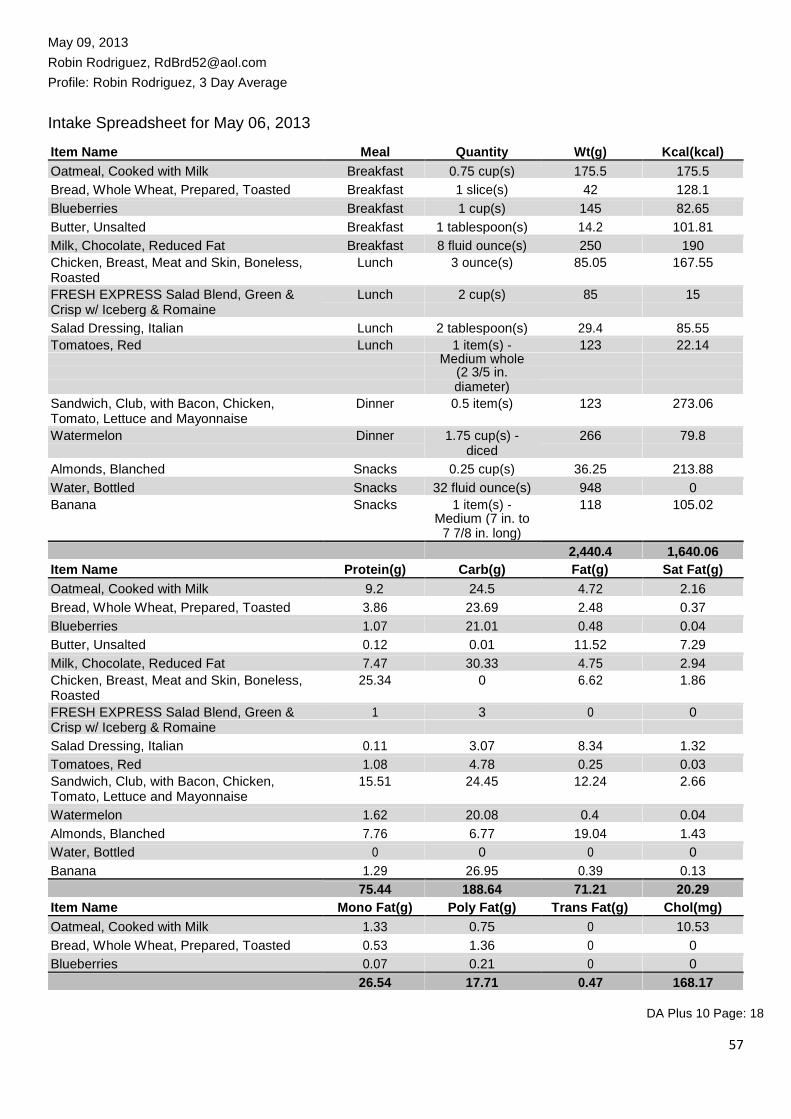
57
May 09, 2013 Robin Rodriguez, [email protected] Profile: Robin Rodriguez, 3 Day Average
Intake Spreadsheet for May 06, 2013 Item Name Meal Quantity Wt(g) Kcal(kcal)
Oatmeal, Cooked with Milk Breakfast 0.75 cup(s) 175.5 175.5
Bread, Whole Wheat, Prepared, Toasted Breakfast 1 slice(s) 42 128.1
Blueberries Breakfast 1 cup(s) 145 82.65
Butter, Unsalted Breakfast 1 tablespoon(s) 14.2 101.81
Milk, Chocolate, Reduced Fat Breakfast 8 fluid ounce(s) 250 190 Chicken, Breast, Meat and Skin, Boneless, Lunch 3 ounce(s) 85.05 167.55 Roasted
FRESH EXPRESS Salad Blend, Green & Lunch 2 cup(s) 85 15 Crisp w/ Iceberg & Romaine
Salad Dressing, Italian Lunch 2 tablespoon(s) 29.4 85.55 Tomatoes, Red Lunch 1 item(s) - 123 22.14 Medium whole
(2 3/5 in.
diameter)
Sandwich, Club, with Bacon, Chicken, Dinner 0.5 item(s) 123 273.06 Tomato, Lettuce and Mayonnaise
Watermelon Dinner 1.75 cup(s) - 266 79.8 diced
Almonds, Blanched Snacks 0.25 cup(s) 36.25 213.88
Water, Bottled Snacks 32 fluid ounce(s) 948 0 Banana Snacks 1 item(s) - 118 105.02 Medium (7 in. to
7 7/8 in. long)
2,440.4 1,640.06 Item Name Protein(g) Carb(g) Fat(g) Sat Fat(g)
Oatmeal, Cooked with Milk 9.2 24.5 4.72 2.16
Bread, Whole Wheat, Prepared, Toasted 3.86 23.69 2.48 0.37
Blueberries 1.07 21.01 0.48 0.04
Butter, Unsalted 0.12 0.01 11.52 7.29
Milk, Chocolate, Reduced Fat 7.47 30.33 4.75 2.94 Chicken, Breast, Meat and Skin, Boneless, 25.34 0 6.62 1.86 Roasted
FRESH EXPRESS Salad Blend, Green & 1 3 0 0 Crisp w/ Iceberg & Romaine
Salad Dressing, Italian 0.11 3.07 8.34 1.32
Tomatoes, Red 1.08 4.78 0.25 0.03 Sandwich, Club, with Bacon, Chicken, 15.51 24.45 12.24 2.66 Tomato, Lettuce and Mayonnaise
Watermelon 1.62 20.08 0.4 0.04
Almonds, Blanched 7.76 6.77 19.04 1.43
Water, Bottled 0 0 0 0
Banana 1.29 26.95 0.39 0.13
75.44 188.64 71.21 20.29 Item Name Mono Fat(g) Poly Fat(g) Trans Fat(g) Chol(mg)
Oatmeal, Cooked with Milk 1.33 0.75 0 10.53
Bread, Whole Wheat, Prepared, Toasted 0.53 1.36 0 0
Blueberries 0.07 0.21 0 0
26.54 17.71 0.47 168.17 DA Plus 10 Page: 18
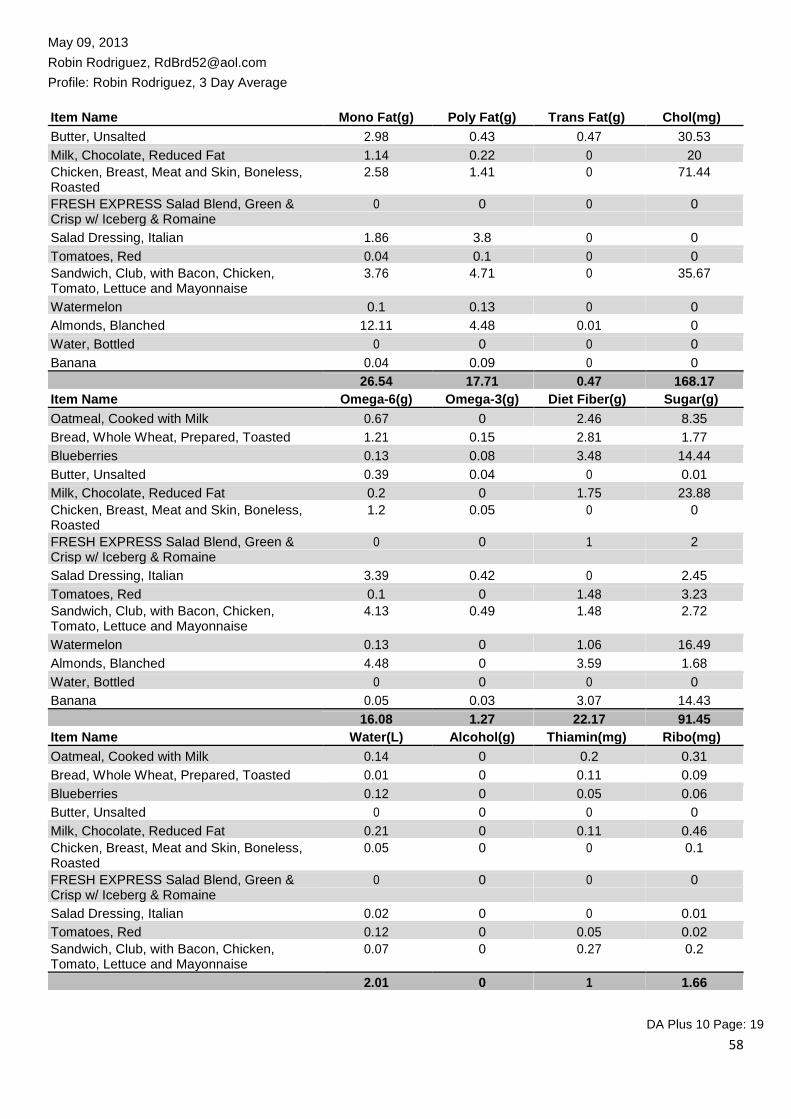
58
May 09, 2013 Robin Rodriguez, [email protected] Profile: Robin Rodriguez, 3 Day Average
Item Name Mono Fat(g) Poly Fat(g) Trans Fat(g) Chol(mg)
Butter, Unsalted 2.98 0.43 0.47 30.53
Milk, Chocolate, Reduced Fat 1.14 0.22 0 20 Chicken, Breast, Meat and Skin, Boneless, 2.58 1.41 0 71.44 Roasted
FRESH EXPRESS Salad Blend, Green & 0 0 0 0 Crisp w/ Iceberg & Romaine
Salad Dressing, Italian 1.86 3.8 0 0
Tomatoes, Red 0.04 0.1 0 0 Sandwich, Club, with Bacon, Chicken, 3.76 4.71 0 35.67 Tomato, Lettuce and Mayonnaise
Watermelon 0.1 0.13 0 0
Almonds, Blanched 12.11 4.48 0.01 0
Water, Bottled 0 0 0 0
Banana 0.04 0.09 0 0 26.54 17.71 0.47 168.17 Item Name Omega-6(g) Omega-3(g) Diet Fiber(g) Sugar(g)
Oatmeal, Cooked with Milk 0.67 0 2.46 8.35
Bread, Whole Wheat, Prepared, Toasted 1.21 0.15 2.81 1.77
Blueberries 0.13 0.08 3.48 14.44
Butter, Unsalted 0.39 0.04 0 0.01
Milk, Chocolate, Reduced Fat 0.2 0 1.75 23.88 Chicken, Breast, Meat and Skin, Boneless, 1.2 0.05 0 0 Roasted
FRESH EXPRESS Salad Blend, Green & 0 0 1 2 Crisp w/ Iceberg & Romaine
Salad Dressing, Italian 3.39 0.42 0 2.45
Tomatoes, Red 0.1 0 1.48 3.23 Sandwich, Club, with Bacon, Chicken, 4.13 0.49 1.48 2.72 Tomato, Lettuce and Mayonnaise
Watermelon 0.13 0 1.06 16.49
Almonds, Blanched 4.48 0 3.59 1.68
Water, Bottled 0 0 0 0
Banana 0.05 0.03 3.07 14.43
16.08 1.27 22.17 91.45 Item Name Water(L) Alcohol(g) Thiamin(mg) Ribo(mg)
Oatmeal, Cooked with Milk 0.14 0 0.2 0.31
Bread, Whole Wheat, Prepared, Toasted 0.01 0 0.11 0.09
Blueberries 0.12 0 0.05 0.06
Butter, Unsalted 0 0 0 0
Milk, Chocolate, Reduced Fat 0.21 0 0.11 0.46 Chicken, Breast, Meat and Skin, Boneless, 0.05 0 0 0.1 Roasted
FRESH EXPRESS Salad Blend, Green & 0 0 0 0 Crisp w/ Iceberg & Romaine
Salad Dressing, Italian 0.02 0 0 0.01
Tomatoes, Red 0.12 0 0.05 0.02 Sandwich, Club, with Bacon, Chicken, 0.07 0 0.27 0.2 Tomato, Lettuce and Mayonnaise
2.01 0 1 1.66 DA Plus 10 Page: 19
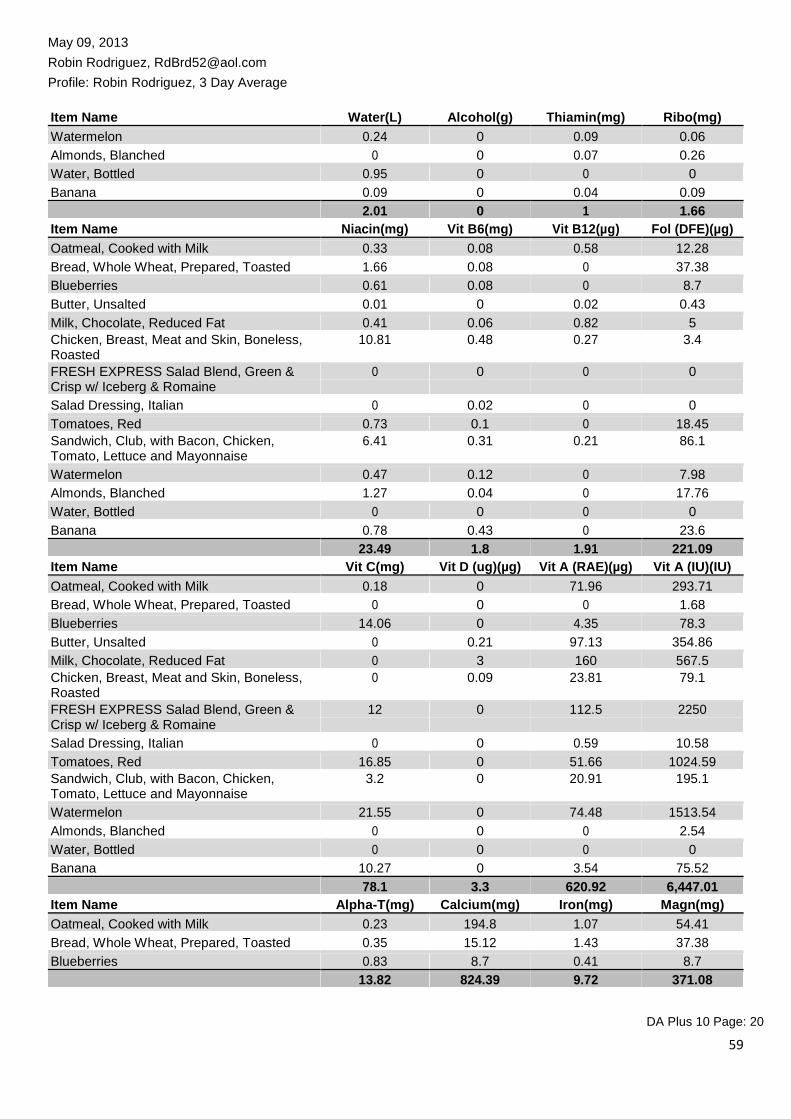
59
May 09, 2013 Robin Rodriguez, [email protected] Profile: Robin Rodriguez, 3 Day Average
Item Name Water(L) Alcohol(g) Thiamin(mg) Ribo(mg)
Watermelon 0.24 0 0.09 0.06
Almonds, Blanched 0 0 0.07 0.26
Water, Bottled 0.95 0 0 0
Banana 0.09 0 0.04 0.09
2.01 0 1 1.66 Item Name Niacin(mg) Vit B6(mg) Vit B12(µg) Fol (DFE)(µg)
Oatmeal, Cooked with Milk 0.33 0.08 0.58 12.28
Bread, Whole Wheat, Prepared, Toasted 1.66 0.08 0 37.38
Blueberries 0.61 0.08 0 8.7
Butter, Unsalted 0.01 0 0.02 0.43
Milk, Chocolate, Reduced Fat 0.41 0.06 0.82 5 Chicken, Breast, Meat and Skin, Boneless, 10.81 0.48 0.27 3.4 Roasted
FRESH EXPRESS Salad Blend, Green & 0 0 0 0 Crisp w/ Iceberg & Romaine
Salad Dressing, Italian 0 0.02 0 0
Tomatoes, Red 0.73 0.1 0 18.45 Sandwich, Club, with Bacon, Chicken, 6.41 0.31 0.21 86.1 Tomato, Lettuce and Mayonnaise
Watermelon 0.47 0.12 0 7.98
Almonds, Blanched 1.27 0.04 0 17.76
Water, Bottled 0 0 0 0
Banana 0.78 0.43 0 23.6 23.49 1.8 1.91 221.09 Item Name Vit C(mg) Vit D (ug)(µg) Vit A (RAE)(µg) Vit A (IU)(IU)
Oatmeal, Cooked with Milk 0.18 0 71.96 293.71
Bread, Whole Wheat, Prepared, Toasted 0 0 0 1.68
Blueberries 14.06 0 4.35 78.3
Butter, Unsalted 0 0.21 97.13 354.86
Milk, Chocolate, Reduced Fat 0 3 160 567.5 Chicken, Breast, Meat and Skin, Boneless, 0 0.09 23.81 79.1 Roasted
FRESH EXPRESS Salad Blend, Green & 12 0 112.5 2250 Crisp w/ Iceberg & Romaine
Salad Dressing, Italian 0 0 0.59 10.58
Tomatoes, Red 16.85 0 51.66 1024.59 Sandwich, Club, with Bacon, Chicken, 3.2 0 20.91 195.1 Tomato, Lettuce and Mayonnaise
Watermelon 21.55 0 74.48 1513.54
Almonds, Blanched 0 0 0 2.54
Water, Bottled 0 0 0 0
Banana 10.27 0 3.54 75.52
78.1 3.3 620.92 6,447.01 Item Name Alpha-T(mg) Calcium(mg) Iron(mg) Magn(mg)
Oatmeal, Cooked with Milk 0.23 194.8 1.07 54.41
Bread, Whole Wheat, Prepared, Toasted 0.35 15.12 1.43 37.38
Blueberries 0.83 8.7 0.41 8.7 13.82 824.39 9.72 371.08
DA Plus 10 Page: 20
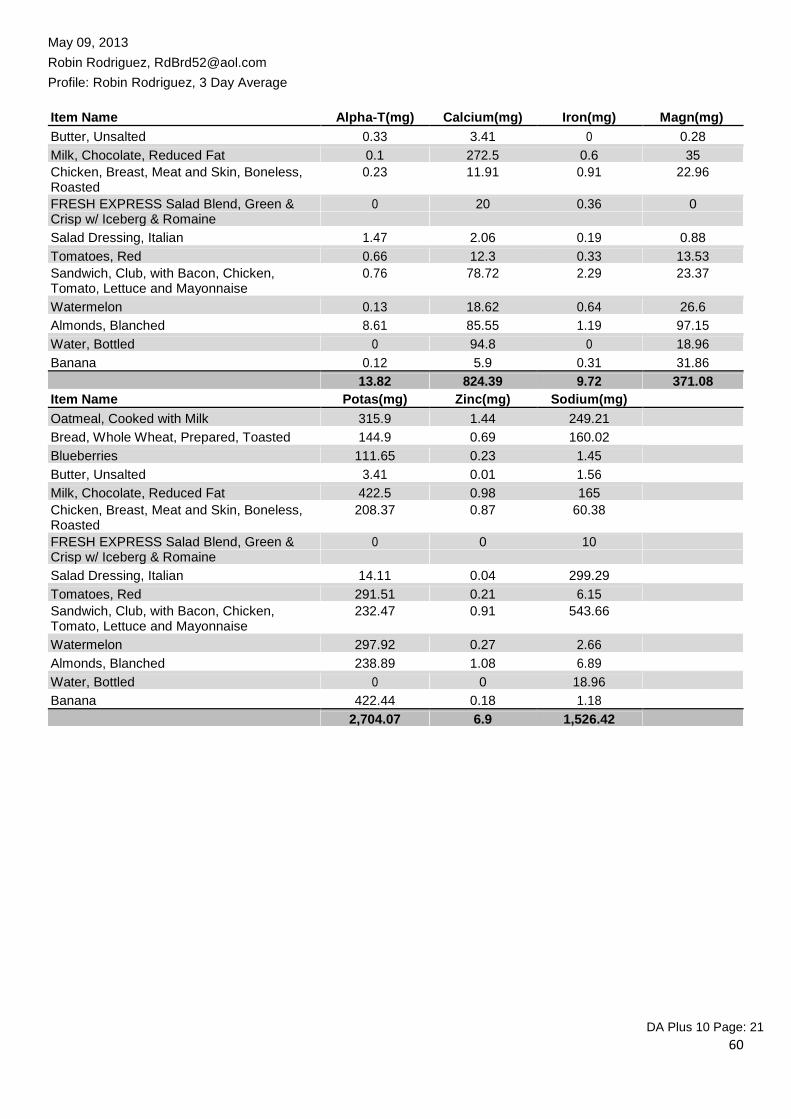
60
May 09, 2013 Robin Rodriguez, [email protected] Profile: Robin Rodriguez, 3 Day Average
Item Name Alpha-T(mg) Calcium(mg) Iron(mg) Magn(mg)
Butter, Unsalted 0.33 3.41 0 0.28
Milk, Chocolate, Reduced Fat 0.1 272.5 0.6 35 Chicken, Breast, Meat and Skin, Boneless, 0.23 11.91 0.91 22.96 Roasted
FRESH EXPRESS Salad Blend, Green & 0 20 0.36 0 Crisp w/ Iceberg & Romaine
Salad Dressing, Italian 1.47 2.06 0.19 0.88
Tomatoes, Red 0.66 12.3 0.33 13.53 Sandwich, Club, with Bacon, Chicken, 0.76 78.72 2.29 23.37 Tomato, Lettuce and Mayonnaise
Watermelon 0.13 18.62 0.64 26.6
Almonds, Blanched 8.61 85.55 1.19 97.15
Water, Bottled 0 94.8 0 18.96
Banana 0.12 5.9 0.31 31.86 13.82 824.39 9.72 371.08 Item Name Potas(mg) Zinc(mg) Sodium(mg)
Oatmeal, Cooked with Milk 315.9 1.44 249.21
Bread, Whole Wheat, Prepared, Toasted 144.9 0.69 160.02
Blueberries 111.65 0.23 1.45
Butter, Unsalted 3.41 0.01 1.56
Milk, Chocolate, Reduced Fat 422.5 0.98 165 Chicken, Breast, Meat and Skin, Boneless, 208.37 0.87 60.38 Roasted
FRESH EXPRESS Salad Blend, Green & 0 0 10 Crisp w/ Iceberg & Romaine
Salad Dressing, Italian 14.11 0.04 299.29
Tomatoes, Red 291.51 0.21 6.15 Sandwich, Club, with Bacon, Chicken, 232.47 0.91 543.66 Tomato, Lettuce and Mayonnaise
Watermelon 297.92 0.27 2.66
Almonds, Blanched 238.89 1.08 6.89
Water, Bottled 0 0 18.96
Banana 422.44 0.18 1.18
2,704.07 6.9 1,526.42 DA Plus 10 Page: 21
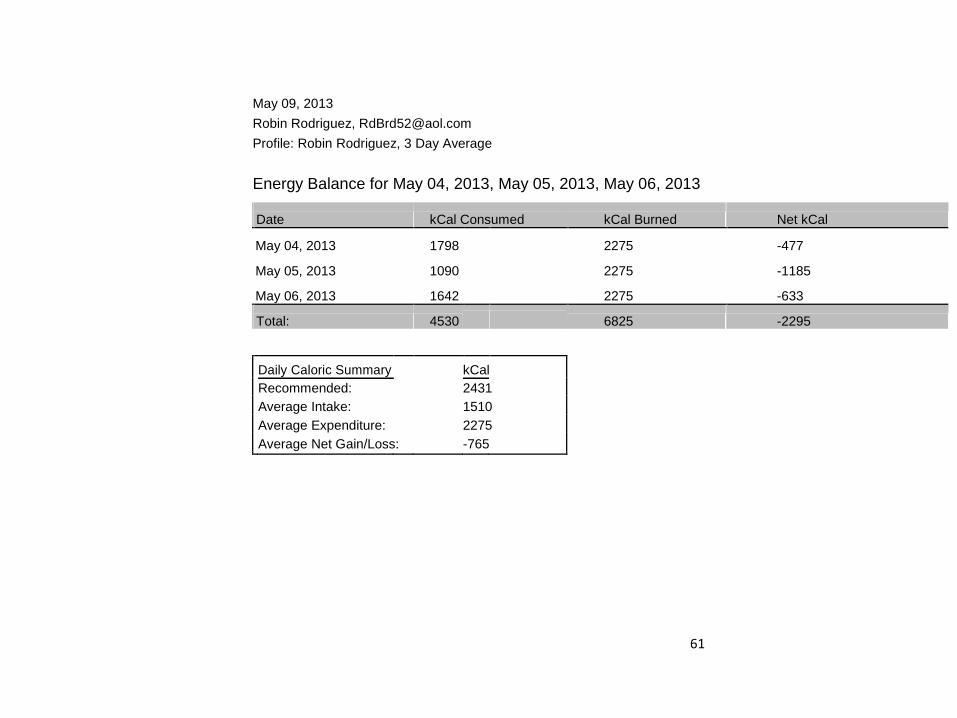
61
May 09, 2013 Robin Rodriguez, [email protected] Profile: Robin Rodriguez, 3 Day Average
Energy Balance for May 04, 2013, May 05, 2013, May 06, 2013
Date kCal Consumed kCal Burned Net kCal
May 04, 2013 1798 2275 -477
May 05, 2013 1090 2275 -1185
May 06, 2013 1642 2275 -633
Total: 4530 6825 -2295
Daily Caloric Summary kCal
Recommended: 2431
Average Intake: 1510
Average Expenditure: 2275
Average Net Gain/Loss: -765
62
Appendix 2
Farm to Table PPT
RobinRodriguez
May 30 , 2013
Nutrition 25: Wednesday 7-10:10
Professor Betty Crocker
x Spinach

63
Creating the wellness book has taught me:
• The importance of consuming as many whole foods in a diet as possible
• Everything that I consume must beneficial to maintaining a healthy diet
• The necessity of being aware of what I am putting into my body
• It is not about the caloric intake but more so of the nutritional value
• And above all else …………………DRINK WATER ….
Chew your calories do not drink them.

64
A new outlook for me..
My wellness future
• Consume more whole foods • Take advantage of all available
resources to maintaining a healthy streak by shopping at local farmer’s markets, trying new recipes, and cooking at home with my family as a way to include everyone around me in this
journey • Including more fish in my diet • Aiming towards reaching a higher
level nutritional content all around in my diet
• Consuming less sugary juices and
sodas, and replacing it with WATER • Stop making excuses and start
setting aside time for myself to exercise.
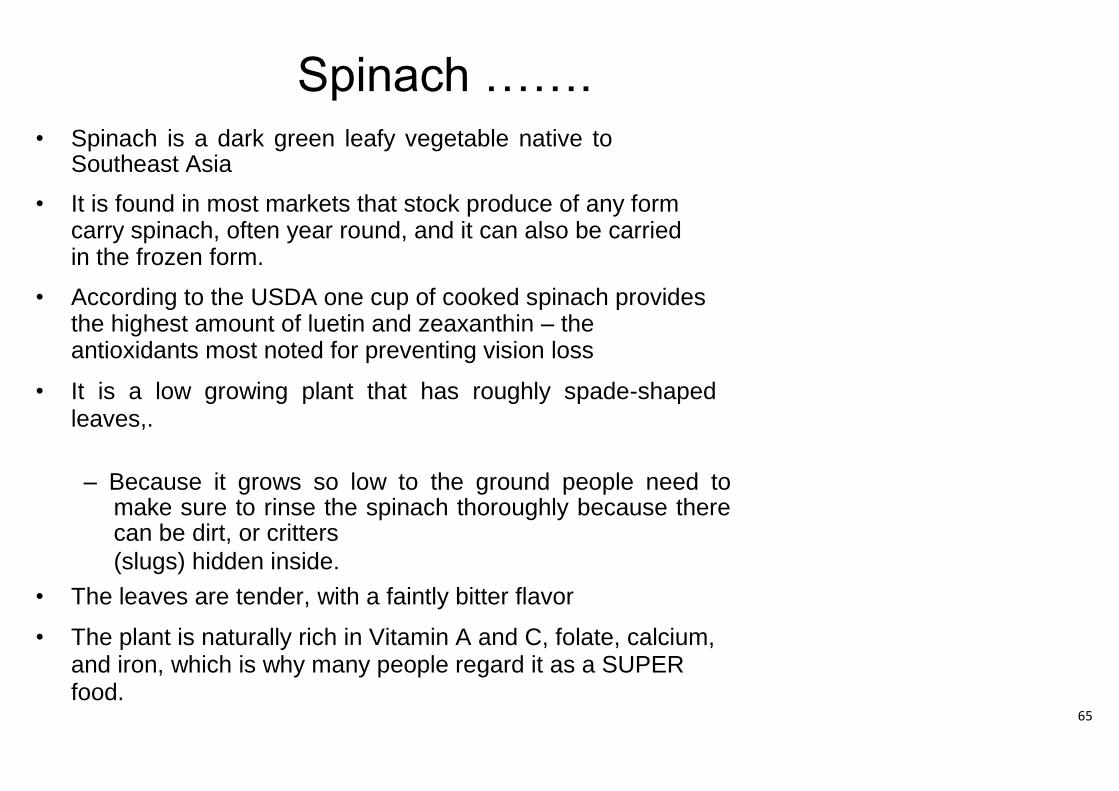
65
Spinach ……. • Spinach is a dark green leafy vegetable native to
Southeast Asia • It is found in most markets that stock produce of any form
carry spinach, often year round, and it can also be carried in the frozen form.
• According to the USDA one cup of cooked spinach provides
the highest amount of luetin and zeaxanthin – the antioxidants most noted for preventing vision loss
• It is a low growing plant that has roughly spade-shaped
leaves,.
– Because it grows so low to the ground people need to make sure to rinse the spinach thoroughly because there can be dirt, or critters (slugs) hidden inside.
• The leaves are tender, with a faintly bitter flavor • The plant is naturally rich in Vitamin A and C, folate, calcium,
and iron, which is why many people regard it as a SUPER food.
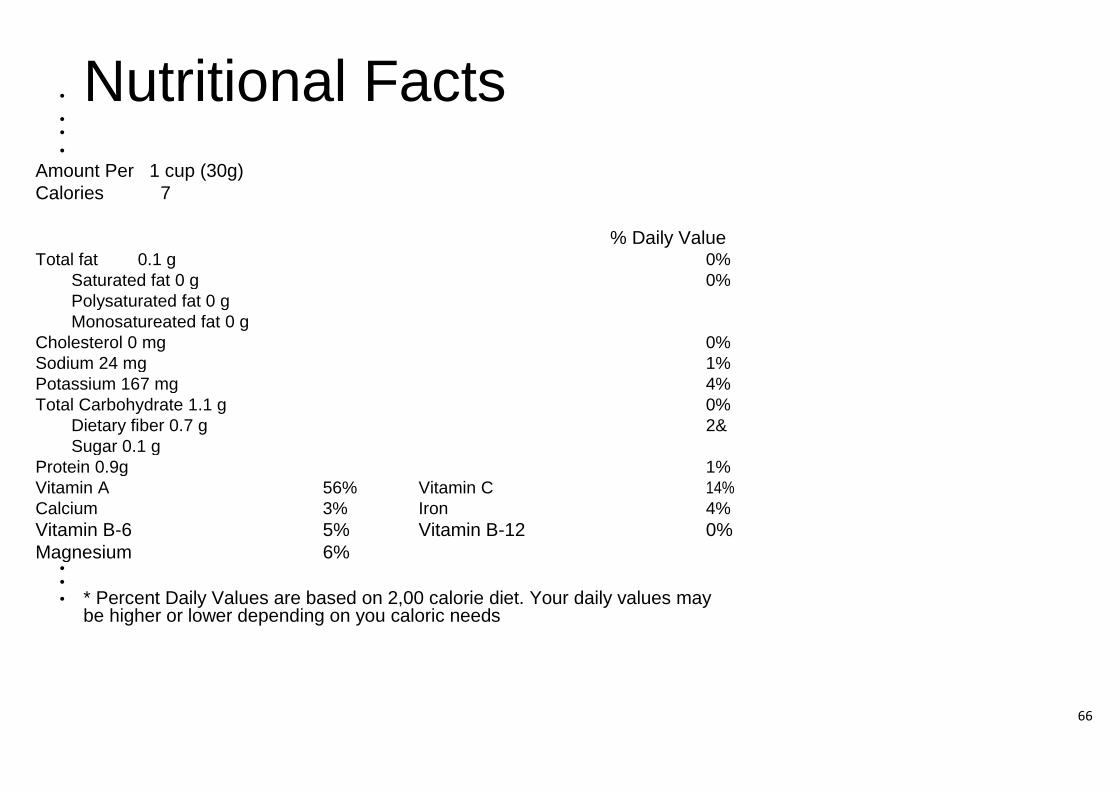
66
• Nutritional Facts
• •
•
Amount Per 1 cup (30g)
Calories 7
% Daily Value
Total fat 0.1 g 0%
Saturated fat 0 g 0%
Polysaturated fat 0 g
Monosatureated fat 0 g
Cholesterol 0 mg 0%
Sodium 24 mg 1%
Potassium 167 mg 4%
Total Carbohydrate 1.1 g 0%
Dietary fiber 0.7 g 2&
Sugar 0.1 g
Protein 0.9g 1%
Vitamin A 56% Vitamin C 14%
Calcium 3% Iron 4%
Vitamin B-6 5% Vitamin B-12 0%
Magnesium 6% • • • * Percent Daily Values are based on 2,00 calorie diet. Your daily values may
be higher or lower depending on you caloric needs

67
Did you know???
• It is wiser to choose tender baby spinach leaves. The larger the leaves, the more mature they are and more likely to be tough or stringy
• Spinach leaves that are placed under direct light in the stores have
been found to contain more nutrients than those stored in darkness • Cooking spinach actually increases it health benefits. Just half a cup
of cooked spinach will give you thrice as much nutrition as one cup of raw spinach.
• Spinach is beneficial to the eyes and building bones. It is also good
for digestion, Spinach eases constipation and protects the mucus lining of the stomach, so that you stay free of ulcers. It also flushes out toxins from the colon.
• The bounty of vitamins and minerals in spinach can bring quick relief
to dry, itchy skin and lavish you with a radiant complexion
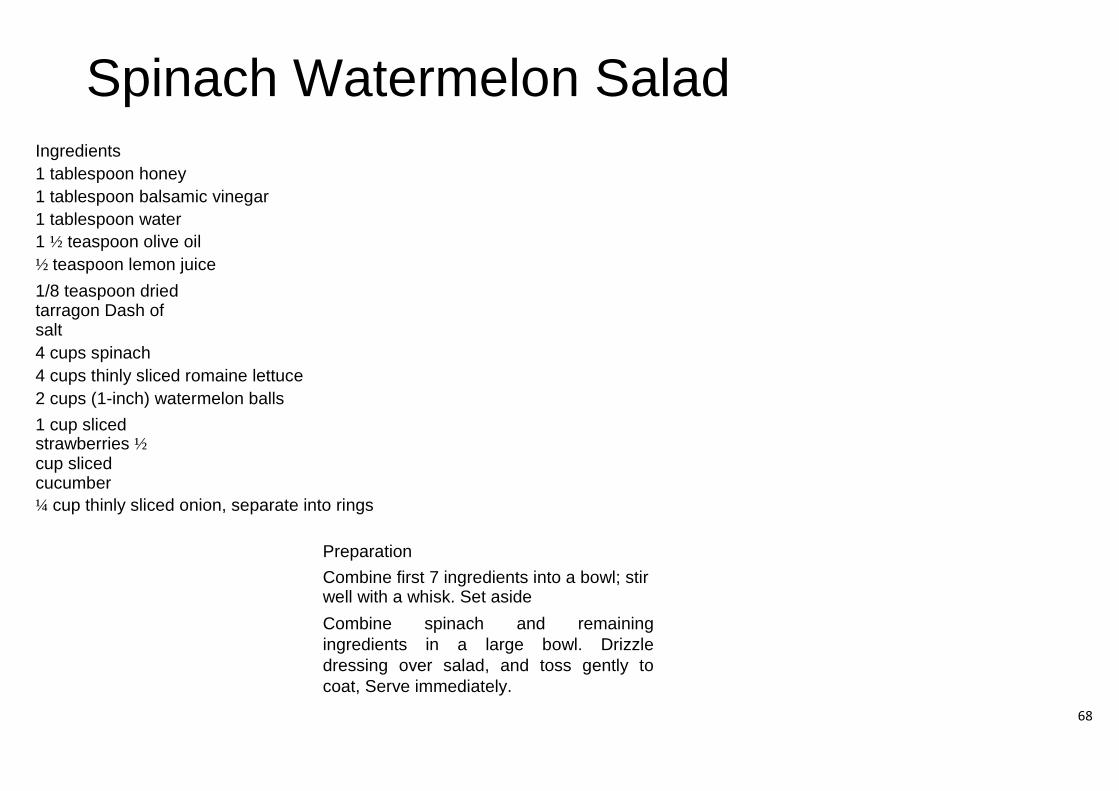
68
Spinach Watermelon Salad
Ingredients 1 tablespoon honey 1 tablespoon balsamic vinegar 1 tablespoon water 1 ½ teaspoon olive oil ½ teaspoon lemon juice 1/8 teaspoon dried tarragon Dash of salt 4 cups spinach 4 cups thinly sliced romaine lettuce 2 cups (1-inch) watermelon balls 1 cup sliced strawberries ½
cup sliced cucumber ¼ cup thinly sliced onion, separate into rings
Preparation
Combine first 7 ingredients into a bowl; stir well with a whisk. Set aside
Combine spinach and remaining
ingredients in a large bowl. Drizzle
dressing over salad, and toss gently to
coat, Serve immediately.
69
References
• http://www.myrecipes.com/recipe/spinach-and-watermelon- salad-10000000226279/
•
http://nutritiondata.self.com/facts/vegetables-and- vegetable-products/2626/2
• http://www.care2.com/greenliving/8-surprising-
health-facts- about-spinach.html
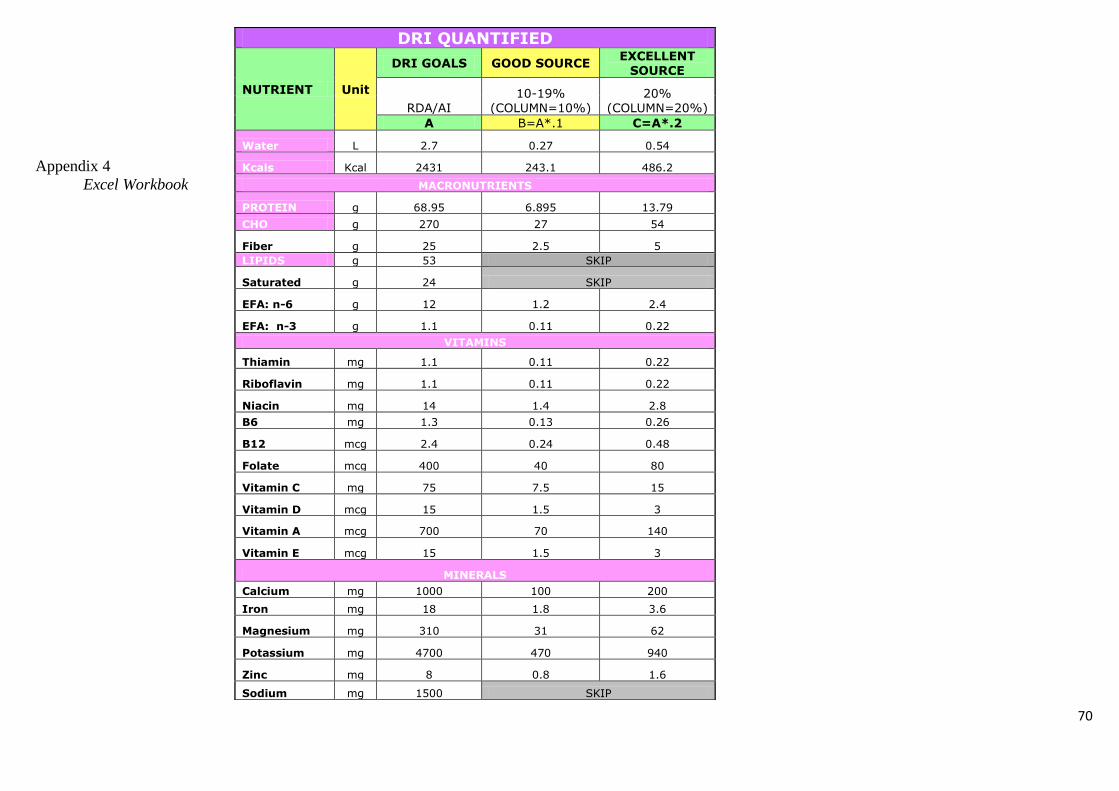
70
Appendix 4
Excel Workbook
DRI QUANTIFIED
NUTRIENT Unit
DRI GOALS GOOD SOURCE EXCELLENT
SOURCE
RDA/AI 10-19%
(COLUMN=10%) 20%
(COLUMN=20%)
A B=A*.1 C=A*.2
Water L 2.7 0.27 0.54
Kcals Kcal 2431 243.1 486.2
MACRONUTRIENTS
PROTEIN g 68.95 6.895 13.79
CHO g 270 27 54
Fiber g 25 2.5 5
LIPIDS g 53 SKIP
Saturated g 24 SKIP
EFA: n-6 g 12 1.2 2.4
EFA: n-3 g 1.1 0.11 0.22
VITAMINS
Thiamin mg 1.1 0.11 0.22
Riboflavin mg 1.1 0.11 0.22
Niacin mg 14 1.4 2.8
B6 mg 1.3 0.13 0.26
B12 mcg 2.4 0.24 0.48
Folate mcg 400 40 80
Vitamin C mg 75 7.5 15
Vitamin D mcg 15 1.5 3
Vitamin A mcg 700 70 140
Vitamin E mcg 15 1.5 3
MINERALS
Calcium mg 1000 100 200
Iron mg 18 1.8 3.6
Magnesium mg 310 31 62
Potassium mg 4700 470 940
Zinc mg 8 0.8 1.6
Sodium mg 1500 SKIP

71
DRI GOALS vs. 3-DAY DIET RECORD
NUTRIENT UNIT
DRI GOALS WB1 3-day Analysis
RDA/AI UL Intake
Intake vs. Goal
(%)
Deficient <80%
Excess >120%
Water L 2.7 0 1.42 53%
Kcals Kcals 2431 0 1663.9 68%
MACRONUTRIENTS
PROTEIN g 68.95 0 76.55 111%
CHO g 270 0 223.94 83%
Fiber g 50 0 23.85 48%
LIPIDS g 53 0 56.73 107%
Saturated g 24 0 15.59 65%
EFA: n-6 g 12 0 8.04 67%
EFA: n-3 g 1.1 0 0.83 75%
VITAMINS
Thiamin mg 1.1 0 1.47 134%
Riboflavin mg 1.1 0 1.83 166%
Niacin mg 14 35 21.83 156%
B6 mg 1.3 100 2.52 194%
B12 mcg 2.4 0 4.85 202%
Folate mcg 400 1000 655.55 164%
Vitamin C mg 75 2000 547.02 729%
Vitamin D mcg 15 50 3.98 27%
Vitamin A mcg 700 3000 957.12 137%
Vitamin E mcg 15 1000 10.74 72%
MINERALS
Calcium mg 1000 2500 807.27 81%
Iron mg 18 45 11.67 65%
Magnesium mg 310 350 404.69 131%
Potassium mg 4700 0 4287.74 91%
Zinc mg 8 0 11.91 149%
Sodium mg 1500 0 2614 174%
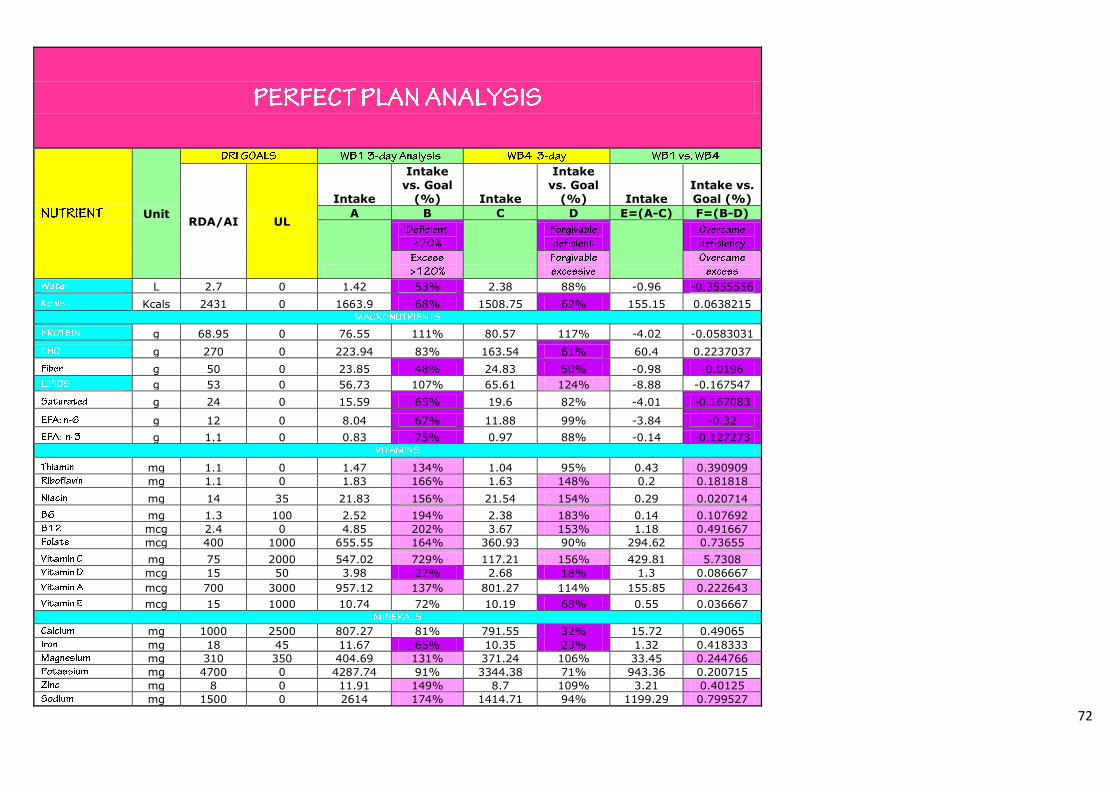
72
Unit RDA/AI UL
Intake
Intake vs. Goal
(%) Intake
Intake vs. Goal
(%) Intake Intake vs. Goal (%)
A B C D E=(A-C) F=(B-D)
L 2.7 0 1.42 53% 2.38 88% -0.96 -0.3555556
Kcals 2431 0 1663.9 68% 1508.75 62% 155.15 0.0638215
g 68.95 0 76.55 111% 80.57 117% -4.02 -0.0583031
g 270 0 223.94 83% 163.54 61% 60.4 0.2237037
g 50 0 23.85 48% 24.83 50% -0.98 -0.0196
g 53 0 56.73 107% 65.61 124% -8.88 -0.167547
g 24 0 15.59 65% 19.6 82% -4.01 -0.167083
g 12 0 8.04 67% 11.88 99% -3.84 -0.32
g 1.1 0 0.83 75% 0.97 88% -0.14 -0.127273
mg 1.1 0 1.47 134% 1.04 95% 0.43 0.390909
mg 1.1 0 1.83 166% 1.63 148% 0.2 0.181818
mg 14 35 21.83 156% 21.54 154% 0.29 0.020714
mg 1.3 100 2.52 194% 2.38 183% 0.14 0.107692
mcg 2.4 0 4.85 202% 3.67 153% 1.18 0.491667
mcg 400 1000 655.55 164% 360.93 90% 294.62 0.73655
mg 75 2000 547.02 729% 117.21 156% 429.81 5.7308
mcg 15 50 3.98 27% 2.68 18% 1.3 0.086667
mcg 700 3000 957.12 137% 801.27 114% 155.85 0.222643
mcg 15 1000 10.74 72% 10.19 68% 0.55 0.036667
mg 1000 2500 807.27 81% 791.55 32% 15.72 0.49065
mg 18 45 11.67 65% 10.35 23% 1.32 0.418333
mg 310 350 404.69 131% 371.24 106% 33.45 0.244766
mg 4700 0 4287.74 91% 3344.38 71% 943.36 0.200715
mg 8 0 11.91 149% 8.7 109% 3.21 0.40125
mg 1500 0 2614 174% 1414.71 94% 1199.29 0.799527
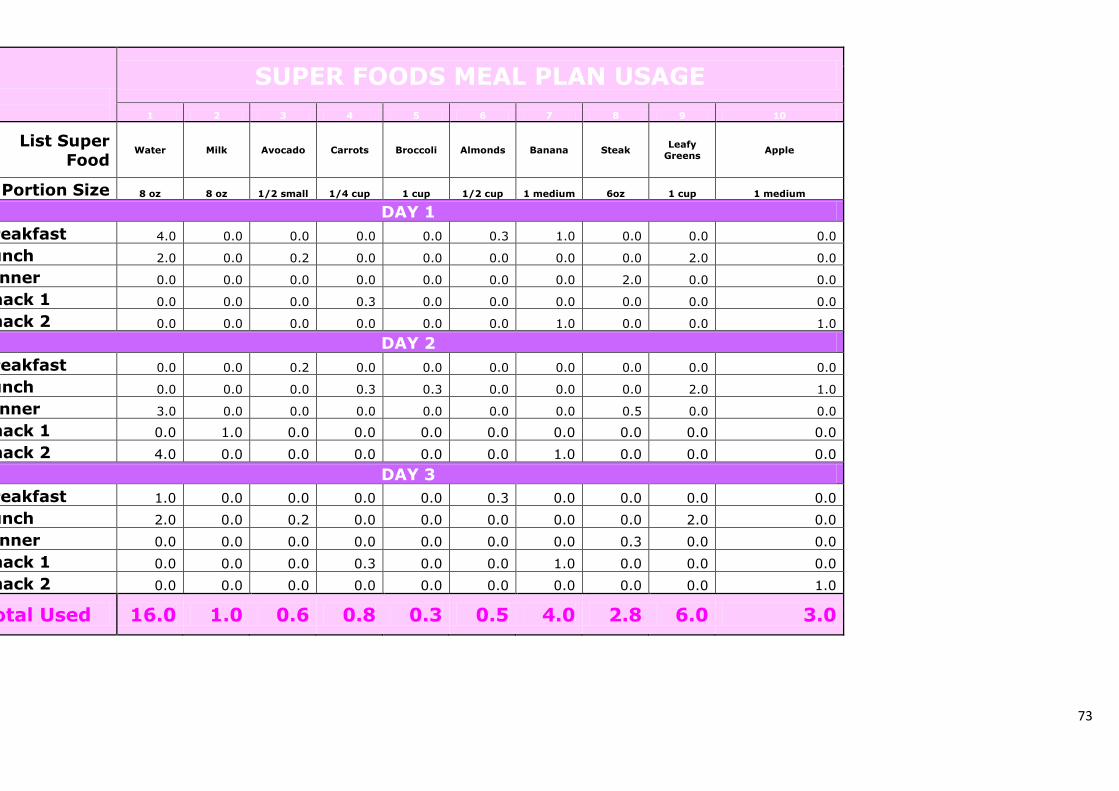
73
SUPER FOODS MEAL PLAN USAGE
1 2 3 4 5 6 7 8 9 10
List Super Food
Water Milk Avocado Carrots Broccoli Almonds Banana Steak Leafy
Greens Apple
Portion Size 8 oz 8 oz 1/2 small 1/4 cup 1 cup 1/2 cup 1 medium 6oz 1 cup 1 medium
DAY 1
Breakfast 4.0 0.0 0.0 0.0 0.0 0.3 1.0 0.0 0.0 0.0
Lunch 2.0 0.0 0.2 0.0 0.0 0.0 0.0 0.0 2.0 0.0
Dinner 0.0 0.0 0.0 0.0 0.0 0.0 0.0 2.0 0.0 0.0
Snack 1 0.0 0.0 0.0 0.3 0.0 0.0 0.0 0.0 0.0 0.0
Snack 2 0.0 0.0 0.0 0.0 0.0 0.0 1.0 0.0 0.0 1.0
DAY 2
Breakfast 0.0 0.0 0.2 0.0 0.0 0.0 0.0 0.0 0.0 0.0
Lunch 0.0 0.0 0.0 0.3 0.3 0.0 0.0 0.0 2.0 1.0
Dinner 3.0 0.0 0.0 0.0 0.0 0.0 0.0 0.5 0.0 0.0
Snack 1 0.0 1.0 0.0 0.0 0.0 0.0 0.0 0.0 0.0 0.0
Snack 2 4.0 0.0 0.0 0.0 0.0 0.0 1.0 0.0 0.0 0.0
DAY 3
Breakfast 1.0 0.0 0.0 0.0 0.0 0.3 0.0 0.0 0.0 0.0
Lunch 2.0 0.0 0.2 0.0 0.0 0.0 0.0 0.0 2.0 0.0
Dinner 0.0 0.0 0.0 0.0 0.0 0.0 0.0 0.3 0.0 0.0
Snack 1 0.0 0.0 0.0 0.3 0.0 0.0 1.0 0.0 0.0 0.0
Snack 2 0.0 0.0 0.0 0.0 0.0 0.0 0.0 0.0 0.0 1.0
Total Used 16.0 1.0 0.6 0.8 0.3 0.5 4.0 2.8 6.0 3.0

74
SUPER FOODS NUTRITION PROFILE
25 2 3 4 5 6 7 8 9 10
List Super Food Water Milk Avocado Carrots Broccoli Almonds Banana Steak Leafy
Greens Apple
Portion Size 8 oz 8 oz
1/2
small
1/4
cup 1 cup 1/2 cup
1
medium 6oz 1 cup
1
medium
NUTRIENT Unit
QUANTITY
Good Excellent
Water L 0.27 0.54 237 244 29.41 30.5 91 72.5 118 170.1 41.25 182
Kcals Skip 0 102.48 49.11 12.51 30.94 427.75 105.02 391 7.46 94.64
MACRONUTRIENTS
PROTEIN g 6.895 0 0 8.22 0.58 0.28 2.57 15.52 1.29 57.2 0.61 0.47
CHO g 27 0 0 12.18 2.54 2.92 6.04 13.54 26.95 0 1.37 25.13
Fiber g 2.5 0 0 0 2 0.85 2.37 7.18 3.07 4.74 0.69 4.37
LIPIDS Skip 0 2.37 4.53 0.07 0.34 38.08 0.39 16.24 0.11 0.31
Saturated Skip 0 1.54 0.63 0.01 0.04 2.87 0.13 5.26 0.02 0.05
EFA: n-6 g 1.2 2.4 0 0.07 0.49 0.04 0.02 8.96 0.05 0.04 0.03 0.08
EFA: n-3 g 0.11 0.22 0 0.01 0.04 0 0.02 0 0.03 0.04 0.02 0.02
VITAMINS
Thiamin mg 0.11 0.22 0 0.05 0.02 0.02 0.06 0.14 0.04 0.2 0.02 0.03
Riboflavin mg 0.11 0.22 0 0.45 0.04 0.02 0.11 0.52 0.09 0.5 0.03 0.05
Niacin mg 1.4 2.8 0 0.23 0.56 0.3 0.58 2.54 0.78 8.36 0.13 0.17
B6 mg 0.13 0.26 0 0.09 0.08 0.04 0.16 0.08 0.43 0.94 0.02 0.08
B12 mcg 0.24 0.48 0 1.15 0 0 0 0 0 5.98 0 0
Folate mcg 40 80 0 12.2 26.17 5.8 57.33 35.53 23.6 20.4 0 5.46
Vitamin C mg 7.5 15 0 0 2.59 1.8 81.17 0 10.27 0 3.46 8.37
Vitamin D mcg 1.5 3 0 2.93 0 0 0 0 0 0 0 0
Vitamin A mcg 70 140 0 141.52 2.06 60.06 28.21 0 3.54 0 25.56 5.46
MINERALS
Calcium mg 100 200 23.7 305 3.82 0.2 566.93 171.11 5.9 13.6 20.8 10.92
Iron mg 1.8 3.6 0 0.07 0.18 10.06 0.66 2.38 0.31 5.86 0.28 0.22
Magnesium mg 31 62 4.74 26.84 8.53 0.09 19.11 26.84 31.86 57.8 7.31 9.1
Potassium mg 470 940 0 366 149.11 97.6 287.56 477.77 422.44 829.6 123.24 194.74
Zinc mg 0.8 1.6 0 1.02 0.02 0.07 0.37 2.15 0.18 9.12 0.21 0.07
Sodium mg Skip 4.74 107.36 2.35 21.05 30.03 13.77 1.18 673.2 6.99 1.82
75
References
http://www.agmrc.org/commodities__products/vegetables/spinach-profile/
http://anrcatalog.ucdavis.edu/pdf/7212.pdf
http://www.webmd.com/food-recipes/food-poisoning/news/20130219/taylor-farms-spinach-recall
http://www.ncbi.nlm.nih.gov/pubmed/19857627

76