rod machado's private pilot ehandbook - simshack · pdf filerod machado’s private...
TRANSCRIPT

Learn everything you need for:The FAA private pilot exam
Biennial flight reviewsUpdating and refreshing your knowledge
A complete information manual by one of aviation’smost knowledgeable and experienced teachers
More than 1,100 original color illustrations and photos
Second Edition

Editors..................................................................R1, R2Aviation Speakers Bureau...........................................R2Product Information...............................................R3-R9Index....................................................................R10-R14Glossary..............................................................R15-R27Abbreviations...............................................................R28
Chapter One - Pages A1-10Airplane Components:Getting to KnowYour Airplane
1
5
12
11
9
10
8
13
14
17
16
15
7
6
4
3
2
Chapter Seventeen - Pages Q1-34Pilot Potpourri:Neat Aeronautical Information
Chapter Sixteen - Pages P1-20Weight and Balance:Let’s Wait and Balance
Chapter Fifteen - Pages O1-26Airplane Performance Charts:Know Before You Go
Chapter Fourteen - Pages N1-54Flight Planning:Getting There From Here
Chapter Thirteen - Pages M1-40Weather Charts and Briefings:PIREPS, Progs and METARS
Chapter Twelve - Pages L1-58Understanding Weather:Looking for Friendly Skies
Chapter Eleven - Pages K1-46Radio Navigation:The Frequency Flyer Program
Chapter Ten - Pages J1-16Aviation Maps: The Art of the Chart
Chapter Nine - Pages I1-36Airspace: The Wild Blue,Green and Red Yonder
Chapter Eight - Pages H1-22Radio Operations:Aviation Spoken Here
Chapter Seven - Pages G1-30Airport Operations:No Doctor Needed
Chapter Six - Pages F1-52Federal Aviation Regulations:How FAR Can We Go?
Chapter Five - Pages E1-42Flight Instruments:Clocks, Tops and Toys
Chapter Four - Pages D1-16Electrical Systems:Knowing What’s Watt
Chapter Three - Pages C1-38Engines:Knowledge of EnginesIs Power
Chapter Two - Pages B1-46Aerodynamics:The Wing is the Thing
Acknowledgments.......................................................ivForeword.......................................................................vDedication....................................................................viAbout the Author......................................................viiPrevious Cover.....................................................viiiIntroduction.................................................................ix
Table of Contents iii
ward acting forces. (If you’re havingtrouble with vectors, see the accomp-anying sidebar at the bottom of page B3.)
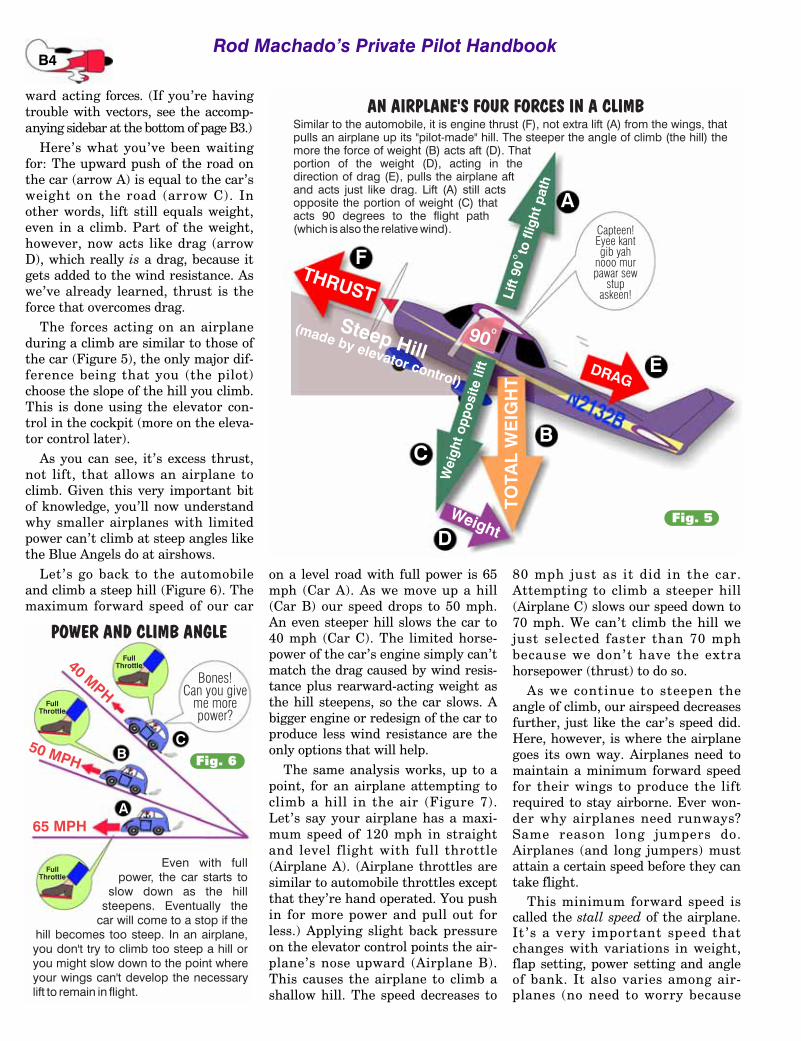
Here’s what you’ve been waitingfor: The upward push of the road onthe car (arrow A) is equal to the car’sweight on the road (arrow C). Inother words, lift still equals weight,even in a climb. Part of the weight,however, now acts like drag (arrowD), which really is a drag, because itgets added to the wind resistance. Aswe’ve already learned, thrust is theforce that overcomes drag.
The forces acting on an airplaneduring a climb are similar to those ofthe car (Figure 5), the only major dif-ference being that you (the pilot)choose the slope of the hill you climb.This is done using the elevator con-trol in the cockpit (more on the eleva-tor control later).
As you can see, it’s excess thrust,not lift, that allows an airplane toclimb. Given this very important bitof knowledge, you’ll now understandwhy smaller airplanes with limitedpower can’t climb at steep angles likethe Blue Angels do at airshows.
Let’s go back to the automobileand climb a steep hill (Figure 6). Themaximum forward speed of our car
on a level road with full power is 65mph (Car A). As we move up a hill(Car B) our speed drops to 50 mph.An even steeper hill slows the car to40 mph (Car C). The limited horse-power of the car’s engine simply can’tmatch the drag caused by wind resis-tance plus rearward-acting weight asthe hill steepens, so the car slows. Abigger engine or redesign of the car toproduce less wind resistance are theonly options that will help.
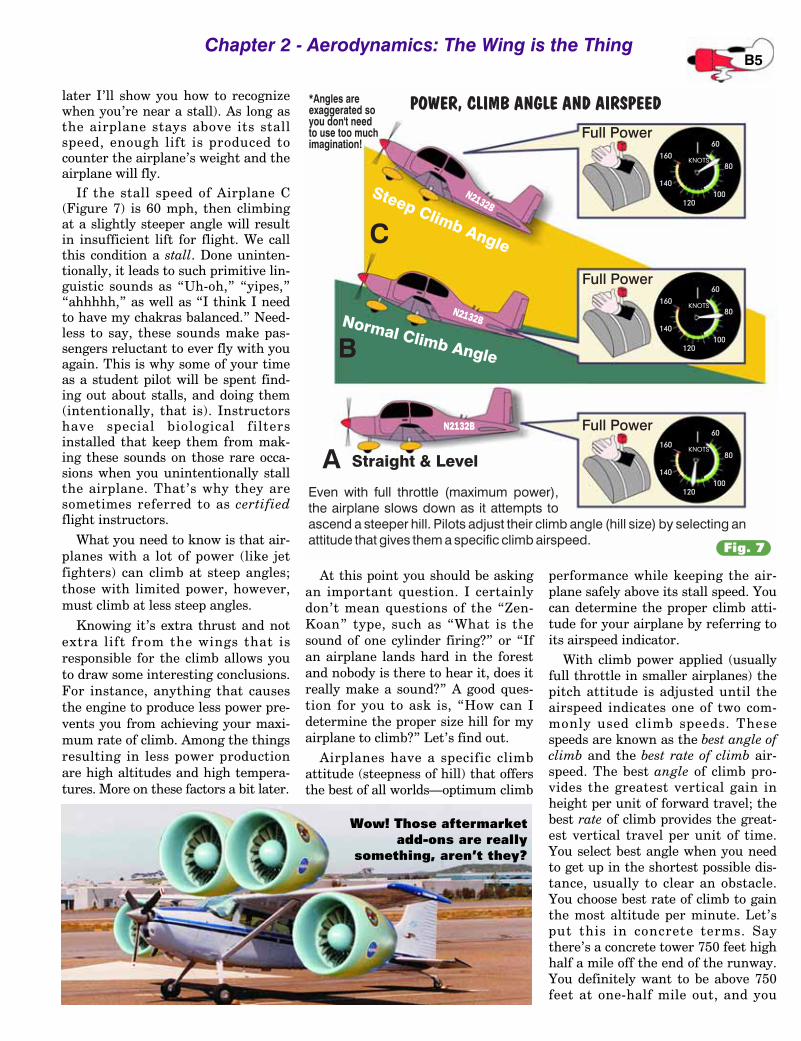
The same analysis works, up to apoint, for an airplane attempting toclimb a hill in the air (Figure 7).Let’s say your airplane has a maxi-mum speed of 120 mph in straightand level flight with full throttle(Airplane A). (Airplane throttles aresimilar to automobile throttles exceptthat they’re hand operated. You pushin for more power and pull out forless.) Applying slight back pressureon the elevator control points the air-plane’s nose upward (Airplane B).This causes the airplane to climb ashallow hill. The speed decreases to
80 mph just as it did in the car.Attempting to climb a steeper hill(Airplane C) slows our speed down to70 mph. We can’t climb the hill wejust selected faster than 70 mphbecause we don’t have the extrahorsepower (thrust) to do so.
As we continue to steepen theangle of climb, our airspeed decreasesfurther, just like the car’s speed did.Here, however, is where the airplanegoes its own way. Airplanes need tomaintain a minimum forward speedfor their wings to produce the liftrequired to stay airborne. Ever won-der why airplanes need runways?Same reason long jumpers do.Airplanes (and long jumpers) mustattain a certain speed before they cantake flight.
This minimum forward speed iscalled the stall speed of the airplane.It’s a very important speed thatchanges with variations in weight,flap setting, power setting and angleof bank. It also varies among air-planes (no need to worry because
AN AIRPLANE'S FOUR FORCES IN A CLIMB
Capteen!Eyee kantgib yah
nooo murpawar sew
stupaskeen!
Similar to the automobile, it is engine thrust (F), not extra lift (A) from the wings, thatpulls an airplane up its "pilot-made" hill. The steeper the angle of climb (the hill) themore the force of weight (B) acts aft (D). Thatportion of the weight (D), acting in thedirection of drag (E), pulls the airplane aftand acts just like drag. Lift (A) still actsopposite the portion of weight (C) thatacts 90 degrees to the flight path(which is also the relative wind).
A
E
F
BC
DTO
TAL
WE
IGH
T
THRUST
DRAG
Wei
ght o
ppos
itelif
t
Weight
Lift
90to
fligh
t pat
h
o
90 oSteep Hill(made by elevator control)
POWER AND CLIMB ANGLE
Even with fullpower, the car starts to
slow down as the hillsteepens. Eventually the
car will come to a stop if thehill becomes too steep. In an airplane,you don't try to climb too steep a hill oryou might slow down to the point whereyour wings can't develop the necessarylift to remain in flight.
40 MPH
65 MPH
FullThrottle
FullThrottle
FullThrottle
50 MPH
Bones!Can you give
me morepower?
A
BC
Fig. 6
Fig. 5
Rod Machado’s Private Pilot HandbookB4
later I’ll show you how to recognizewhen you’re near a stall). As long asthe airplane stays above its stallspeed, enough lift is produced tocounter the airplane’s weight and theairplane will fly.
If the stall speed of Airplane C(Figure 7) is 60 mph, then climbingat a slightly steeper angle will resultin insufficient lift for flight. We callthis condition a stall. Done uninten-tionally, it leads to such primitive lin-guistic sounds as “Uh-oh,” “yipes,”“ahhhhh,” as well as “I think I needto have my chakras balanced.” Need-less to say, these sounds make pas-sengers reluctant to ever fly with youagain. This is why some of your timeas a student pilot will be spent find-ing out about stalls, and doing them(intentionally, that is). Instructorshave special biological filtersinstalled that keep them from mak-ing these sounds on those rare occa-sions when you unintentionally stallthe airplane. That’s why they aresometimes referred to as certifiedflight instructors.
What you need to know is that air-planes with a lot of power (like jetfighters) can climb at steep angles;those with limited power, however,must climb at less steep angles.
Knowing it’s extra thrust and notextra lift from the wings that isresponsible for the climb allows youto draw some interesting conclusions.For instance, anything that causesthe engine to produce less power pre-vents you from achieving your maxi-mum rate of climb. Among the thingsresulting in less power productionare high altitudes and high tempera-tures. More on these factors a bit later.
At this point you should be askingan important question. I certainlydon’t mean questions of the “Zen-Koan” type, such as “What is thesound of one cylinder firing?” or “Ifan airplane lands hard in the forestand nobody is there to hear it, does itreally make a sound?” A good ques-tion for you to ask is, “How can Idetermine the proper size hill for myairplane to climb?” Let’s find out.
Airplanes have a specific climbattitude (steepness of hill) that offersthe best of all worlds—optimum climb
performance while keeping the air-plane safely above its stall speed. Youcan determine the proper climb atti-tude for your airplane by referring toits airspeed indicator.
With climb power applied (usuallyfull throttle in smaller airplanes) thepitch attitude is adjusted until theairspeed indicates one of two com-monly used climb speeds. Thesespeeds are known as the best angle ofclimb and the best rate of climb air-speed. The best angle of climb pro-vides the greatest vertical gain inheight per unit of forward travel; thebest rate of climb provides the great-est vertical travel per unit of time.You select best angle when you needto get up in the shortest possible dis-tance, usually to clear an obstacle.You choose best rate of climb to gainthe most altitude per minute. Let’sput this in concrete terms. Saythere’s a concrete tower 750 feet highhalf a mile off the end of the runway.You definitely want to be above 750feet at one-half mile out, and you
60
100
120
140
160
80KNOTS
Full Power
60
100
120
140
160
80KNOTS
Full Power
A
B
C
60
100
120
140
160
80
Full Power
Straight & Level
Normal Climb Angle
Steep Climb Angle
POWER, CLIMB ANGLE AND AIRSPEED
Even with full throttle (maximum power),the airplane slows down as it attempts toascend a steeper hill. Pilots adjust their climb angle (hill size) by selecting anattitude that gives them a specific climb airspeed.
*Angles areexaggerated soyou don't needto use too muchimagination!
KNOTS
Fig. 7
B5Chapter 2 - Aerodynamics: The Wing is the Thing
Wow! Those aftermarketadd-ons are really
something, aren’t they?
During a descent, your job is to maintain stablecylinder head temperatures (CHT) and oil temper-atures (i.e., keep their temperature indications inthe green). On some airplanes, gear extension oreven partial flap extension at high speeds can beused in lieu of large power reductions to start adescent (check your POH). While momentary powerreductions aren’t as harmful if the power isimmediately restored, large ones over longperiods can be damaging. Try planning yourdescents so engine temperatures changeslowly from their previous cruise values.
The PropellerPropellers come in all sizes and colors, but they
are of two basic types: fixed pitch and constantspeed. In an airplane with a fixed pitch prop, onelever—the throttle—controls both power and pro-peller blade RPM (revolutions per minute). In aconstant speed prop, there are separate con-trols for power and RPM.
When you start your flight training, you’llprobably fly an airplane with a fixed pitchpropeller. Fixed pitch propellers have theirpitch (angle of attack) fixed during the forg-ing process. The angle is set in stone (actu-ally, aluminum). This pitch can’t be changedexcept by replacing the propeller, which pret-ty much prevents you from changing the pro-peller’s pitch in flight. Fixed pitch props are notideal for any one thing, yet they’re in many waysbest for everything. They represent a compromise
between the bestangle of attack for climb and the best angle for cruise. They are simple to oper-ate, and easier (thus less expensive) to maintain.
On fixed pitch propeller airplanes, engine power and engine RPM are both con-trolled by the throttle. One lever does it all, power equals RPM, and that’s the end.
As you move up into higher performance airplanes, you’ll soon encounter con-stant speed (controllable pitch) propellers. Airplanes with these propellers usuallyhave both a throttle and a propeller control, so you manage engine power and
propeller RPM separately (Figure 45). On airplanes with constant speed propellers, movement of the throttle determines
the amount of fuel and air reaching the cylinders. Simply stated, the throttle deter-mines how much power the engine can develop. Movement of the propeller control
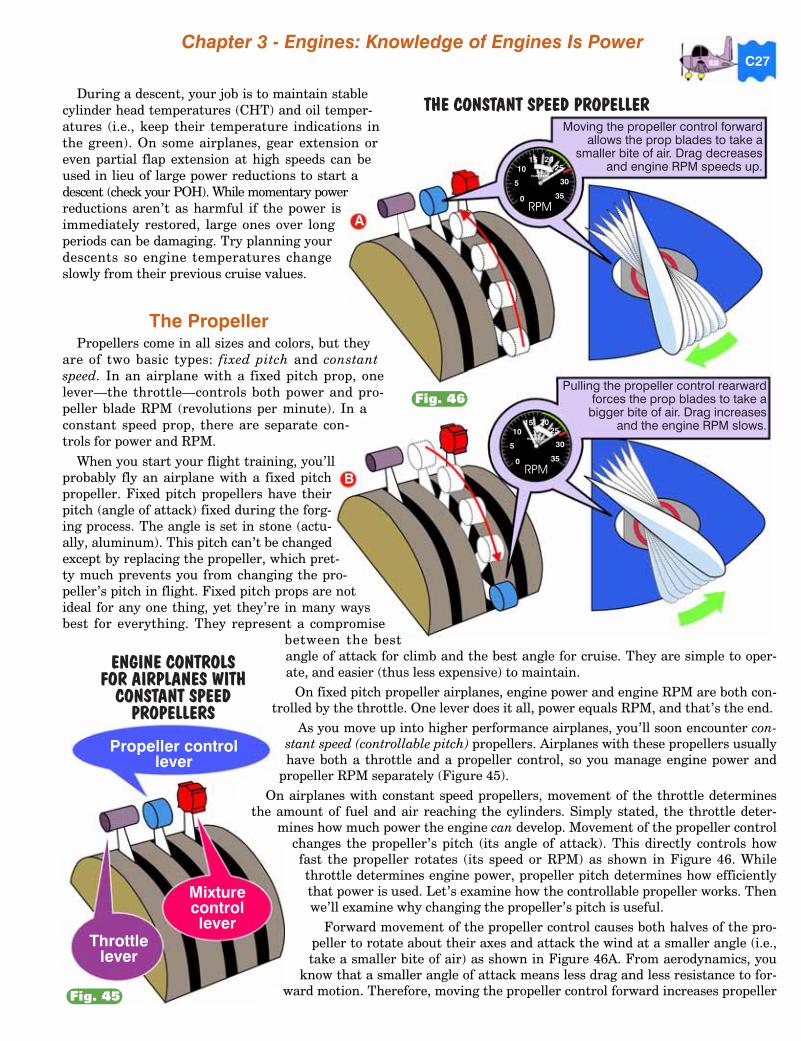
changes the propeller’s pitch (its angle of attack). This directly controls howfast the propeller rotates (its speed or RPM) as shown in Figure 46. Whilethrottle determines engine power, propeller pitch determines how efficientlythat power is used. Let’s examine how the controllable propeller works. Thenwe’ll examine why changing the propeller’s pitch is useful.
Forward movement of the propeller control causes both halves of the pro-peller to rotate about their axes and attack the wind at a smaller angle (i.e.,take a smaller bite of air) as shown in Figure 46A. From aerodynamics, you
know that a smaller angle of attack means less drag and less resistance to for-ward motion. Therefore, moving the propeller control forward increases propeller
Chapter 3 - Engines: Knowledge of Engines Is PowerC27
THE CONSTANT SPEED PROPELLER
Pulling the propeller control rearwardforces the prop blades to take a
bigger bite of air. Drag increasesand the engine RPM slows.
0
5
1015 20
25
30
35
RPMHUNDREDS
A
B
0
5
1015 20
25
30
35
RPMHUNDREDS
Moving the propeller control forwardallows the prop blades to take a
smaller bite of air. Drag decreasesand engine RPM speeds up.
RPM
RPM
Fig. 46
Propeller controllever
Throttlelever
Mixturecontrollever
ENGINE CONTROLSFOR AIRPLANES WITH
CONSTANT SPEEDPROPELLERS
Fig. 45
RPM. Pulling the propeller controlrearward causes the propeller toattack the wind at a larger angle ofattack (i.e., take a larger bite of air).Propeller drag increases and engineRPM slows, as shown in Figure 46B.
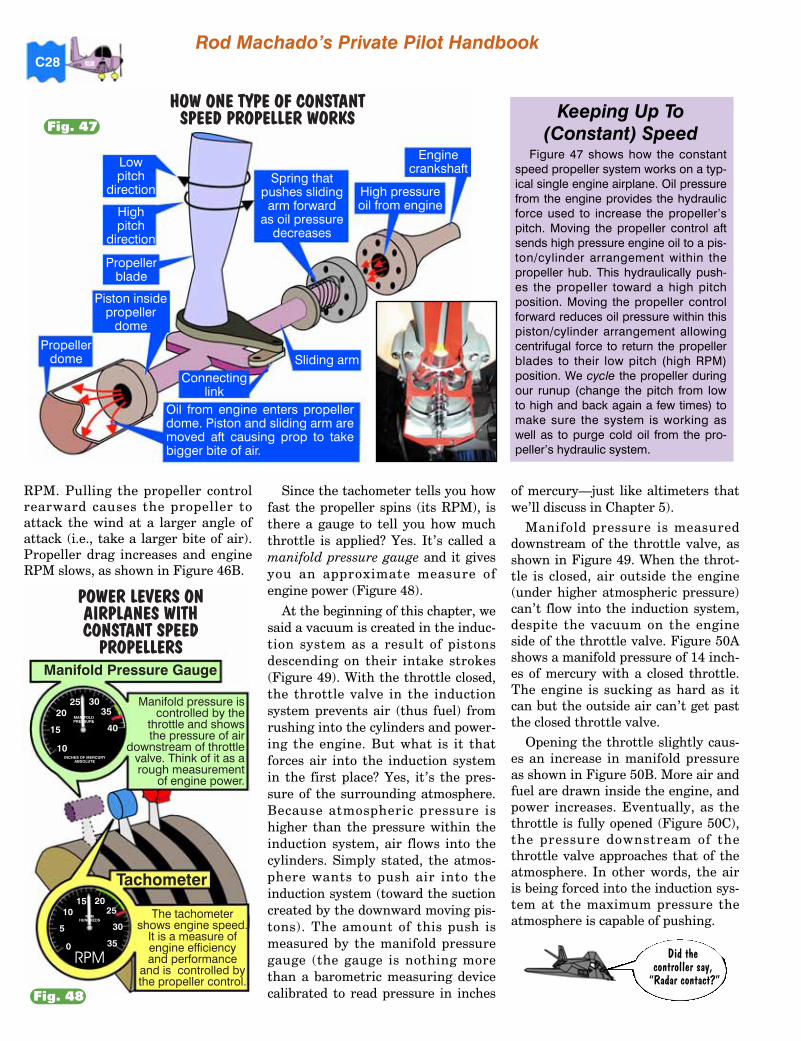
Since the tachometer tells you howfast the propeller spins (its RPM), isthere a gauge to tell you how muchthrottle is applied? Yes. It’s called amanifold pressure gauge and it givesyou an approximate measure ofengine power (Figure 48).
At the beginning of this chapter, wesaid a vacuum is created in the induc-tion system as a result of pistonsdescending on their intake strokes(Figure 49). With the throttle closed,the throttle valve in the inductionsystem prevents air (thus fuel) fromrushing into the cylinders and power-ing the engine. But what is it thatforces air into the induction systemin the first place? Yes, it’s the pres-sure of the surrounding atmosphere.Because atmospheric pressure ishigher than the pressure within theinduction system, air flows into thecylinders. Simply stated, the atmos-phere wants to push air into theinduction system (toward the suctioncreated by the downward moving pis-tons). The amount of this push ismeasured by the manifold pressuregauge (the gauge is nothing morethan a barometric measuring devicecalibrated to read pressure in inches
of mercury—just like altimeters thatwe’ll discuss in Chapter 5).
Manifold pressure is measureddownstream of the throttle valve, asshown in Figure 49. When the throt-tle is closed, air outside the engine(under higher atmospheric pressure)can’t flow into the induction system,despite the vacuum on the engineside of the throttle valve. Figure 50Ashows a manifold pressure of 14 inch-es of mercury with a closed throttle.The engine is sucking as hard as itcan but the outside air can’t get pastthe closed throttle valve.
Opening the throttle slightly caus-es an increase in manifold pressureas shown in Figure 50B. More air andfuel are drawn inside the engine, andpower increases. Eventually, as thethrottle is fully opened (Figure 50C),the pressure downstream of thethrottle valve approaches that of theatmosphere. In other words, the airis being forced into the induction sys-tem at the maximum pressure theatmosphere is capable of pushing.
Rod Machado’s Private Pilot HandbookC28
Propellerdome
Piston insidepropeller
dome
Oil from engine enters propellerdome. Piston and sliding arm aremoved aft causing prop to takebigger bite of air.
Propellerblade
High pressureoil from engine
Spring thatpushes slidingarm forward
as oil pressuredecreases
Sliding arm
Highpitch
direction
Lowpitch
direction
HOW ONE TYPE OF CONSTANTSPEED PROPELLER WORKS
Enginecrankshaft
Connectinglink
Keeping Up To(Constant) Speed
Figure 47 shows how the constantspeed propeller system works on a typ-ical single engine airplane. Oil pressurefrom the engine provides the hydraulicforce used to increase the propeller’spitch. Moving the propeller control aftsends high pressure engine oil to a pis-ton/cylinder arrangement within thepropeller hub. This hydraulically push-es the propeller toward a high pitchposition. Moving the propeller controlforward reduces oil pressure within thispiston/cylinder arrangement allowingcentrifugal force to return the propellerblades to their low pitch (high RPM)position. We cycle the propeller duringour runup (change the pitch from lowto high and back again a few times) tomake sure the system is working aswell as to purge cold oil from the pro-peller’s hydraulic system.
POWER LEVERS ONAIRPLANES WITHCONSTANT SPEED
PROPELLERS
0
5
1015 20
25
30
35
RPMHUNDREDS
10
15
2025 30
35
40MANIFOLDPRESSURE
INCHES OF MERCURYABSOLUTE
Manifold pressure iscontrolled by the
throttle and showsthe pressure of air
downstream of throttlevalve. Think of it as arough measurement
of engine power.
Manifold Pressure Gauge
The tachometershows engine speed.
It is a measure ofengine efficiencyand performance
and is controlled bythe propeller control.
Tachometer
RPM
Fig. 47
Fig. 48
Did thecontroller say,
“Radar contact?”

Under normal conditions, theengine’s manifold pressure can’t riseabove atmospheric pressure. Why?
The atmosphere can only push anamount equal to how much it weighs.At sea level, atmospheric pressure
weighs enough to push a column ofmercury 30 inches into a glass tubecontaining a vacuum (see Chapter 5for more details on barometric pres-sure). As a measurement of theatmosphere’s weight, we say that theoutside air pressure is 30 inches ofmercury. Therefore, the engine’smanifold pressure at full throttle is alittle less than 30 inches (it’s a littleless because of air friction and intakerestrictions within the induction sys-tem). Clearly, then, manifold pres-sures near 30 inches of mercury sig-nifies more power is being developedby the engine. On the other hand,low manifold pressures (say 15 inch-es or so) indicate less fuel and air isentering the cylinders and less poweris being produced.
As the airplane climbs, you’llnotice the manifold pressure decreas-es even though the throttle is fullyopened. Why? Atmospheric pressuredecreases as you ascend. It decreasesapproximately one inch of mercuryfor every thousand feet of altitudegain (and increases approximatelyone inch of mercury for every thou-sand feet of altitude loss). At sea levelyou can develop approximately 30inches of manifold pressure with fullthrottle. At 5,000 MSL, however,your manifold pressure will beapproximately 25 inches with full
Chapter 3 - Engines: Knowledge of Engines Is PowerC29
Atmospheric pressure forces airinto the induction system towardthe lower pressure in the cylinder.
AIR FLOWInductionsystem
Throttlevalve
HOW THE ENGINE DRAWS INAIR FOR COMBUSTION
As the piston moves downward, it creates a suction inthe cylinder similar to the plunger in a hypodermicneedle. Low pressure is created, which draws air inthrough the induction system.
10
15
2025 30
35
40MANIFOLDPRESSURE
INCHES OF MERCURYABSOLUTE
Manifold pressure ismeasured downstreamof the throttle valve. It's
nothing more than ameasure of air pressure
in inches of mercury.
Fig. 49
10
15
2025 30
35
40MANIFOLDPRESSURE
INCHES OF MERCURYABSOLUTE
Manifold pressure is measured downstream from the throttle valveand provides an approximate measure of engine power.
MANIFOLD PRESSURE
Airintake
Induction system Induction system
At partial power, a littlemore air flows into thecylinders. Therefore,the air pressure risesin the intake manifoldresulting in a rise ofmanifold pressure.
B
10
15
2025 30
35
40MANIFOLDPRESSURE
INCHES OF MERCURYABSOLUTE
Airintake
Induction system
When the throttle is fullyclosed, airflow into thecylinders is restricted. Verylittle airflow gets past thethrottle valve despite thepiston's enormous suction(low manifold pressure).
A
10
15
2025 30
35
40MANIFOLDPRESSURE
INCHES OF MERCURYABSOLUTE
Airintake
At full throttle in a non-turbocharged engine, aircan't be forced into theengine at greater thanatmospheric pressure(which is near 30 inchesof mercury).
C
Fig. 50

Welcome to Volts for Dolts, theMachado QuickCourse for thoseafraid of electricity.
Attention, class. This is going to beeasy.
Watt? Easy? Yes, because we’regoing to learn what electricity does,rather than split atoms over what itis.
Let’s be practical. You don’t know,and don’t much care, about the dif-ference between jewels and joules.You do want and need to know howto detect and direct electrons in yourairplane and put them to work foryou. You also need to know when theelectrical system is threatening toroll over and play dead, and what canbe done about it.
Read on. Fear not. Think volt, notbolt.
Electricity and WaterAlbert Einstein once said, “Make
everything as simple as possible, butnot simpler.” For instance, Einstein’sconcept of time distortion is oftendiscussed from a mathematical per-spective. For most of us, this is likelistening to a lecture delivered inMartian. Actually, Southern Martian.On the other hand, suppose someonesaid that the length of one minutedepends on which side of the bath-
room door you’re on. Now we’re com-municating.
Unfortunately, the philosophy ofsimplicity has not been applied tounderstanding the airplane’s electri-cal system—until now.
We’re going to approach this like aplumber, by thinking about electrici-ty as though it were water. This maybe the only chance you will ever haveto mix electricity and water safely, sopay attention.
A water model of electricity usesbasic plumbing language to explainhow electrons flow in a circuit. Theonly problem with the model is thatyou can’t use it to build a computer.
The model’s language isn’t preciseenough to describe the intricate elec-trical nuances necessary to accurate-ly convey the point (besides, whatwould you do if water suddenly shotout of your hard drive?). You can,however, use the water model todescribe—accurately enough to suitany normal private pilot—how anairplane’s electrical system works.
I caution you not to take thismodel literally, and if you actuallyare knowledgeable about things elec-trical, I also urge you not to takeoffense. The model is only used tohelp clarify certain cause and effectrelationships.
Page D1
A Simplified Approach for Those With Little or No Understanding of Electricity
IF YOU STUDY THE WATER THEORY OF ELECTRICITY...
... you need not worry
that stepping on the elec-
trical cord will cut off
the flow of juice to your
electrical equipment!Hey acornhead! Getoff thecord.
Chapter Four
Electrical SystemsKnowing What’s Watt

The Charge-DischargeAmmeter
Between the positive terminal ofthe battery and the primary bus isanother version of an ammeter foundon some airplanes (Figure 12).Ammeters of this variety are oftencalled charge-discharge ammeters.Figure 13 shows a charge-dischargeammeter. As the name implies, thecharge-discharge ammeter tells you ifelectrical current is flowing into orout of the battery. This directlyinforms you about your electrical sys-tem’s state of health. Whether youhave a load meter or a charge-dis-charge ammeter depends on the spe-cific make and model of your air-plane. Most airplanes have one or theother but seldom both.
Current flow from the primary businto the battery is indicated by a pos-itive needle deflection (Figure 14).Think of water (electrical current)pushing the needle toward the (+) or(-) side of the ammeter as it enters orleaves the battery. A positive deflec-tion usually implies that the batteryis being charged (water is movinginto the battery). A negative needledeflection indicates that the batteryis supplying the primary bus withelectrical current (water is movingout of the battery).
Normally, the needle should beresting near the zero or center mark.This implies that the battery is nei-ther being charged nor discharged (agood sign). Continuous needle deflec-tions too far from cen-
ter, however, are cause for concern.There are circumstances where theneedle will indicate a large deflectionfrom the center position for shortperiods.
Starter motors demand largeamounts of electrical current fortheir operation. After startup, thebattery is sure to be slightly drained.Expect to see a positive (+) needledeflection of five, maybe six or sevenneedle widths on the ammeter rightafter engine start. This means that
the alternator is replenishing batteryenergy consumed by the current-hungry starter. Expect a similarammeter indication if the radios were
D6
60
0
60
AMPERES
0 60
ALT
AMPERES
ALTCB
CB GYRO
GYRO
RADIOLIGHTS
RADIO
Electricalground
Electricalground
WATER ANALOGY OF ELECTRICITYLoad meter
Charge/dischargeammeter
RADIO
CIG
PANELLIGHTS
LANDLIGHT
NAVLIGHT
NAV
NAV
CB
CB
CB
CB
CB
CB
CB
CB
CB
CB
Pri
mar
y b
usA
vio
nics
bus
Avionicsmaster switch
Water pump(alternator)
Battery
60
0
60
AMPERES
POSITIVE (+)AMMETER
INDICATION
Batterybeing
charged
Water (current) flow
Charge/dischargeammeter
Battery
THE CHARGE/DISCHARGE
AMMETER
Fig. 13
Fig. 14
Fig. 12
A wise man says, “Man
who use tongue to test
airplane battery find
experience re-volting.”
Rod Machado’s Private Pilot Handbook
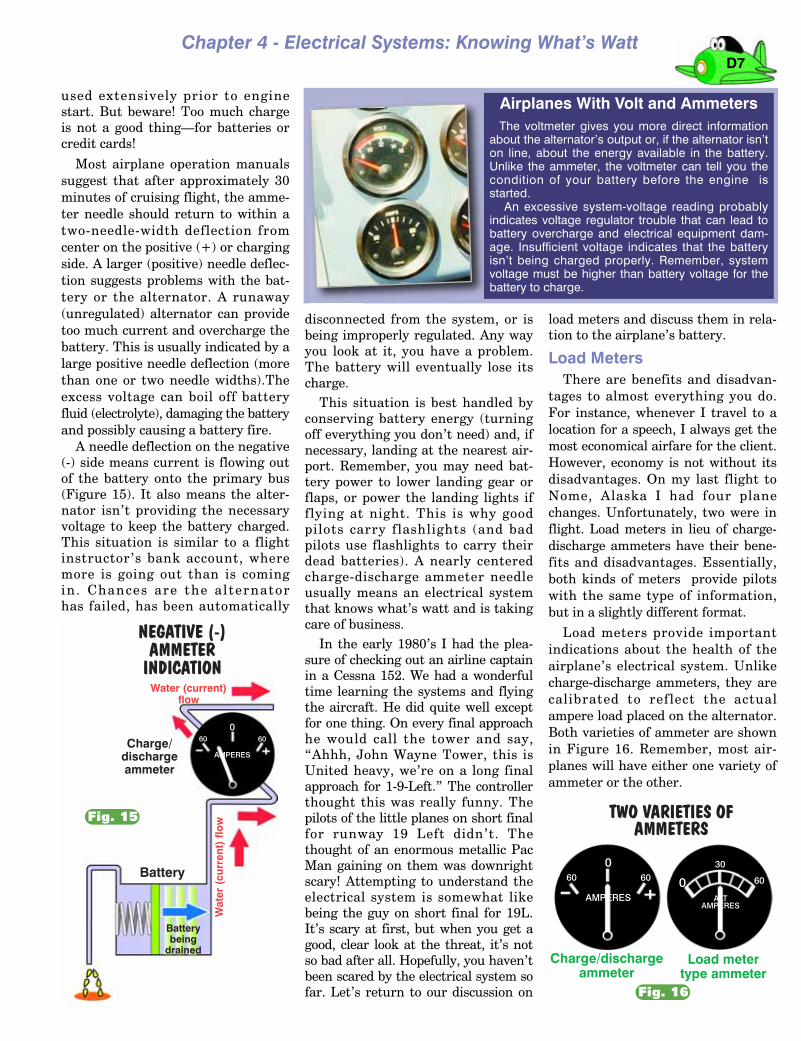
used extensively prior to enginestart. But beware! Too much chargeis not a good thing—for batteries orcredit cards!
Most airplane operation manualssuggest that after approximately 30minutes of cruising flight, the amme-ter needle should return to within atwo-needle-width deflection fromcenter on the positive (+) or chargingside. A larger (positive) needle deflec-tion suggests problems with the bat-tery or the alternator. A runaway(unregulated) alternator can providetoo much current and overcharge thebattery. This is usually indicated by alarge positive needle deflection (morethan one or two needle widths).Theexcess voltage can boil off batteryfluid (electrolyte), damaging the batteryand possibly causing a battery fire.
A needle deflection on the negative(-) side means current is flowing outof the battery onto the primary bus(Figure 15). It also means the alter-nator isn’t providing the necessaryvoltage to keep the battery charged.This situation is similar to a flightinstructor’s bank account, wheremore is going out than is comingin. Chances are the alternatorhas failed, has been automatically
disconnected from the system, or isbeing improperly regulated. Any wayyou look at it, you have a problem.The battery will eventually lose itscharge.
This situation is best handled byconserving battery energy (turningoff everything you don’t need) and, ifnecessary, landing at the nearest air-port. Remember, you may need bat-tery power to lower landing gear orflaps, or power the landing lights ifflying at night. This is why goodpilots carry flashlights (and badpilots use flashlights to carry theirdead batteries). A nearly centeredcharge-discharge ammeter needleusually means an electrical systemthat knows what’s watt and is takingcare of business.
In the early 1980’s I had the plea-sure of checking out an airline captainin a Cessna 152. We had a wonderfultime learning the systems and flyingthe aircraft. He did quite well exceptfor one thing. On every final approachhe would call the tower and say,“Ahhh, John Wayne Tower, this isUnited heavy, we’re on a long finalapproach for 1-9-Left.” The controllerthought this was really funny. Thepilots of the little planes on short finalfor runway 19 Left didn’t. Thethought of an enormous metallic PacMan gaining on them was downrightscary! Attempting to understand theelectrical system is somewhat likebeing the guy on short final for 19L.It’s scary at first, but when you get agood, clear look at the threat, it’s notso bad after all. Hopefully, you haven’tbeen scared by the electrical system sofar. Let’s return to our discussion on
load meters and discuss them in rela-tion to the airplane’s battery.
Load MetersThere are benefits and disadvan-
tages to almost everything you do.For instance, whenever I travel to alocation for a speech, I always get themost economical airfare for the client.However, economy is not without itsdisadvantages. On my last flight toNome, Alaska I had four planechanges. Unfortunately, two were inflight. Load meters in lieu of charge-discharge ammeters have their bene-fits and disadvantages. Essentially,both kinds of meters provide pilotswith the same type of information,but in a slightly different format.
Load meters provide importantindications about the health of theairplane’s electrical system. Unlikecharge-discharge ammeters, they arecalibrated to reflect the actualampere load placed on the alternator.Both varieties of ammeter are shownin Figure 16. Remember, most air-planes will have either one variety ofammeter or the other.
Chapter 4 - Electrical Systems: Knowing What’s WattD7
60
0
60
AMPERES
Batterybeing
drained
Wat
er (
curr
ent)
flo
w
NEGATIVE (-)AMMETER
INDICATIONWater (current)
flow
Charge/dischargeammeter
Battery60
0
60
AMPERES
0 60
30
ALT
AMPERES
TWO VARIETIES OFAMMETERS
Charge/dischargeammeter
Load metertype ammeter
Fig. 15
Fig. 16
Airplanes With Volt and AmmetersThe voltmeter gives you more direct information
about the alternator’s output or, if the alternator isn’ton line, about the energy available in the battery.Unlike the ammeter, the voltmeter can tell you thecondition of your battery before the engine isstarted.
An excessive system-voltage reading probablyindicates voltage regulator trouble that can lead tobattery overcharge and electrical equipment dam-age. Insufficient voltage indicates that the batteryisn’t being charged properly. Remember, systemvoltage must be higher than battery voltage for thebattery to charge.
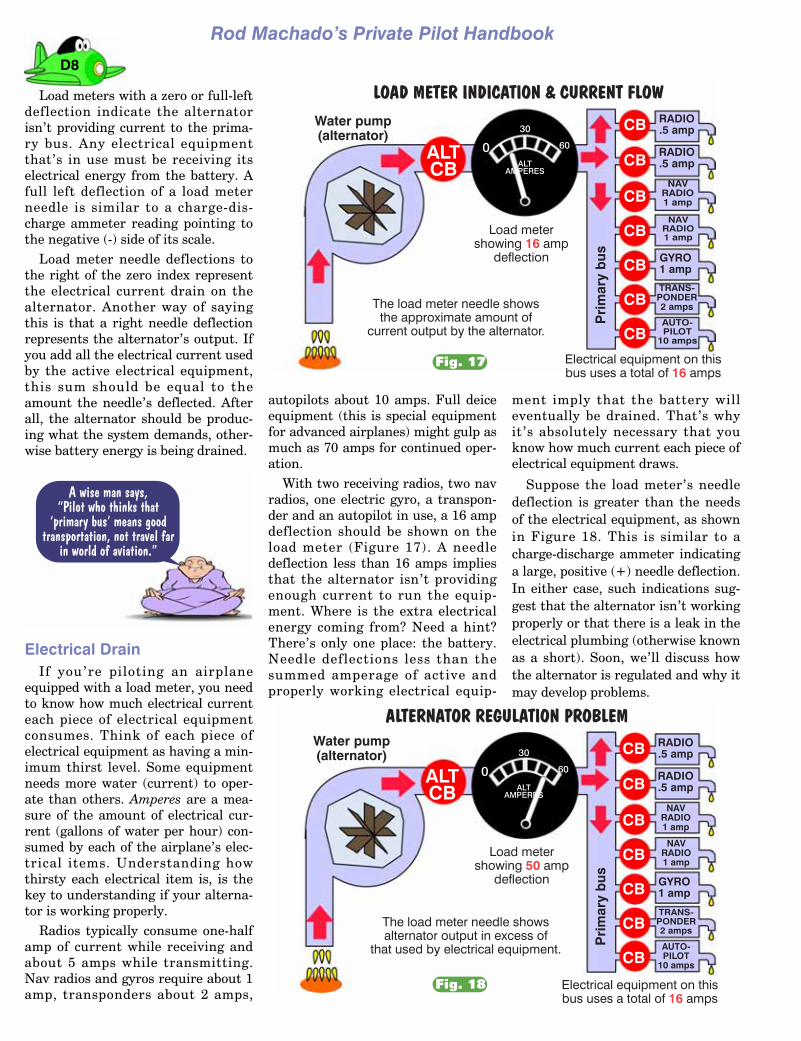
Load meters with a zero or full-leftdeflection indicate the alternatorisn’t providing current to the prima-ry bus. Any electrical equipmentthat’s in use must be receiving itselectrical energy from the battery. Afull left deflection of a load meterneedle is similar to a charge-dis-charge ammeter reading pointing tothe negative (-) side of its scale.
Load meter needle deflections tothe right of the zero index representthe electrical current drain on thealternator. Another way of sayingthis is that a right needle deflectionrepresents the alternator’s output. Ifyou add all the electrical current usedby the active electrical equipment,this sum should be equal to theamount the needle’s deflected. Afterall, the alternator should be produc-ing what the system demands, other-wise battery energy is being drained.
Electrical DrainIf you’re piloting an airplane
equipped with a load meter, you needto know how much electrical currenteach piece of electrical equipmentconsumes. Think of each piece ofelectrical equipment as having a min-imum thirst level. Some equipmentneeds more water (current) to oper-ate than others. Amperes are a mea-sure of the amount of electrical cur-rent (gallons of water per hour) con-sumed by each of the airplane’s elec-trical items. Understanding howthirsty each electrical item is, is thekey to understanding if your alterna-tor is working properly.
Radios typically consume one-halfamp of current while receiving andabout 5 amps while transmitting.Nav radios and gyros require about 1amp, transponders about 2 amps,
autopilots about 10 amps. Full deiceequipment (this is special equipmentfor advanced airplanes) might gulp asmuch as 70 amps for continued oper-ation.
With two receiving radios, two navradios, one electric gyro, a transpon-der and an autopilot in use, a 16 ampdeflection should be shown on theload meter (Figure 17). A needledeflection less than 16 amps impliesthat the alternator isn’t providingenough current to run the equip-ment. Where is the extra electricalenergy coming from? Need a hint?There’s only one place: the battery.Needle deflections less than thesummed amperage of active andproperly working electrical equip-
ment imply that the battery willeventually be drained. That’s whyit’s absolutely necessary that youknow how much current each piece ofelectrical equipment draws.
Suppose the load meter’s needledeflection is greater than the needsof the electrical equipment, as shownin Figure 18. This is similar to acharge-discharge ammeter indicatinga large, positive (+) needle deflection.In either case, such indications sug-gest that the alternator isn’t workingproperly or that there is a leak in theelectrical plumbing (otherwise knownas a short). Soon, we’ll discuss howthe alternator is regulated and why itmay develop problems.
D8
0 60
ALT
AMPERES
ALTCB
CB RADIO.5 amp
RADIO.5 amp
TRANS-PONDER2 amps
Load metershowing amp
deflection16
GYRO1 amp
NAVRADIO1 amp
NAVRADIO1 amp
AUTO-PILOT
10 amps
CB
CB
CB
CB
CB
CB
30
Pri
mar
y b
us
Water pump(alternator)
The load meter needle showsthe approximate amount of
current output by the alternator.
Electrical equipment on thisbus uses a total of amps16
LOAD METER INDICATION & CURRENT FLOW
0 60
ALT
AMPERES
ALTCB
CB RADIO.5 amp
RADIO.5 amp
TRANS-PONDER2 amps
Pri
mar
y b
us
ALTERNATOR REGULATION PROBLEM
GYRO1 amp
NAVRADIO1 amp
NAVRADIO1 amp
AUTO-PILOT
10 amps
CB
CB
CB
CB
CB
CB
30
Load metershowing amp
deflection50
Water pump(alternator)
The load meter needle showsalternator output in excess of
that used by electrical equipment.
Electrical equipment on thisbus uses a total of amps16
Fig. 18
Fig. 17
A wise man says,“Pilot who thinks that
‘primary bus’ means goodtransportation, not travel far
in world of aviation.”
Rod Machado’s Private Pilot Handbook
The AltimeterWelcome to the third dimension. One of
the things that makes aviation unique isyour ability to operate in 3D. No, you won’tneed any of those funny-colored glasses, but youwill need some assistance figuring out where youare in the third dimension. This is why I wouldnow like to introduce you to your altimeter.
Airplanes move left or right with great preci-sion, flying specific headings and airways. This istwo-dimensional navigation. Altimeters allow air-planes to fly at specific altitudes—a third dimen-sion—with equal precision.
There are lots of ways to get high in aviation(all perfectly legal and honest, honest!). Inthe next few minutes, you will discoverthat there’s altitude and then there’s alti-tude. Knowing one from the other is cru-cial to your success as a pilot, not to men-tion your longevity as a person.
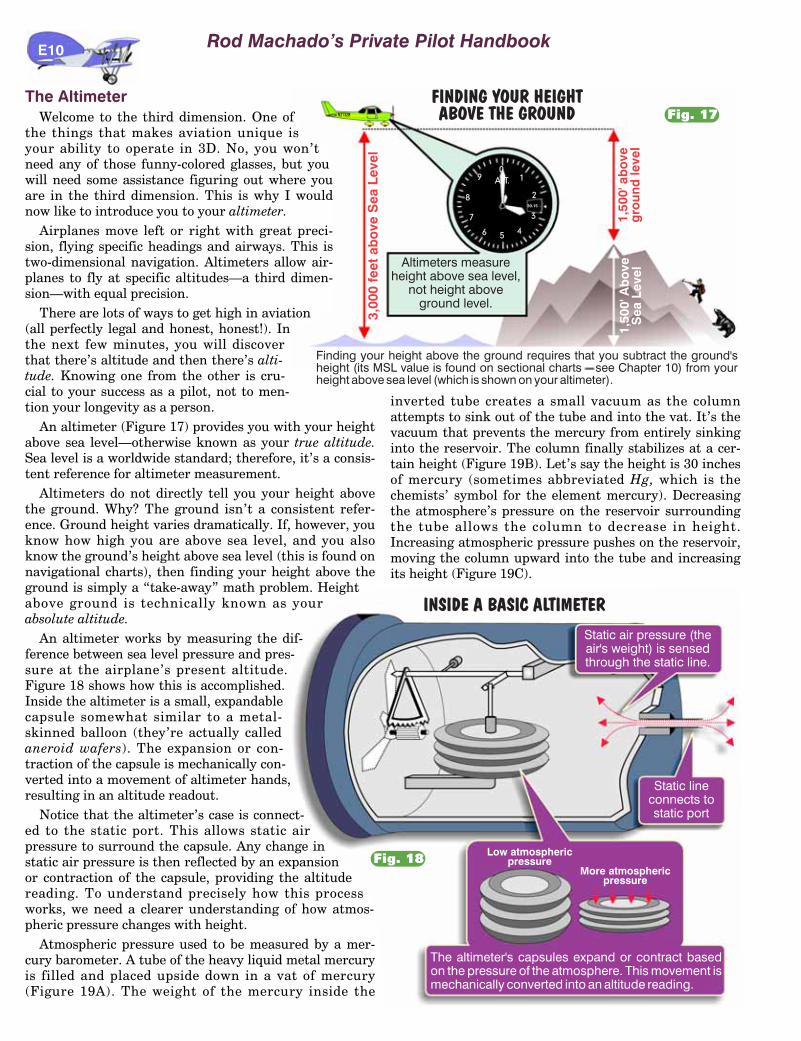
An altimeter (Figure 17) provides you with your heightabove sea level—otherwise known as your true altitude.Sea level is a worldwide standard; therefore, it’s a consis-tent reference for altimeter measurement.
Altimeters do not directly tell you your height abovethe ground. Why? The ground isn’t a consistent refer-ence. Ground height varies dramatically. If, however, youknow how high you are above sea level, and you alsoknow the ground’s height above sea level (this is found onnavigational charts), then finding your height above theground is simply a “take-away” math problem. Heightabove ground is technically known as yourabsolute altitude.
An altimeter works by measuring the dif-ference between sea level pressure and pres-sure at the airplane’s present altitude.Figure 18 shows how this is accomplished.Inside the altimeter is a small, expandablecapsule somewhat similar to a metal-skinned balloon (they’re actually calledaneroid wafers). The expansion or con-traction of the capsule is mechanically con-verted into a movement of altimeter hands,resulting in an altitude readout.
Notice that the altimeter’s case is connect-ed to the static port. This allows static airpressure to surround the capsule. Any change instatic air pressure is then reflected by an expansionor contraction of the capsule, providing the altitudereading. To understand precisely how this processworks, we need a clearer understanding of how atmos-pheric pressure changes with height.
Atmospheric pressure used to be measured by a mer-cury barometer. A tube of the heavy liquid metal mercuryis filled and placed upside down in a vat of mercury(Figure 19A). The weight of the mercury inside the
inverted tube creates a small vacuum as the columnattempts to sink out of the tube and into the vat. It’s thevacuum that prevents the mercury from entirely sinkinginto the reservoir. The column finally stabilizes at a cer-tain height (Figure 19B). Let’s say the height is 30 inchesof mercury (sometimes abbreviated Hg, which is thechemists’ symbol for the element mercury). Decreasingthe atmosphere’s pressure on the reservoir surroundingthe tube allows the column to decrease in height.Increasing atmospheric pressure pushes on the reservoir,moving the column upward into the tube and increasingits height (Figure 19C).
E10
N2132B
3,00
0 fe
et a
bo
ve S
ea L
evel
1,50
0' a
bo
veg
roun
d le
vel
1,50
0' A
bo
veS
ea L
evel
Altimeters measureheight above sea level,
not height aboveground level.
Finding your height above the ground requires that you subtract the ground'sheight (its MSL value is found on sectional charts see Chapter 10) from yourheight above sea level (which is shown on your altimeter).
.
1
2
3
09
8
5
7
6 4
ALT.
30.15
FINDING YOUR HEIGHTABOVE THE GROUND Fig. 17
Static lineconnects tostatic port
Static air pressure (theair's weight) is sensedthrough the static line.
Low atmosphericpressure
More atmosphericpressure
The altimeter's capsules expand or contract basedon the pressure of the atmosphere. This movement ismechanically converted into an altitude reading.
INSIDE A BASIC ALTIMETER
Rod Machado’s Private Pilot Handbook
Fig. 18

The changing height of the mercury column representsatmospheric pressure in much the same way your tonguemight represent the pressure of someone standing onyour chest. A tongue sticking way out of your mouthwould represent a lot of pressure on your chest. When theperson stepped off your chest, your tongue would (wehope) recede into your mouth. One might be able to cal-culate the person’s weight by measuring the exactamount of tongue protrusion. One might say that 200pounds is worth 6 inches of tongue. Of course, I saythis tongue in cheek since it’s not all that accu-rate; after all, it’s only a rule of tongue, and cali-bration would always be a challenge.
Even if we calculated tongue protrusion for agiven amount of weight, this information is totallyuseless (but high in entertainment value, never-theless). There is, however, great value in calcu-lating the height, in inches, that a column ofmercury will change if it’s moved vertically.Since the weight of the atmosphere changes withheight, this pressure change should be reflectedby a lengthening or shortening of the mercurycolumn. Indeed, this is exactly what happens. Acolumn of mercury changes about one inch inheight per thousand feet of altitude change, andthis is the standard used to calibrate altimeters(Figure 19D).
Let’s say that at sea level, under typicalpressure conditions, our mercury columnstands 30 inches tall. We say the atmospher-ic pressure is 30 inches of mercury. At 1,000feet MSL (mean sea level), the pressuredecreases and the mercury column fallsapproximately one inch. It now stands 29inches tall. The atmospheric pressure at1,000 feet MSL is properly stated as 29 inch-es of mercury. Altitude measurement isbased on the consistency of this known pres-sure change.
Aircraft altimeters don’t use mercurybarometers. If they did, there would be abig, three-foot long tube protruding fromthe instrument panel (Not a pretty sight.Besides, it would keep poking you in theeye). Instead, the small expandable cap-sule’s expansion or contraction is calibratedin inches of mercury. In other words, takenfrom sea level to 1,000 feet MSL, the cap-sule expands a small but predictableamount. Altimeter designers calibrate thischange as equaling one inch on the mercurybarometer.
Now you are ready to understand howaltimeters can determine your airplane’sheight above sea level.
Figure 20A shows an altimeter resting atsea level, where the pressure is 30” Hg. This is the pres-sure sensed through the airplane’s static port; therefore,the pressure surrounding the expandable capsule is also30” Hg. Let’s say the pressure inside the capsule is also at30” Hg. What’s going to happen to the capsule? Will itexpand? No. The pressure inside the capsule is the sameas the pressure outside the capsule. Without any pressuredifference, the capsule doesn’t expand and the altimeterreads an altitude of zero feet.
Chapter 5 - Flight Instruments: Clocks, Tops & Toys E11
An increase inatmospheric
pressure causesthe column
to rise.
A decrease inatmospheric
pressure causesthe column
to fall. 30"Tall
29"Tall
28"Tall
1,000'MSL
SeaLevel
2,000'MSL
Column heightdecreases 1"of mercury forevery 1,000'
altitudechange.
Columnheight
(30" tall)is a
measure ofatmospheric
pressure.
Atmosphericpressure
HOW A MERCURY BAROMETER WORKS
Liquid mercury in vat
Test tube is full ofliquid mercury.
A B
C D
.
1
2
3
09
8
5
7
6 4
ALT.
30.00
.
1
2
3
09
8
5
7
6 4
ALT.
30.003000'
2000'
1000'
Sea level
- 27"
- 28"
- 29"
30"
30"
30"
30"
27"
The pressure inside the capsule is the same as theoutside static pressure. Therefore, the capsule does-n't expand and the hands read "zero" altitude.
The pressure inside the capsule is 3" greater than theoutside static pressure. Therefore, the capsule ex-pands an amount equivalent to three inches of mer-cury. This equates to an altitude reading of 3,000 feetabove sea level.
HOW THE ALTIMETERCALCULATES YOUR ALTITUDE B
AFig. 20
Fig. 19
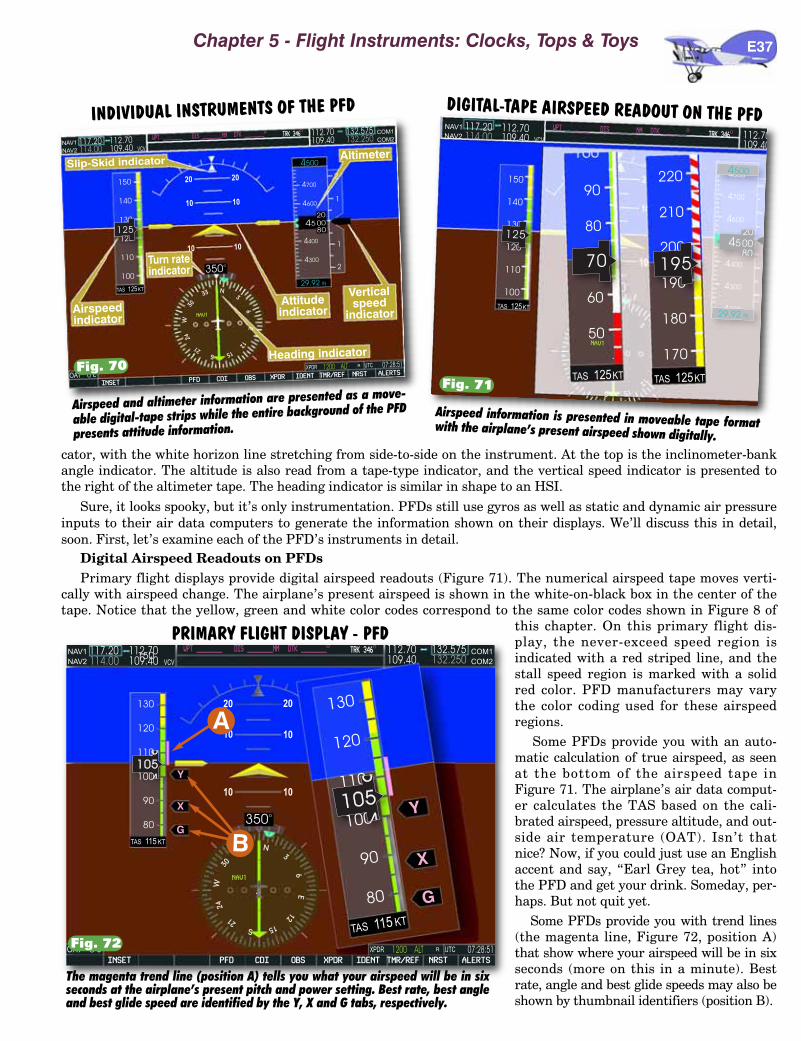
cator, with the white horizon line stretching from side-to-side on the instrument. At the top is the inclinometer-bankangle indicator. The altitude is also read from a tape-type indicator, and the vertical speed indicator is presented tothe right of the altimeter tape. The heading indicator is similar in shape to an HSI.
Sure, it looks spooky, but it’s only instrumentation. PFDs still use gyros as well as static and dynamic air pressureinputs to their air data computers to generate the information shown on their displays. We’ll discuss this in detail,soon. First, let’s examine each of the PFD’s instruments in detail.
Digital Airspeed Readouts on PFDsPrimary flight displays provide digital airspeed readouts (Figure 71). The numerical airspeed tape moves verti-
cally with airspeed change. The airplane’s present airspeed is shown in the white-on-black box in the center of thetape. Notice that the yellow, green and white color codes correspond to the same color codes shown in Figure 8 of
this chapter. On this primary flight dis-play, the never-exceed speed region isindicated with a red striped line, and thestall speed region is marked with a solidred color. PFD manufacturers may varythe color coding used for these airspeedregions.
Some PFDs provide you with an auto-matic calculation of true airspeed, as seenat the bottom of the airspeed tape inFigure 71. The airplane’s air data comput-er calculates the TAS based on the cali-brated airspeed, pressure altitude, and out-side air temperature (OAT). Isn’t thatnice? Now, if you could just use an Englishaccent and say, “Earl Grey tea, hot” intothe PFD and get your drink. Someday, per-haps. But not quit yet.
Some PFDs provide you with trend lines(the magenta line, Figure 72, position A)that show where your airspeed will be in sixseconds (more on this in a minute). Bestrate, angle and best glide speeds may also beshown by thumbnail identifiers (position B).
Chapter 5 - Flight Instruments: Clocks, Tops & Toys E37
150
130
120
110
100
90
80
TAS KT115
INSET PFD CDI OBS
OAT 0 C
NAV1
NAV2 VCV
WPT ________ DIS ________NM DTK ________117.20114.00
112.70109.40
.
33 N
3
12
15S21
24
W30
350o
NAV1
G
X
Y
10 10
20 20
10 10
XPDR IDENT TMR/REF NRST ALERTS
XPDR UTCR1200 ALT 07:28:51
COM1
COM2
OTRK 346
O132.575132.250
112.70109.40
6E
130
120
110
100
90
80
TASKT115
G
X
Y
150
140
130
120
110
100
TAS KT125
125
200
190
180
170
220
210
TAS KT125
195
OAT 0 C
NAV1
NAV2VCV
WPT ________ DIS ________NM DTK ________O TRK 346O
117.20114.00
112.70109.40 112.70
109.40
.
3
12
15S
TAS KT125
NAV1
90
80
60
50
70
4
4
4
4
4
4
800
700
600
400
300
200
2
2
1
4500
29.92 IN
350o
ADVANCED GLASS C
2
2
1
1
INSETPFD CDI OBS XPDR IDENT TMR/REF NRST ALERTSOAT 0 C
XPDR UTCR1200 ALT 07:28:51
NAV1
NAV2
COM1
COM2
VCV
WPT ________ DIS ________NM DTK ________O
TRK 346O
117.20
114.00
132.575
132.250112.70
109.40
112.70
109.40
.
33 N3
6E
12
15S
21
24
W30
NAV1
Slip-Skid indicator Altimeter
Heading indicator
Airspeedindicator
Attitudeindicator
Verticalspeed
indicator
Turn rateindicator
10 10
20 20
10 10
4
4
4
4
700
600
400
300
4500
29.92 IN
150
140
130
120
110
100
TAS KT125
20
4500
80125
INDIVIDUAL INSTRUMENTS OF THE PFD
Fig. 70
The magenta trend line (position A) tells you what your airspeed will be in sixseconds at the airplane’s present pitch and power setting. Best rate, best angleand best glide speed are identified by the Y, X and G tabs, respectively.
Airspeed information is presented in moveable tape formatwith the airplane’s present airspeed shown digitally.
Airspeed and altimeter information are presented as a move-
able digital-tape strips while the entire background of the PFD
presents attitude information.
DIGITAL-TAPE AIRSPEED READOUT ON THE PFD
Fig. 71
PRIMARY FLIGHT DISPLAY - PFD
Fig. 72
A
B
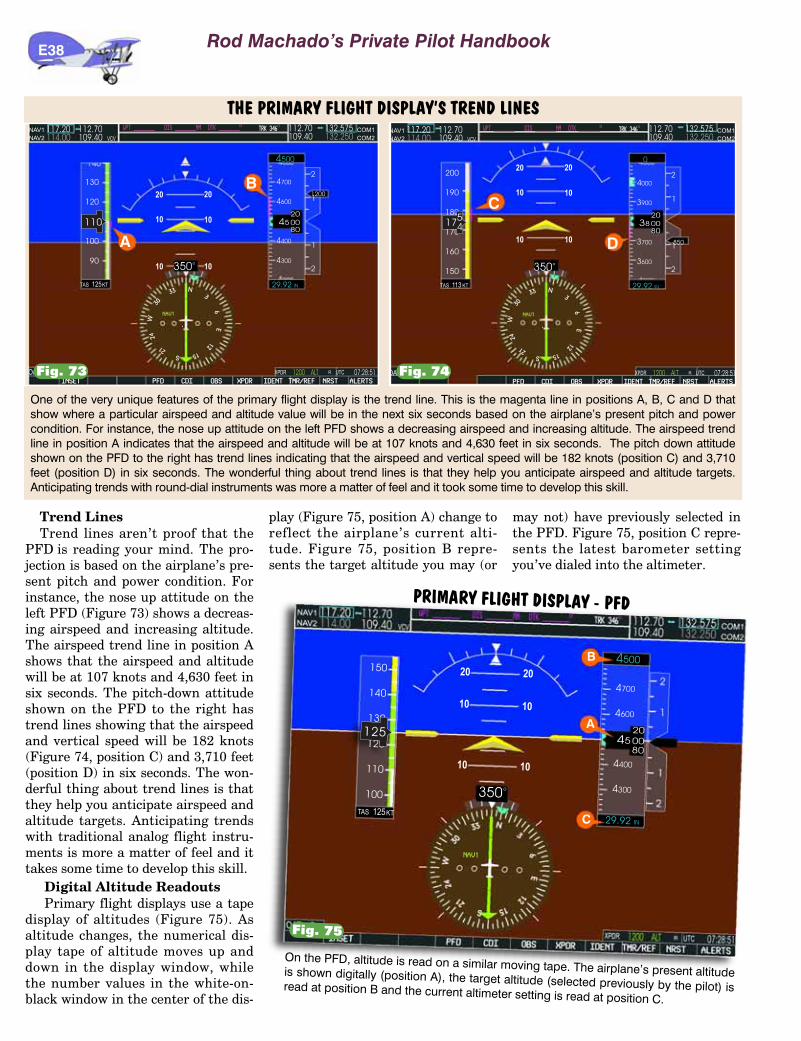
Trend LinesTrend lines aren’t proof that the
PFD is reading your mind. The pro-jection is based on the airplane’s pre-sent pitch and power condition. Forinstance, the nose up attitude on theleft PFD (Figure 73) shows a decreas-ing airspeed and increasing altitude.The airspeed trend line in position Ashows that the airspeed and altitudewill be at 107 knots and 4,630 feet insix seconds. The pitch-down attitudeshown on the PFD to the right hastrend lines showing that the airspeedand vertical speed will be 182 knots(Figure 74, position C) and 3,710 feet(position D) in six seconds. The won-derful thing about trend lines is thatthey help you anticipate airspeed andaltitude targets. Anticipating trendswith traditional analog flight instru-ments is more a matter of feel and ittakes some time to develop this skill.
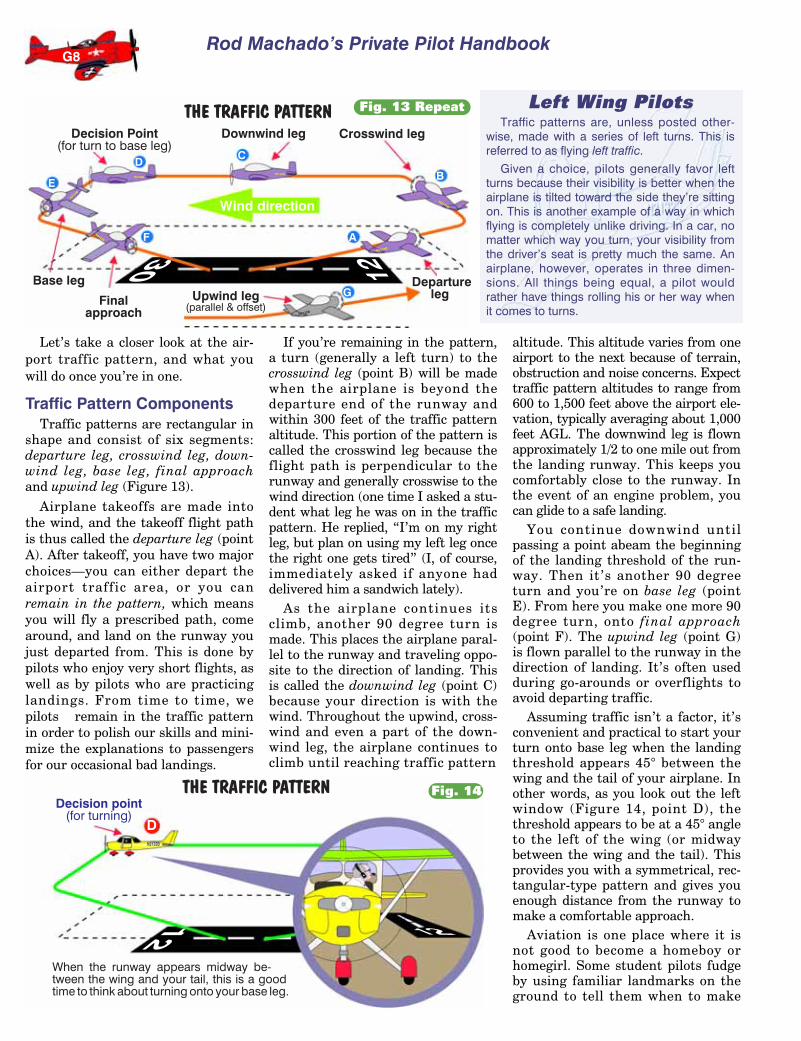
Digital Altitude ReadoutsPrimary flight displays use a tape
display of altitudes (Figure 75). Asaltitude changes, the numerical dis-play tape of altitude moves up anddown in the display window, whilethe number values in the white-on-black window in the center of the dis-
play (Figure 75, position A) change toreflect the airplane’s current alti-tude. Figure 75, position B repre-sents the target altitude you may (or
may not) have previously selected inthe PFD. Figure 75, position C repre-sents the latest barometer settingyou’ve dialed into the altimeter.
E38 Rod Machado’s Private Pilot Handbook
NAV1
350o
4
4
4
4
700
600
400
300
4500
29.92 IN
20
4500
80
150
140
130
120
110
100
TAS KT125
C
B
A
10 10
20 20
10 10
125
PRIMARY FLIGHT DISPLAY - PFD
On the PFD, altitude is read on a similar moving tape. The airplane’s present altitudeis shown digitally (position A), the target altitude (selected previously by the pilot) isread at position B and the current altimeter setting is read at position C.
130
120
110
100
90
TAS KT125
110
2
2
1
1
INSET PFD CDI OBS XPDR IDENT TMR/REF NRST ALERTS
OAT 0 C XPDR UTCR1200 ALT 07:28:51
NAV1
NAV2
COM1
COM2VCV
WPT ________ DIS ________NM DTK ________O TRK 346O
117.20114.00
132.575132.250
112.70109.40
112.70109.40
.
33 N
3
6E
12
15S21
24
W30
350o
NAV1
1200
.
33 N
3
6E
12
15S21
24
W30
A
B 4
4
4
4
700
600
400
300
4500
29.92 IN
20
4500
80
10 10
20 20
10 10
One of the very unique features of the primary flight display is the trend line. This is the magenta line in positions A, B, C and D thatshow where a particular airspeed and altitude value will be in the next six seconds based on the airplane’s present pitch and powercondition. For instance, the nose up attitude on the left PFD shows a decreasing airspeed and increasing altitude. The airspeed trendline in position A indicates that the airspeed and altitude will be at 107 knots and 4,630 feet in six seconds. The pitch down attitudeshown on the PFD to the right has trend lines indicating that the airspeed and vertical speed will be 182 knots (position C) and 3,710feet (position D) in six seconds. The wonderful thing about trend lines is that they help you anticipate airspeed and altitude targets.Anticipating trends with round-dial instruments was more a matter of feel and it took some time to develop this skill.
THE PRIMARY FLIGHT DISPLAY’S TREND LINES
.
33 N
3
6E
12
15S21
24
W30
200
190
180
170
160
150
TAS KT113
175
4
2
2
1
1
PFD CDI OBS XPDR IDENT TMR/REF NRST ALERTS
OAT 0 C XPDR UTCR1200 ALT 07:28:51
NAV1
NAV2 VCV
WPT ________ DIS ________NM DTK ________O117.20114.00
112.70109.40
COM1
COM2
TRK 346O
132.575132.250
112.70109.40
.
33 N
3
6E
12
15S21
24
W30
350o
NAV1
-850
C
D
40
9
7
6
00
00
00
00
3
3
3
0
29.92 IN
20
3800
80
10 10
20 20
10 10
Fig. 73 Fig. 74
Fig. 75
Rod Machado’s Private Pilot Handbook
Let’s take a closer look at the air-port traffic pattern, and what youwill do once you’re in one.
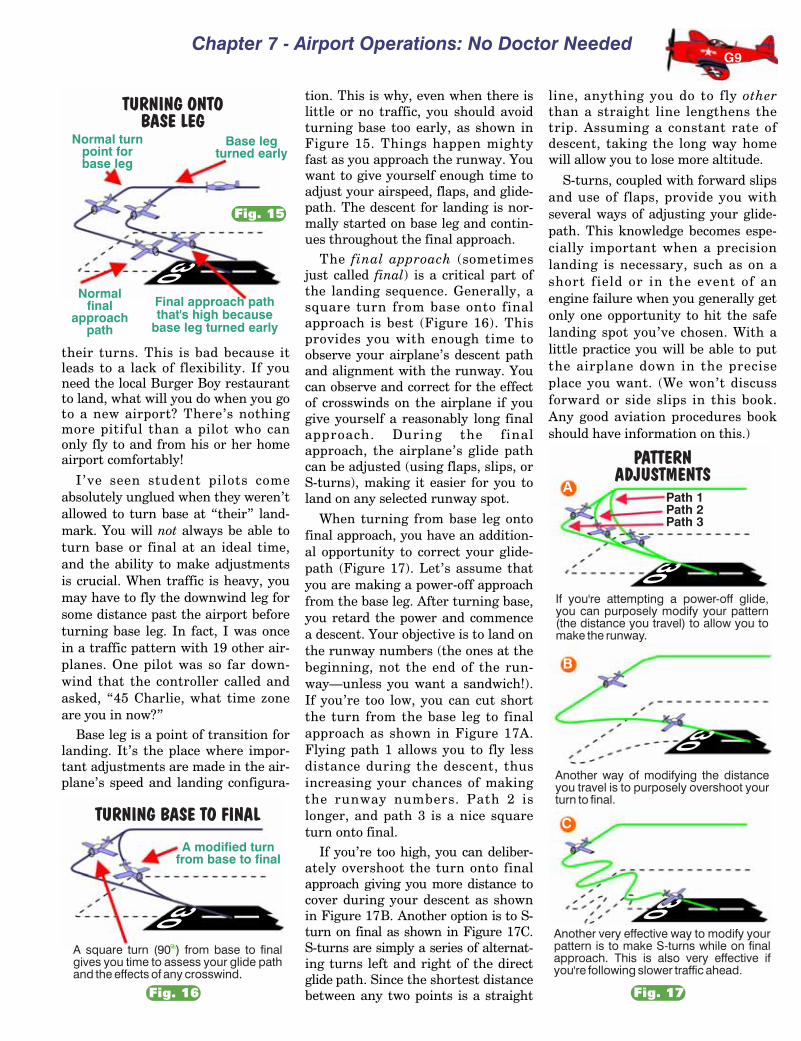
Traffic Pattern ComponentsTraffic patterns are rectangular in
shape and consist of six segments:departure leg, crosswind leg, down-wind leg, base leg, final approachand upwind leg (Figure 13).
Airplane takeoffs are made intothe wind, and the takeoff flight pathis thus called the departure leg (pointA). After takeoff, you have two majorchoices—you can either depart theairport traffic area, or you canremain in the pattern, which meansyou will fly a prescribed path, comearound, and land on the runway youjust departed from. This is done bypilots who enjoy very short flights, aswell as by pilots who are practicinglandings. From time to time, wepilots remain in the traffic patternin order to polish our skills and mini-mize the explanations to passengersfor our occasional bad landings.
If you’re remaining in the pattern,a turn (generally a left turn) to thecrosswind leg (point B) will be madewhen the airplane is beyond thedeparture end of the runway andwithin 300 feet of the traffic patternaltitude. This portion of the pattern iscalled the crosswind leg because theflight path is perpendicular to therunway and generally crosswise to thewind direction (one time I asked a stu-dent what leg he was on in the trafficpattern. He replied, “I’m on my rightleg, but plan on using my left leg oncethe right one gets tired” (I, of course,immediately asked if anyone haddelivered him a sandwich lately).
As the airplane continues itsclimb, another 90 degree turn ismade. This places the airplane paral-lel to the runway and traveling oppo-site to the direction of landing. Thisis called the downwind leg (point C)because your direction is with thewind. Throughout the upwind, cross-wind and even a part of the down-wind leg, the airplane continues toclimb until reaching traffic pattern
altitude. This altitude varies from oneairport to the next because of terrain,obstruction and noise concerns. Expecttraffic pattern altitudes to range from600 to 1,500 feet above the airport ele-vation, typically averaging about 1,000feet AGL. The downwind leg is flownapproximately 1/2 to one mile out fromthe landing runway. This keeps youcomfortably close to the runway. Inthe event of an engine problem, youcan glide to a safe landing.
You continue downwind untilpassing a point abeam the beginningof the landing threshold of the run-way. Then it’s another 90 degreeturn and you’re on base leg (pointE). From here you make one more 90degree turn, onto final approach(point F). The upwind leg (point G)is flown parallel to the runway in thedirection of landing. It’s often usedduring go-arounds or overflights toavoid departing traffic.
Assuming traffic isn’t a factor, it’sconvenient and practical to start yourturn onto base leg when the landingthreshold appears 45° between thewing and the tail of your airplane. Inother words, as you look out the leftwindow (Figure 14, point D), thethreshold appears to be at a 45° angleto the left of the wing (or midwaybetween the wing and the tail). Thisprovides you with a symmetrical, rec-tangular-type pattern and gives youenough distance from the runway tomake a comfortable approach.
Aviation is one place where it isnot good to become a homeboy orhomegirl. Some student pilots fudgeby using familiar landmarks on theground to tell them when to make
G8
12
Decision point(for turning)
When the runway appears midway be-tween the wing and your tail, this is a goodtime to think about turning onto your base leg.
DN2132B
THE TRAFFIC PATTERN
AF
G
B
CD
E
DeparturelegUpwind leg
(parallel & offset)
THE TRAFFIC PATTERN
N2132B
30 12
N2132B
N2132B
N2132B
N2132B
N2132BN2132B
Wind direction
Crosswind legDownwind leg
Base leg
Finalapproach
Decision Point(for turn to base leg)
Left Wing PilotsTraffic patterns are, unless posted other-
wise, made with a series of left turns. This isreferred to as flying left traffic.
Given a choice, pilots generally favor leftturns because their visibility is better when theairplane is tilted toward the side they’re sittingon. This is another example of a way in whichflying is completely unlike driving. In a car, nomatter which way you turn, your visibility fromthe driver’s seat is pretty much the same. Anairplane, however, operates in three dimen-sions. All things being equal, a pilot wouldrather have things rolling his or her way whenit comes to turns.
Fig. 13 Repeat
Fig. 14
Chapter 7 - Airport Operations: No Doctor Needed
their turns. This is bad because itleads to a lack of flexibility. If youneed the local Burger Boy restaurantto land, what will you do when you goto a new airport? There’s nothingmore pitiful than a pilot who canonly fly to and from his or her homeairport comfortably!
I’ve seen student pilots comeabsolutely unglued when they weren’tallowed to turn base at “their” land-mark. You will not always be able toturn base or final at an ideal time,and the ability to make adjustmentsis crucial. When traffic is heavy, youmay have to fly the downwind leg forsome distance past the airport beforeturning base leg. In fact, I was oncein a traffic pattern with 19 other air-planes. One pilot was so far down-wind that the controller called andasked, “45 Charlie, what time zoneare you in now?”
Base leg is a point of transition forlanding. It’s the place where impor-tant adjustments are made in the air-plane’s speed and landing configura-
tion. This is why, even when there islittle or no traffic, you should avoidturning base too early, as shown inFigure 15. Things happen mightyfast as you approach the runway. Youwant to give yourself enough time toadjust your airspeed, flaps, and glide-path. The descent for landing is nor-mally started on base leg and contin-ues throughout the final approach.
The final approach (sometimesjust called final) is a critical part ofthe landing sequence. Generally, asquare turn from base onto finalapproach is best (Figure 16). Thisprovides you with enough time toobserve your airplane’s descent pathand alignment with the runway. Youcan observe and correct for the effectof crosswinds on the airplane if yougive yourself a reasonably long finalapproach. During the finalapproach, the airplane’s glide pathcan be adjusted (using flaps, slips, orS-turns), making it easier for you toland on any selected runway spot.
When turning from base leg ontofinal approach, you have an addition-al opportunity to correct your glide-path (Figure 17). Let’s assume thatyou are making a power-off approachfrom the base leg. After turning base,you retard the power and commencea descent. Your objective is to land onthe runway numbers (the ones at thebeginning, not the end of the run-way—unless you want a sandwich!).If you’re too low, you can cut shortthe turn from the base leg to finalapproach as shown in Figure 17A.Flying path 1 allows you to fly lessdistance during the descent, thusincreasing your chances of makingthe runway numbers. Path 2 islonger, and path 3 is a nice squareturn onto final.
If you’re too high, you can deliber-ately overshoot the turn onto finalapproach giving you more distance tocover during your descent as shownin Figure 17B. Another option is to S-turn on final as shown in Figure 17C.S-turns are simply a series of alternat-ing turns left and right of the directglide path. Since the shortest distancebetween any two points is a straight
line, anything you do to fly otherthan a straight line lengthens thetrip. Assuming a constant rate ofdescent, taking the long way homewill allow you to lose more altitude.
S-turns, coupled with forward slipsand use of flaps, provide you withseveral ways of adjusting your glide-path. This knowledge becomes espe-cially important when a precisionlanding is necessary, such as on ashort field or in the event of anengine failure when you generally getonly one opportunity to hit the safelanding spot you’ve chosen. With alittle practice you will be able to putthe airplane down in the preciseplace you want. (We won’t discussforward or side slips in this book.Any good aviation procedures bookshould have information on this.)
G9
TURNING ONTOBASE LEG
30
N2132B
Normal turnpoint forbase leg
Normalfinal
approachpath
Final approach paththat's high because
base leg turned early
Base legturned early
N2132
B
N2132
B
N2132B
N2132B
TURNING BASE TO FINAL
30
N2132
B
N2132B
A square turn (90 ) from base to finalgives you time to assess your glide pathand the effects of any crosswind.
A modified turnfrom base to final
PATTERNADJUSTMENTS
If you're attempting a power-off glide,you can purposely modify your pattern(the distance you travel) to allow you tomake the runway.
Another way of modifying the distanceyou travel is to purposely overshoot yourturn to final.
Another very effective way to modify yourpattern is to make S-turns while on finalapproach. This is also very effective ifyou're following slower traffic ahead.
30N2132B
N2132
B
B
30N2132B
N2132
B
C
30
Path 1Path 2Path 3
A
N2132B
N2132B
N2132
B
Fig. 15
Fig. 16 Fig. 17

Rod Machado’s Private Pilot Handbook
Class E Airspace Starting At700 Feet AGL
When Class E airspace starts at700 above ground level, it will be sur-rounded by a magenta faded line, asshown in Figure 7. Anywhere withinthis magenta faded area, controlledairspace starts at 700 feet AGL. Anaeronautical sectional chart showsthis magenta faded border quiteclearly in Figure 8, position 1.Outside the border of the magentafade, controlled airspace starts at1,200 feet AGL.
Within the borders of the magentafade, at and above 700 feet AGL, RodMachado’s Airspace SimplificationRule #2 applies. In other words, youneed a minimum of 3V/152 for VFRflight.
Why would an airspace designerwant to lower Class E airspace to 700feet AGL around or near an airport?To keep VFR pilots from bumpinginto IFR pilots who are makinginstrument approaches.
The keyhole type extensions ofClass E airspace starting at 700 feetAGL in Figure 8 identify descentpaths followed by IFR airplanes dur-ing their instrument approaches. Thekeyhole slot is shown on the aeronau-tical sectional chart excerpt in Figure8, position 1. IFR pilots on an instru-ment approach typically descend toaltitudes of 700 feet AGL (and lower).They remain in Class E airspace dur-ing most of their IFR approach. Ifthey see the airport, they land; ifthey don’t see it, they fly off to anoth-
er airport (hopefully one that hasfewer clouds and better visibility).
Remember that in Class E airspacebelow 10,000 feet MSL, VFR pilotsshould be flying with no less than3V/152. This means if an IFR pilotpops out of the clouds, there shouldbe ample time for the VFR and IFRpilots to see and avoid each other(IFR pilots are equally responsible tosee and avoid whenever they arenot in instrument meteorologicalconditions).
Some airports have instrumentapproaches that bring IFR pilotsdown closer than 700 feet AGL, asshown in Figure 9. There are airportsallowing IFR pilots to come within200 feet AGL or less while still in theclouds. Since controlled airspace
I8
Class Estarts at700' AGL
CLASS E AIRSPACE AT 700' AGLWithin the borders of the magenta faded area surrounding an airport,Class E (controlled) airspace starts at 700 feet above ground level (AGL)instead of the normal 1,200 feet AGL. The lower base of Class E airspace(i.e., 700' AGL), keeps airplanes flying instrument approaches in con-trolled airspace asthey descend to theairport.
Class Eairspace
Carr Mem.Airport
Class A18,000' MSL
Class A18,000' MSL
Class Estarts at
1,200' AGL
Class Estarts at
1,200' AGL
700' AGL
Fig. 7
Class Estarts at700' AGL
Class Estarts atsurfaceMcComb-Pike
Airport
CLASS E AIRSPACE AT THE SURFACEWithin the borders of the magenta (red) dashed line, Class E airspacedescends all the way to the surface surrounding McComb-Pike airport.Since some instrument approaches bring pilots real close to the surfaceof an airport, this lower Class E surface area keeps them in controlledairspace during theirdescent.
Class Eairspace
Class Estarts at
1,200' AGL
Class Estarts at
1,200' AGL
N2132B
N2132
B
Fig. 8
Fig. 10Fig. 9
1
1
McComb-Pike airport as shown on anaeronautical sectional chart.
Carr airport as shown on anaeronautical sectional chart.
Chapter 9 - Airspace: The Wild Blue, Green & Red Yonder
helps VFR pilots see and avoid otherpilots, these airports have Class Eairspace lowered all the way to thesurface. (There are other reasons whycontrolled airspace is lowered, but theseare beyond the scope of this book.)
Figure 10 shows how surface-basedClass E airspace is shown on an aero-nautical sectional chart. A dottedmagenta line defines the lateralboundaries of the controlled airspacesurrounding McComb-Pike Countyairport (position 1). Airports withoutair traffic control towers use amagenta dashed line to represent thissurface-based Class E airspace.(Airports with established controltowers, as you’ll see a little later, useblue-dashed lines to represent con-trolled airspace in contact with thesurface around that airport.)
What does this surface-based ClassE airspace mean to you as a VFRpilot approaching and departingMcComb-Pike airport? It means RodMachado’s Airspace SimplificationRule #2 applies all the way to thesurface within the boundaries of themagenta-dashed line. The only thingdifferent here is that the controlledairspace normally existing at 700 feetor 1,200 feet AGL drops to the sur-face within the boundaries of themagenta dashed line.
Additional Requirements InSurface-Based ControlledAirspace
There are two additional require-ments when operating at an airporthaving any type of surface-based con-trolled airspace established for it(Class E in the case of McComb-Pike):
1. The reported ground visibility atthe airport must be at least threestatute miles. If the ground visibilityisn’t reported, then the flight visibili-ty during takeoff, landing or whenoperating in the traffic pattern mustbe at least three statute miles. (Theflight visibility is always determinedby the pilot on the honor system.)
2. If a ceiling exists at that airport,it can be no lower than 1,000 feetAGL if you desire to operate beneathit. If you want to take off, land or
operate in the traffic pattern, theceiling (if one exists) must be at least1,000 feet AGL or more.
A ceiling is defined as the heightabove the earth’s surface of the low-est layer of clouds reported as brokenor overcast, or any reported verticalvisibility into obscuring phenomena.We’ll be talking more about theseterms in Chapter 13. For themoment, consider a ceiling as beinganything in the sky you can’t readilysee through (like clouds for instance).
To summarize these requirements,remember this. To operate to, from,or at an airport within the bound-aries of any surface-based controlledairspace, you need a minimum ofthree miles reported visibility (flight
visibility if none reported) and noless than a 1,000 foot ceiling (if a ceil-ing exists). Let’s symbolize thesebasic VFR requirements as 3V/1C.(As you’ll soon see, in addition toClass E, there are three other typesof controlled airspace that can sur-round an airport at the surface: ClassD, C and B.)
Here’s Rod Machado’s AirspaceSimplification Rule #3: Taking off,landing, or operating in the trafficpattern of an airport having any typeof surface-based controlled airspacerequires basic VFR minimums of atleast three miles visibility and, if aceiling exists at that airport, it can beno lower than 1,000 feet. We’ll sym-bolize this rule as 3V/1C.
I9
N911
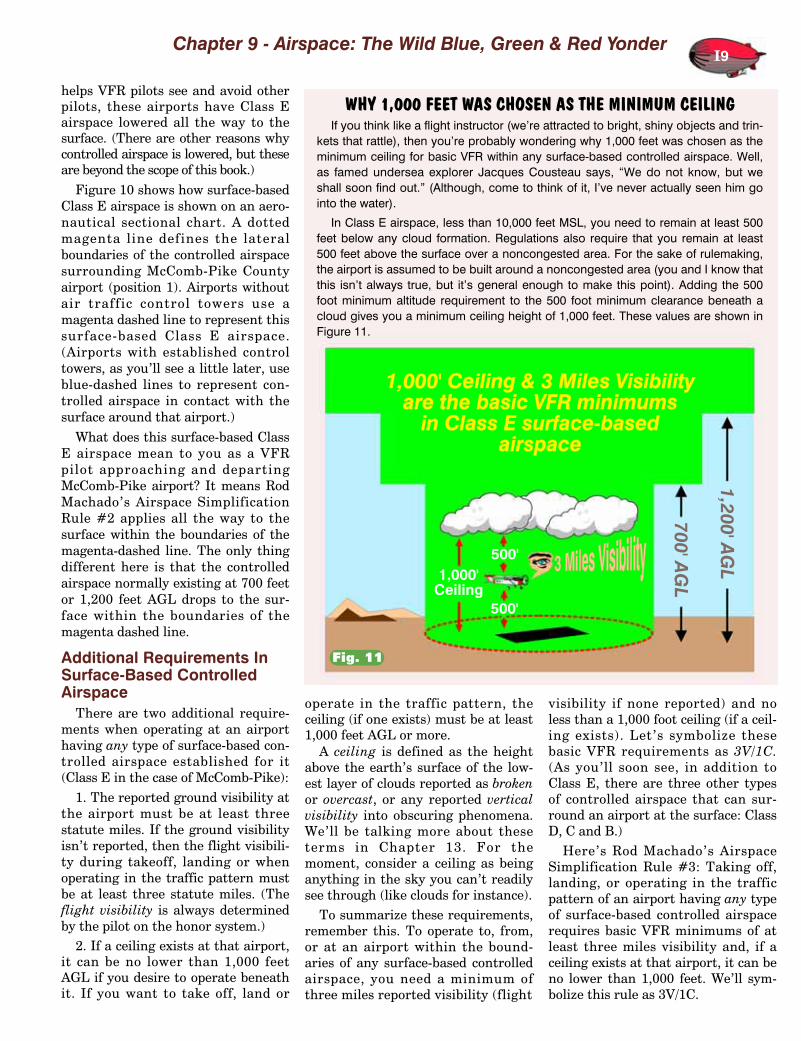
1,000' Ceiling & 3 Miles Visibilityare the basic VFR minimums
in Class E surface-basedairspace
1,000' Ceiling & 3 Miles Visibilityare the basic VFR minimums
in Class E surface-basedairspace
1,200' AG
L
700' AG
L1,000'Ceiling
500'
500'
WHY 1,000 FEET WAS CHOSEN AS THE MINIMUM CEILINGIf you think like a flight instructor (we’re attracted to bright, shiny objects and trin-
kets that rattle), then you’re probably wondering why 1,000 feet was chosen as theminimum ceiling for basic VFR within any surface-based controlled airspace. Well,as famed undersea explorer Jacques Cousteau says, “We do not know, but weshall soon find out.” (Although, come to think of it, I’ve never actually seen him gointo the water).
In Class E airspace, less than 10,000 feet MSL, you need to remain at least 500feet below any cloud formation. Regulations also require that you remain at least500 feet above the surface over a noncongested area. For the sake of rulemaking,the airport is assumed to be built around a noncongested area (you and I know thatthis isn’t always true, but it’s general enough to make this point). Adding the 500foot minimum altitude requirement to the 500 foot minimum clearance beneath acloud gives you a minimum ceiling height of 1,000 feet. These values are shown inFigure 11.
Fig. 11
Rod Machado’s Private Pilot Handbook
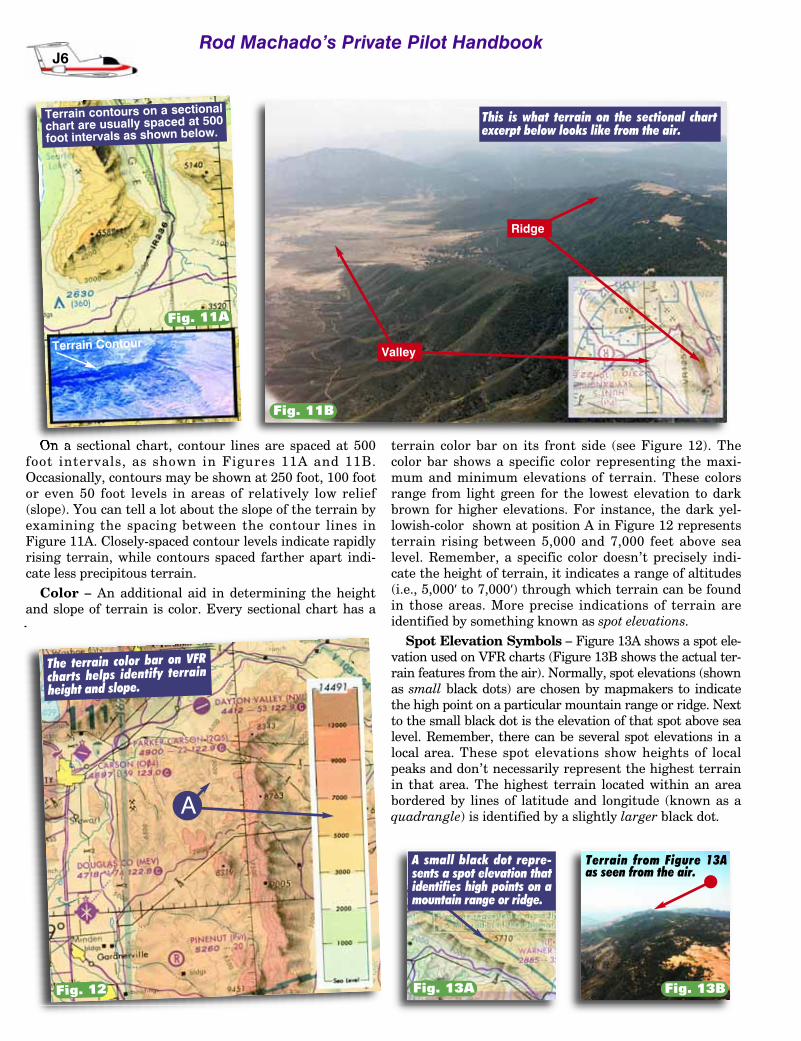
On a sectional chart, contour lines are spaced at 500foot intervals, as shown in Figures 11A and 11B.Occasionally, contours may be shown at 250 foot, 100 footor even 50 foot levels in areas of relatively low relief(slope). You can tell a lot about the slope of the terrain byexamining the spacing between the contour lines inFigure 11A. Closely-spaced contour levels indicate rapidlyrising terrain, while contours spaced farther apart indi-cate less precipitous terrain.
Color – An additional aid in determining the heightand slope of terrain is color. Every sectional chart has a
terrain color bar on its front side (see Figure 12). Thecolor bar shows a specific color representing the maxi-mum and minimum elevations of terrain. These colorsrange from light green for the lowest elevation to darkbrown for higher elevations. For instance, the dark yel-lowish-color shown at position A in Figure 12 representsterrain rising between 5,000 and 7,000 feet above sealevel. Remember, a specific color doesn’t precisely indi-cate the height of terrain, it indicates a range of altitudes(i.e., 5,000’ to 7,000’) through which terrain can be foundin those areas. More precise indications of terrain areidentified by something known as spot elevations.
Spot Elevation Symbols – Figure 13A shows a spot ele-vation used on VFR charts (Figure 13B shows the actual ter-rain features from the air). Normally, spot elevations (shownas small black dots) are chosen by mapmakers to indicatethe high point on a particular mountain range or ridge. Nextto the small black dot is the elevation of that spot above sealevel. Remember, there can be several spot elevations in alocal area. These spot elevations show heights of localpeaks and don’t necessarily represent the highest terrainin that area. The highest terrain located within an areabordered by lines of latitude and longitude (known as aquadrangle) is identified by a slightly larger black dot.
J6
Fig. 12
Fig. 11A
Fig. 13A Fig. 13B
Terrain from Figure 13Aas seen from the air.
Terrain contours on a sectional
chart are usually spaced at 500foot intervals as shown below.
The terrain color bar on VFRcharts helps identify terrainheight and slope.
A small black dot repre-sents a spot elevation thatidentifies high points on amountain range or ridge.
Fig. 11B
This is what terrain on the sectional chartexcerpt below looks like from the air.
ValleyTerrain Contour
Ridge
A
Rod Machado’s Private Pilot Handbook
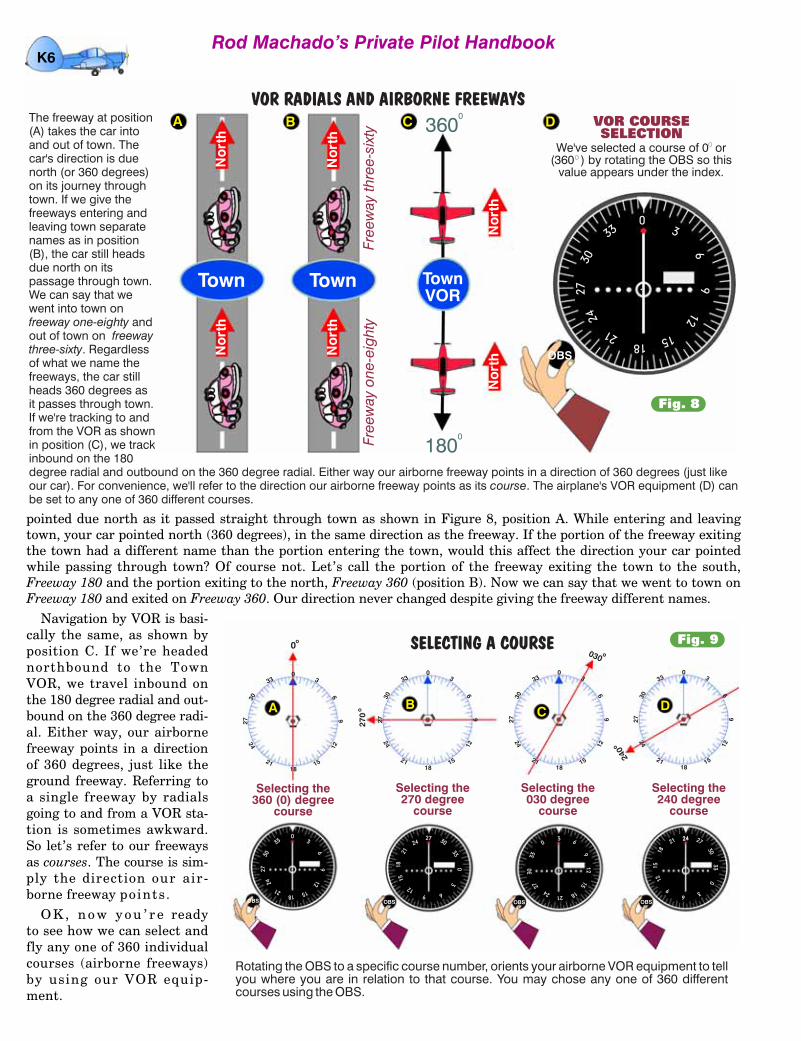
pointed due north as it passed straight through town as shown in Figure 8, position A. While entering and leavingtown, your car pointed north (360 degrees), in the same direction as the freeway. If the portion of the freeway exitingthe town had a different name than the portion entering the town, would this affect the direction your car pointedwhile passing through town? Of course not. Let’s call the portion of the freeway exiting the town to the south,Freeway 180 and the portion exiting to the north, Freeway 360 (position B). Now we can say that we went to town onFreeway 180 and exited on Freeway 360. Our direction never changed despite giving the freeway different names.
Navigation by VOR is basi-cally the same, as shown byposition C. If we’re headednorthbound to the TownVOR, we travel inbound onthe 180 degree radial and out-bound on the 360 degree radi-al. Either way, our airbornefreeway points in a directionof 360 degrees, just like theground freeway. Referring toa single freeway by radialsgoing to and from a VOR sta-tion is sometimes awkward.So let’s refer to our freewaysas courses. The course is sim-ply the direction our air-borne freeway points .
O K , n o w y o u ’ r e readyto see how we can select andfly any one of 360 individualcourses (airborne freeways)by using our VOR equip-ment.
K6
.
OBS
330
3
69
12
1518
21
24
27
30
Town Town
Free
way
thre
e-si
xty
Free
way
one
-eig
hty
360
180
0
0
A B C D
VOR RADIALS AND AIRBORNE FREEWAYS
We've selected a course of 0 or(360 ) by rotating the OBS so this
value appears under the index.
VOR COURSESELECTION
The freeway at position(A) takes the car intoand out of town. Thecar's direction is duenorth (or 360 degrees)on its journey throughtown. If we give thefreeways entering andleaving town separatenames as in position(B), the car still headsdue north on itspassage through town.We can say that wewent into town on
andout of town on
. Regardlessof what we name thefreeways, the car stillheads 360 degrees asit passes through town.If we're tracking to andfrom the VOR as shownin position (C), we trackinbound on the 180degree radial and outbound on the 360 degree radial. Either way our airborne freeway points in a direction of 360 degrees (just likeour car). For convenience, we'll refer to the direction our airborne freeway points as its . The airplane's VOR equipment (D) canbe set to any one of 360 different courses.
freeway one-eightyfreeway
three-sixty
course
TownVOR
Fig. 8
Rotating the OBS to a specific course number, orients your airborne VOR equipment to tellyou where you are in relation to that course. You may chose any one of 360 differentcourses using the OBS.
SELECTING A COURSE
.
OBS
330
3
69
12
1518
21
24
27
30
03
69
12
1518
21
24
2730
330
3
69
12
1518
21
24
2730
330
3
69
12
1518
21
24
2730
330
3
69
12
1518
21
24
2730
33
0
Selecting the360 (0) degree
course
o
A
.
33
03
6912
15
18
21
2427 30
OBS
Selecting the270 degree
course
270
o B
.
33
03
6
912
15
182124
27
30
OBS
Selecting the030 degree
course
030
o
C
. 33
0
36
9
12
15
18
21 2424 27
30
OBS
Selecting the240 degree
course
240o
D
Fig. 9
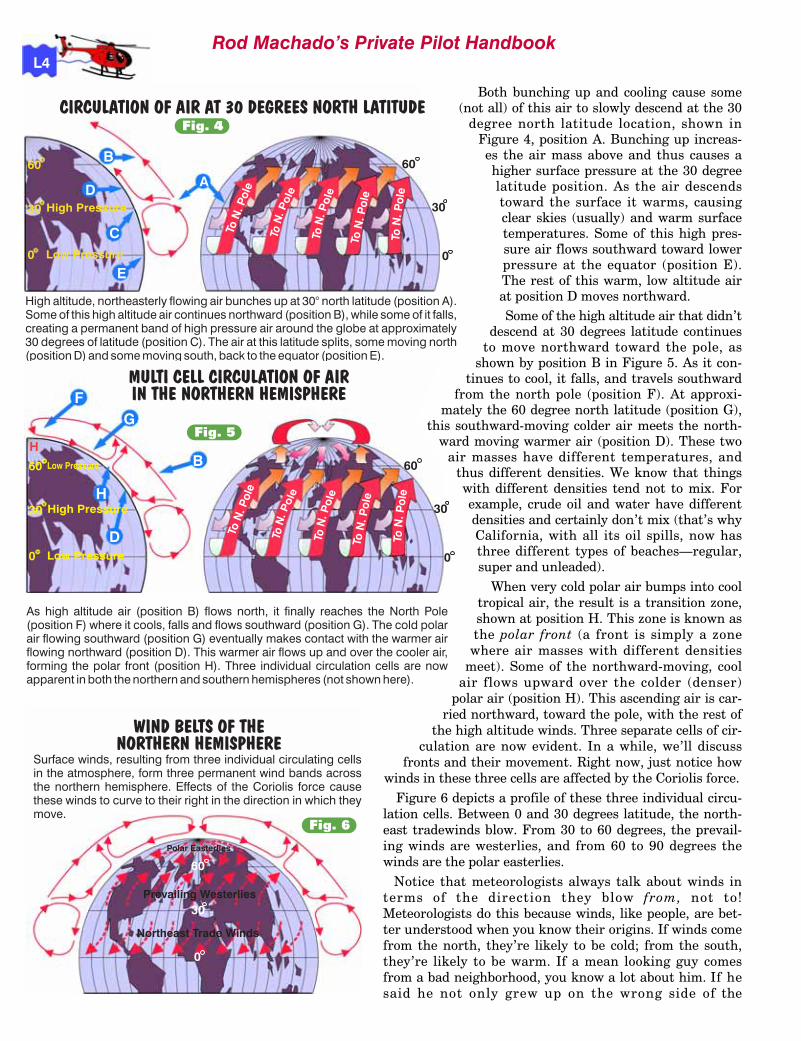
Rod Machado’s Private Pilot Handbook
Both bunching up and cooling cause some(not all) of this air to slowly descend at the 30
degree north latitude location, shown inFigure 4, position A. Bunching up increas-es the air mass above and thus causes ahigher surface pressure at the 30 degreelatitude position. As the air descendstoward the surface it warms, causingclear skies (usually) and warm surfacetemperatures. Some of this high pres-sure air flows southward toward lowerpressure at the equator (position E).The rest of this warm, low altitude airat position D moves northward. Some of the high altitude air that didn’t
descend at 30 degrees latitude continuesto move northward toward the pole, as
shown by position B in Figure 5. As it con-tinues to cool, it falls, and travels southward
from the north pole (position F). At approxi-mately the 60 degree north latitude (position G),
this southward-moving colder air meets the north-ward moving warmer air (position D). These two
air masses have different temperatures, andthus different densities. We know that thingswith different densities tend not to mix. Forexample, crude oil and water have differentdensities and certainly don’t mix (that’s whyCalifornia, with all its oil spills, now hasthree different types of beaches—regular,super and unleaded).
When very cold polar air bumps into cooltropical air, the result is a transition zone,shown at position H. This zone is known asthe polar front (a front is simply a zonewhere air masses with different densities
meet). Some of the northward-moving, coolair flows upward over the colder (denser)
polar air (position H). This ascending air is car-ried northward, toward the pole, with the rest of
the high altitude winds. Three separate cells of cir-culation are now evident. In a while, we’ll discuss
fronts and their movement. Right now, just notice howwinds in these three cells are affected by the Coriolis force.
Figure 6 depicts a profile of these three individual circu-lation cells. Between 0 and 30 degrees latitude, the north-east tradewinds blow. From 30 to 60 degrees, the prevail-ing winds are westerlies, and from 60 to 90 degrees thewinds are the polar easterlies.
Notice that meteorologists always talk about winds interms of the direction they blow from, not to!Meteorologists do this because winds, like people, are bet-ter understood when you know their origins. If winds comefrom the north, they’re likely to be cold; from the south,they’re likely to be warm. If a mean looking guy comesfrom a bad neighborhood, you know a lot about him. If hesaid he not only grew up on the wrong side of the
L4
A60
30
0
High altitude, northeasterly flowing air bunches up at 30° north latitude (position A).Some of this high altitude air continues northward (position B), while some of it falls,creating a permanent band of high pressure air around the globe at approximately30 degrees of latitude (position C). The air at this latitude splits, some moving north(position D) and some moving south, back to the equator (position E).
CIRCULATION OF AIR AT 30 DEGREES NORTH LATITUDE
Low Pressure
60
30
0
ToN
. Pol
e
ToN
. Pol
eD
C
E
B
High Pressure
Low Pressure
Low Pressure60
30
0
As high altitude air (position B) flows north, it finally reaches the North Pole(position F) where it cools, falls and flows southward (position G). The cold polarair flowing southward (position G) eventually makes contact with the warmer airflowing northward (position D). This warmer air flows up and over the cooler air,forming the polar front (position H). Three individual circulation cells are nowapparent in both the northern and southern hemispheres (not shown here).
MULTI CELL CIRCULATION OF AIRIN THE NORTHERN HEMISPHERE
H
F
H
G
B
D
60
30
0
ToN
. Pol
e
ToN
. Pol
e
High Pressure
Fig. 4
Fig. 5
Surface winds, resulting from three individual circulating cellsin the atmosphere, form three permanent wind bands acrossthe northern hemisphere. Effects of the Coriolis force causethese winds to curve to their right in the direction in which theymove.
WIND BELTS OF THENORTHERN HEMISPHERE
30
Northeast Trade Winds
Prevailing Westerlies
Polar Easterlies
60
0
Fig. 6

Chapter 12 - Understanding Weather
tracks, but grew up underneath them, you know he was abad dude. Figure 7 depicts this circulation on a multidi-mensional level.
While the issue of air is weighing on your mind, let’ssee how it weighs on the earth.
Air Pressure and Vertical Air MovementAir has weight. This weight exerts a pressure on the
earth’s surface in much the same way a professionalwrestler exerts pressure on your body by standing onyour chest (I hope this doesn’t happen to you a lot).Changing the air’s temperature, however, changes itsdensity and the pressure it exerts on the earth’s surface.
For example, along the equator there exist areas ofwarmer (less dense) rising air, as shown in Figure 8, posi-
tion 1. Rising air certainly wouldn’t create as much pres-sure on the surface as descending air. After all, onemoves upward while the other pushes downward.Warmer (less dense) rising air provides less push or pres-sure on the surface. We call large areas of warm rising airlow pressure centers. Near the equator, it’s quite commonto find permanent belts of low pressure air wrappedaround the earth.
Conversely, permanent high pressure areas exists atthe poles (Figure 8, position 2). Colder (more dense) airdescends, creating more pressure on the earth’s surface.Now you know why cold air falls on your toes duringthose nocturnal refrigerator raids. Think of cold air as ananvil resting on your chest, as shown in Figure 9. Gravitypulls the anvil downward as it does with cold air, increas-ing the pressure on your body. Let’s attach helium bal-loons to the anvil, making it lighter. Now the anvil movesupward (off your chest), in the same manner as risingwarmer air moves upward off the earth’s surface.Pressure at the surface decreases as warm air rises. Ofcourse, as warm air rises, cold air moves in underneath toreplace it. Thus, atmospheric circulation consists of highpressure air moving toward lower pressure air (Figure 8,position 3). This simple air circulation model is a funda-mental key to understanding weather.
Now that you understand major wind patterns, it’stime to examine exactly what makes the wind blow.
Getting Water in the AirWeather (meaning clouds, rain, thunderstorms, etc.)
wouldn’t exist if there wasn’t a means of putting waterinto the air. Television meteorologists would be forced toentertain their flock with hand-puppet shadows andbenign patter. Nearly half of all pilot fatalities would dis-appear, and any remaining Flight Service Stations couldbe retrofitted as bowling alleys.
L5
3D MULTICELLCIRCULATION OF AIR
Three wind belts are seen from above in 3-D perspective. Noticehow warmer, northward moving air from 30° latitude (position A)confronts colder, southward moving air from the north polar re-gion (position B). This confrontation is the source of much of thenasty weather we experience in the United States.
60
30
0
To N
. Pol
e
To N
. Pol
eA
B
When looking at a simplified,single-cell circulation
of the atmospherewe see that the
cold air descend-ing at the poles
(#2) createshigher pressureon the surface.
This air (#3)moves towardthe equator tofill in the lower
pressure createdby the rising,
warmer air (#1).Of course, as theearth rotates, the
circulation becomea tad more complex
as you've already seen.
HIGH AND LOW PRESSURE CENTERSON A NONROTATING EARTH
Higher pressurefound at poles.(Cold, falling air)
Lower pressurefound at equator.
(Warm, rising air)1
33
3 3
1
2
2
Think of cold (heavier) airas an anvil that falls and in-creases the pressure onyour chest. Simi-larly, cold airfalls, creatingmore pressureon the earth'ssurface.
Warmer (lighter) air, on theother hand, tends to rise like an
anvil being lifted off yourchest. You feel a
reduction inpressure. Similarly,
rising warmer airis felt by the
earth as alowering of
pressure on itssurface.
AIR MOVEMENT AND HOW ITAFFECTS SURFACE PRESSURE
HELIUM, that'show you spell
relief!
Fig. 7
Fig. 8
Fig. 9
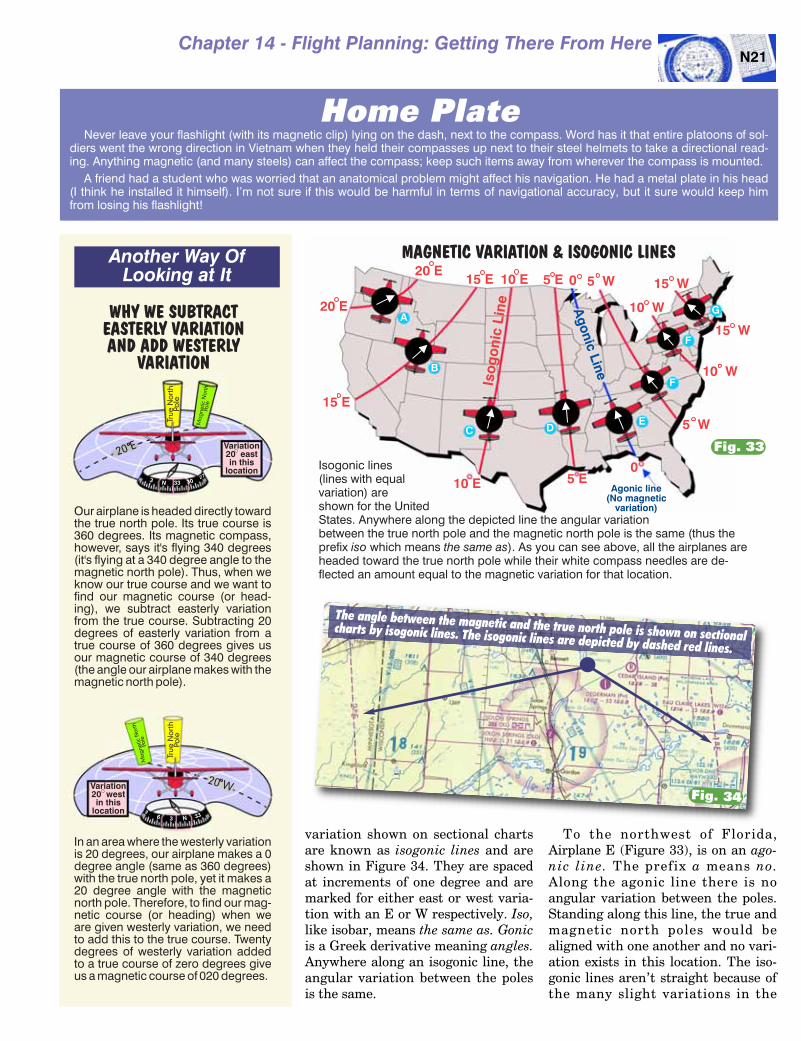
Chapter 14 - Flight Planning: Getting There From HereN21
variation shown on sectional chartsare known as isogonic lines and areshown in Figure 34. They are spacedat increments of one degree and aremarked for either east or west varia-tion with an E or W respectively. Iso,like isobar, means the same as. Gonicis a Greek derivative meaning angles.Anywhere along an isogonic line, theangular variation between the polesis the same.
To the northwest of Florida,Airplane E (Figure 33), is on an ago-nic line. The prefix a means no.Along the agonic line there is noangular variation between the poles.Standing along this line, the true andmagnetic north poles would bealigned with one another and no vari-ation exists in this location. The iso-gonic lines aren’t straight because ofthe many slight variations in the
Home PlateNever leave your flashlight (with its magnetic clip) lying on the dash, next to the compass. Word has it that entire platoons of sol-
diers went the wrong direction in Vietnam when they held their compasses up next to their steel helmets to take a directional read-ing. Anything magnetic (and many steels) can affect the compass; keep such items away from wherever the compass is mounted.
A friend had a student who was worried that an anatomical problem might affect his navigation. He had a metal plate in his head(I think he installed it himself). I’m not sure if this would be harmful in terms of navigational accuracy, but it sure would keep himfrom losing his flashlight!
Isogonic lines(lines with equalvariation) areshown for the UnitedStates. Anywhere along the depicted line the angular variationbetween the true north pole and the magnetic north pole is the same (thus theprefix which means ). As you can see above, all the airplanes areheaded toward the true north pole while their white compass needles are de-flected an amount equal to the magnetic variation for that location.
iso the same as
MAGNETIC VARIATION & ISOGONIC LINES
20 E
20 E
15 E
15 E
10 E
10 E
5 E
5 E
0
0
5 W
5 W
10 W
10 W
15 W
15 W
Isog
onic
Line
Agonic line(No magnetic
variation)
Agonic Line
A
B
EC
F
D
F
G
Fig. 33
WHY WE SUBTRACTEASTERLY VARIATIONAND ADD WESTERLY
VARIATION
Our airplane is headed directly towardthe true north pole. Its true course is360 degrees. Its magnetic compass,however, says it's flying 340 degrees(it's flying at a 340 degree angle to themagnetic north pole). Thus, when weknow our true course and we want tofind our magnetic course (or head-ing), we subtract easterly variationfrom the true course. Subtracting 20degrees of easterly variation from atrue course of 360 degrees gives usour magnetic course of 340 degrees(the angle our airplane makes with themagnetic north pole).
In an area where the westerly variationis 20 degrees, our airplane makes a 0degree angle (same as 360 degrees)with the true north pole, yet it makes a20 degree angle with the magneticnorth pole. Therefore, to find our mag-netic course (or heading) when weare given westerly variation, we needto add this to the true course. Twentydegrees of westerly variation addedto a true course of zero degrees giveus a magnetic course of 020 degrees.
Tru
e N
ort
hPo
le
Ma
gn
etic N
ort
hPo
le
3327
30N3
Variation20 eastin this
location
20 E
Tru
e N
ort
hPo
le
Ma
gn
etic
No
rth
Po
le
N 3369
3
Variation20 westin this
location
20 W
Another Way OfLooking at It
Fig. 34
The angle between the magnetic and the true north pole is shown on sectionalcharts by isogonic lines. The isogonic lines are depicted by dashed red lines.

Famous PeopleWith Pilot
Certificates
Mario AndrettiPrince AndrewJames ArnessRichard BachF. Lee BaileyHoward BakerJacinda BarrettDirk BenedictChris BoniolJimmy BuffetLavar BurtonGeorge BushPrince CharlesRoy ClarkStephen CoontsDave CoulierTom Cruise Dan DierdorfMichael DornHugh DownsClint EastwoodBill ElliotSarah (Fergie) FergusonHarrison FordMichael J. FoxMorgan FreemanMickey GilleyBill GlassonDavid HartmanPaul HarveyChad HenningsBarron HiltonAlan JacksonBruce JennerAngelina JolieJoe JuneauGeorge KennedyKris KristoffersonLorenzo LamasTom LandryGeorge McGovernJoe MontanaPaul NewmanLeonard NimoyArnold PalmerFess ParkerDennis QuaidAnthony RobbinsCliff RobertsonDavid Lee RothKurt RussellJohnny RutherfordMarty SchottenheimerWilliam ShatnerPatrick SwayzeLowell Thomas Jr.Aaron TippinJohn TravoltaBobby UnserHon. Barbara VucanovichRusty WallaceTreat WilliamsCharles WoolerySam Wyche
Once you have tasted flight, you will walk the worldwith your eyes turned skyward, for there you havebeen and there you long to return.
Leonardo da Vinci
Welcome to your instructor in a book.Written by a veteran ground and flightinstructor, this book is presented ina warm, conversational manner andspiced with humor. With a quarter of acentury of teaching experience, RodMachado’s tried-and-true methods ofinstruction have achieved exceptionalresults with thousands of students. Hisfresh approach to instructing hasmade him a popular nationalspeaker and educator. Rod has theunique ability to simplify the difficultand his humor helps you remem-ber the lesson.
This valuable one-stop handbook contains the information necessary to:Fly as a knowledgeable and competent pilot.Prepare for the Private Pilot FAA knowledge exam.Prepare for the Private Pilot practical oral exam.Refresh for required currency training.Remain an up-to-date confident pilot.
As a comprehensive information source book, these pages include:Simplification of aviation’s more technical subjects such as aerodynamics, engines and flight instruments.Latest information on the weather codes: METAR and TAF.Alphabet airspace made E-Z with three-dimensional illustrations.Step-by-step procedures for planning a smooth cross country flight.Easy to apply navigation methods for VOR, GPS and ADF.Clear, down-to-earth explanations of pertinent Federal Aviation Regulations Part 61 and Part 91.Water model of electricity allows quick learning and understandingof the airplane’s electrical system.Primary flight displays and the latest glass cockpit technology.A wealth of basic and advanced insights, advice and wisdom gleaned from practical experience.
With this book you are ensured an enjoyablelearning experience and quality instruction.
Rod Machado’s Private Pilot HandbookPublished by The Aviation Speakers Bureau
(800) 437-7080
Web site: www.rodmachado.com
$64.95
Rod Machado