rocky mtn glut
TRANSCRIPT

Rocky Mountain GlutAssessing Condensate Production Volumes in the Rocky
Mountains and Existing Takeaway Infrastructure to Identify Opportunities for Supply Investment
Eric Peterson
Senior Business Analyst
Condensate Markets, Export & Takeaway Capacity 2014
Houston, TX
October 2014

Introduction to ARB Midstream
• Denver based infrastructure development company providing midstream solutions
• Strong financial support from private equity
• Utilize in-depth fundamental analysis to identify value propositions of our assets
• Emphasis on early stage development opportunities
• Developing a new crude-by-rail terminal• Niobrara Connector “NiCon”
• Centrally located in the DJ Basin
• Unit train capable
• Scheduled in-service date: Q3 2015
2

Observations
3
• High IRR plays incentivize drilling activity
• DJ Basin provides some of the best economics in North America
• Growing play with significant production growth in the future
• Average of 65% of DJ Basin production is +45 API, more than any other Rockies play and getting lighter
• Midstream infrastructure is not adequate for long term production volumes
• Niobrara Connector “NiCon” crude-by-rail facility will provide additional takeaway optionality getting crude and condensate to market

IRR’s of Various Plays – High IRR Drives Drilling Activity
4
Utica
Marcellus - Dry
Uinta
Dry Gas
Wet Gas
Oil
Permian
Bakken
DJ Basin
Eagle Ford
40-71%
Granite Wash
Miss Lime55%
24%
28%66%
24%
74%73%
45%-73%
61%
Marcellus - Wet
Source: Credit Suisse
44%Woodford

Horizontal drilling activity drives production
5
Horizontal
Vertical
Directional
Source: RigData, HPDI
-16 /
+768
-8 /
+377
+19 /
+114
+62 /
+409 Rig Change /
Production
Increase

Comparison of Rockies Basins
-
100,000
200,000
300,000
400,000
500,000
600,000
700,000
800,000
900,000
1,000,000
0 12 24 36 48 60 72
Incre
me
nta
l P
rod
uctio
n (
bp
d)
Months Developed
Bakken
PRB
DJ Basin
6
Mature Play
Growing Plays

Bakken Production Forecast
7
-
200
400
600
800
1,000
1,200
1,400
1,600
Pro
du
cti
on
(b
pd
) Th
ou
sa
nd
s
Condensate (>45°)
Light (>38° and <45°)
Intermediate (>22° and <38°)
Heavy (<22°)
Source: Genscape
-
200
400
600
800
1,000
1,200
1,400
1,600
Th
ou
sa
nd
s
2014 2019

PRB Production Forecast
8
-
10
20
30
40
50
60
70
80
90
100
Pro
du
cti
on
(b
pd
) Th
ou
sa
nd
s
Condensate (>45°)
Light (>38° and <45°)
Intermediate (>22° and <38°)
Heavy (<22°)
Source: Genscape
-
5
10
15
20
25
30
35
40
45
Th
ou
sa
nd
s
2014 2019

DJ Production Forecast
9
0
50
100
150
200
250
300
350
400
450
500
Pro
du
cti
on
(b
pd
) Th
ou
sa
nd
s
Condensate (>45°)
Light (>38° and <45°)
Intermediate (>22° and <38°)
Heavy (<22°)
Source: ARB Midstream
-
50
100
150
200
250
300
350
400
Th
ou
sa
nd
s
2014 2019

All Basin API
20 25 30 35 40 45 50 55 60 65 70 75 80 85 90
Eagle Ford
SCOOP
Utica
Bakken
Miss Lime
DJ Basin
PRB
Canadian Condensate
Natural Gasoline
API Gravity
10
Condensate Preferred Diluent

Bulk of the increased production volumes are +45 API
11
-
5,000
10,000
15,000
20,000
25,000
30,000
35,000
40,000
45,000
Pro
du
ctio
n (
bp
d)
API Gravity
DJ Production by API(Jan 2014 vs May 2014)
Jan-14 May-14
Source: EIA
Production Increase: 61kbpd
>45 API: 62% to 70%
WAVG API: 45.4 to 47.1
Additional +45 API: 54kbpd

High API production centered in the core area of the Wattenberg Field
12Source: HPDI
Cru
de A
PI G
ravity
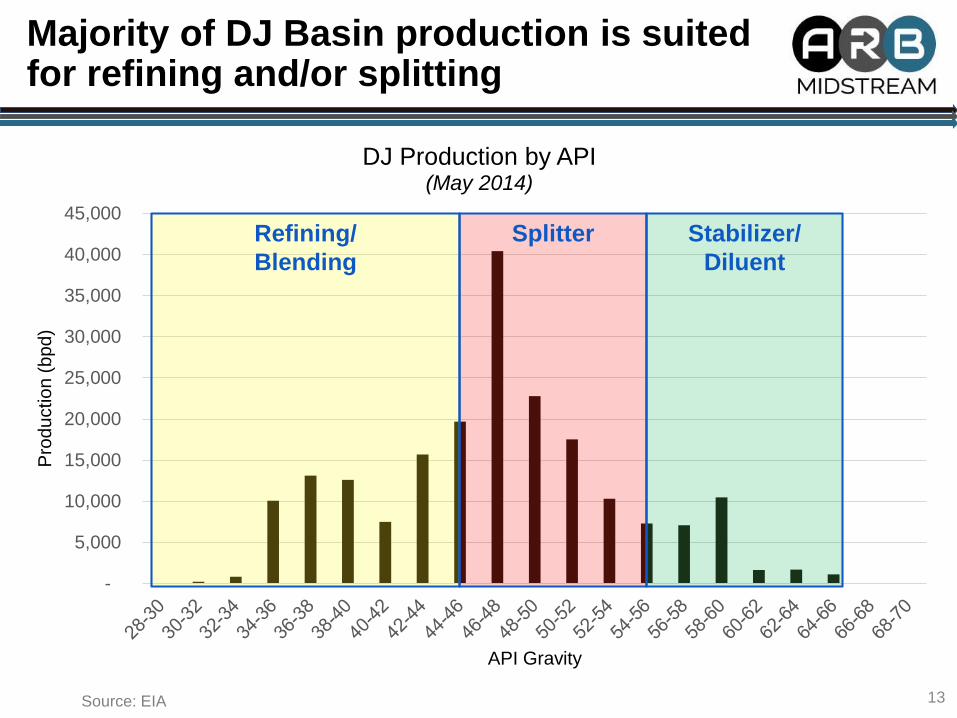
Majority of DJ Basin production is suited for refining and/or splitting
13
-
5,000
10,000
15,000
20,000
25,000
30,000
35,000
40,000
45,000
Pro
du
ctio
n (
bp
d)
API Gravity
DJ Production by API(May 2014)
Splitter Stabilizer/
Diluent
Refining/
Blending
Source: EIA

End Markets

East Coast Waterborne Imports –Q4 2009 vs Q4 2013
-
50,000
100,000
150,000
200,000
250,000
300,000
Wate
rborn
e Im
port
s (
bp
d)
API Gravity
Q4 2009 Q4 2013
15Source: EIA
Imports are down from
1.2MM to 592kbpd (-52%)

West Coast Waterborne Imports –Q4 2009 vs Q4 2013
-
50,000
100,000
150,000
200,000
250,000
300,000
Wate
rborn
e Im
port
s (
bp
d)
API Gravity
Q4 2009 Q4 2013
16Source: EIA
Imports have increased
from 985k to 1.115MMbpd
(+13%)

Gulf Coast Waterborne Imports –Q4 2009 vs Q4 2013
-
200,000
400,000
600,000
800,000
1,000,000
1,200,000
1,400,000
Wa
terb
orn
e Im
po
rts (
bp
d)
API Gravity
Q4 2009 Q4 2013
17Source: EIA
Imports have decreased
from 5.5MM to 3.5MMbpd
(-36%)

US Light Capacity Additions
18Source: Argus

Takeaway Infrastructure

Current pipeline infrastructure leaving the basin all leads to Cushing
20
PXP NECL

White Cliffs Expansion
21
0
20
40
60
80
100
120
140
160
Mb
/d
Flow Capacity
Source: Genscape

Pony Express Line Fill + Walk Up Shipments
22
0
50
100
150
200
250
Mb
/d
Flow Capacity
Source: Genscape

-
100,000
200,000
300,000
400,000
500,000
600,000
700,000
Pro
du
ctio
n &
Cap
acit
y (b
pd
)Midstream infrastructure is not adequate for long term production volumes
23
NiCon
Pony Express
White Cliffs Twin
Existing Rail
WC Exp #2WC Exp #1
White Cliffs
Refining Demand
70,000 – 250,000 bpd of
additional takeaway capacity
needed(announced pipelines)

Niobrara Connector “NiCon” –Centrally located in the DJ Basin
24
PXP NECL

Niobrara Connector “NiCon” –Specifications
25
• 79,000 bpd nameplate capacity
• 120 car unit train capable
• 224 Acres
• Industrial spur serviced by the UP
• In Service date Q3 2015
• Segregation of product in up to 4 - 100,000 bbl tanks

Summary
• High IRR plays incentivize drilling activity
• DJ Basin provides some of the best economics in North America
• Growing play with significant production growth in the future
• Average of 65% of DJ Basin production is +45 API, more than any other Rockies play and getting lighter
• Midstream infrastructure is not adequate for long term production volumes
• Niobrara Connector “NiCon” crude-by-rail facility will provide additional takeaway optionality getting crude and condensate to market
26
