rocky mountain region: cre quarter-in-review q3-2016
TRANSCRIPT

Denver, Phoenix and Salt Lake City economic and office overview
Q3 2016

Economy

Employment growth
-300.0
-250.0
-200.0
-150.0
-100.0
-50.0
0.0
50.0
100.0
150.0
200.0
12-m
onth
net c
hang
e (tho
usan
ds)
Phoenix Denver Salt Lake City
Most recent annual growth slightly slower than cyclical average, but trend remains one of stability
Source: JLL Research, Bureau of Labor Statistics
+101,800current cycle
average growth
+115,500previous cycleaverage growth
2
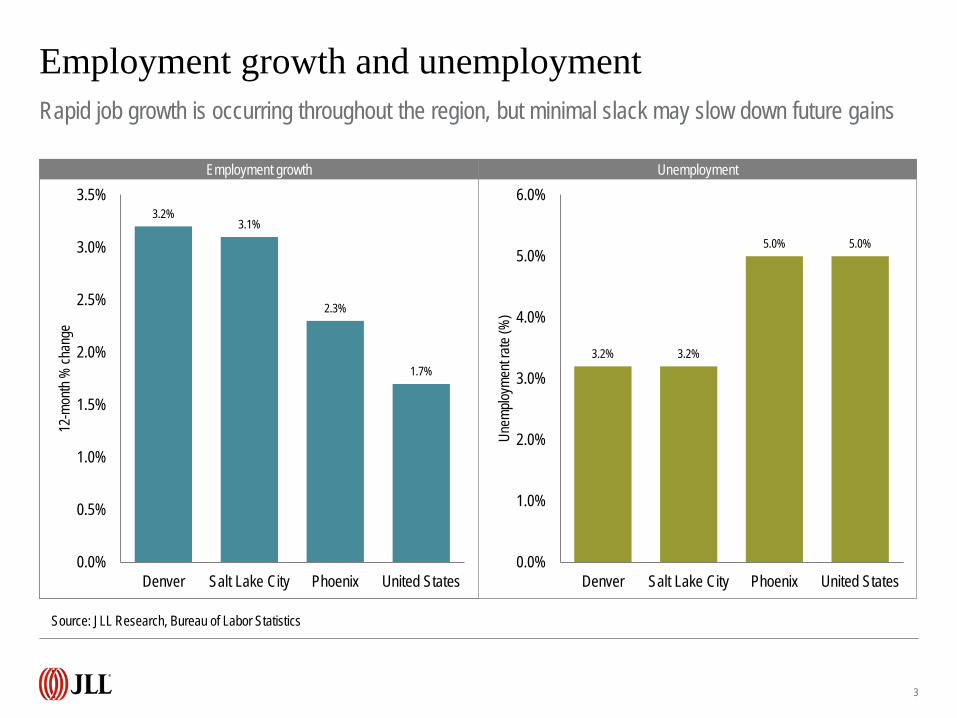
3.2%3.1%
2.3%
1.7%
0.0%
0.5%
1.0%
1.5%
2.0%
2.5%
3.0%
3.5%
Denver Salt Lake City Phoenix United States
12-m
onth
% ch
ange
Employment growth and unemploymentRapid job growth is occurring throughout the region, but minimal slack may slow down future gains
Source: JLL Research, Bureau of Labor Statistics
3.2% 3.2%
5.0% 5.0%
0.0%
1.0%
2.0%
3.0%
4.0%
5.0%
6.0%
Denver Salt Lake City Phoenix United States
Unem
ploym
ent ra
te (%
)
Employment growth Unemployment
3

Employment growth
-5 0 5 10 15 20 25
Information
Manufacturing
Other services
Government
Trade, transportation and utilities
Financial activities
Leisure and hospitality
Professional and business services
Construction and mining
Education and health
12-month net change (thousands)
Phoenix Denver Salt Lake City
Job growth balanced across health, construction, professional services and leisure
Source: JLL Research, Bureau of Labor Statistics
4

Housing starts
0
10,000
20,000
30,000
40,000
50,000
60,000
70,000
80,000
90,000
100,000
Autho
rized
units
Phoenix Denver Salt Lake City
Regional markets on track to surpass 2015 starts, but still well below previous peak
Source: JLL Research, U.S. Census Bureau
5

Office

Market Inventory (s.f.) YTD 2016 net absorption (s.f.)
Total vacancy (%)
Average asking rent
($ p.s.f.)
Under construction
(s.f.)
Denver 108,018,472 -20,603 13.8% $26.56 3,649,889
Phoenix 84,035,044 2,611,611 19.7% $24.22 1,692,140
Salt Lake City 49,442,083 1,247,276 7.3% $22.50 2,122,795
Region 241,495,599 3,838,284 14.5% $25.03 7,464,824
Regional office overviewEven as occupancy growth stalls in Denver, vacancy is falling regionally
Source: JLL Research
Comparison to U.S. office market
+70bpNet absorption (% of inventory)
7.1%Share of national construction
6.0%Share of national inventory
+0bpTotal vacancy
+50bpU/C as % of inventory
-$7.32 (-22.6%)Average asking rent
7

Net absorption
-4,000,000
-2,000,000
0
2,000,000
4,000,000
6,000,000
8,000,000
10,000,000
2006 2007 2008 2009 2010 2011 2012 2013 2014 2015 YTD 2016
Net a
bsor
ption
(s.f.)
Denver Phoenix Salt Lake City
More than 1.0 m.s.f. of absorption in both Phoenix and SLC keeping annualized growth stable
Source: JLL Research
5.1 m.s.f.2016 annualized
absorption
8

1,384,779
625,814
413,118
246,778 239,670 224,516
0
200,000
400,000
600,000
800,000
1,000,000
1,200,000
1,400,000
1,600,000
Tempe (Phoenix) Utah County (SaltLake City)
Draper (Salt LakeCity)
Chandler (Phoenix) Scottsdale Airpark(Phoenix)
Midtown Suburbs(Denver)
YTD
net a
bsor
ption
(s.f.)
Net absorptionLarge user-heavy suburban submarkets are driving regional occupancy growth
Source: JLL Research
9
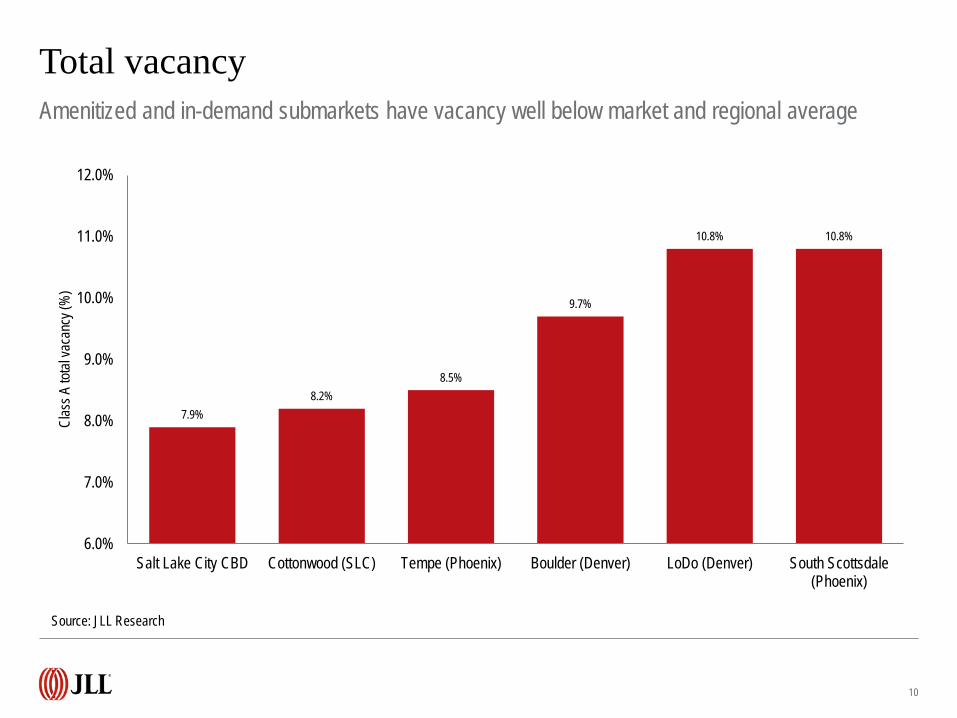
7.9%8.2%
8.5%
9.7%
10.8% 10.8%
6.0%
7.0%
8.0%
9.0%
10.0%
11.0%
12.0%
Salt Lake City CBD Cottonwood (SLC) Tempe (Phoenix) Boulder (Denver) LoDo (Denver) South Scottsdale(Phoenix)
Clas
s A to
tal va
canc
y (%
)Total vacancyAmenitized and in-demand submarkets have vacancy well below market and regional average
Source: JLL Research
10

Rent growth
44.8%
23.3%
20.8% 20.0%
13.8% 13.0%10.9%
10%
15%
20%
25%
30%
35%
40%
45%
50%
Draper (SLC) Boulder (Denver) Tempe (Phoenix) Sandy SouthTowne (SLC)
Utah County (SLC) South Scottsdale(Phoenix)
Paradise Valley(Phoenix)
Clas
s A ye
ar-o
ver-y
ear r
ent g
rowt
h (%
)
Outside of Denver (except Boulder), double-digit rent growth unabated in many submarkets
Source: JLL Research
11

Rent growth
-10%
-5%
0%
5%
10%
15%
20%
25%
30%
2010 2011 2012 2013 2014 2015 Q2 2016
Rent
grow
th sin
ce 20
10 (%
)
All regional markets are experiencing rent growth on the back of both new supply and tightening
Source: JLL Research
+26.5%Denver
+11.5%Phoenix
+20.3%Salt Lake City
12

Under construction
0
2,000,000
4,000,000
6,000,000
8,000,000
10,000,000
12,000,000
14,000,000
2006 2007 2008 2009 2010 2011 2012 2013 2014 2015 Q3 2016
Unde
r con
struc
tion (
s.f.)
Denver Phoenix Salt Lake City
As developments deliver, the construction pipeline will slow in response to market softening
Source: JLL Research
13

COPYRIGHT © JONES LANG LASALLE IP, INC. 2016
TJ JaroszewskiDirector – Rocky Mountains Research+1 303 260 [email protected]
Phil RyanSenior Research Analyst – U.S. Office+1 202 719 [email protected]