rockware software, consulting & training. for over 35 … · 2018-03-23 · mapinfo pro ......
TRANSCRIPT

8 0 0 . 7 7 5 . 674 5 • w w w . r o c k w a r e . c o m 11
RockWare Software, Consulting & Training.For over 35 Years.
®
303.278.3534 ∙ 800.775.6745 (U.S.) • +41 91 967 52 53 (Europe) • www.RockWare.com
Environmental Geotechnical Hydrology Mining Petroleum

8 0 0 . 7 7 5 . 674 5 • w w w . r o c k w a r e . c o m
Table of ContentsConsulting ....................................................3-5RockWorks .............................................. 6-14RockWare GIS Link 2 ................................15LogPlot ....................................................16-19AqQA ............................................................ 20PetraSim ..................................................21-22Adaptive Groundwater ..............................23WellCAD ...................................................... 24GS+ ................................................................ 25Surfer ............................................................. 25
Aqtesolv ........................................................ 26Groundwater Vistas ....................................27Didger ............................................................ 28AquiferWin32 ..............................................28ChemPoint Pro ............................................29ChemStat ...................................................... 29DeltaGraph ...................................................30Grapher ......................................................... 31Oriana ............................................................ 31StereoStat ..................................................... 32
IgPet................................................................ 32RockPack III .................................................. 33MapInfo Pro .................................................. 34 Datamine Discover .....................................35Datamine Discover 3D ..............................36ArcGIS .....................................................37-38ArcGIS Desktop Extensions .....................39Training .......................................................... 40
Index Adaptive Groundwater ..............................23AqQA ............................................................ 20Aqtesolv ........................................................ 26AquiferWin32 ..............................................28ArcGIS ........................................................... 37ArcGIS Desktop Extensions .....................39ChemPoint Pro ............................................29ChemStat ...................................................... 29Consulting ....................................................... 3
Datamine Discover .....................................35Datamine Discover 3D ..............................36DeltaGraph ...................................................30Didger ............................................................ 28Grapher ......................................................... 31Groundwater Vistas ....................................27GS+ ................................................................ 25IgPet................................................................ 32LogPlot .......................................................... 16
MapInfo Pro .................................................. 34Oriana ............................................................ 31PetraSim ........................................................ 21RockPack III .................................................. 33RockWare GIS Link 2 ................................15RockWorks .................................................... 6StereoStat ..................................................... 32Surfer ............................................................. 25Training .......................................................... 40WellCAD ...................................................... 24
Ordering Information Phone: 303.278.3534 | Fax: 303.278.4099 | www.rockware.com Europe: Phone: +41 91 967 52 53 | Fax: +41 91 967 55 50 | www.rockware.com
All major credit cards accepted. Prices subject to change.
Environmental Geotechnical Hydrology Mining Petroleum
Use these symbols to find products by industry
Follow us on:

8 0 0 . 7 7 5 . 674 5 • w w w . r o c k w a r e . c o m 33
RockWare Consulting
RockWare was founded in 1983 to provide geoscientific software and consulting to a variety of markets, including petroleum, mining, environmental and civil engineering. RockWare consists of geoscientists with a wide variety of technical knowledge and real world experience upon which customers rely for assistance with their projects, fast reliable analysis of their data, and litigation support using videos and graphics. RockWare’s ability to quickly create scientifically accurate, understandable, and appealing analyses, diagrams and videos has provided enormous benefit for our satisfied customers.
Support & Graphics for:• Environmental• Oil and Gas• Mining• Hydrogeological Sciences
Extensive expertise in:• Geology• Geomodeling• Geochemistry• Geomorphology• Physics• Hydrogeology• Groundwater Modeling• And much more
Modeling, volumetrics, graphics, and videos of virtually any type of subsurface data including:• Contaminant Plumes• Ore Bodies• Reservoirs• Well / Borehole Geophysics• Reserve Estimates• Field Mapping• Site Characterization• Digital Well / Borehole Log and Cross-Section Creation• 3D Visualization• Virtual Tour / Flyover Videos
8 0 0 . 7 7 5 . 674 5 • w w w . r o c k w a r e . c o m 3
8 0 0 . 7 7 5 . 674 5 • w w w . r o c k w a r e . c o m 44
Cross-Sections
Hydrocarbon Reservoir
Hydrostratigraphy and Geochemistry
Contamination Plume from Leaking Surface Tank
Complex, Inter-Fingered Geology Color-Coded by Hydraulic Conductivity
Three-Dimensional DiagramsThree-Dimensional Diagrams
Hydrocarbon Reservoir
Hydrostratigraphy and Geochemistry
Contamination Plume from Leaking Surface Tank
Complex, Inter-Fingered Geology Color-Coded by Hydraulic Conductivity
Three-Dimensional Diagrams
RockWare Consulting Continued
Cross-Sections
Soil Compaction Levels
Slice Through Contaminated Site
Cross-Sections within Formation Porosity Model
Stratigraphic Layers Beneath Litigation Site
Correlated Petroleum Logs
Hydrothermally Mineralized Vein
Cross-Sections
Soil Compaction Levels
Slice Through Contaminated Site
Cross-Sections within Formation Porosity Model
Stratigraphic Layers Beneath Litigation Site
Correlated Petroleum Logs
Hydrothermally Mineralized Vein
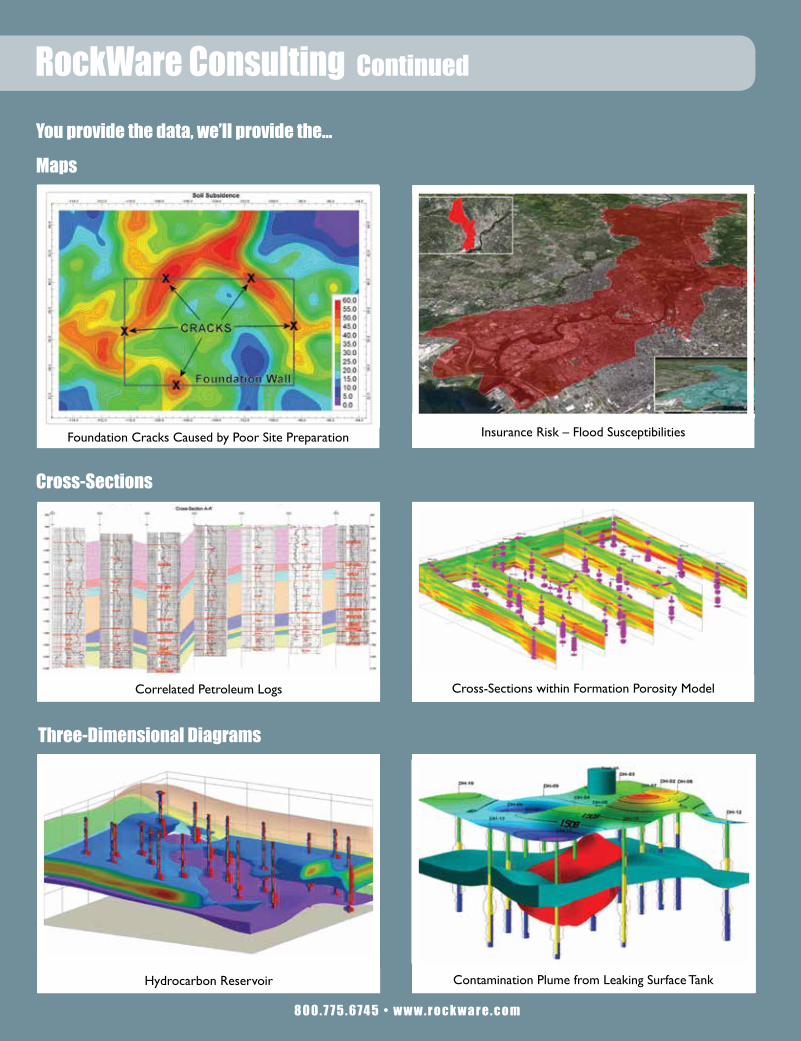
You provide the data, we’ll provide the... Maps
You provide the data,we’ll provide the...
Maps.
Foundation Cracks Caused by Poor Site Preparation
Cumulative Oilfield Production Map
Housing Development Construction Hazard Map
Groundwater Percolation Rates: As inferred from precipitation (red) and water table levels (blue)
Insurance Risk – Flood Susceptibilities
Insurance Risk – Saturated Slope Failure
Accident Site Associated with Poor Zoning
Foundation Cracks Caused by Poor Site Preparation Insurance Risk – Flood Susceptibilities
Cross-Sections within Formation Porosity Model
Contamination Plume from Leaking Surface Tank
Correlated Petroleum Logs
Hydrocarbon Reservoir
8 0 0 . 7 7 5 . 674 5 • w w w . r o c k w a r e . c o m

8 0 0 . 7 7 5 . 674 5 • w w w . r o c k w a r e . c o m 55
RockWare Consulting Continued
Volumetric Computations
Material Volumetrics – Subway Tunneling Project
Shopping Center Site – Preparation Volumetrics
Contaminant Plume Volumetrics
Hydrocarbon Reservoir Volumetrics
Video Animations
Time-Based Animation Depicting Changes in Foundation Level Moisture
Virtual Tour Depicting Data Sets Available For Study Site as Floating Layers
Virtual Tour Showing Visual Impact of Proposed Pipeline
Virtual Tour Depicting Hydrostratigraphic Framework of Miami, Florida Area
Video Animations
Time-Based Animation Depicting Water Table Drawdown from Over-Pumping Wells
Rotating Animation Depicting Pipeline Network Leaking in Shallow Stratigraphic Units
Time-Animation Video Depicting Reservoir Depletion
Site Overview: Viewer is gradually introduced to site via draped airphoto, followed by storage tanks,
boreholes, stratigraphy and plume.
Volumetric Computations
Volumetric Computations
Material Volumetrics – Subway Tunneling Project
Shopping Center Site – Preparation Volumetrics
Contaminant Plume Volumetrics
Hydrocarbon Reservoir Volumetrics
5
Time-Based Animation Depicting Changesin Foundation Level Moisture
Site Overview: Viewer is gradually introducedto site via draped airphoto, followed by storage tanks,
boreholes, stratigraphy and plume.
Material Volumetrics – Subway Tunneling Project Contaminant Plume Volumetrics
8 0 0 . 7 7 5 . 674 5 • w w w . r o c k w a r e . c o m
Please contact [email protected], or call us at 1.800.775.6745 extension 4,
for help with any of your consulting needs.

8 0 0 . 7 7 5 . 674 5 • w w w . r o c k w a r e . c o m66
RockWorks is a comprehensive program that offers visualization and modeling of spatial data and subsurface data. Whether you are a petroleum engineer, environmental scientist, hydrologist, geologist, or educator, RockWorks contains tools that will save time and money, increase profitability, and provide you with a competetive edge through high-quality graphics, models, and plots.
Download a trial version at www.rockware.com
RockWorks16®
Professional Applications for RockWorks include:Petroleum
Well spotting, structural and isopach mapping, logs and cross sections, stratigraphic models and fences p. 6
EnvironmentalBorehole database for lithologic, stratigraphic, analytical data; point and contour maps, logs, cross sections, plume models p. 7
Mining Drillhole database for lithologic, assay, geophysical data; 2D and 3D log diagrams, block modeling, detailed volume tools p. 8
GeotechnicalBorehole database for lithologic, geophysical, geotechnical data; logs, sections, surface/solid models, structural tools p. 9
RockWorks Feature LevelsRockWorks EarthApps – Level 1 – Free!
Reads spatial data from a row-and-column datasheet and generates output for display in Google Earth. p. 10
RockWorks Utilities – Level 2 – $700 Reads a variety of data types from the datasheet and creates maps, models, charts, and diagrams in 2D and 3D. (Includes all Level 1 programs.) p. 11
RockWorks Logs and Sections – Level 3 – $1,500 Perpetual or $650 Annual
Reads sub-surface data from a borehole database and creates 2D and 3D log and log section diagrams. (Includes all Level 1 and 2 programs.) p. 12
RockWorks Borehole Modeling – Level 4 – $3,000 Perpetual or $1,300 Annual
Reads sub-surface data from a borehole database and creates 2D and 3D maps, models, and diagrams. (Includes all Level 1-3 programs.) p. 13
RockWorks Professional – Level 5 – $5,000 Perpetual or $2,200 Annual
Powerful batch and scripting tools, supports MS SQLServer databases, and includes the RockWare GIS Link 16. (Includes all Level 1-4 programs.) p. 14Academic and classroom
licenses are available at www.rockware.com
8 0 0 . 7 7 5 . 674 5 • w w w . r o c k w a r e . c o m1
Professional Applications for RockWorks include:Petroleum
Well spotting, structural & isopach mapping, logs & cross sections, stratigraphic models and fences, production graphs p. 2
EnvironmentalBorehole database for lithologic, stratigraphic, analytical data; point and contour maps, logs, cross sections, plume models p. 3
Mining Drillhole database for lithologic, assay, geophysical data; 2D and 3D log diagrams, block modeling, detailed volume tools p. 4
GeotechnicalBorehole database for lithologic, geophysical, geotechnical data; logs, sections, surface/solid models, structural tools p. 5
RockWorks Feature Levels Buy just the tools you need! All are offered with Annual (Rental), Single, or Concurrent (Network) Licenses. Starting prices are shown here. Bulk discounts are available.
RockWorks BASIC – Utilities and Logs & Log Sections $650 Rental | $1,500 Single | $2,625 Network
Create maps, models, charts, and diagrams in 2D and 3D from spatial and structural data in the program datasheet. Create 2D and 3D log and log section diagrams from sub-surface data stored in the borehole database. p. 6
RockWorks STANDARD – Borehole Modeling $1,300 Rental | $3,000 Single | $5,250 Network
Interpolate 2D and 3D models, create 2D and 3D maps, cross sections, block models, and other diagrams from sub-surface data stored in the borehole database. (Includes all BASIC programs.) p. 8
RockWorks ADVANCED – Professional $2,200 Rental | $5,000 Single | $8,750 Network
Connect to SQL-Server databases, utilize powerful automation tools, 3D faulting, custom land grids, well production diagrams, and the RockWare GIS Link. (Includes all BASIC + STANDARD programs.) p. 9
Etc...What’s new, system requirements p. 9
RockWorks is a comprehensive program that offers visualization and modeling of spatial data and subsurface data. Whether you are a petroleum engineer, environmental scientist, hydrologist, geologist, or educator, RockWorks contains tools that will save time and money, increase profitability, and provide you with a competetive edge through high-quality graphics, models, and plots.
Now 64-bit!
Download a fully-functional trial version at www.rockware.com
RockWorks17®
Academic and classroom licenses are available at www.rockware.com
p. 7
p. 8
p. 9
p. 10
p. 11
p. 13
p. 14
p. 14
8 0 0 . 7 7 5 . 674 5 • w w w . r o c k w a r e . c o m6
RockWorks is a comprehensive program that offers visualization and modeling of spatial data and subsurface data. Whether you are a petroleum engineer, environmental scientist, hydrologist, geologist, or educator, RockWorks contains tools that will save time and money, increase profitability, and provide you with a competitive edge through high-quality graphics, models, and plots.
Now 64-bit!

8 0 0 . 7 7 5 . 674 5 • w w w . r o c k w a r e . c o m 7
RockWorks16®
What’s New
Coordinate Support• Enter locations with State Plane, UTM,
local, custom, longitude/latitude or PLSS (Range/Township) descriptions
• Map (XY) and depth (Z) units can be mixed (meters and ft)
• Define coordinate systems and units in Utilities datasheets
• Convert single coordinates and XY lists
Google Earth Connectivity• Enter spatial data into the RockWorks
datasheet and create output for display directly in Google Earth—maps, images, and flyovers (see page 10)
• Quick display of individual points in Google Earth
• Output all 2D and 3D graphics to Google Earth
While the look and feel of RockWorks16 is much like previous versions (no huge learning curve), it offers major new functionality. We’ve added enhanced coordinate support and Google Earth connectivity, as well as improvements to the database, modeling tools, plotting windows, and system options. Here are some of the highlights...
Database and Datasheet Improvements• Tablet friendly data entry • Organize custom fields into user-defined tabs or groupings and display only the table and columns you use• Store optional coordinate systems for your boreholes • Link tables to ground surface or top of casing• Enter downhole surveys using any vertical format• Enter dip direction and dip angle with Stratigraphy contacts for use with the new Dip gridding method• Search for boreholes, hide disabled holes, sort holes• Import AGS data into the borehole database
Modeling Features• Dip-based gridding method uses dip
angle and direction to interpolate surfaces
• Stratigraphy rules for smarter sections and models with missing data
• Model only selected formations—great for big projects with many units
New /Improved Diagram Types• Multi-panel projected cross sections with
log-distance labels• “EZ” correlations—quick vertical grid panels for I-Data and P-Data sections
• Striplog improvements—curve fills, curve symbols, many more
• Label profile diagrams with XY coordinates or distance
• Display faults in sections and profiles• Compute optimal well paths between XYZ
points or payzone surfaces• Create lateral and 3D geosteering diagrams
System Features• Unicode support for non-Latin alphabets • Define fonts for all Rockplot2D graphics• More feature levels—purchase just the
tools you need!• Display only the menus you use• New network license manager—
monitor users, borrow seats for field use
Plot Improvements• Include fills in vector patterns • Snap to vertices, lines, or “smart” snap
points in logs for easier hand-drawing of correlation lines/panels
• Apply transparency to color- or pattern-filled polygons
• Save viewpoints in 3D scenes • Capture distance as well as XYZ
coordinates in 3D scenes• Add labels and logos to your 3D scenes• Save vertical exaggeration in 3D scenes• Freeze layers in ReportWorks for easier editing
8 0 0 . 7 7 5 . 674 5 • w w w . r o c k w a r e . c o m2
RockWorks17®
Professional Applications
Mapping Tools• Structure and isopach maps: contour maps with lines and color fills, custom color tables• 3D surface displays• Bubble maps of any well data (production, etc.)• Well and lease spotting from Range, Township, Section descriptions• Land grid and lease maps with section boundaries• Coordinate systems: longitude/latitude, UTM, State Plane, local, custom• Well location maps: customized symbols (e.g. well status), plan-view horizontal well traces• Gridding algorithms: kriging, triangulation, inverse-distance, trend polynomial, more• Grid model tools: filters, math operations, editor, imports and exports
Petroleum
Well Database Tools• Cross sections: hole to hole and projected • 3D fence diagrams• Correlations: model-based and “EZ” panels• Horizontal and vertical wells: 2D and 3D, flexible log layout• Stratigraphic modeling of all/selected formations• Solid modeling of lithologic, geophysical, geotechnical,
geochemical data, with display as voxel or isosurface diagrams• Geosteering: optimal well paths based on target formations, lateral and 3D displays• Well database for well locations and miscellaneous well data, formation contacts, raster images, geophysical data,
lithology, well construction, production, and more• Data imports—Excel, LAS, LogPlot, IHS, KGS, Tobin, other databases• Stratigraphic contacts from digital elog data or raster logs
Other Tools• Structural geology diagrams• Graphic output: 2D and 3D output to RockWorks, Google Earth• 2D editing tools: contour lines, text, shapes, legends, images• Snapping tools for hand-drawn correlations• Composite scenes in 3D with maps, logs, surfaces, solids, panels, surface objects• Page layout program for small to large format presentations and posters• Exports to GIS Shapefiles, CAD DXF, raster formats, Google Earth• Image import, rectification, depth-registration• Program automation
7

8 0 0 . 7 7 5 . 674 5 • w w w . r o c k w a r e . c o m8
RockWorks16®
Professional Applications
Mapping Tools• Structure and isopach maps: contour maps with lines and color fills, custom color tables• 3D surface displays• Bubble maps of any well data (production, etc.)• Well and lease spotting from Range, Township, Section descriptions• Land grid and lease maps with section boundaries• Coordinate systems: longitude/latitude, UTM, State Plane, local, custom• Well location maps: customized symbols (e.g. well status), plan-view horizontal well traces• Gridding algorithms: kriging, triangulation, inverse-distance, trend polynomial, more• Grid model tools: filters, math operations, editor, imports and exports
Petroleum
Well Database Tools• Cross sections: hole to hole and projected • 3D fence diagrams• Correlations: model-based and “EZ” panels• Horizontal and vertical wells: 2D and 3D, flexible log layout• Stratigraphic modeling of all/selected formations• Solid modeling of lithologic, geophysical, geotechnical,
geochemical data, with display as voxel or isosurface diagrams• Geosteering: optimal well paths based on target formations,
lateral and 3D displays• Well database for well locations and miscellaneous well data, formation contacts, raster images, geophysical data, lithology, well construction, and more
• Data imports—Excel, LAS, LogPlot, IHS, KGS, Tobin, ADO (other databases)• Stratigraphic contacts from digital elog data or raster logs
Other Tools• Structural geology diagrams• Graphic output: 2D and 3D output to RockWorks, Google Earth• 2D editing tools: contour lines, text, shapes, legends, images• Snapping tools for hand-drawn correlations• Composite scenes in 3D with maps, logs, surfaces, solids, panels, surface objects• Page layout program for small to large format presentations and posters• Exports to GIS Shapefiles, CAD DXF, raster formats, Google Earth• Image import, rectification, depth-registration• Program automation
8 0 0 . 7 7 5 . 674 5 • w w w . r o c k w a r e . c o m 3
RockWorks17®
Professional Applications
Borehole Database Tools• Cross sections: multi-panel projected and hole to hole, with borehole logs and/or interpolated panels • Correlations: model-based and “EZ” panels, snapping tools for hand-drawn correlations• Borehole logs in 2D and 3D• 3D fence diagrams• Surface modeling of stratigraphic layers and water levels• Plume modeling of analytical data, with display as voxel
or isosurface diagrams, 2D plan and section slices• Solid modeling of lithologic materials, geophysical and
geotechnical measurements• Volume reports of lithologic and stratigraphic models,
contaminant extraction models• Bulk data imports from Excel, text, LAS, other databases
Other Tools• Time-based animations• Piper and Durov diagrams with TDS circles, Stiff diagrams for multiple samples• Water level drawdown diagrams and surfaces• 2D editing tools: contour lines, text, shapes, legends, images• Composite scenes in 3D with maps, logs, surfaces, solids, panels, surface objects• Page layout program for small to large format presentations and posters• Exports to GIS Shapefiles, CAD DXF, raster formats, Google Earth• Image import and rectification• Program automation• Google Earth output directly from data: points, cones, lines, polygons, images, flyovers
Environmental Mapping Tools• Borehole location maps with detailed data labels • Contaminant concentration maps with lines and color fills,
custom color tables, date filters• Plan- and surface-based slices from 3D models• Stiff diagram maps• Time-graph maps for user-selected analytes• Potentiometric surface maps • Flow maps in 2D and 3D• Coordinate systems: lon/lat, UTM, State Plane, local, custom
8 0 0 . 7 7 5 . 674 5 • w w w . r o c k w a r e . c o m8

8 0 0 . 7 7 5 . 674 5 • w w w . r o c k w a r e . c o m 9
RockWorks16®
Professional Applications
Borehole Database Tools• Cross sections: multi-panel projected and hole to hole, with borehole logs and/or interpolated panels • Correlations: model-based and “EZ” panels, snapping tools for hand-drawn correlations• Borehole logs in 2D and 3D• 3D fence diagrams• Surface modeling of stratigraphic layers and water levels• Plume modeling of analytical data, with display as voxel
or isosurface diagrams, 2D plan and section slices• Solid modeling of lithologic materials, geophysical and
geotechnical measurements• Volume reports of lithologic and stratigraphic models, contaminant extraction models
• Bulk data imports from Excel, text, LAS, ADO (other databases)
Other Tools• Time-based animations• Piper and Durov diagrams with TDS circles, Stiff diagrams for multiple samples• Water level drawdown diagrams and surfaces• 2D editing tools: contour lines, text, shapes, legends, images• Composite scenes in 3D with maps, logs, surfaces, solids, panels, surface objects• Page layout program for small to large format presentations and posters• Exports to GIS Shapefiles, CAD DXF, raster formats, Google Earth• Image import and rectification• Program automation• Google Earth output directly from data: points, cones, lines, polygons, images, flyovers
Environmental Mapping Tools• Borehole location maps with detailed data labels • Contaminant concentration maps with lines and color fills,
custom color tables, date filters• Plan- and surface-based slices from 3D models• Stiff diagram maps• Time-graph maps for user-selected analytes• Potentiometric surface maps • Flow maps in 2D and 3D• Coordinate systems: lon/lat, UTM, State Plane, local, custom
8 0 0 . 7 7 5 . 674 5 • w w w . r o c k w a r e . c o m4
RockWorks17®
Professional Applications
Mapping Tools• Drillhole location maps with detailed data labels • Assay, concentration maps with lines and color fills, custom
color tables• 3D surface displays: topographic surfaces, stratigraphic units• 3D point maps• Geology maps: plan or surface-based slices from block models• Multivariate maps: pie chart, bar chart, starburst, spider maps• Coordinate systems: longitude/latitude, UTM, State Plane, local, custom
Borehole Database Tools• Projected cross sections showing drillhole orientation• Correlation panels: stratigraphy, lithology, grade/concentration, geophysics• Drillhole logs in 2D and 3D with lithology, stratigraphy, bargraphs/disks, curves, color intervals, text• Block model interpolation from XYZG point or drillhole data, display as voxels, isosurfaces, fence
diagrams, 2D plan and section slices• Surface model interpolation of stratigraphic units• Downhole fracture display and modeling - closest fracture and closest fracture intersection• Volume reports of lithologic, stratigraphic models• Data imports: Excel, LAS, acQuire, Newmont, other databases
Other Tools• Block model editor: 3D voxel/polyhedron editor, or slice-based• Volume calculations: grade statistics by level, extraction reports,
GT calculators, floating cones model extraction tools• Stereonet and rose diagrams, stereonet and rose maps• Ternary diagrams, frequency histograms for source data and models• Graphic output: 2D and 3D output to RockWorks, Google Earth• 2D editing tools: contour lines, text, shapes, legends, images• Composite scenes in 3D with maps, drillhole logs, surfaces,
blocks, panels• Page layout program for small to large format presentations and posters• Exports to GIS Shapefiles, CAD DXF, raster formats, Google Earth• Image import and rectification• Program automation
Mining
8 0 0 . 7 7 5 . 674 5 • w w w . r o c k w a r e . c o m 9

8 0 0 . 7 7 5 . 674 5 • w w w . r o c k w a r e . c o m10
RockWorks16®
Professional Applications
Mapping Tools• Drillhole location maps with detailed data labels • Assay, concentration maps with lines and color fills, custom color tables
• 3D surface displays: topographic surfaces, stratigraphic units• 3D point maps• Geology maps: plan or surface-based slices from block models• Multivariate maps: pie chart, bar chart, starburst, spider maps• Coordinate systems: longitude/latitude, UTM, State Plane, local, custom
Borehole Database Tools• Projected cross sections showing drillhole orientation• Correlation panels: stratigraphy, lithology, grade/concentration, geophysics• Drillhole logs in 2D and 3D with lithology, stratigraphy, bargraphs/disks, curves, color intervals, text• Block model interpolation from XYZG point or drillhole data, display as voxels, isosurfaces, fence
diagrams, 2D plan and section slices• Surface model interpolation of stratigraphic units• Downhole fracture display and modeling - closest fracture and closest fracture intersection• Volume reports of lithologic, stratigraphic models• Data imports: Excel, LAS, acQuire, Newmont, ADO (other databases)
Other Tools• Block model editor: 3D voxel/polyhedron editor, or slice-based• Volume calculations: grade statistics by level, extraction reports, GT calculators, floating cones model extraction tools
• Stereonet and rose diagrams, stereonet and rose maps• Ternary diagrams, frequency histograms for source data and models• Graphic output: 2D and 3D output to RockWorks, Google Earth• 2D editing tools: contour lines, text, shapes, legends, images• Composite scenes in 3D with maps, drillhole logs, surfaces,
blocks, panels• Page layout program for small to large format presentations and posters• Exports to GIS Shapefiles, CAD DXF, raster formats, Google Earth• Image import and rectification• Program automation
Mining
8 0 0 . 7 7 5 . 674 5 • w w w . r o c k w a r e . c o m10 8 0 0 . 7 7 5 . 674 5 • w w w . r o c k w a r e . c o m 5
RockWorks17®
Professional Applications
Mapping Tools• Multiple components in piechart, spider maps• Point maps with detailed data labels • Topographic contour maps with lines and color fills, custom color tables• 3D surface displays• Strike and dip maps in 2D and 3D• Coordinate systems: longitude/latitude, UTM, State Plane, local, custom
Borehole Database Tools• Cross sections: multi-panel projected and hole to hole, with borehole logs and/or interpolated panels• Correlations: model-based and “EZ” panels, snapping tools for hand-drawn correlations• Borehole logs in 2D and 3D• 3D fence diagrams• Surface modeling of stratigraphic layers and water levels• Solid modeling of lithologic materials, fractures, and geophysical, geotechnical, geochemical data,
with display as voxel or isosurface diagrams, 2D plan and section slices• Geology maps: plan slices from stratigraphy or lithology models• Volume reports of lithologic, stratigraphic, excavation models• Fracture display and modeling, stereonet maps, rose diagram maps• Munsell colors for display in logs and interpolation into color models• Data imports: Excel, AGS, Colog, Fugro CPT, gINT, LAS, Penetrometer, other databases
Other Tools• Sieve diagrams, ternary diagrams with classification overlays• Stereonet and rose diagrams• Slope/aspect analysis on grid models• Predictive tools: lithology materials from curves, interval data (porosities, strength, cohesion)
from lithology• 2D editing tools: contour lines, text, shapes, legends, images• Composite scenes in 3D with maps, logs, surfaces, solids, panels, surface objects• Page layout program for small to large format presentations and posters• Exports to GIS Shapefiles, CAD DXF, raster formats, Google Earth• Image import and rectification• Program automation • Google Earth output directly from data: points, cones, lines, polygons, images, flyovers
Geotechnical
10

8 0 0 . 7 7 5 . 674 5 • w w w . r o c k w a r e . c o m 11
RockWorks16®
Professional Applications
Mapping Tools• Multiple components in piechart, spider maps• Point maps with detailed data labels • Topographic contour maps with lines and color fills, custom color tables• 3D surface displays• Strike and dip maps in 2D and 3D• Coordinate systems: longitude/latitude, UTM, State Plane, local, custom
Borehole Database Tools• Cross sections: multi-panel projected and hole to hole, with borehole logs and/or interpolated panels• Correlations: model-based and “EZ” panels, snapping tools for hand-drawn correlations• Borehole logs in 2D and 3D• 3D fence diagrams• Surface modeling of stratigraphic layers and water levels• Solid modeling of lithologic materials, fractures, and geophysical, geotechnical, geochemical data,
with display as voxel or isosurface diagrams, 2D plan and section slices• Geology maps: plan slices from stratigraphy or lithology models• Volume reports of lithologic, stratigraphic, excavation models• Fracture display and modeling, stereonet maps, rose diagram maps• Munsell colors for display in logs and interpolation into color models• Data imports: Excel, AGS, Colog, Fugro CPT, gINT, LAS, Penetrometer, ADO (other databases)
Other Tools• Sieve diagrams, ternary diagrams with classification overlays• Stereonet and rose diagrams• Slope/aspect analysis on grid models• Predictive tools: lithology materials from curves, interval data (porosities, strength, cohesion)
from lithology• 2D editing tools: contour lines, text, shapes, legends, images• Composite scenes in 3D with maps, logs, surfaces, solids, panels, surface objects• Page layout program for small to large format presentations and posters• Exports to GIS Shapefiles, CAD DXF, raster formats, Google Earth• Image import and rectification• Program automation • Google Earth output directly from data: points, cones, lines, polygons, images, flyovers
Geotechnical
8 0 0 . 7 7 5 . 674 5 • w w w . r o c k w a r e . c o m
RockWorks17®
Feature Levels
RockWorks BASIC RockWorks UtilitiesEnter a variety of spatial or sample data into the datasheet and create maps, models, charts, and diagrams in 2D and 3D—an indispensable collection of mapping, modeling, and display tools.
Data Management Tools• Built-in Project Manager for easy access to data and output files in your project• Flat, spreadsheet-style datasheet for entering row and column spatial data• Multiple column types–spatial data, graphical items, file links• Numerous data import and exports: Excel, text, shapefiles, GPS points/tracks• Coordinate conversion tools: longitude/latitude, UTM, US State Plane, local co-
ordinates; 30+ datums; convert US Public Land Survey (range/township/section) locations using the free RockWorks “LandBase”
• Field Data interface for entry and processing of data from tablet devices• Digitizer for capturing points from scanned maps
Program Output• Point Maps—unique symbols, colors, labels; 2D bubbles and 3D spheres; Stiff
diagram maps; piechart, starburst, spider maps• Land Grid Maps— Well and lease spotting using free RockWare LandBase, Range/
Township/Section boundary maps• Grid Modeling—12 interpolation methods for XYZ data, grid math/resampling/ filtering/
editing tools; grid imports and exports• Contour Maps and 3D Surfaces—line and color contour maps, 3D surfaces
with color, shading options; image, DXF and Shapefile draping• Solid (Block) Modeling—8 interpolation methods for XYZG data; model math/
resampling / filtering / editing tools; model imports and exports• Volumetrics—easy reports for X, Y, thickness data; detailed grid-based reports; pit
optimization with 3D block models; grade-thickness models and reports• Survey Tools—lateral and 3D geosteering diagrams; optimal well bore surveys;
bearing/inclination/distance surveys -> XYZ points• Statistical Tools—statistics reports; frequency histogram plots; scatter plots with
best fit lines; ternary diagrams; sieve diagrams• Hydrology/Hydrochemisty Tools—Theis drawdown diagrams and models; Piper and
Durov diagrams with TDS circles; Stiff diagrams and maps• Structural/Directional Tools—fracture maps and densities; rose diagrams,
stereonets; strike and dip maps; plane rotation and intersection• Image Tools—raster image import, rotate/scale/clip options; digitizer; image display
as planes, panels, draped; solid color models from vertical panels• Coordinate Conversions—for single points or lists• 3D tanks, buildings, arrows, tubes, discs, spheres• EarthApps—point, line, polygon, survey maps; images; flyovers in Google Earth
6
Rental Single Network $650 $1,500 $2,625starting at
8 0 0 . 7 7 5 . 674 5 • w w w . r o c k w a r e . c o m 11

8 0 0 . 7 7 5 . 674 5 • w w w . r o c k w a r e . c o m
Data Management Tools• Built-in Project Manager for easy access to data files and
Google Earth output files in your project directory• Flat, spreadsheet-style datasheet for entering row and column
spatial data• Multiple column types–spatial data, graphical items, file links• Numerous data import and export tools: Excel, text, shapefiles,
GPS points and tracks, and more• Coordinate conversion tools: longitude/latitude, UTM, US State
Plane, local coordinates; 30+ datums; convert US Public Land Survey (range/township/section) locations using the free RockWorks “LandBase”
Program Output• Point maps—icons, circles, cones, cylinders, strike and dip symbols/
disks with custom colors and sizing• Line maps—lines, tubes, polylines, parabolas, and pipelines• Polygon maps—polygons, claims, leases, PLSS land grids, countries
and states• Images—draped over the ground, floating, as vertical panels• Flyovers—simple and advanced flyovers from your data, and super easy
flyovers from clipboard points • Cell maps—min/max, frequencies, averages and cumulative values, distances• Survey maps—points and polygons from survey descriptions
RockWorks16®
Feature Levels
RockWorks EarthApps – Level 1: FREEEnter spatial data into a row-and-column datasheet and create maps and images for display in Google Earth. Install the RockWorks16 Trial version (with all feature levels). When the Trial period expires, the EarthApps remain functional.
12 8 0 0 . 7 7 5 . 674 5 • w w w . r o c k w a r e . c o m7
RockWorks17®
Feature Levels
RockWorks BASIC (cont.)Logs & Log SectionsEnter borehole or well data into a database and create well location maps, 2D and 3D log and log section diagrams. Simple correlations are available for cross sections.
Data Management Tools• SQLite or MDB database for storing downhole lithology,
stratigraphy, analytical, geophysical, geotechnical, structural, water level, color and well construction data
• Project Manager for easy access to data, models, and graphics in your project directory
• Interactive depth-registration for raster logs• Stratigraphy and lithology contact pickers• Simple and complex data queries• Excel, AGS, LAS, IHS, KGS, Tobin WCS, LogPlot, gINT,
Fugro CPT, database, text imports• Excel, LogPlot, Shape, Google Earth, text exports• Borehole location and measurement units in feet or meters• Local, UTM, U.S. State Plane, PLSS coordinates• Easy customization of the borehole location tables to include any kind of reference information
Program Output• 2D logs, log profiles, projected sections, and hole-to-hole cross sections; 3D logs• Simple stratigraphy, interval-data, and point-data correlation panels• Click and drag log designer for 2D and 3D log layout• Inclined and horizontal logs in both 2D and 3D• Interactive map for selecting profile and cross section locations or for importing
from saved lists in the database• Background images in section location maps • Hand-drawn correlations with new snapping tools• Borehole location maps with detailed data labels, miniature logs, non-vertical
well traces• XYZ coordinates from borehole surveys • Optimal well paths based on XYZ points
8 0 0 . 7 7 5 . 674 5 • w w w . r o c k w a r e . c o m12

8 0 0 . 7 7 5 . 674 5 • w w w . r o c k w a r e . c o m
RockWorks16®
Feature Levels
RockWorks Utilities – Level 2: $700Enter a variety of spatial or sample data into the datasheet and create maps, models, charts, and diagrams in 2D and 3D—an indispensable collection of mapping, modeling, and display tools. (Also includes all of the EarthApps tools, previous page.)
Data Management Tools• Field Data interface for entry and processing of data from
tablet devices• Digitizer for capturing points from scanned maps• Built-in Project Manager for easy access to data files,
models, and graphic files in your project directory• All of the data tools from Level 1 (previous page)
Program Output• Point Maps—unique symbols, colors, labels; 2D bubbles and 3D spheres; Stiff
diagram maps; piechart, starburst, spider maps• Land Grid Maps— Well and lease spotting using free RockWare LandBase, Range/
Township/Section boundary maps• Grid Modeling—12 interpolation methods for XYZ data, grid math/resampling/ filtering/
editing tools; grid imports and exports• Contour Maps and 3D Surfaces—line and color contour maps, 3D surfaces
with color, shading options; image, DXF and Shapefile draping• Solid (Block) Modeling—8 interpolation methods for XYZG data; model math/
resampling / filtering / editing tools; model imports and exports• Volumetrics—easy reports for X, Y, thickness data; detailed grid-based reports; pit optimization with 3D block models; grade-thickness models and reports
• Survey Tools—lateral and 3D geosteering diagrams; optimal well bore surveys; bearing/inclination/distance surveys -> XYZ points
• Statistical Tools—statistics reports; frequency histogram plots; scatter plots with best fit lines; ternary diagrams; sieve diagrams
• Hydrology/Hydrochemisty Tools—Theis drawdown diagrams and models; Piper and Durov diagrams with TDS circles; Stiff diagrams and maps
• Structural/Directional Tools—fracture maps and densities; rose diagrams, stereonets; strike and dip maps; plane rotation and intersection
• Image Tools—raster image import, rotate/scale/clip options; digitizer; image display as planes, panels, draped; solid color models from vertical panels
• Coordinate Conversions—for single points or lists• 3D tanks, buildings, arrows, tubes, discs, spheres
138 0 0 . 7 7 5 . 674 5 • w w w . r o c k w a r e . c o m
RockWorks17®
Feature Levels
RockWorks STANDARD Borehole ModelingEnter borehole or well data into a database and create 2D and 3D maps and models, cross sections, fence diagrams, isosurface and voxel diagrams. (Also includes all BASIC Level features, previous pages.)
Data Management Tools • All of the borehole database tools, imports, exports from BASIC Level (previous page)• Geotechnical values from lithology data• Lithology prediction from curve data• Uranium grade computations based on gamma counts • Curve data resampling
Program Output• Surface-based modeling of stratigraphy and aquifer data• 2D iso-concentration maps based on downhole water and soil chemistry information• 3D solid modeling of lithology, analytical, assay, geophysical, geotechnical, fracture,
vector, and color data• 2D cross sections, profiles, projected cross sections, and contour/geology maps
slicing through all model types• 3D fence diagrams slicing through all model types• Numerous gridding and solid modeling algorithms• Model filtering based on value range, spatial boundaries, other models• On-the-fly volume calculations of surface-based and 3D solid models• Detailed volume reports from stratigraphic and solid models
8
Rental Single Network $1,300 $3,000 $5,250starting at
8 0 0 . 7 7 5 . 674 5 • w w w . r o c k w a r e . c o m 13

8 0 0 . 7 7 5 . 674 5 • w w w . r o c k w a r e . c o m8 0 0 . 7 7 5 . 674 5 • w w w . r o c k w a r e . c o m
RockWorks ADVANCED Professional LevelOffers all of the features of BASIC and STANDARD, described on the previous pages. AND includes these professional features...
Data Management Tools• All of the data tools from BASIC and STANDARD• Support of MS SQL-Server databases• Import commercial (PLSS) landgrids
Program Features• Program Automation/Scripting: The RockWare Command Language (RCL) is a powerful
tool for automating program operations and is very easy to use. It’s indispensible for projects which require multiple models and diagrams, receive new data, and/or need QA/QC tracking of settings.
• No programming required! • 3D Faulting: Define single or multiple fault polylines with dip/direction/
extent and use these for modeling of surfaces or solids to create fault barriers.
• Store well Production data in the database and generate production diagrams in 2D, 3D and Google Earth.
• Includes the RockWare GIS Link
RockWorks17®
Feature Levels
Etc...What’s New• 64-bit processing for larger, higher-resolution models• Multi-threading for faster modeling• 3D Faulting for solid (block) models, surface models, and
stratigraphy models• New QuickMap view for borehole locations• SQL Lite (default) or MDB for local databases• Production table in database and full suite of well production diagrams• GeoBody filter for grouping block model values
9
Rental Single Network $2,200 $5,000 $8,750starting at
System Requirements• Windows 7, Windows 8, or Windows10• RockWare Network License Administrator (for Network license)
requires Windows Server 2003 or higher• 64-bit operating system• 2+ GB RAM
14

8 0 0 . 7 7 5 . 674 5 • w w w . r o c k w a r e . c o m
RockWare GIS Link$399Generate RockWorks strip logs, cross-sections, profiles, fence diagrams, and contour maps using ArcMap and RockWorks. (Is included in RockWorks Advanced Level.)
Program Features• Install the RockWare GIS link as a toolbar in ArcMap.• Import your RockWorks borehole locations as a layer in an ArcMap geodatabase.• Create a 2D striplog for any borehole location using the RockWorks engine.• Create 2D profiles, 2D cross-sections, and 3D fence diagrams for any of these data types: lithology, stratigraphy, water levels,
interval-data, time-data, point-data, and fractures.• Create either straight-line or interpolated diagrams for stratigraphic data.• Create line- or color-contour maps of ground surface elevations, formation tops, or formation thickness, and display them
as a DXF layer in ArcMap.
15

8 0 0 . 7 7 5 . 674 5 • w w w . r o c k w a r e . c o m
An easy-to-use log plotting program with a flexible log layout. Plot single-page logs for shallow borings or multi-page/continuous logs for deep wells. LogPlot has been widely used in the environmental, geotechnical, petroleum, and mining industries since 1983.
Download a trial version at www.rockware.com
LogPlot®
The Log DesignerThe Log Designer allows you to quickly design borehole and well logs and modify existing design templates.
• Easy to use, with point, click, multiple-select and alignment capabilities
• Multi-pane re-vamped design window displays headers, footers, and log body (NEW)
• Two header and footer designs, full page report header• Well information linking between data file and header/ footer fields
• Macros for dates, page numbers and well locations• Header/footer images, patterns, symbols, curve and
bargraph legends, notes and text• The log body can include any number and combination of columns, including lithology patterns and descriptions, cuttings percent columns, single and cross-plot curves, bargraphs, interval and point-based text, tadpoles, fracture traces (NEW), well construction, raster images, fillbars, water levels and other symbols, and scale bars
The Data EditorType, copy/paste and or import your log data into the Data Editor.
• Tabbed data sheets with a flexible layout, for easy data entry (NEW)
• Data sheets added on the fly, or automatically updated from the log design
• Double-click access to RockWorks borehole records, data can now be extracted from and written directly to the RockWorks17 database (NEW)
• Data import from LAS, Excel, DBF, AGS (NEW) and text• Data export to LAS, Excel and RockWorks• Data types: lithology/stratigraphy, interbeds, cuttings percent-
ages, curves, interval and point-based data and text, general comments, header/footer text and notes, symbols, fillbars, downhole survey, tadpoles, fractures and well construction
• Easy linking of keywords (“sandstone”) to graphic patterns and colors
16
Single Network $899 $1,575

8 0 0 . 7 7 5 . 674 5 • w w w . r o c k w a r e . c o m
LogPlot® Professional Applications
New Patterns – The LogPlot Pattern Editor now supports the new pattern library with filled shapes and an unlimited number of items.
New Streamlined Interface – The LogPlot Data Editor, Log Designer and LogViewer have been redesigned for use on multiple monitors and to make the creation and modification of logs easier than ever.
New Log Data Tools• New text formatting for text
descriptions – bold, italic, underline, color, superscript, subscript or symbols
• New wavy and thick contact lines for display in Lithology pattern columns
• LogPlot now supports Unicode for non-Latin characters
• New tools add increased flexibility when defining data page names and columns
• New Data Templates to store customized data entry forms
New Log Display Tools• Header/Footer symbol and pattern
legends• Log body fracture columns and water
level symbols• Offset options for interval text columns• New color gradient options for log
body curves• New static text macros• Curve/bargraph headers that can move
when the column location is adjusted• Rotated Header text and notes
New Network License Manager• Easy to set up• Borrow a license for use in the field
17
The Log Viewer• Create paginated or continuous logs• Compile and display multiple logs at once• Quickly re-display logs at any scale and adjust header/
footer settings (NEW)• Use your mouse to view depth/elevation at any point
on the log• Graphic export options include PDF (NEW), HTML
(for display online), BMP, JPG, TIFF, and PNG• Print your log, export an image of a single page, or
export all pages in a single image
Other New Features in LogPlot8

8 0 0 . 7 7 5 . 674 5 • w w w . r o c k w a r e . c o m
LogPlot® Professional Applications
18
Environmental• Soil and rock type symbols and descriptions• Sample symbols, names, descriptions and data• VOC data collected from MIP or other sampling devices• OVA/PID data• Borehole geophysics• Detailed well construction
diagrams, including nested wells
• Water level data• Water and soil contamination information
• Blow counts, RQC and other geotechnical parameters
Geotechnical• Soil and rock type symbols and descriptions• Blow counts, RQD and other geotechnical parameters• Core symbols and data, including Recovery and RQD• Fracture information, including spacing, orientation and
aperture• Sample symbols, names, descriptions and data• Borehole geophysics• Atterburg Limits• Grain Size and sieve analysis results• Water level data• Water and soil contamination information• CPT data, plotted as curves or colored intervals

8 0 0 . 7 7 5 . 674 5 • w w w . r o c k w a r e . c o m
LogPlot® Professional Applications
19
Mining• Soil and rock type symbols and descriptions• Core symbols and data, including Recovery and RQD• Assay results• Munsell Color Codes• Fracture spacing, filling and orientation• Alteration, mineralization and oxidation values• Casing and well construction• Water level data
Oil & Gas• Well/borehole geophysics• Gas curves• Drilling rate, RPM and Weight on Bit• Lithologic Cuttings data• Formation tops and descriptions• Casing and perforation diagrams• Drill Stem Test intervals• Fossils• Core data, including intervals and fractures• Pay zones and show intervals

8 0 0 . 7 7 5 . 674 5 • w w w . r o c k w a r e . c o m
AqQATM
With the AqQA spreadsheet, you can:• Paste data directly from Excel. • Convert units with a mouse click – no more keying in mole weights.• Use common spreadsheet tools such as copy, paste, transpose, sort, and many
others.• Compare replicate analyses and check standards. • Mix samples. • Flag exceedances of regulatory limits. • Check for internal consistency against AWWA standards. • Calculate fluid properties such as water type, TDS, hardness, conductivity and
carbonate speciation. • Calculate calcite saturation and CO2 fugacity. • Quickly create Piper, Stiff, Ternary, Durov, and 7 other plot types.
AqQA features• Six tests for water data
consistency according to AWWA 1030-E Standard Methods.
• 11 plot types: Series, Time Series, Cross Plot, Ternary, Stiff, Piper diagram, Durov, Schoeller, Ion Balance, Pie Chart and Radial Plot.
• Calculates carbonate equilibria, TDS, density, conductivity, hardness and more.
• Flags violations of water quality standards.
• Check replicates and standards • 200 pre-defined analyte types –
inorganic, organic, biological assay, radioactivity, isotopes–or define your own.
Still storing your water analysis in Excel®? AqQA was created with water engineers and aqueous geochemists in mind— or for that matter, anyone who keeps water chemistry data in a spreadsheet. Analyzing your water testing data is as easy as 1, 2, 3 with AqQA: 1) Paste your water analysis data in the “Data Sheet” tab 2) Click on the “Data Analysis” tab to check water testing data for internal
consistency, and view other calculated water properties
3) Use the “New Graph” tab to create publication quality graphics — includes Piper diagram, Stiff diagram and 9 other plot types
Download a trial versionat www.rockware.com
$349
20

8 0 0 . 7 7 5 . 674 5 • w w w . r o c k w a r e . c o m
Interfaces• TOUGH2*–for multi-phase fluid and heat flow in porous and
fractured media.
• TOUGH2-MP*–parallel version of TOUGH2 code.
• T2VOC–for 3-phase flow of water, air, and a volatile organic compound.
• TMVOC–for 3-phase flow of water, gas, and a multi- component mixture of volatile organic compounds.
• TOUGHREACT*–for coupled modeling of subsurface multiphase fluid and heat flow, solute transport, and chemical reactions.
• HydrateResSim**–for simulating behavior of hydrate- bearing geologic systems.
* A standard PetraSim license includes TOUGH2, T2VOC, TMVOC and TOUGHREACT v1.2 simulators. Use of TOUGH v2.1 and v3, TOUGHREACT v2 and v3, and TOUGH2-MP requires the purchase of the simulator through Lawrence Berkeley National Laboratory in addition to the PetraSim interface.
** HydrateResSim is a free simulator available through the National Energy Technology Laboratory of the U.S. Department of Energy
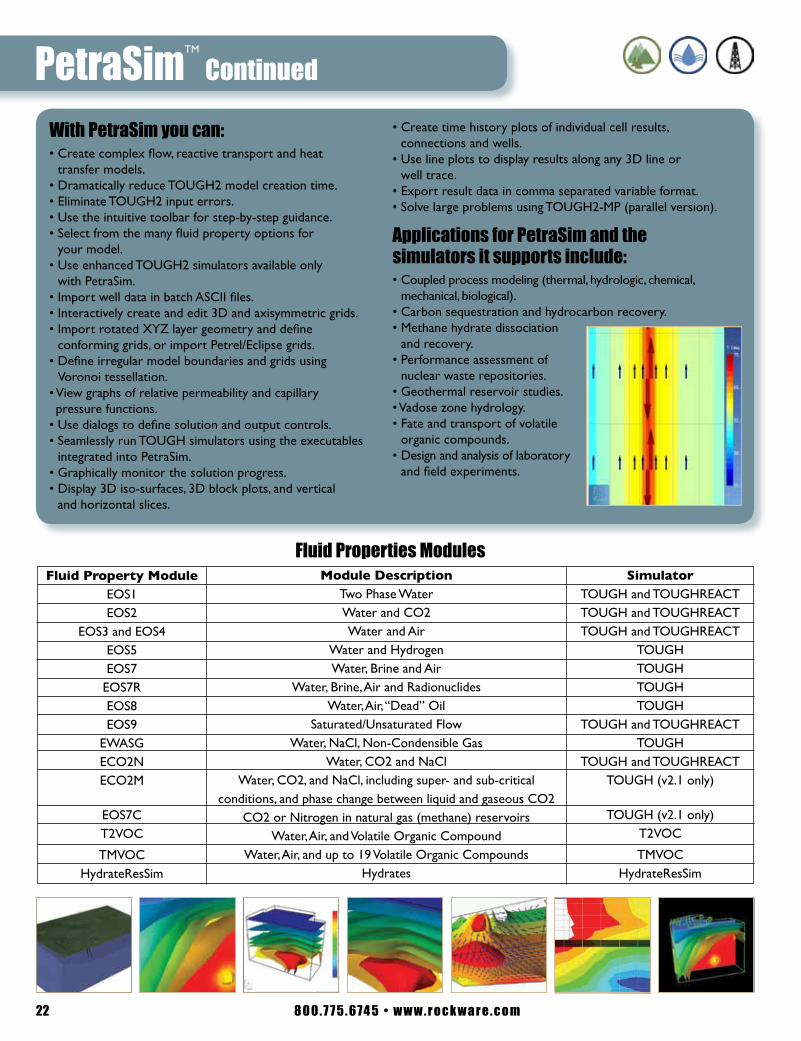
Solve Challenging Subsurface Flow Problems with PetraSimPetraSim is the graphical interface for the TOUGH family of simulators. Developed at Lawrence Berkeley National Laboratory, TOUGH2 and its derivatives are recognized for their broad range of subsurface simulation capabilities, including heat and multi-phase flow and reactive transport. PetraSim helps you access the power of TOUGH2 in an integrated 3D environment that includes mesh generation, parameter definition, execution, and display of results. Save valuable time and increase model reliability with PetraSim..
Download a trial version at www.rockware.com
$ Call for pricing
PetraSimTM
21
8 0 0 . 7 7 5 . 674 5 • w w w . r o c k w a r e . c o m
With PetraSim you can:• Create complex flow, reactive transport and heat
transfer models.• Dramatically reduce TOUGH2 model creation time.• Eliminate TOUGH2 input errors.• Use the intuitive toolbar for step-by-step guidance.• Select from the many fluid property options for
your model.• Use enhanced TOUGH2 simulators available only
with PetraSim.• Import well data in batch ASCII files.• Interactively create and edit 3D and axisymmetric grids.• Import rotated XYZ layer geometry and define
conforming grids, or import Petrel/Eclipse grids.• Define irregular model boundaries and grids using
Voronoi tessellation.• View graphs of relative permeability and capillary pressure functions.
• Use dialogs to define solution and output controls.• Seamlessly run TOUGH simulators using the executables
integrated into PetraSim.• Graphically monitor the solution progress.• Display 3D iso-surfaces, 3D block plots, and vertical
and horizontal slices.
• Create time history plots of individual cell results, connections and wells.
• Use line plots to display results along any 3D line or well trace.
• Export result data in comma separated variable format.• Solve large problems using TOUGH2-MP (parallel version).
Applications for PetraSim and the simulators it supports include:• Coupled process modeling (thermal, hydrologic, chemical,
mechanical, biological).• Carbon sequestration and hydrocarbon recovery.• Methane hydrate dissociation
and recovery.• Performance assessment of
nuclear waste repositories.• Geothermal reservoir studies.• Vadose zone hydrology.• Fate and transport of volatile
organic compounds.• Design and analysis of laboratory
and field experiments.
PetraSimTM
Continued
22
Fluid Property ModuleEOS1EOS2
EOS3 and EOS4EOS5EOS7
EOS7REOS8EOS9
EWASGECO2NECO2M
EOS7CT2VOC
TMVOCHydrateResSim
Module DescriptionTwo Phase WaterWater and CO2Water and Air
Water and HydrogenWater, Brine and Air
Water, Brine, Air and RadionuclidesWater, Air, “Dead” Oil
Saturated/Unsaturated FlowWater, NaCl, Non-Condensible Gas
Water, CO2 and NaClWater, CO2, and NaCl, including super- and sub-critical
conditions, and phase change between liquid and gaseous CO2CO2 or Nitrogen in natural gas (methane) reservoirs
Water, Air, and Volatile Organic CompoundWater, Air, and up to 19 Volatile Organic Compounds
Hydrates
Fluid Properties ModulesSimulator
TOUGH and TOUGHREACTTOUGH and TOUGHREACTTOUGH and TOUGHREACT
TOUGHTOUGHTOUGHTOUGH
TOUGH and TOUGHREACTTOUGH
TOUGH and TOUGHREACTTOUGH (v2.1 only)
TOUGH (v2.1 only)T2VOC
TMVOCHydrateResSim

8 0 0 . 7 7 5 . 674 5 • w w w . r o c k w a r e . c o m 23
With Adaptive Groundwater you can:• Quickly create three-dimensional flow and transport models• Significantly reduce model development cost• Develop very-large, high-resolution regional models because
the parallel AMR technique breaks large problems into many small parts
• More accurately and efficiently compute hydraulic head and solute concentration solutions because grid refinement is automatically added in regions of high head and/or concentration gradients
• Quickly change the grid resolution by simply varying the number of AMR levels
• Accurately simulate thin and highly-stratified plumes because the higher-order Eulerian-Lagrangian transport solution significantly reduces numerical dispersion
• Be fully prepared for future parallel computer architecture enhancements (i.e., multiple-core processors) because the software is fully multi-threaded
• Use much larger time steps when simulating advection-dominated transport• Reduce computational effort because the simulation time step is automatically
adjusted based on the velocity field and cell sizes (i.e., Courant number)• Visually monitor simulation progress during model runs
Adaptive GroundwaterTM
Download a trial version at www.rockware.com
$999

8 0 0 . 7 7 5 . 674 5 • w w w . r o c k w a r e . c o m
WellCAD is a PC based composite log package, which combines comprehensive graphic editing mechanisms and data processing tools. Combining technically excellent display, editing and analysis capabilities for well data, WellCAD has become the standard log composite software in the Mining, Oil and Gas and Geotechnical industries and is used in a wide range of applications.
Download a trial version at www.rockware.com
Starting at $3,682 (Includes 1 year of maintenance)
WellCAD®
Features• Import/Export–ASCII, CSV, TXT, LAS, BMP, JPG, TIF, GIF,
plus many more industry specific formats.
• Data Presentation–2D and 3D borehole display of images, curves, intervals, points, lithology, stratigraphy, text, symbols, stacking patterns, biostratigraphy, engineering details, and more.
• Depth Management–Multiple depth management (time, depth, TVD) plus an advanced depth matching tool.
• Editing–Slice, shift, merge, resample, and filter curves with results displayed alongside the original data.
• Computations–Formula parser (curve calculator with multiple discriminators).
Optional Modules• Image & Structure Interpretation Module–
Borehole Image and Structure/Breakout Analysis.
• CoreCAD–Interactive digital core description.
• Full Wave Processing Module–Sonic Data Processing and Velocity Analysis.
• LIS/DLIS Module–Import LIS/DLIS data.
• Deviation Module–3D well path visualization.
• Multiwell Module–Borehole and correlated cross-sections.
• ODBC Connector Module–Load and save data from/to ODBC compatible databases.
• Automation Module–Automate your workflow using COM components.
24

8 0 0 . 7 7 5 . 674 5 • w w w . r o c k w a r e . c o m
GS+ is a comprehensive geostatistics software program that is fast, efficient and easy to use. GS+ provides all geostatistics components, from semivariance analysis through kriging and mapping, in a single integrated software program widely praised for its flexibility and friendly interface. Many users are surprised that geostatistical analysis can be so easy and intuitive. GS+ output is compatible with industry standards, can be used directly with many other programs, and accepts data files with as many as 2 billion records.
Download a trial version at www.rockware.com
$399
GS+TM
Surfer®
A contouring and 3D surface mapping program that quickly and easily converts your data into outstanding contour, surface, wireframe, vector, image, shaded relief, and post maps. Virtually all aspects of your maps can be customized to produce exactly the presentation you want using Surfer’s software tools. Producing publication quality maps has never been quicker or easier.
Download a trial version at www.rockware.com
$849
25

8 0 0 . 7 7 5 . 674 5 • w w w . r o c k w a r e . c o m
AQTESOLV is the original all-in-one package for the design and analysis of aquifer tests. From entry of field data to test analysis and report generation, AQTESOLV offers a complete and easy-to-use set of tools for the interpretation of pumping tests, slug tests and constant-head tests. Recently added features include the Agarwal method for recovery analysis, distance-drawdown plots, horizontal wells, groundwater mounding tools and automatic image well generation for bounded aquifers. AQTESOLV is the only aquifer testing package to feature an important new solution by Tartakovsky and Neuman (2007) for pumping tests in unconfined aquifers including effects from the unsaturated zone.
Download a trial version at www.rockware.com
Starting at $500
AQTESOLVTM
A Complete Package• Data entry wizards• Import wizard• Diagnostics and derivative analysis• Solution expert• Visual curve matching• Automatic curve matching• Interactive sensitivity analysis• Statistical analysis of results• 17 plots and reports• Contouring• Test design and drawdown prediction
• Context-sensitive help
Comprehensive Test Methods• Pumping tests• Variable-rate tests• Recovery tests• Intermittent pumping tests• Injection tests• Step-drawdown tests• Single-well tests• Slug tests• Constant-head
(constant- drawdown) tests
Advanced Solutions• Double-porosity models• Single-fracture models• Generalized radial flow model• Horizontal wells• Interceptor trenches• Confined/unconfined
conversion• Water-table aquitard• Wedge-shaped aquifers• Channel aquifers• Nonuniform aquifers• Oscillatory slug tests• Groundwater mounding
26

8 0 0 . 7 7 5 . 674 5 • w w w . r o c k w a r e . c o m
Models included in Groundwater Vistas• MODFLOW USG• MODFLOW 2005• MODFLOW 2000• MODFLOW96 Double Precision• MODFLOW88• MT3DMS• SEAWAT• RT3D• MODPATH• Brute Force• MODOFC• SOMOS• MGO• PEST-ASP• UCODE
Models supported by Groundwater Vistas• MODFLOWT• MODFLOW-SURFACT• SWIFT• MT3D’99• PATH3D
Groundwater Vistas is a state of the art software package for 3D groundwater flow and contaminant transport modeling, calibration and optimization using the MODFLOW suite of codes. The advanced version of Groundwater Vistas provides the ideal groundwater risk assessment tool, with Monte Carlo versions of MODFLOW, MODPATH and MT3D and stochastic processing features.
Download a trial version at www.rockware.com
$ Call for pricing
Groundwater VistasTM
Other Features• 64-bit available for the Advanced Version and higher.• Displays both plan and cross-sectional views.• 3D visualization using GW3D.• Run all supported models from within GV.• Advanced PEST support.• Automated parameter sensitivity analysis.• Imports-exports data from ArcView.• Imports existing MODFLOW models.• Imports data from SURFER and ASCII files.• Export results to SURFER, Slicer, DXF, BMP, WMF, EarthVision, EVS, Tecplot and
ASCII files.• Overlay maps in DXF and SURFER BLN formats.• Full on-line context-sensitive help.
27

8 0 0 . 7 7 5 . 674 5 • w w w . r o c k w a r e . c o m
AquiferWin32 is for the analysis and display of aquifer test results. It combines powerful data management capabilities with everything you would expect in a Windows™ program and displays an unlimited number of type curves for multiple-type curve techniques. Other features include simultaneous optimization of multiple data sets, full control of parameter and data units, site map and wells displayed in plan view, customizable headers/footers supporting Bitmaps and Metafiles, exports to DXF and Metafile formats, customizable graphs and much more. AquiferWin32 now includes WinFlow, an easy to use flow and transport tool.
Download a trial version at www.rockware.com
$650
AquiferWin32TM
Didger is a highly accurate digitizing program that represents an invaluable addition to your software library. In seconds, Didger precisely transforms points, lines, or areas from your paper maps, graphs, aerial photos, scanned raster images, imported vector files, or GeoTIFF images to a versatile digital format you can use with your other software.
Download a trial version at www.rockware.com
$389
Didger®
28

8 0 0 . 7 7 5 . 674 5 • w w w . r o c k w a r e . c o m
ChemPoint Pro is a complete data management and reporting solution for air, soil, surface water, ground water, ash, sludge and bio-tissue data analysis. ChemPoint Pro tracks facility information, sampling locations, sampling dates, monitoring well construction, sample containers, and laboratory analysis results, along with all the related information. There is support for multiple sample containers for a location, duplicate analysis, split samples and replicate measurements. ChemPoint Pro users can export data in a format compatible with most commercial statistical analysis applications. When you purchase ChemPoint Pro, you automatically receive a free copy of ChemStat.
Download a trial version at www.rockware.com
$1,490
ChemPoint Pro®
ChemStat is the easiest and fastest application available for the statistical analysis of groundwater monitoring data at RCRA facilities. ChemStat includes most statistical analysis methods described in the 1989 and 1992 USEPA statistical analysis documents, USEPA Draft Unified Guidance Document, U.S. Navy Statistical Analysis Guidance document and other guidance documents and methods documented in popular statistical texts. Features include over 10 types of graphs, parametric and non-parametric analysis methods, and 15 tests for outliers, trend and distribution.
Download a trial version at www.rockware.com
$990
ChemStat®
29

8 0 0 . 7 7 5 . 674 5 • w w w . r o c k w a r e . c o m
Features• Analyze your data with DeltaGraph’s Formula Builder and 50 mathematical and statistical functions; or, fit a curve to your data with advanced regression tools.
• Visualize your results the way you want with DeltaGraph. With over 80 different chart types and 200 different styles, both 2-D and 3-D, you have a choice of business and technical charts.
• Customize your charts using DeltaGraph. You have complete control. Nearly every chart element is customizable in color, font, style, and location.
• Get results quickly and easily. DeltaGraph’s Chart Advisor shows you the charting options for your data, and will even recommend a chart type and style based on the type of data and audience.
• Share your results with the highest quality output, both on screen and in print, thanks to PANTONE® color matching.
DeltaGraph enables you to tell your story with the perfect chart for your data. DeltaGraph goes beyond the limits of everyday graphing software with an unrivaled selection of chart types and unprecedented formatting flexibility. Make your work stand out and distribute your charts virtually anywhere. And, because DeltaGraph is available for both Macintosh and Windows platforms, you are virtually unlimited in your application of high-powered, visual communication.
Download a trial version at www.rockware.com
$299 (Mac / Windows)
DeltaGraph®
30

8 0 0 . 7 7 5 . 674 5 • w w w . r o c k w a r e . c o m
Grapher is easy-to-understand technical graphing software for anyone who needs to create publication-quality graphs quickly and easily. Display your data in one of more than 30 different graph types. Combine multiple graph types to present your data in a completely new way. Alter a property of any of the graph types to create compelling new graphs.
Download a trial version at www.rockware.com
$489
GrapherTM
Oriana for Windows calculates the special forms of sample and inter-sample statistics required for circular data (e.g. angles or directions measured in degrees, time of day, day of week, month of year, etc.). The analyses include basic statistics such as mean vector and confidence limits, single sample distribution tests like Rayleigh’s, pairwise and multisample tests such as Watson-Williams F-Test and chi-squared test, and pairwise correlations. It also graphs your data in a variety of ways, including rose diagrams, allowing you to easily demonstrate patterns.
Download a trial version at www.rockware.com
$475
OrianaTM
31
8 0 0 . 7 7 5 . 674 5 • w w w . r o c k w a r e . c o m
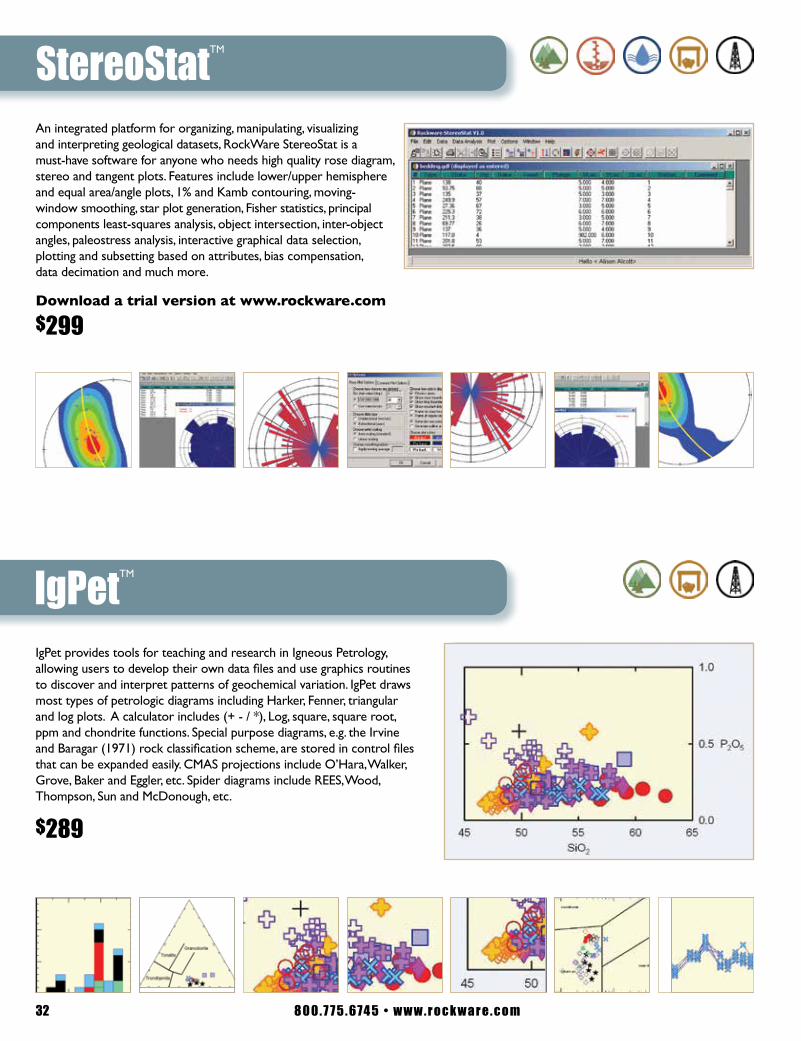
An integrated platform for organizing, manipulating, visualizing and interpreting geological datasets, RockWare StereoStat is a must-have software for anyone who needs high quality rose diagram, stereo and tangent plots. Features include lower/upper hemisphere and equal area/angle plots, 1% and Kamb contouring, moving-window smoothing, star plot generation, Fisher statistics, principal components least-squares analysis, object intersection, inter-object angles, paleostress analysis, interactive graphical data selection, plotting and subsetting based on attributes, bias compensation, data decimation and much more.
Download a trial version at www.rockware.com
$299
StereoStatTM
32
IgPet provides tools for teaching and research in Igneous Petrology, allowing users to develop their own data files and use graphics routines to discover and interpret patterns of geochemical variation. IgPet draws most types of petrologic diagrams including Harker, Fenner, triangular and log plots. A calculator includes (+ - / *), Log, square, square root, ppm and chondrite functions. Special purpose diagrams, e.g. the Irvine and Baragar (1971) rock classification scheme, are stored in control files that can be expanded easily. CMAS projections include O’Hara, Walker, Grove, Baker and Eggler, etc. Spider diagrams include REES, Wood, Thompson, Sun and McDonough, etc.
$289
IgPetTM

8 0 0 . 7 7 5 . 674 5 • w w w . r o c k w a r e . c o m
RockPack III is a package of programs useful for all phases of rock slope analysis and design where stability is controlled by the orientations and characteristics of rock mass discontinuities (joints, bedding, foliations, faults, etc). RockPack III is applicable to practically all rock excavations, including highway roadcuts, quarries, mines and building excavations.
Download a trial version at www.rockware.com
$875
Kinematic Stereonet Analyses• Based on simple CSV text files.• Plot planar data as Dip Vectors or Poles to Planes.• Dynamically draw great circles.• Markland’s test for showing Slope Face, Friction Circle,
Critical Zone and Toppling Zone.
Other Features• Imperial or Metric units.• Seismicity and surcharge considered in the
PLANE program.• Artificial support design for PLANE, WEDGE and TOPPLING programs.
• Water pressure considered in WEDGE analyses.
Factor of Safety Models• PLANE–for calculating the safety factor against
translational sliding along discontinuities in a rock mass.
• RAPWEDGE (rapid wedge)–for calculating the factor of safety against translational sliding of a wedge created in a rock mass by two intersecting discontinuities, whose line of intersection daylights in the slope face.
• CMPWEDGE (comprehensive wedge)–for calculating the factor of safety for a wedge effected by a tension crack and water pressure in the tension crack.
• TOPPLE–for quantitatively examining potential topples once they have been identified.
RockPack IIITM
33

8 0 0 . 7 7 5 . 674 5 • w w w . r o c k w a r e . c o m
MapInfo Professional® is a powerful mapping and geographic analysis application. Designed to easily visualize the relationships between data and geography, MapInfo Professional helps business analysts, planners, GIS professionals – even non-GIS users – gain new insights into their markets, share information-rich maps and graphs and improve strategic decision-making.
Download a trial version at www.rockware.com
$ Call for pricing
MapInfo Pro®
MapInfo Professional expands location intelligence• Discover trends hidden in spreadsheets and charts.• Perform powerful data analysis and calculations.• Create custom maps and content for analysis.• Now 64 bit for faster computing, better graphics
and larger files.
Use geographic insights to innovate business processes• Manage location-based assets, people and property.• Optimize service and sales territories for greater efficiencies.• Deploy networks, infrastructure and utilities with confidence.• Map resources, plan logistics and prepare for emergencies.
Data accessMapInfo Professional provides built-in support to access and view a variety of data formats directly. View your Microsoft Excel®, Micro-soft Access®, Oracle®, Microsoft® SQL Server and many other file formats directly. You can also view images of virtually any format.
Data creation and editingMapInfo Professional provides CAD data creation and editing tools to edit your tabular data such as values and names. Make all of your map and data changes in one application.
DisplayMap display options are a great strength of MapInfo Professional. You can instantly shade, change style or mark territories, boundaries, highways, fiber lines or points based on any tabular data values through a simple wizard (using symbols, graduated symbols, charts or graphs).
Data and map publishingMapInfo Professional provides a spectrum of options for this purpose. From the ability to export data to any format, to publishing large maps with legends and charts, MapInfo Professional seamlessly integrates across applications. In addition, MapInfo Professional is Web-enabled to publish static or interactive maps through easy-to-use wizards.
34

8 0 0 . 7 7 5 . 674 5 • w w w . r o c k w a r e . c o m
Datamine Discover MapInfo bundle is the desktop Geographical Information System (GIS) running with MapInfo designed especially for the geosciences, providing the tools to effectively compile, visualize, analyze and map spatial geoscience data.
Download a trial version at www.rockware.com
$ Call for pricing
Features• Now 64 bit for faster computing, better graphics and larger files.• Build geological datasets. • Produce high-quality scaled geological maps, with
titleblocks, map grids, legends, structural symbols, etc. • Compile drillhole data and create cross-sections, plans
and logs. • Create, filter, contour, profile, manipulate, color and analyse gridded surfaces. • Analyse and visualise geochemical data. • Rectify unprojected raster images. • Create graphs with maintained spatial links for interactive analysis. • Enhance your GIS productivity via an extensive range of data, object, table and
map windows utilities. • Connect to other geological systems, databases and file formats. • Control the MapInfo Professional workspace with a real-time, enhanced layer
control. • Optionally display your GIS data in 3D (Discover 3D). • Integrate with a field GIS (Discover Mobile).
Additions include major enhancements in our massive grid technology, a new drillhole cross-section generation tool and easy section regeneration, automatic batch printing from a map series, as well as numerous other improvements.
Visit www.rockware.com for a complete list of new features.
Datamine DiscoverTM
35

368 0 0 . 7 7 5 . 674 5 • w w w . r o c k w a r e . c o m
Built on top of the functionality and power of the award-winning Datamine Discover MapInfo bundle, Discover 3D turns the 2D environment into a full 3D GIS System. Accurately visualize and analyze all of your datasets in the Discover 3D environment. Then interpret, digitize and model them to examine and test trends, potential extensions, offsets and targets.
Download a trial version at www.rockware.com
$ Call for pricing
Features• Now 64 bit for faster computing, better graphics and larger files.• Fully integrated with Encom Discover and MapInfo Professional
(Requires Encom Discover and MapInfo).• Real-time 3D navigation via the mouse or SpaceNavigatorTM.• Fly-through movie creation and playback.• Extensive industry format support, allowing the visualization and
manipulation of data such as gridded surfaces, vector objects, voxel models and raster images.
• Visualize and analyze drillhole projects in 3D in detail, including color and thickness modulation display controls, 2D section boundary display, live downhole data interrogation, etc.
• Dynamic drillhole planning and targeting.• Extensive powerful modelling and gridding capabilities.
These modeling and gridding capabilities include:• Extrusion of simple objects to create fault planes, stratigraphic
boundaries, etc.• Digitize interpretations directly in 3D, including snapping precisely
to drillhole intervals.• Wireframing between objects (including tieline support) to build triangulated surfaces and solids.
• Interpolation between 3D objects to create smooth gridded surfaces.• 3D block modelling (3D gridding) to create and manipulate
voxel models.• Model refinement and experimentation with Discover 3D’s
advanced editing functionality, e.g. cutting or intersecting one model with another, elastically reshaping regions within a solid, combining multiple models, etc.
Datamine DiscoverTM 3D
36

8 0 0 . 7 7 5 . 674 5 • w w w . r o c k w a r e . c o m
ArcGIS® is desktop GIS mapping software that provides geographic data visualization, mapping, management, and analysis capabilities along with the ability to create and edit data.
Download a trial version at www.rockware.com
$ Call for pricing
ArcGIS®
Benefits and New Features in ArcGIS Enhanced Quality and Performance• Expanded parallel processing• Many software quality improvements• Optimized file handling• Includes 32 bit and 64 bit version (ArcGIS Pro) for full compatibility with old
and new extensions
Improved Security• Public Key Infrastructure (PKI) support• Single sign-on authentication• Standardized SQL parser
Geodata• Support for new workspaces (Teradata, SQLite, PostgreSQL 9.2)• Modify field properties on supported DBMSs• New archiving tool set
Improved Mapping and Reporting• Improved PDF export• Improved generalization• Mailing label generation
Cloud GIS• Includes ArcGIS Online—Use online maps and tools that are a built-in part of
ArcGIS, whether you’re using ArcGIS Desktop, a mobile device, a browser, or if you’re developing applications using the ArcGIS Web Mapping APIs.
• Find, share, organize, and use maps, apps, and other resources via ArcGIS.com.• Discover, share, and present geographic information using ArcGIS Explorer Online.
Expanded GIS in the Field• Leverage ArcGIS Mobile with ArcGIS Desktop and access geoprocessing tools to
create, edit, and sync mobile caches to your device.• Use streaming GPS, photo attachments, and location tracking.• Access a new iPhone mapping application directly from the Apple iTunes App Store.
37

8 0 0 . 7 7 5 . 674 5 • w w w . r o c k w a r e . c o m38
ArcGIS® Continued
ArcGIS Desktop Basic (ArcView)ArcGIS Desktop Basic is the industry standard for GIS visualization. With free basemaps and the ability to add you own data, Basic is the perfect solution for the everyday GIS analyst.
With ArcGIS Desktop Basic, you can:• Visually model and spatially analyze a process or workflow.• Create interactive maps from file, database, and online sources.• Create street-level maps and incorporate GPS locations.• View CAD data or satellite images.• Generate reports and charts.
ArcGIS Desktop Standard (ArcEditor)ArcGIS Desktop Standard is meant for the GIS user that regularly makes edits to databases and geodatabases. With this level, the user can check the precision of the database and make changes where necessary.
With ArcGIS Desktop Standard, you can:• Use complete GIS data editing capabilities.• Have the ability to edit a multiuser enterprise geodatabase.• Use disconnected editing in the field.• Store historical snapshots of your data.• Automate quality control.• Create spatial data from scanned maps.• Use raster-to-vector conversion.
ArcGIS Desktop Advanced (ArcInfo)ArcGIS Desktop Advanced is the highest level of ArcGIS. This level opens up the advanced geocoding and cartography tools to allow the GIS user the most complete and thorough database processing and analysis available.
With ArcGIS Desktop Advanced, you can:• Complete advanced GIS data analysis and modeling.• Create atlaslike, publication-quality maps.• Use advanced data translation and creation tools.• Complete advanced feature manipulation and processing.• Work with data conversions for CAD, raster, dBASE, and coverage formats.

8 0 0 . 7 7 5 . 674 5 • w w w . r o c k w a r e . c o m 39
ArcGIS® Desktop Extensions
ArcGIS Family• ArcGIS Desktop• ArcGIS Pro• ArcPad• All ArcGIS Extensions• ArcGIS Desktop Gallery
Add more functionality to ArcGIS Desktop with the Extensions. These specialized tools allow you to perform more sophistocated tasks such as raster geoprocessing and 3D analysis.
Visit www.rockware.com
$ Call for pricing
System RequirementsMust have an existing or new ArcGIS Desktop or ArcGIS Pro, Basic, Standard, or Advanced (ArcView, ArcEditor, or ArcInfo) license to run the Extensions.
ArcGIS 3D Analyst Analyze your data in a realistic perspective.
ArcGIS Data Interoperability Eliminate barriers to data use and distribution.
ArcGIS Data Reviewer Automate, simplify, and improve data quality control management.
ArcGIS Geostatistical Analyst Use advanced statistical tools to investigate your data.
ArcGIS Network Analyst Perform sophisticated routing, closest facility, and service area analysis.
ArcGIS Publisher Freely share your maps and data with a wide range of users.
ArcGIS Schematics Represent and understand your networks to shorten decision cycles.
ArcGIS Spatial Analyst Derive answers from your data using advanced spatial analysis.
ArcGIS Tracking Analyst Reveal and analyze time-based patterns and trends in your data.
ArcGIS Workflow Manager Better manage GIS tasks and resources. *Requires ArcGIS Desktop Standard or Advanced

8 0 0 . 7 7 5 . 674 5 • w w w . r o c k w a r e . c o m 4040
Too busy to teach yourself? Get up to speed fast with RockWare training courses.• Courses offered for RockWorks and Surfer®.• Focus on the software for two days… WITHOUT office interruptions.• RockWare trainers are both software and industry experts.• Courses cater to all levels and backgrounds.
WorkshopsRegional workshops are held across the globe and are open to anyone. Go to www.rockware.com for a Workshop Schedule.
Custom TrainingCustom courses can be held onsite in your office, or via the web in an online meeting. Courses can follow a standard curriculum or can be tailored to address client-specific problems and needs.
Email [email protected] or visit www.rockware.com for pricing and additional information.
RockWare Training
US Office2221 East StreetGolden CO 80401303.278.3534800.775.6745F: 303.278.4099www.rockware.com
European OfficeVicolo dei Saroli 1 6944 Cureglia Switzerland+41 91 967 52 53F: +41 91 967 55 50www.rockware.com
©2018 RockWare, Incorporated and its licensors. All rights reserved. RockWare is a registered trademark of RockWare, Incorporated. All product and names mentioned are the property of their respective owners. Surfer® is a registered trademark of Golden Software, Inc.
Canadian Post Publications Agreement #40065056 Canadian Return Address DP GlobalMail 4960-2 Walker Rd Windsor Ontario N9A6J3